A Study on Variation in Channel Width and Braiding Intensity of the Brahmaputra River in Assam, India

1
Department of Applied Geology, Dibrugarh University, Dibrugarh 786004, India
2
Centre for Studies in Geography, Dibrugarh University, Dibrugarh 786004, India
*
Author to whom correspondence should be addressed.
Geosciences 2018, 8(9), 343; https://doi.org/10.3390/geosciences8090343
Submission received: 26 July 2018
/
Revised: 22 August 2018
/
Accepted: 23 August 2018
/
Published: 11 September 2018
(This article belongs to the Special Issue Quantitative Geomorphology)
Abstract
:The Brahmaputra River flows through Assam, India, for about 670 km along an alluvial valley as a wide braided river. The width of the river varies with time along its course. The braiding intensity of this river is estimated using the braiding index (BI) of Brice (1964), which also changes with space and time along the course of the river. Temporal changes of both width and BI have been studied using topographic maps of 1912–1928 and 1963–1975, and dry season satellite data of 1996, 2000, 2007 and 2009. The mean widths of the Brahmaputra River channel in Assam during 1912–1928, 1963–1975, 1996, 2000, 2007 and 2009 were 5949 m, 7455 m, 7505 m, 8008 m, 8308 m and 9012 m, respectively, confirming an overall increase in width with time. Both the width and variation of width are lowest in four short narrower segments of the river. Three of these segments represent hard points comprising gneissic rock, and one segment is on alluvium comprising cohesive clay. The increase in width is correlated to enormous sediment load produced by the great Assam earthquake of 1950 and large-scale deforestation in the Himalayas. The mean BIs for the Brahmaputra for 1963–1975, 1996, 2000, 2007 and 2009 were 8.59, 8.43, 6.67, 6.58 and 7.70, respectively, indicating in general a decreasing trend up to 2007. The BI showed low variation at the four narrow segments where there is also a minimum variation of the channel width. The BI has increased significantly in the upstream part of the river. Very high fluctuation of discharge (17,000 in 24 h) and high sediment loads of the Brahmaputra (daily mean sediment discharge of 2.0 million tonnes during monsoon), erodible alluvial banks and high width/depth ratios are the main causes of development of braiding. The interrelationship between channel width and BI of the Brahmaputra shows a positive correlation, indicating an increase in BI with increasing channel width.
1. Introduction
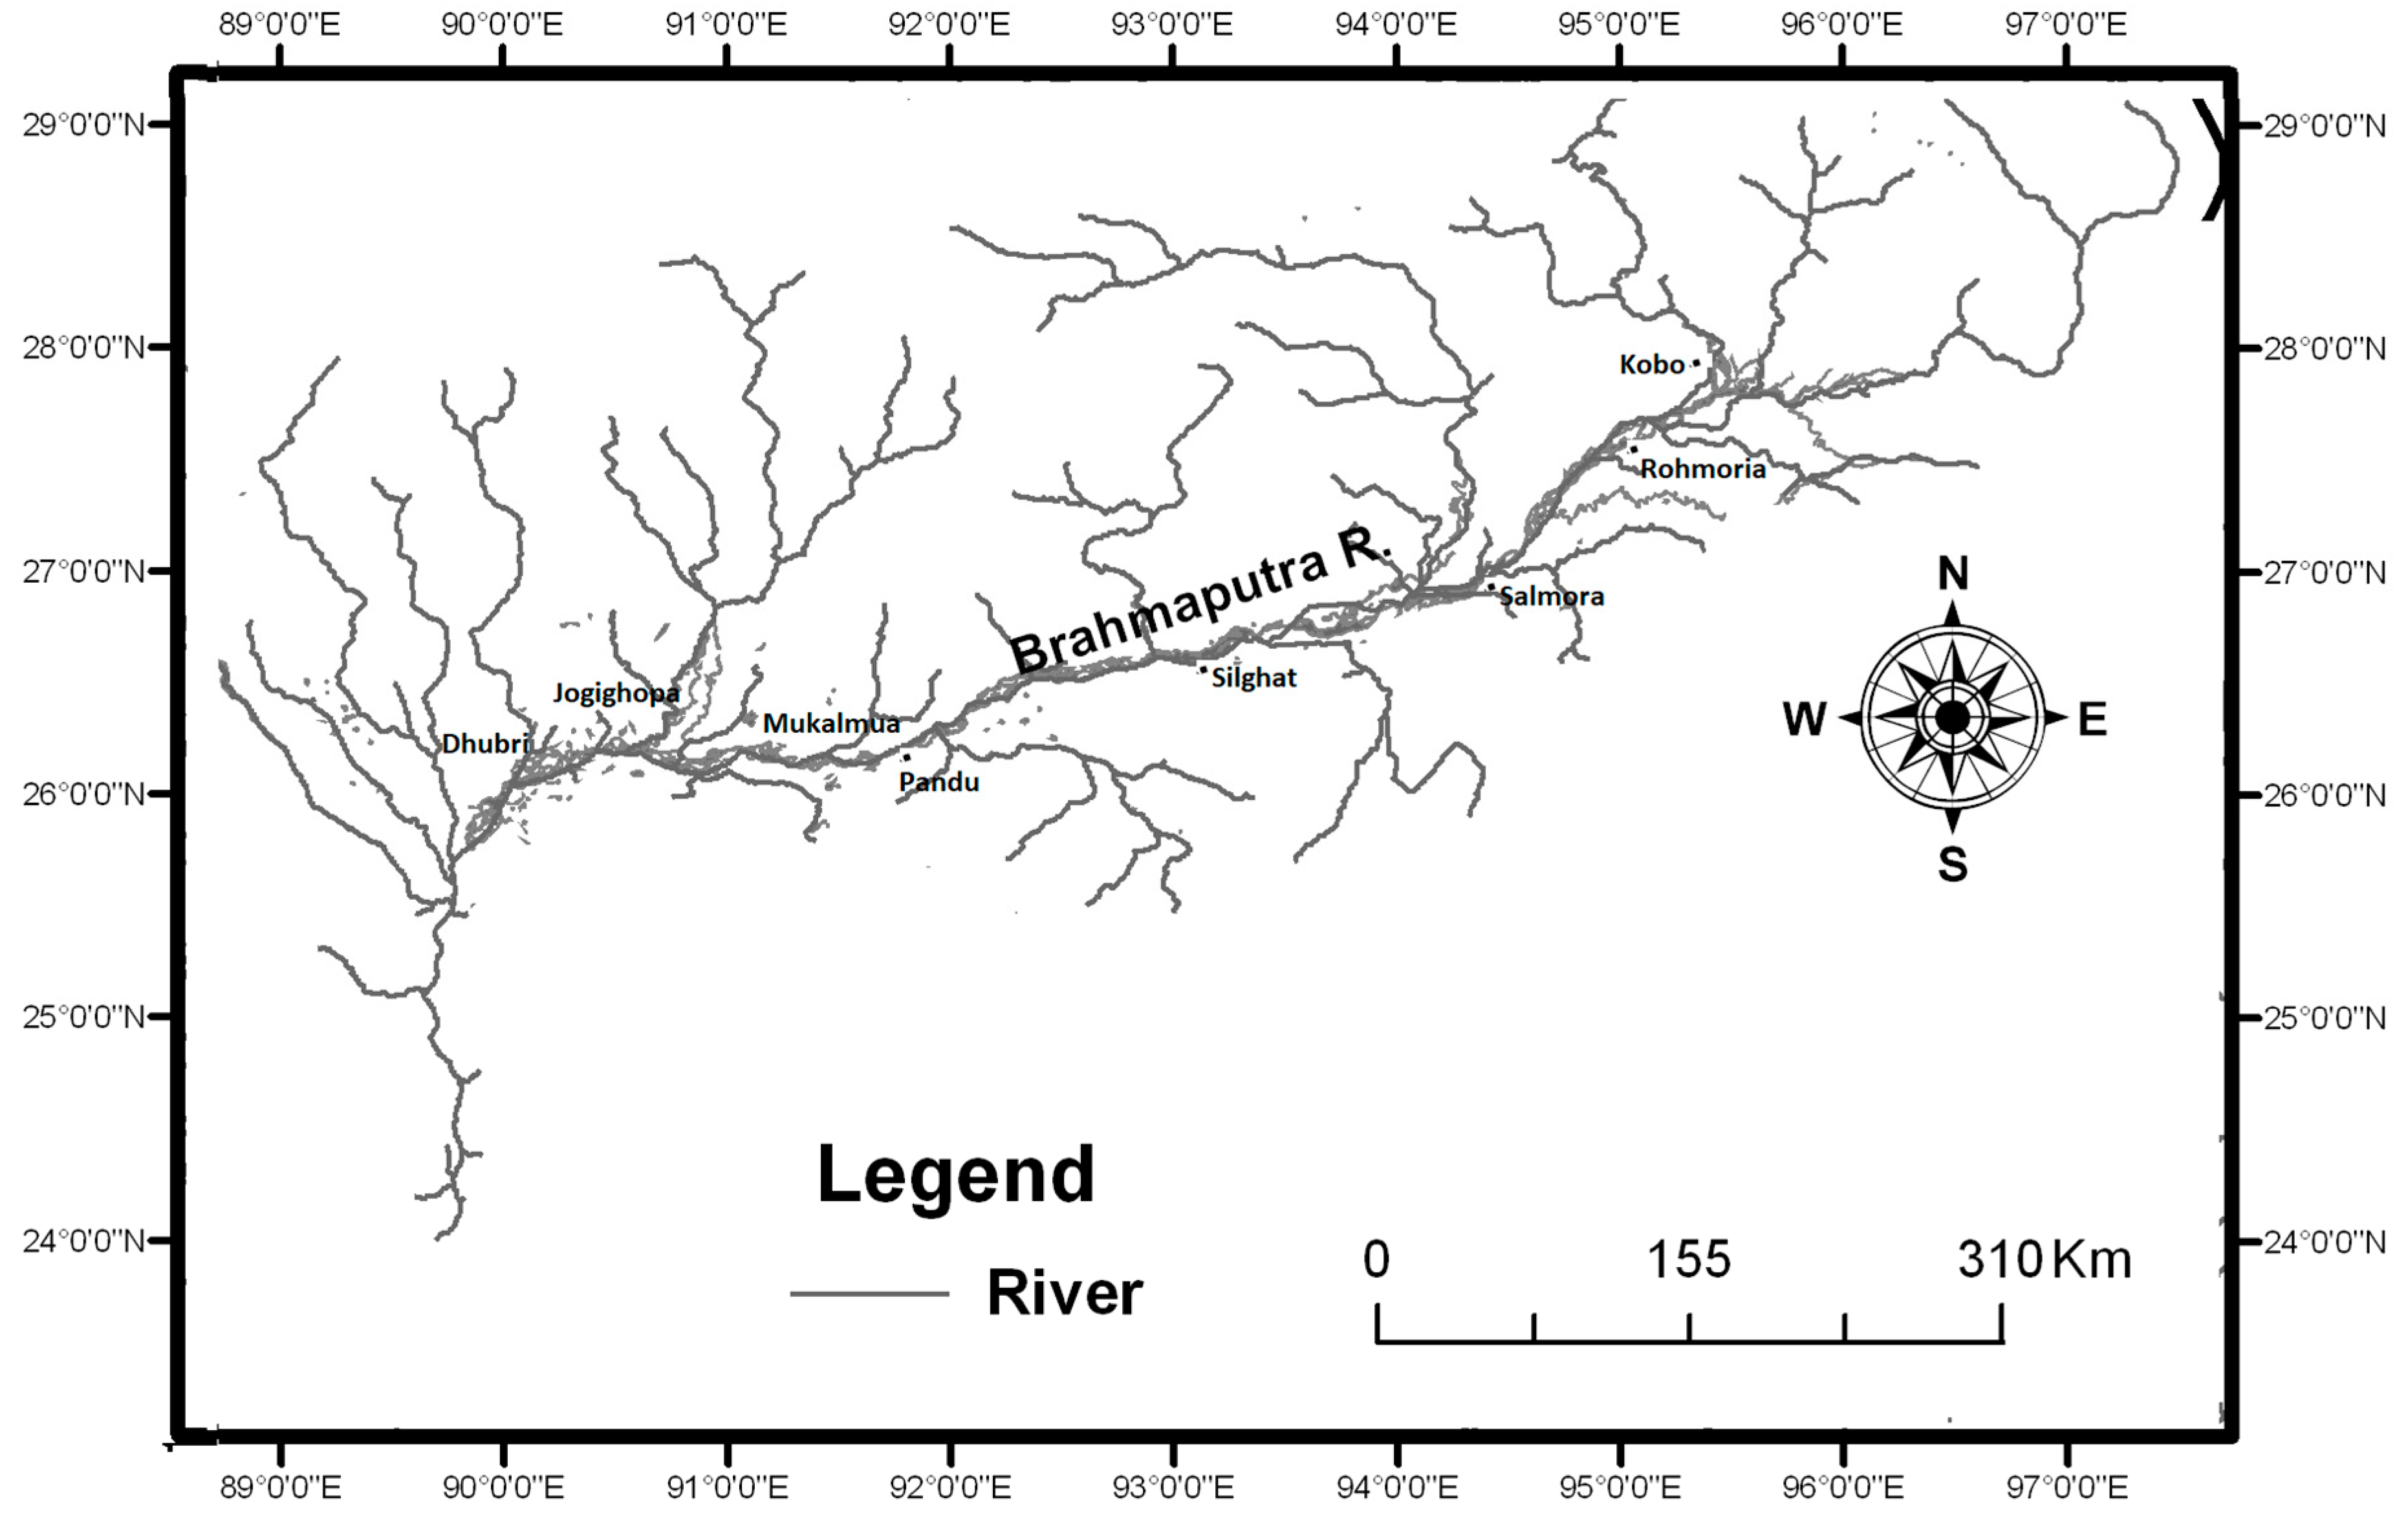
The Brahmaputra River is a large international river flowing through Tibet (China), India and Bangladesh. Rising near the ChemaYundung glacier in southwest Tibet (elevation 5300 m, 82°10′ E, 30°30′ N), the Brahmaputra traverses a total distance of 2880 km, which comprises an easterly course of 1625 km in Tibet, a southerly and westerly course of 918 km in India and a southerly course of 337 km in Bangladesh (Figure 1). Total basin area of the river is 580,000 km2. The Brahmaputra flows southward through deep bedrock gorges cutting across the Higher and Lesser Himalayas and Siwalik Hills with high gradient (4.3 m/km to 16.8 m/km) before entering plains near Pasighat in India. The approximately 600-m-wide river in the Himalayas has become 10 km wide just 12 km downstream of Pasighat due to a sudden decrease in gradient to 0.27 m/km, which results in the high deposition of sediment and development of a braided channel consisting of a network of small channels separated by transitory braid bars. It flows through Assam, India, for about 670 km with an average gradient of 0.16 m/km along a valley comprising its own alluvium as a wide braided river, but it also has three short narrow single-channel reaches where it cuts through hard gneiss rocks.
The Brahmaputra Valley in Assam is 35–90 km wide, and the width of the Brahmaputra River channel varies from 1.1 to 18.6 km. The width of the river is neither uniform along its course, nor invariable in the same place, except for a few short reaches. Hence, in this article an attempt has been made to assess the width and braiding as well as their variations with time for the Brahmaputra River from Kobo (upstream of Assam) to Dhubri (downstream of Assam) for a length of about 670 km (Figure 1).
2. Materials and Methods
Data on the width and braiding of the Brahmaputra River are derived from the Survey of India (SoI) topographic maps of 1912–1928 and 1963–1975 as well as dry season (December) Indian Remote Sensing (IRS) satellite data of 1996, 2000, 2007 and 2009. The Braiding Index (BI) of the Brahmaputra River was not measured for the first (1912–1928) period as these maps were prepared based on the ground survey spanning a long time period, whereas the Survey of India (SoI) maps of the second (1963–1975) sequence were prepared based on large-scale aerial photographs taken during the dry season along with ground survey; hence the BI of the river was measured from this period. The river has a nearly east–west-trending course in Assam from Kobo to near Dhubri. The channel width has been measured perpendicular to the two banklines at the same fixed geographical points at every 5′ E longitudinal interval. For measuring width, the river course is divided into 64 segments each of 5′ E longitude, with length varying from 8 to 11 km depending on the trend of the river channel, and braiding is measured within each segment. The segment at Kobo lies within 95°15′–95°20′ E and the segment near Dhubri is within 90°00′–90°05′ E. The banklines include channels, islands/chars and sand bars in the river braid belt. Smaller offshoot channels are considered to be outside the river banklines if
- the channel did not return to the main channel;
- the width of the channel was less than 80 m.
There are three indices for estimation of the braiding intensity of a braided river, viz. braiding index (BI) by Brice [1,2], braiding parameter (Bo) by Rust [3] and braid-channel length ratio (B) by Friend and Sinha [4]. In the present study, the braiding intensity is estimated by using the braiding index (BI) following Brice [2] using the relation:
where Li = sum of the length of the braid bars and islands in a particular segment of the river, and L = length of the course of the river in that particular segment. A river is called braided when its braiding index is more than 1.5, and the Brahmaputra River is a braided river.
Braiding index = 2 (Li)/L
2.1. Previous Work on the Brahmaputra
Various morphological and hydrological aspects of the Brahmaputra River in Assam, India, had been studied by different workers like Geological Survey of India [5] on geomorphological aspects, Goswami (1985) on the hydrology, basin denudation and channel aggradation, Water and Power Consultancy Services (India) WAPCOS [6] on morphology, meteorology, sediment and water transport, and Kotoky and Sarma [7] on a geomorphological study on the Brahmaputra from Majuli to Kaziranga. Gilfellon et al. [8] studied channel and bed morphology of the Brahmaputra in Upper Assam; Sarma [9] carried out a detailed study on pattern of erosion and bankline migration of the Brahmaputra in Assam; Sarma [10] gave an overview of the Brahmaputra River system; Sarma [11,12] dealt with the morphology of the Brahmaputra in Assam; and Sarma and Phukan [13] described the pattern of bank erosion and channel migration of the Brahmaputra in Assam during the twentieth century. Singh and France Lanord [14] and Singh et al. [15] determined erosional rates of the Brahmaputra watershed using isotope and major ion composition, respectively. Studies on morphological aspects, facies and the hydrology of the Brahmaputra (Jamuna) River were carried out in Bangladesh by Coleman [16]. Channel migration of the Jamuna was studied at first by Bristow [17,18]. Klaassen et al. [19] dealt with sedimentological processes and Thorne et al. [20] described the planform pattern and channel evolution of the Jamunariver. Richardson and Thorne [21] dealt with the hydraulics of the Jamunariver. Previous work on change in channel width of the Brahmaputra River in Assam reveals that the same occurs both due to erosion as well as lateral accretion of banks [22,23].
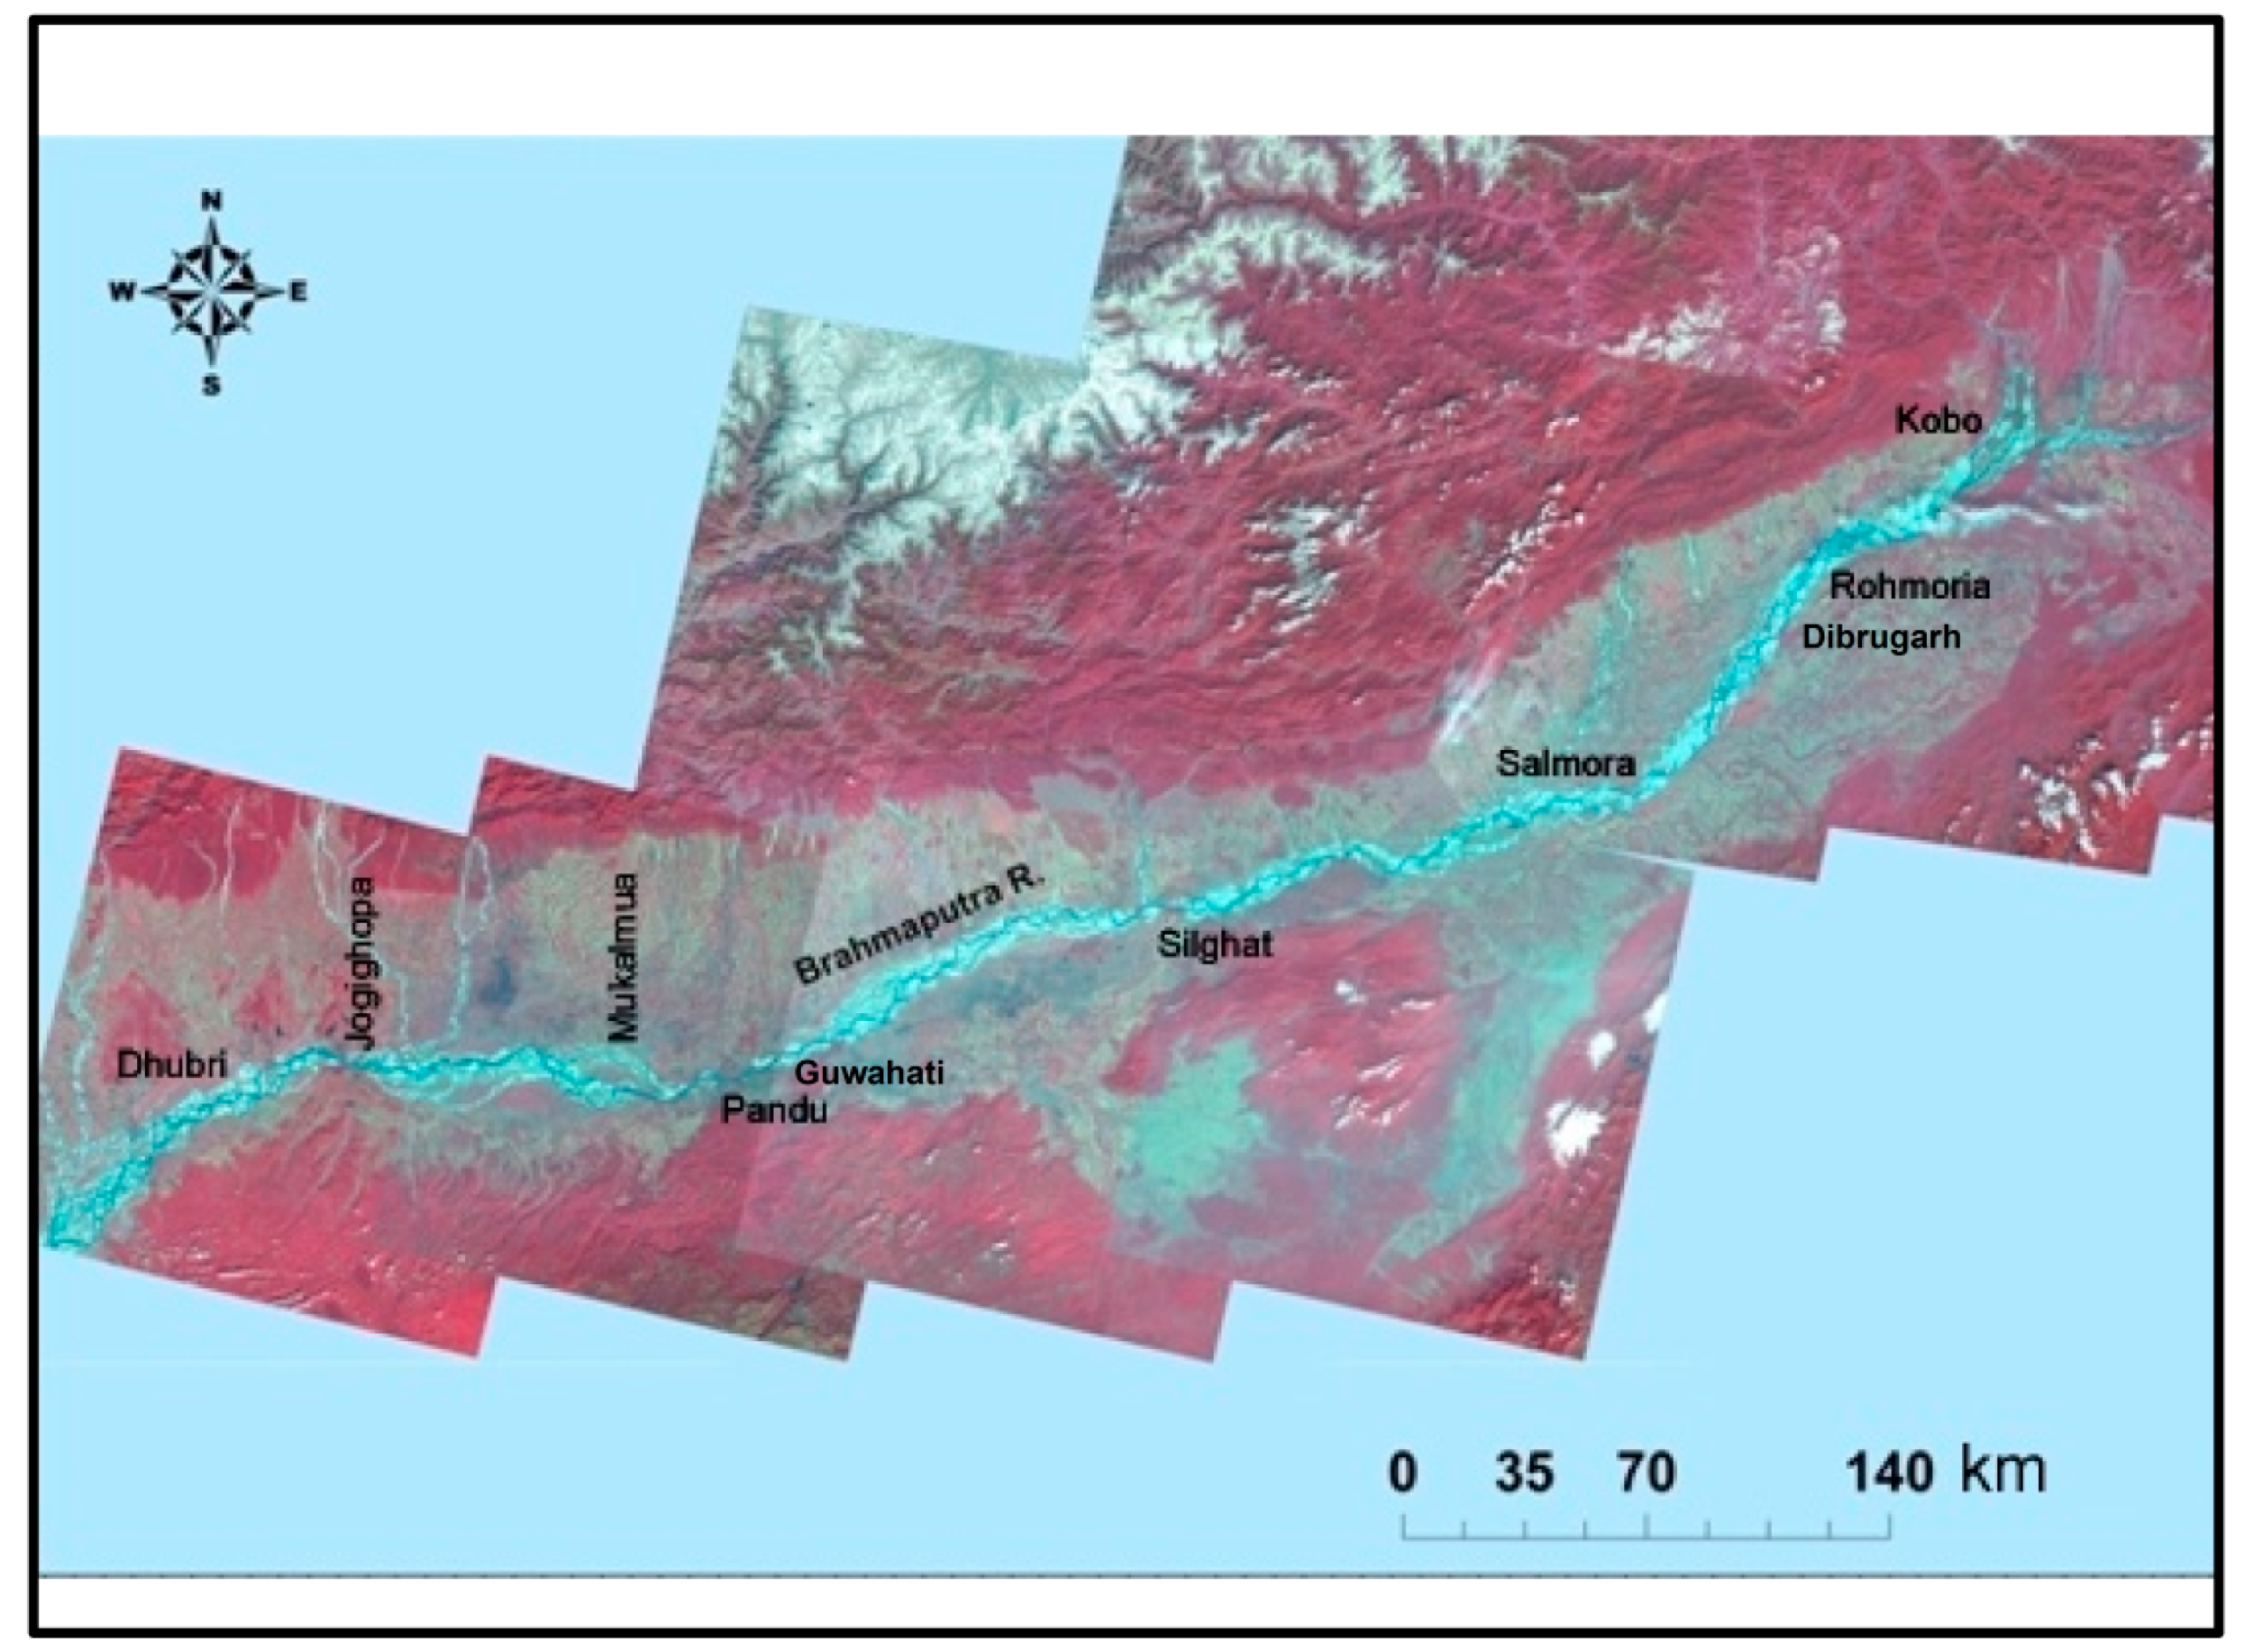
2.2. Morphology of the Brahmaputra River Channel in Assam
The morphology of the Brahmaputra River channel is very conspicuous in satellite images of low flow (Figure 2). Within the selected course of the Brahmaputra River in Assam, the channel reach can be divided into the following three categories following Leopold and Wolman [24] and Eaton et al. [25] (Figure 3).
- (1)
- narrow single channel reach (node);
- (2)
- anbranching-cum-braided reach;
- (3)
- braided (island/bar) reach.
Among these, the single-channel reaches are permanent in nature whereas the anabranching reaches are observed to be stable for the last 40 years and the intensity of braiding varies along the solely braided reaches.
The Brahmaputra flows in a narrow single channel for three short rocky reaches at Silghat (width = 1.5 km), Pandu (width = 1.1 km), and Jogighopa (width = 2.1 km). In the upstream in between longitude 94°50′ E to 95°13′ E and in the downstream in between longitude 90°35′ E to 91°05′ E the river develops anabranching-cum-braided channels. About 83 percent of the course of the Brahmaputra in Assam is braided, where the flow of the river gets divided into a number of channels of different orders separated by mid-channel braid bars.
2.3. Hydrometeorology, Water Discharge, Sediment Load and Bankline Migration
The annual precipitation is about 300 mm in the Brahmaputra basin in Tibet. Annual rainfall in the southern slopes of the Himalayan drainage of the Brahmaputra is between 1000 and 3000 mm, and between 2000 and 4000 mm over the Brahmaputra Valley of Assam as well as the Naga–Patkai and Indo–Myanmar Ranges.
The Brahmaputra is the fourth largest river in the world in terms of average flow discharge at its mouth with a flow of 19,830 , whereas the river ranks 22nd in terms of drainage area. Hence, discharge per unit drainage area in the Brahmaputra is amongst the highest in the world. At Pandu the Brahmaputra yields 0.0306 m3 s−1km−2, and the mean annual flood discharge is 51,156 [6]. The rainy season (May through October) accounts for up to 82% of the mean annual flow at Pandu with high fluctuations in daily discharge [11].
The Brahmaputra plays a significant role in the sediment and geochemical element budgets of the globe. It supplies 670 km3 of water, 1000 million tonnes of particulates, and 100 million tonnes of dissolved material annually to the Bay of Bengal [26,27,28]. Weathering and erosion rates in the Brahmaputra basin are among the highest in the world. During the monsoon months, June through September, the daily rate of sediment discharge at Pandu averages 2.0 million tonnes, whereas average annual suspended load is 402 million tonnes [29]. Goswami [30], using a sediment budget, estimated a secular aggradation of 607 km Assam reach of the Brahmaputra between Ranaghat (near Pasighat) in Arunachal Pradesh and Jogighopa in Assam as 16 cm during the period from 1971 through 1979. A study of bankline migration of the Brahmaputra River in Assam during the twentieth century reveals that between 1912 and 1996, the highest annual rate of shift in the bankline due to erosion and lateral accretion was 227.50 m/year and 331.50 m/year, respectively [13].
3. Results
3.1. Variation in Width of the Brahmaputra River
Detailed data on the width of the channelbelt measured in between the two banks of the Brahmaputra River are presented in Table 1. Mean width of the Brahmaputra River channel in Assam measured in between the two banks at 64 fixed segments along its course between 1912–1928 was 5949 m, which increased to 7455 m by 1963–1975. During this time span, out of a total of 64 segments under study, there were channel-widening ranges from 52 to 6656 m (mean = 2190 m) in as many as 53 segments; compared to this, narrowing was noticed ranging from 30 to 5417 m (mean = 1791 m) in only 11 segments. It is evident from the data that there was an overall widening of the channel in the years 1963–1975 as compared to the earlier time. In 1996, the mean width of the channel was 7505 m, which was slightly more than that of the former sequence (1963–1975). From 1963–1975 and to 1996, out of 64 segments, widening took place in 35 segments ranging from 56 to 4773 m (mean = 1704 m), and narrowing took place at as many as 29 segments ranging from 18 to 6117 m (mean = 1947 m). In 2000, 2007 and 2009, the mean widths of the channel were 8008, 8308 and 9012 m, respectively, which were significantly more than those in1996.
From 1996 to 2009, out of 64 segments widening took place in as many as 51 segments ranging from 16 to 8374 m (mean = 2109 m) and narrowing took place at only 13 segments ranging from 16 to 3065 m (mean = 851 m).
By comparing the width of the first sequence (1912–28) of data with that of the last (2009) it is observed that out of 64 segments widening took place in 55 segments ranging from 7 to 11,429 m (mean = 3878 m) and narrowing took place at only 9 segments ranging from 220 to 3347 m (mean = 1913 m). It is also noticed that there are 19 segments where there has been an invariable increase in width; these sections are distributed from upstream to downstream. In other sections there is a decrease in width in one period and an increase in the other and vice versa.
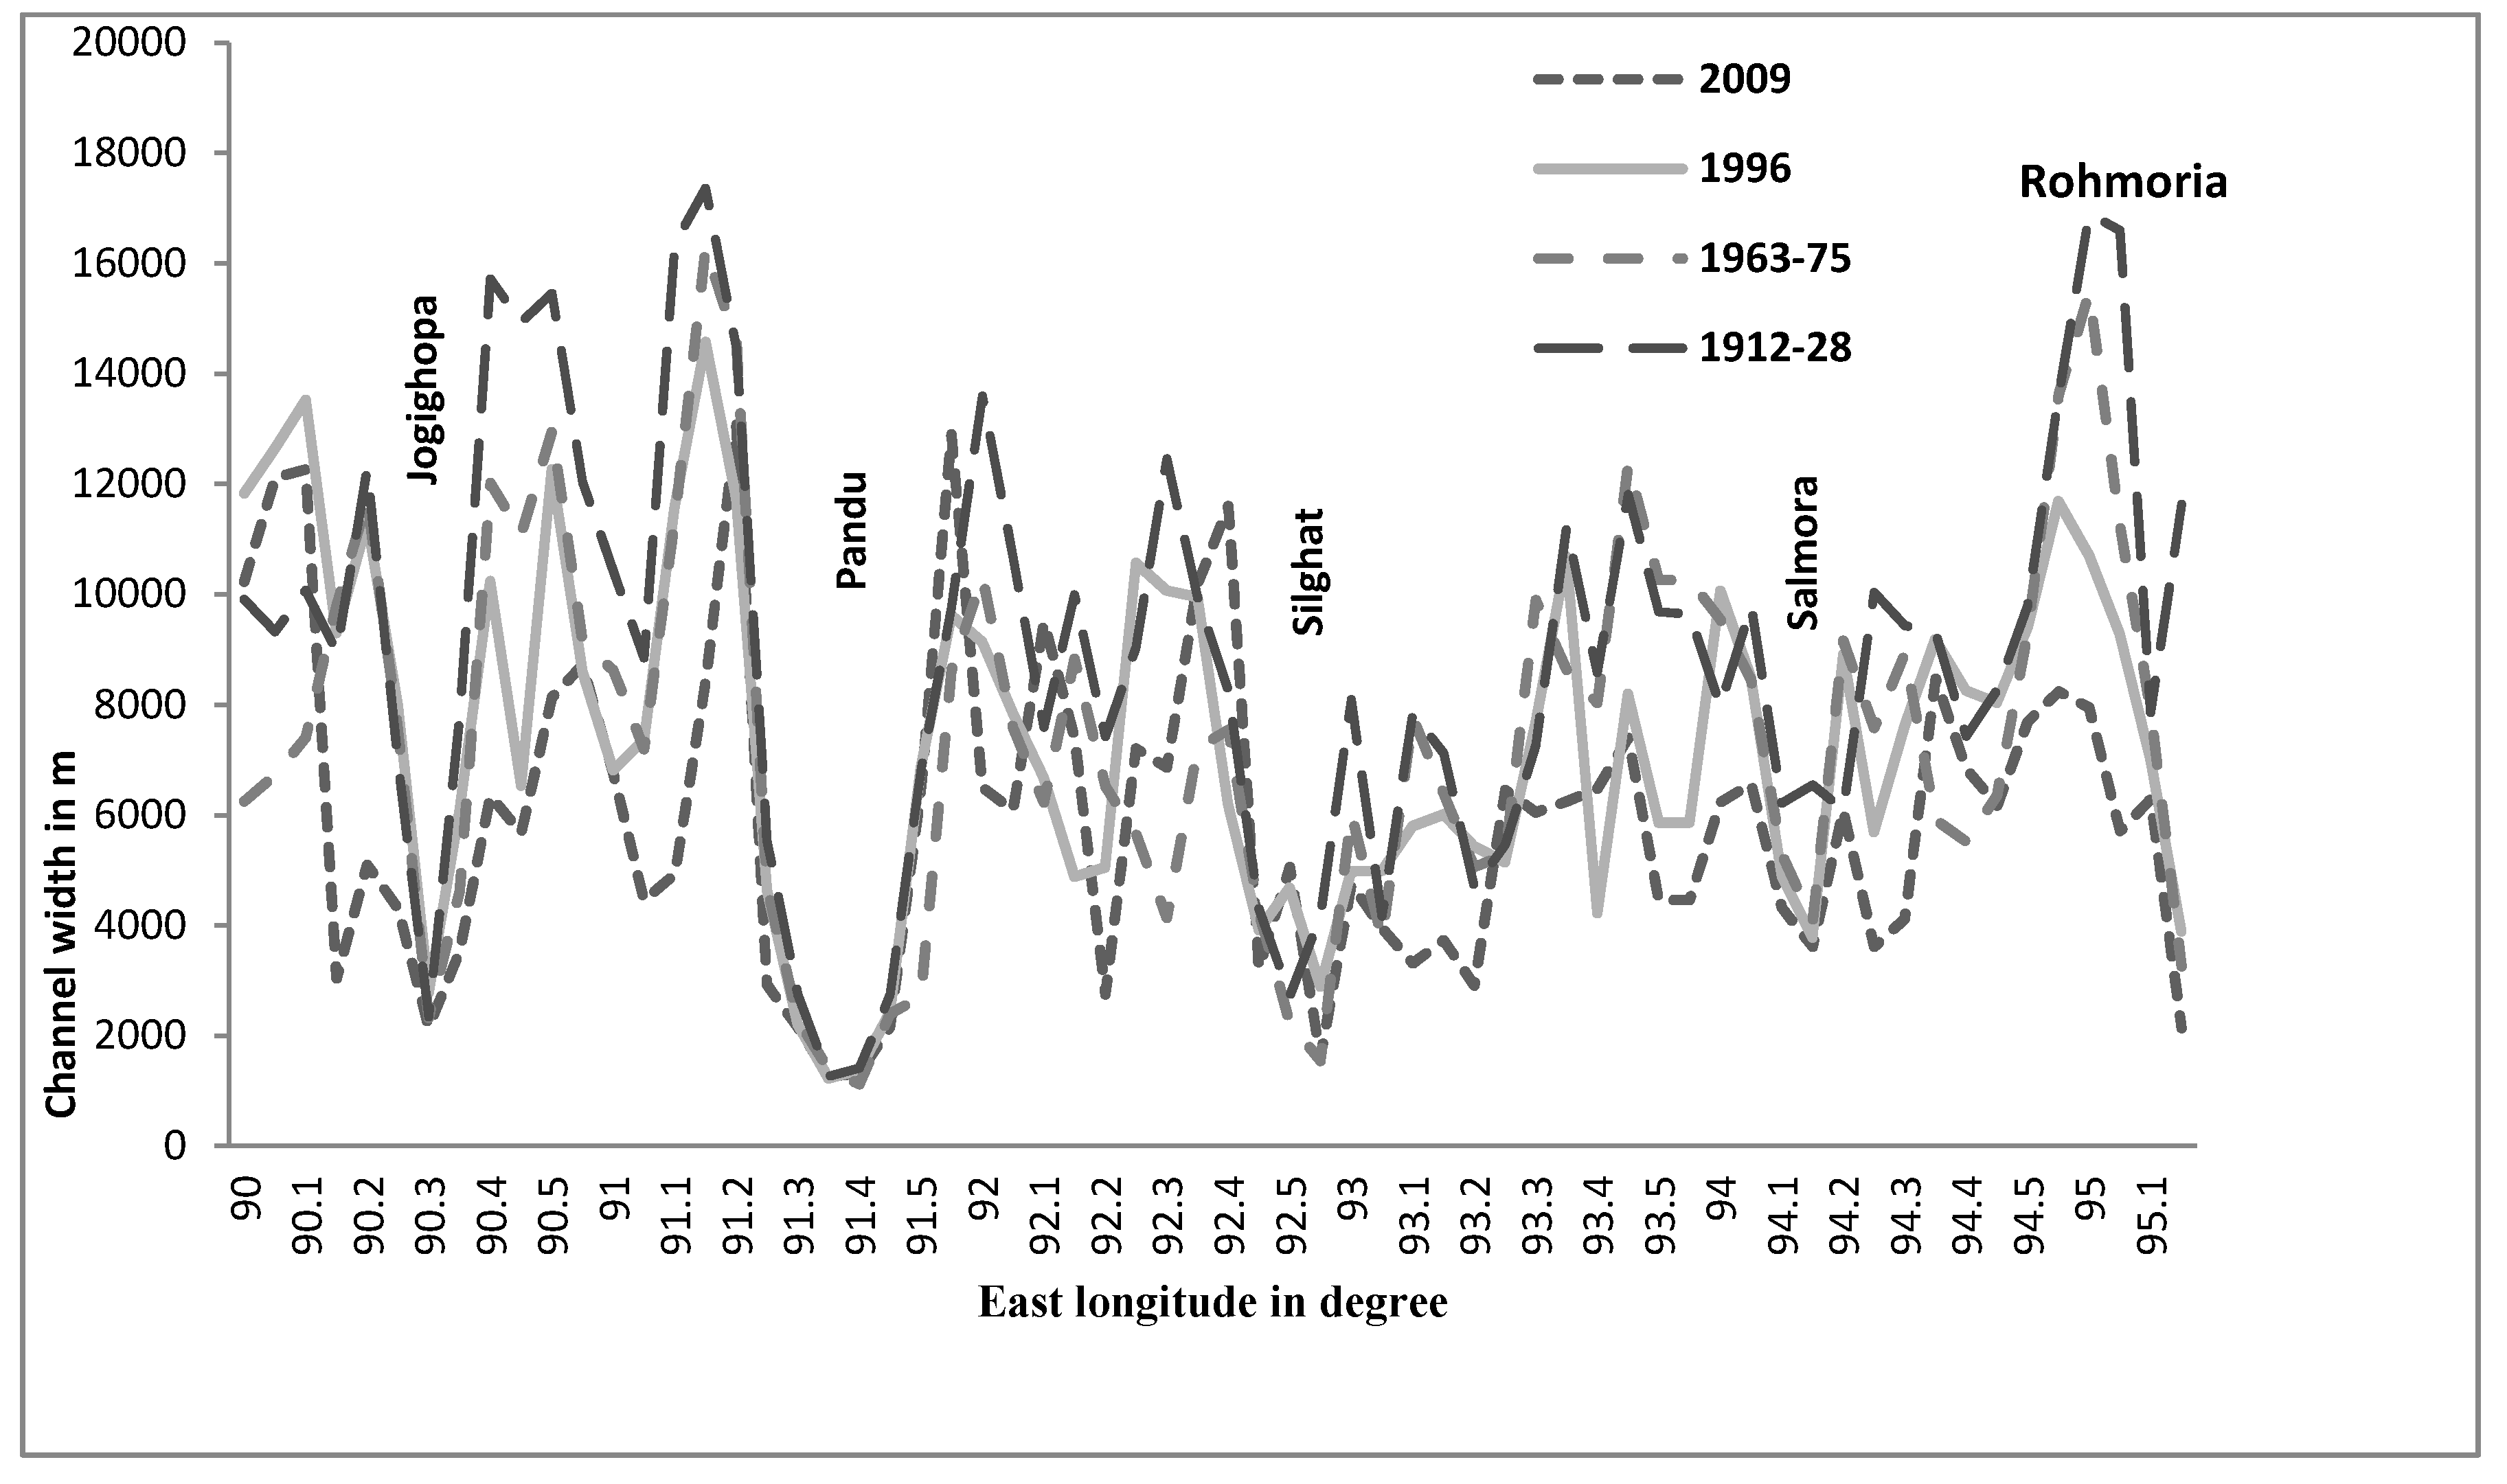
In order to assess variation of the channel width along the course of the Brahmaputra River from Dhubri to Kobo within different time periods under study, the data in Table 1 are shown graphically in Figure 4 by superimposing one upon the other. It is evident from Figure 4 that the width showed very low values as well as minimum variations at four segments; from upstream to downstream these segments are:
- Salmora (Majuli): 94°15′–94°20′
- Silghat: 92°55′–93°00′
- Pandu: 91°35′–91°45′
- Jogighopa: 90°30′–90°35′
The Silghat, Pandu and Jogighopa segments represent hard points comprising gneissic rocks. Among these, also the Pandu segment shows the least variation and it is the narrowest segment of the entire course through the Brahmaputra Valley. However, the Salmora segment lies on alluvium comprising cohesive clay from which pottery has been made since very ancient times. All these narrow segments can be considered as nodes. On the contrary, the reaches around Rohmoria situated on the east of Dibrugarh (Figure 5) and Mukalmua located on the west of Pandu have shown consistent increases in width throughout the period under study [29].
Causes of Increase in Width
The larger number of segments (53 out of 64, or 82.8%) where there were increases in width in the period from (1912–1928) to (1963–1975) might be a consequence of the great Assam earthquake of 1950 that measured 8.5 on the Richter scale, whose epicenter was within the Brahmaputra basin. This earthquake induced large-scale landslides in the Himalayas. As the slope of the Himalayas was barren for several years after the earthquake, the loose debris and barren slopes together resulted in 45 billion m3 of sediment inputs into the river system in this rain-drenched region, which ultimately choked the bed of the Brahmaputra [31]. The floodplain aggradation has not been able to keep up with channel aggradation, so channel capacity has declined. The bed of the Brahmaputra is raised by about 3 m in Dibrugarh, as revealed by a sharp rise in the low-water level of the Brahmaputra River at Dibrugarh as a result of deposition of the enormous amount of sediment on its bed following the 1950 great earthquake (Figure 6).The highest flood level (HFL) in Dibrugarh is 105.95 m and the danger level (DL) is 104.24 m. There is no record of the lowest water level. As the river became shallower, it became wider to accommodate its regular flow subsequent to 1950. Unfortunately, maps or images of the Brahmaputra immediately after 1950 are not available to confirm the widening of the channel spatially, and the next survey of the river was carried out only during 1963–1975 after a gap of 13–25 years, which reveals the widening of the channel.
There was a minor increase in width between 1963–1975 and 1996, from 7455 to 7504 m. However, the progressive increase in width during 1996 to 2009, from 7504 to 9012 m, was very significant. Although the cause of this widening could not be worked out appropriately, it is correlated to deforestation [32] due to large-scale road construction and logging operations in the forests of the Arunachal Himalayas during this period [33].
3.2. Braiding Intensity (BI) of the Brahmaputra River
The braidings of the Brahmaputra River were measured using BI along the river at 64 segments for the periods 1963–1975, 1996, 2000, 2007 and 2009, and are given in Table 2. The mean BIs for the entire Brahmaputra in Assam for 1963–1975 and 1996 were 8.59 and 8.43, respectively, indicating a slight decrease in braiding in the later period. Out of a total of 64 segments, there were 30 segments where the BI of the river had increased and 34 segments where the BI had decreased in 1996 as compared to 1963–1975. The average BI for the entire Brahmaputra in Assam since 2009 was 7.70, indicating a significant decrease in braiding in this period as compared to 1996. The BI increased in 28 segments and decreased in 36 segments in 2009 as compared to 1996, but the cause of thedecrease in BI cannot be ascertained. The increase of BI in some segments might indicate that the river was depositing more silt in those areas as compared to the former occasion. On the other hand, the river was either depositing less silt or rather eroding away the sediment in the segments where the BI was decreasing.
Variation of Braiding Index (BI) with Time
The BIs of the three study periods (1963–1975, 1996 and 2009) along the Brahmaputra River from Dhubri to Kobo are presented in Figure 7. Variation of BI with time is examined by using the superimposed graphs of the values of BI of all segments for the three time sequences of the Brahmaputra River. It is evident from Figure 7 that the BI showed minimum variation at the Pandu segment. The variation was also very low at both Silghat and Jogighopa. Lower variation is also noticed on the segment surrounding Salmora of Majuli. Significantly, all these four segments also show minimum variation of the channel width (cf. Figure 4). The BI values show an increasing trend at the upstream segments around Rohmoria (94°05′–94°10′) and the same show a decreasing trend upstream of Jogighopa (90°55′–91°00′).
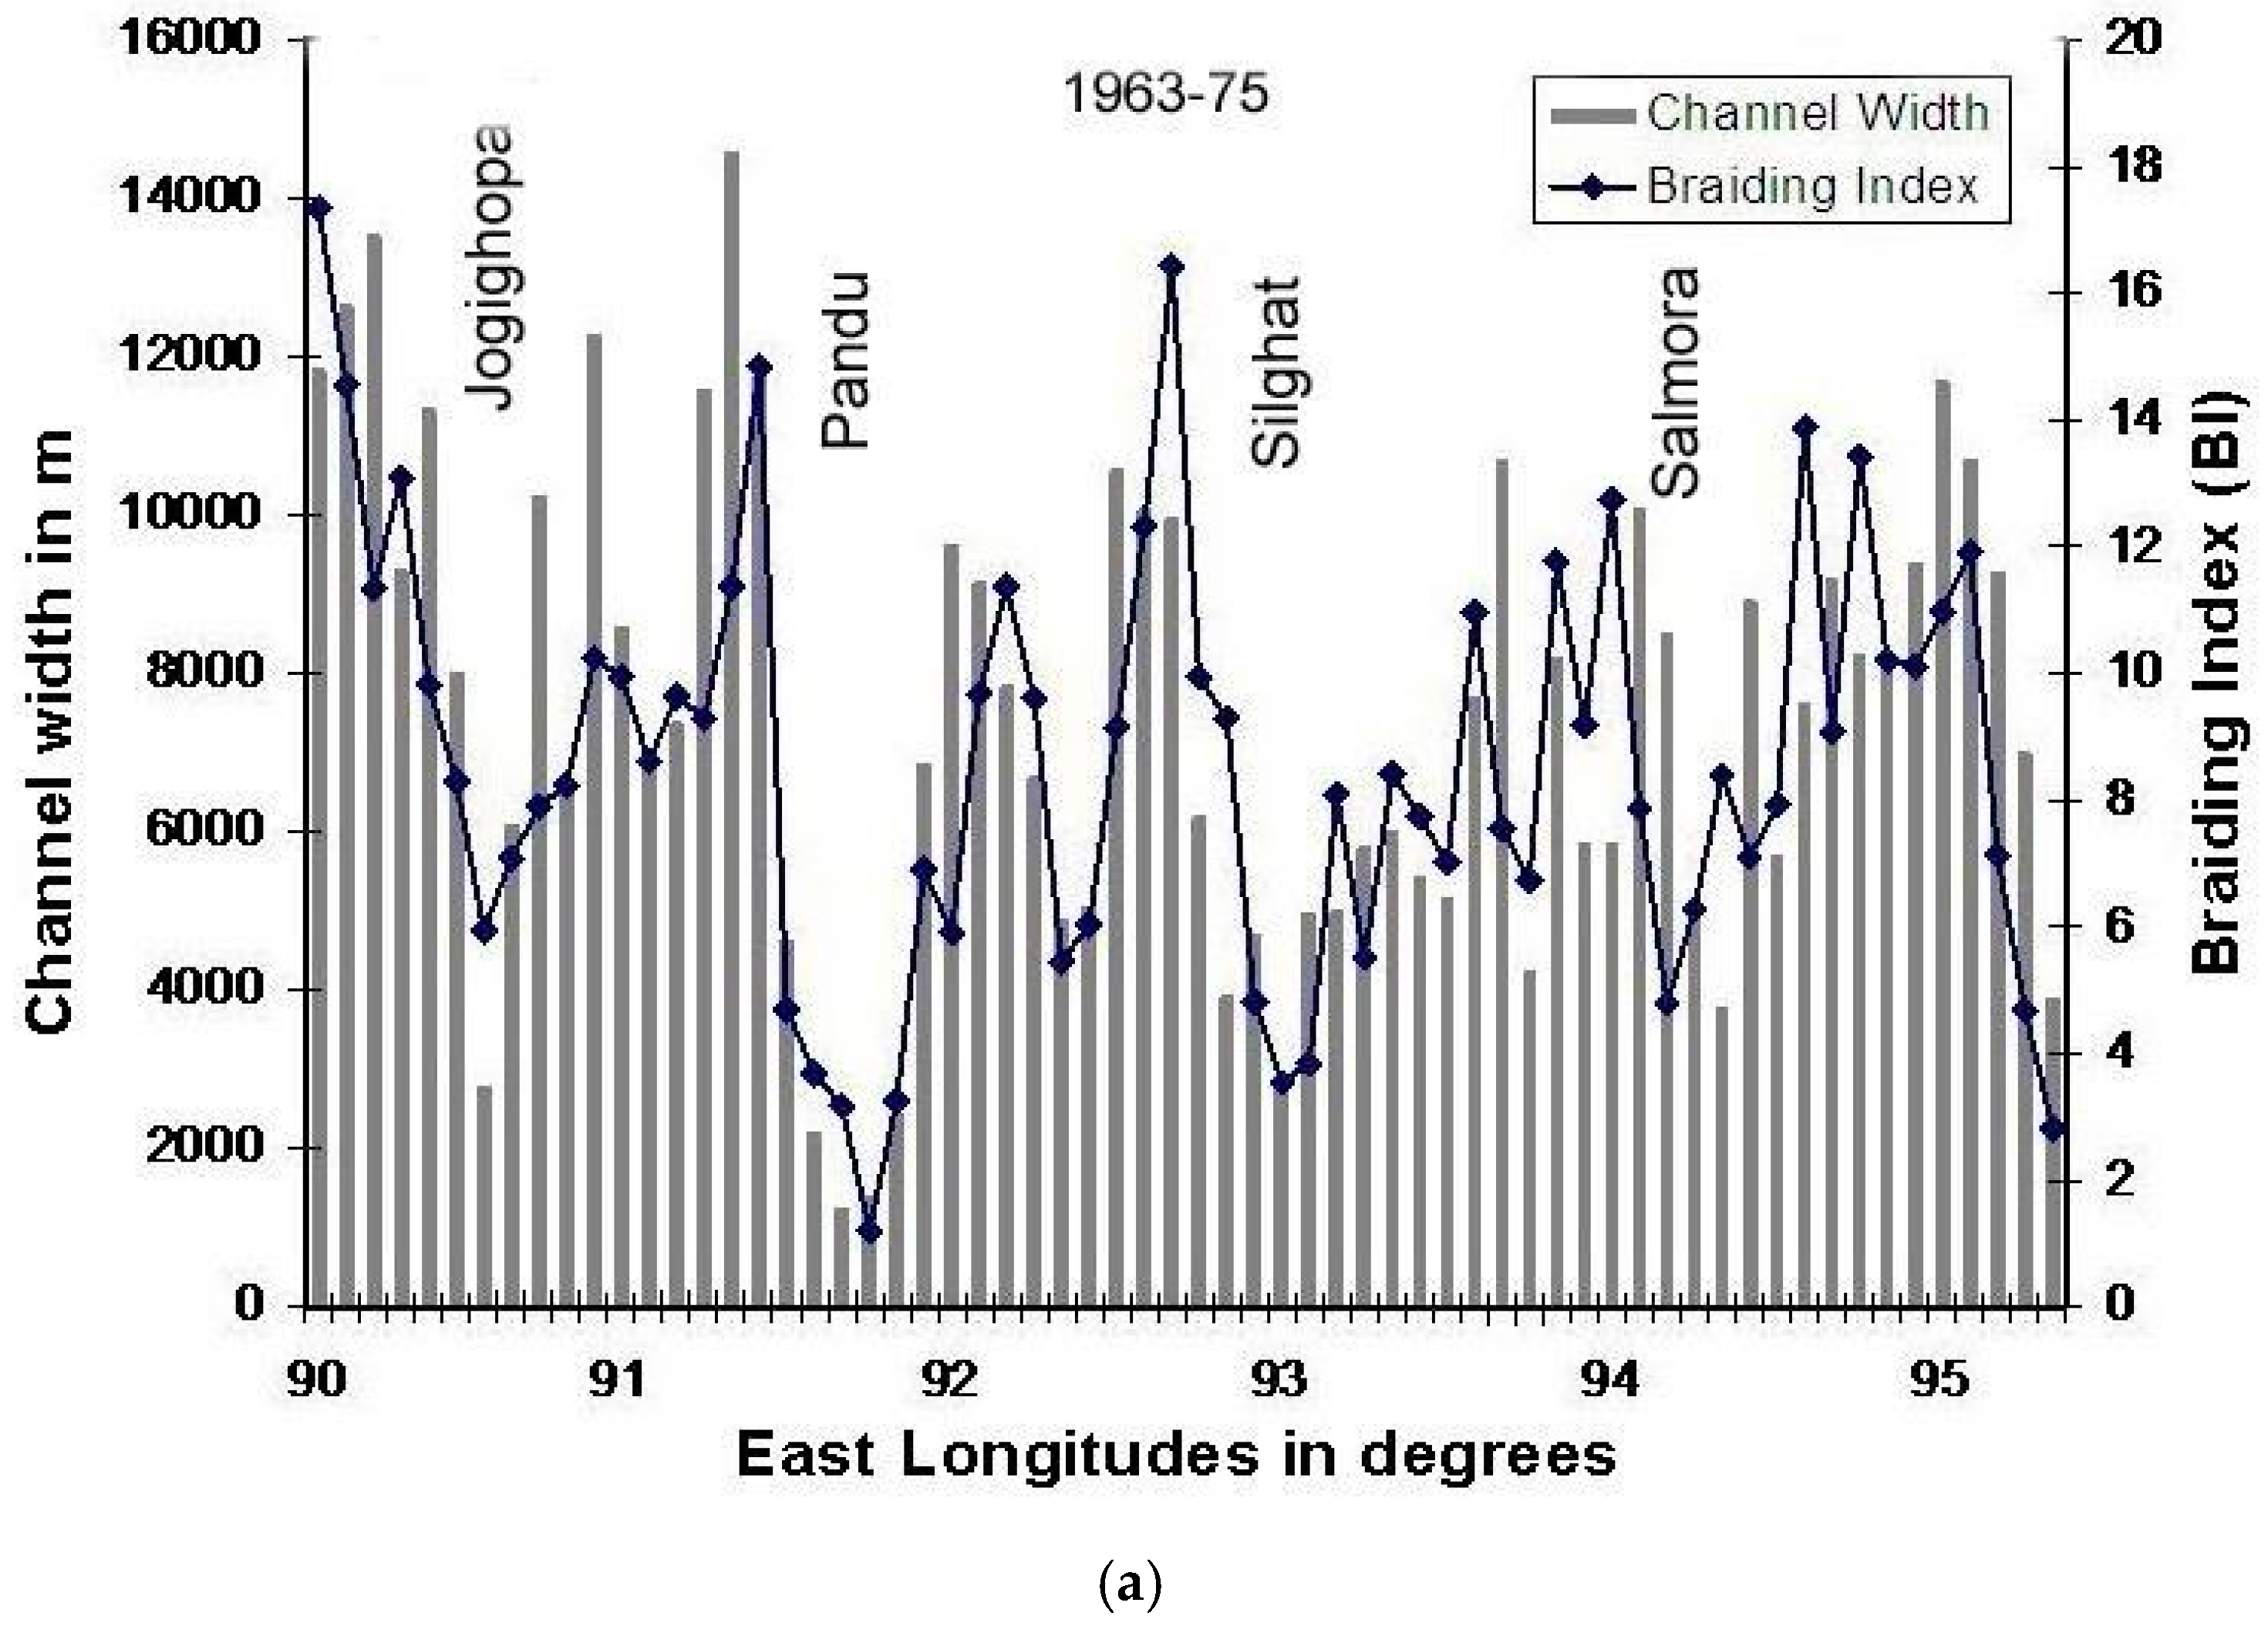
3.3. Interrelationship between Channel Width and Braiding Index (BI)
The channel widths and BIs of different segments along the Brahmaputra river course are plotted together for all periods in order to observe their interrelationship. The plots reveal that there is a strong similarity between their trends, as shown, for example, for the 1963–1975 period in Figure 8a. The variations of channel width and BI of different segments along the Brahmaputra river course between 1963–1975 and 2009 are given in Table 3 and shown graphically in Figure 8b. A scatter plot of the changes in channel width against BI between 1963–1975 and 2009 is shown in Figure 8c. It is evident from Figure 8c that the relation between the changes in both channel width and that of BI is widely scattered, and only 22.8% of the total variation shows positive correlation.
Using data from the Table 1 and Table 2, the variation in width in the three time sequences (1963–1975, 1996 and 2009) and the corresponding variation in the BI in each segment are analysed. The variations are both similar and dissimilar in nature. The similar variations are: (a) increase in width and a corresponding increase in BI, and (b) decrease in width and corresponding decrease in BI. The dissimilar variations are: (c) increase in width and corresponding decrease in BI, and (d) decrease in width and a corresponding increase in BI.
It is evident from the data that between (1963–1975) and 1996 an increase in width associated with an increase in BI was found in 20 cases (31%), and decrease in width with decline in BI was recorded in 19 cases (30%). On the other hand, an increase in width leading to decrease in BI was found in 15 cases (23%), and decrease in width and a corresponding increase in BI was found in 10 cases (16%). Between 1996 and 2009, an increase in width associated with an increase in BI was found in 25 cases (39%), and decrease in width with a decline in BI was observed in 8 cases (13%), whereas an increase in width and corresponding decrease in BI was also found in 25 cases (39%), and decrease in width with an increase in BI was recorded in only 6 cases (9%). The overall similar variation was 56.5% as compared to dissimilar variation of 43.5%, signifying that the majority of the variations are similar in nature.
The BI values of the Brahmaputra at different segments are plotted against corresponding channel widths for all time sequences under study (Figure 9). The plot shows a positive correlation of 41.2%, indicating an increase in BI with increasing channel width.
4. Discussion
There is a large variation of width of the Brahmaputra River channel along its course through the Brahmaputra Valley in Assam. The width is lowest at the nodes, but increases significantly just downstream of the nodes. The BI of the Brahmaputra River channel also varies along its course and is lowest and nearly invariable at the nodes. The BI has increased significantly in the upstream part of the river. The mean BI showed a decreasing trend with time until 2007, which is opposite of the trend of variation in the corresponding mean channel width.
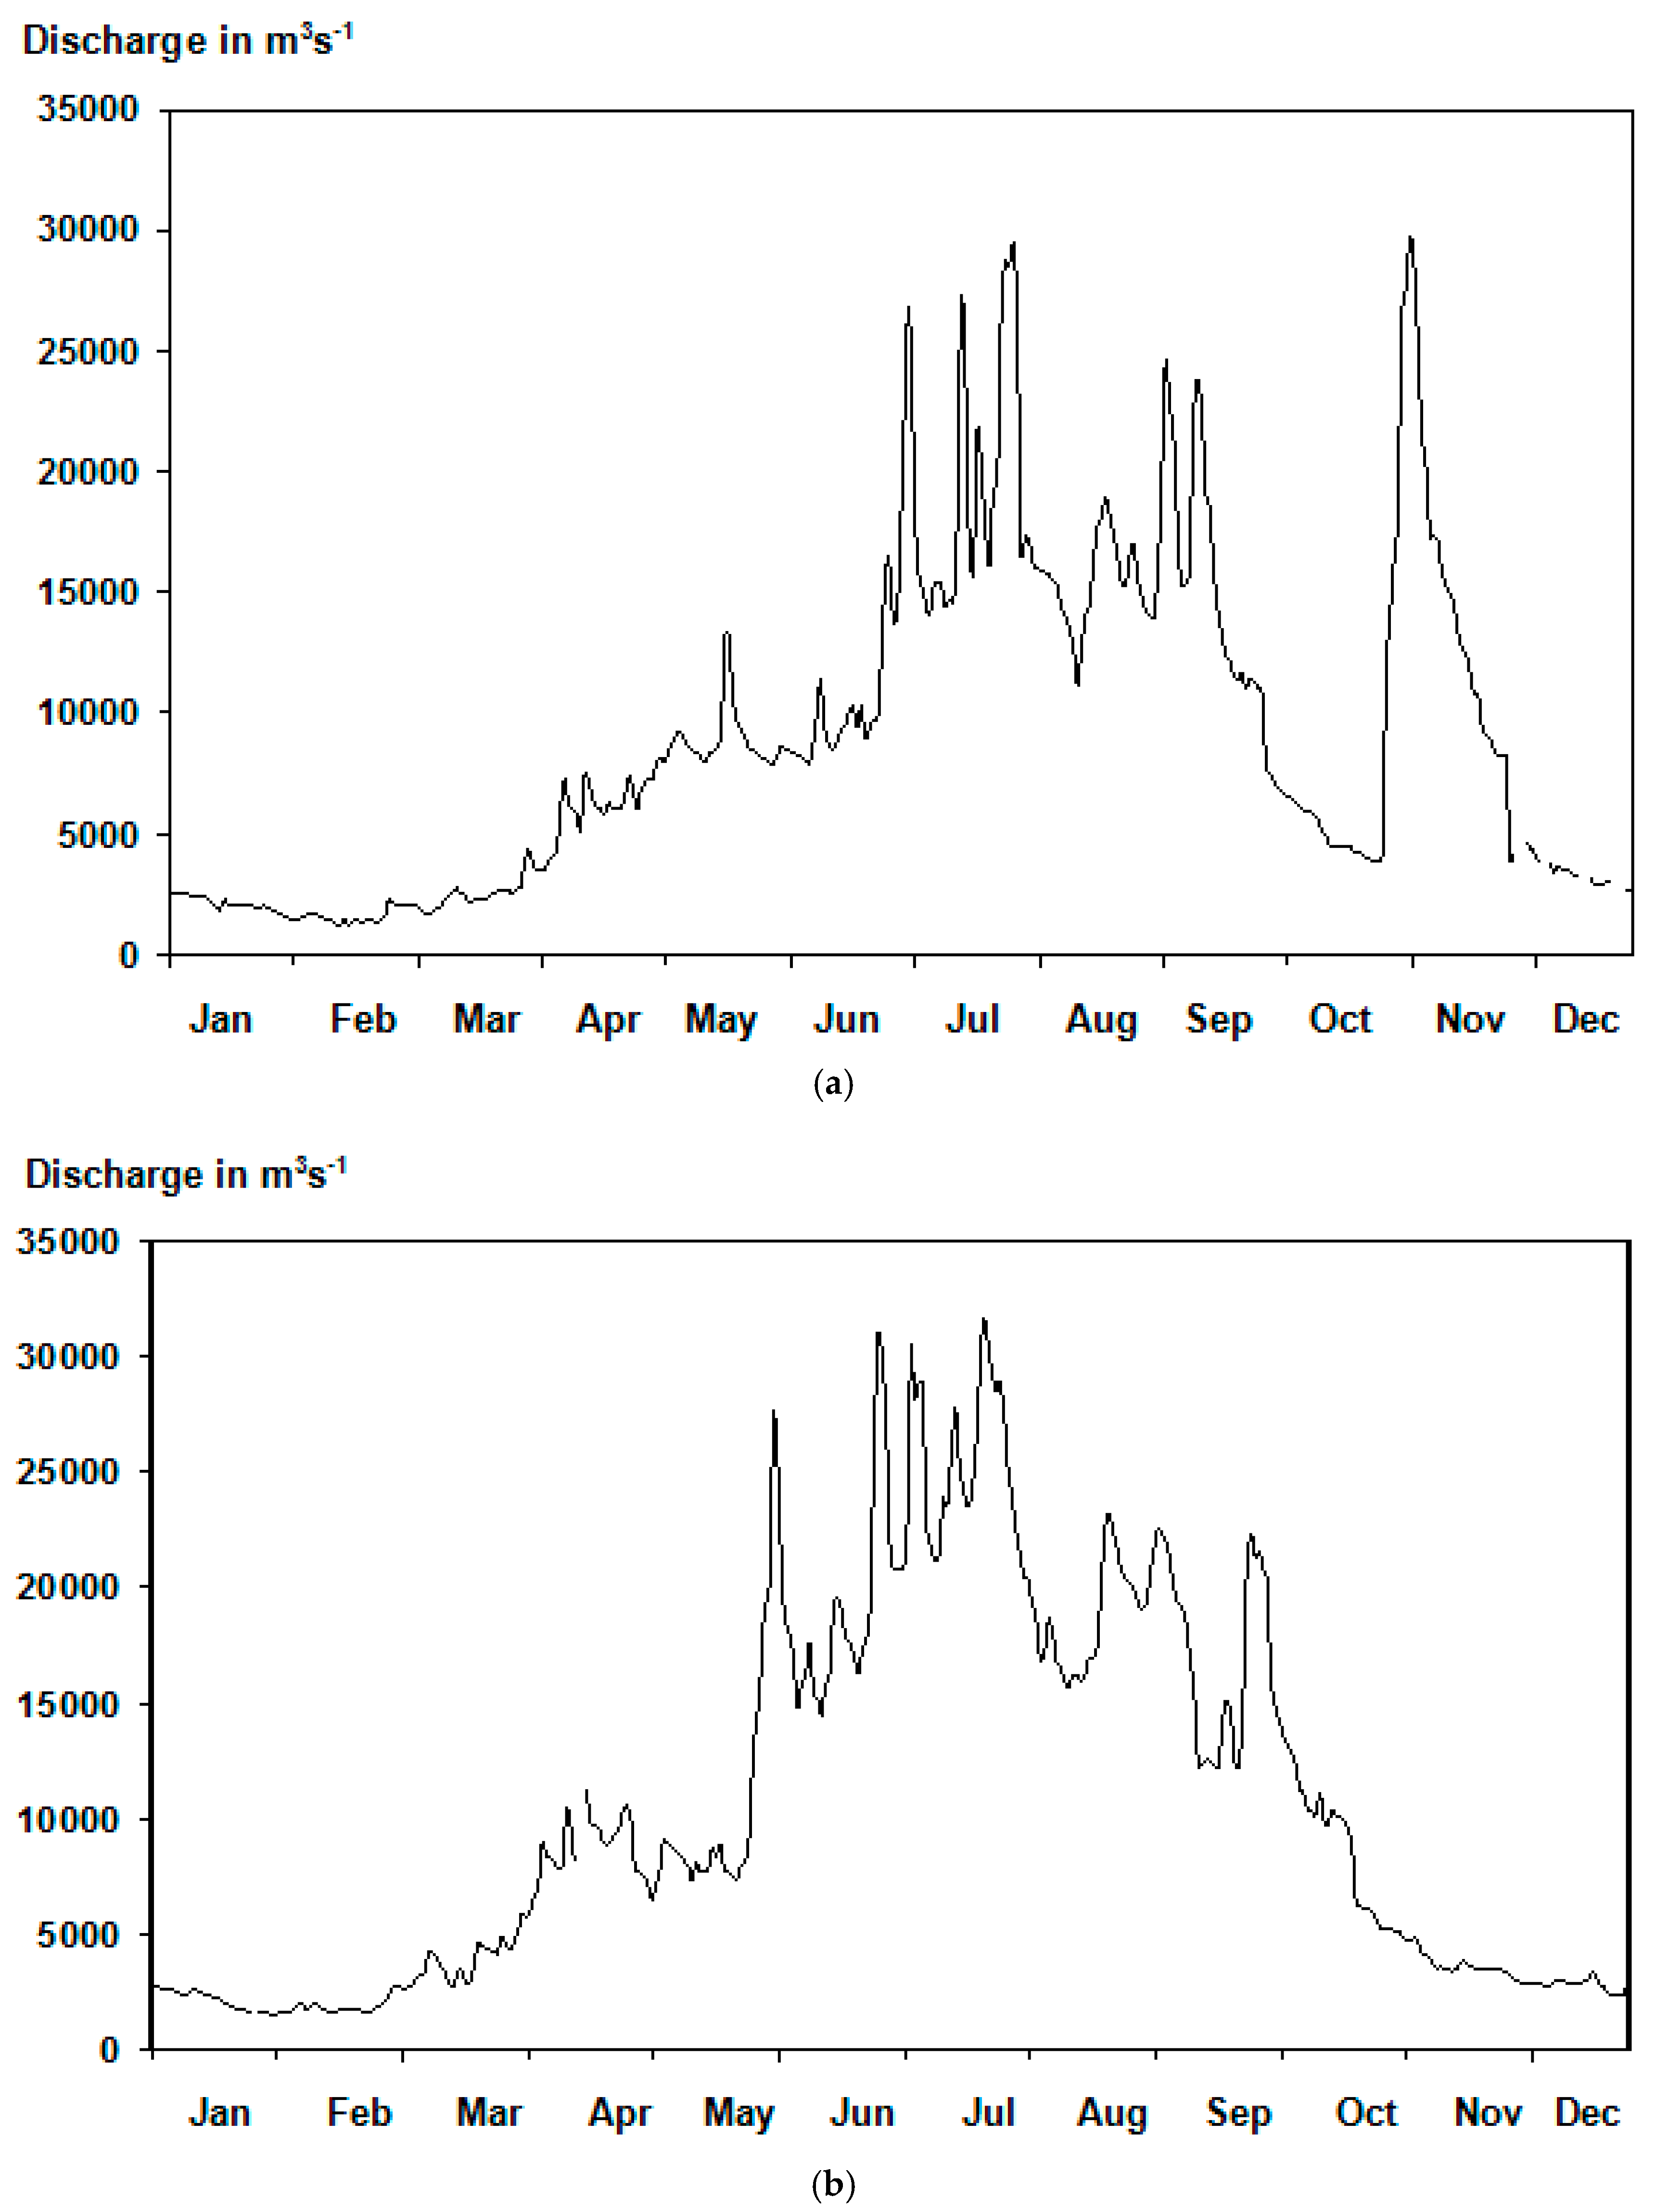
Most rivers will braid when channel width (w) is 60 times its depth (d) [34]. At Pandu, the most constricted part of the Brahmaputra, maximum depth recorded is 27.4 m and width is 1100 m, hence here w = 40 d, and this segment does not develop braiding. However, the mean width in braided reaches of the Brahmaputra is around 8000 m and depth is about 10 m, hence in majority of the cases w = 800 d, and this large w/d ratio is one of the principal causes of development of braiding in the Brahmaputra. When the difference of discharge is very high it results in rapid fluctuation of discharge, and such a situation gives rise to braiding. Discharges that are excessive lead to erosion of the banks and irregular bedload movement, which is a key factor in the formation of a braided stream Knighton [35]. This aspect is also applicable in the case of the Brahmaputra River. Most of the hydrographs represent multiple peaks occurring at different times during June to October, indicating high variation of discharge (Figure 10). Large variations of the discharge within a short span of time are noticed during a flood, with the maximum difference of about 17,000 in 24 h (7–8 June 1990) and 24,000 in 48 h (7–9 June 1990) being recorded in the rising limb of the hydrograph. The maximum discharge reduction on the recession limb was 12,000 over 24 h (21–22 September 1977) [11].
Bank erodibilty is also a major component of Brahmaputra braided river systems. Braided systems that have banks of readily erodible materialare found in the environment of the Brahmaputra River. For example, in the reach around Rohmoria, the lower part of the bank comprises a layer of coarse loose sand for a length of about 10 km, and as a result, this reach has suffered a very high rate of bank erosion vis-à-vis channel migration (cf., Figure 5) [27].
5. Sustainable Management for Brahmaputra Braided Segments
The Brahmaputra River’s braided segments, as discussed in this paper, change their geometry with time. Being situated in a high seismic region, the river basin has been largely affected by strong earthquakes and attendant large-scale landslides vis-à-vis high sediment input. Such an incident disrupts the natural balance of sediment input and sediment transport, causing change in channel morphology. Balancing the sustainable development of such a dynamic braided river valley without compromising natural river ecosystem functions is a complex task [28]. Some of the strategies for achieving this could be (1) to adopt measures for reducing flood at a reach scale, thereby reducing flood as well as bank erosion; (2) reducing sediment delivery to decrease braiding intensity by afforestation policies; (3) to reduce sediment input from landsliding through reforestation of bare landslide areas as a long-term solution; and (4) balancing human needs in active braided systems for both risk reduction and ecosystem maintenance.
Management strategies that have been undertaken by the Government of Assam for controlling the braided segments of the Brahmaputra River include protecting the developed floodplain by engineered structures and afforesting the catchment. There is no unique solution to managing braided rivers, but that management depends on the stage of geomorphological evolution of the river, ecological dynamics and concerns, and human needs and safety. To propose ‘sustainable’ solutions, the government authorities must consider the cost–benefit aspects of their options, and the needs and desires of society. This requires an interdisciplinary approach linking engineers, earth scientists and social scientists concerned with environmental economics, planning, and societal and political strategies, in order to fully evaluate the economic and social validity of different options for different timescales.
6. Conclusions
There is a large variation of width of the Brahmaputra River channel along its course through the Assam Valley. The width is less on the constricted (node) parts comprising hard rocks as well as cohesive soil. The width increases significantly just downstream of the nodes. The mean width of the river has been increasing with time for about the last nine decades along its course in Assam. An abrupt increase in mean width is correlated to a tectonic event. The BI of the Brahmaputra River channel also varies along its course. The BI is lower and is nearly invariable at the constricted (node) parts comprising hard rocks as well as cohesive soils. The BI has increased significantly in the upstream part of the river. Very high fluctuations of discharge (17,000 in 24 h) and high sediment loads of the Brahmaputra (daily mean sediment discharge of 2.0 million tonnes during monsoon), erodible alluvial banks and high width/depth ratios are the main causes of development of braiding. The interrelationship between channel width and BI of the Brahmaputra shows a positive correlation, indicating an increase in BI with increasing channel width.
Author Contributions
Formal analysis, S.A.; Investigation, J.N.S. and S.A.; Methodology, S.A.; Writing–original draft, J.N.S.; Writing–review an editing, J.N.S. and S.A.
Funding
This research received no external funding.
Conflicts of Interest
The authors declare no conflict of interest.
References
- Brice, J.C. Index for description of channel braiding. Geol. Soc. Am. Bull. 1960, 71, 1833. [Google Scholar]
- Brice, J.C. Channel Pattern and Terraces of the Loup River in Nebraska; US Government Printing Office: Washington, DC, USA, 1964.
- Rust, B.R. Depositional models for braided alluvium. CSPG Spec. Publ. 1978, 5, 605–626. [Google Scholar]
- Friend, P.F.; Sinha, R. Braiding and meandering parameters. Geol. Soc. Lond. Spec. Publ. 1993, 75, 105–111. [Google Scholar] [CrossRef] [Green Version]
- Geological Survey of India. Proceedings of the Seminar on Fluvial Process and Geomorphology of the Brahmaputra Basin; Geological Survey of India: Kolkata, India, 1981.
- Water and Power Consultancy Services (India). Morphological Studies of the River Brahmaputra. Available online: http://www.wapcos.gov.in/ (accessed on 11 September 2018).
- Kotoky, P.; Sarma, J.N. Hydrogeomorphological study of the Brahmaputra river from Majuli to Kaziranga. Unpublished report. 2001. [Google Scholar]
- Gilfellon, G.B.; Sarma, J.N.; Gohain, K. Channel and bed morphology of a part of the Brahmaputra river in Assam. J. Geol. Soc. India 2003, 62, 227–236. [Google Scholar]
- Sarker, M.H.; Thorne, C.R. Morphological response of the Brahmaputra-Padma-Lower Meghna river system to the Assam earthquake of 1950. In Braided Rivers: Process, Deposits, Ecology and Management; International Association of Sedimentologists: Ghent, Belgium, 2006; pp. 289–310. [Google Scholar]
- Sarma, J.N.; Dibrugarh University, Rajapeta, Dibrugarh, Assam, India. Pattern of erosion and bankline migration of the river Brahmaputra in Assam. Unpublished report. 2004. [Google Scholar]
- Sarma, J.N. An overview of the Brahmaputra River system. In The Brahmaputra Basin Water Resources; Kluwer Academic Publishers: London, UK, 2004; pp. 72–87. [Google Scholar]
- Sarma, J.N. Fluvial process and morphology of the Brahmaputra River in Assam, India. Geomorphology 2005, 70, 226–256. [Google Scholar] [CrossRef]
- Sarma, J.N.; Phukan, M.K. Origin and some geomorphological changes of Majuli island of the Brahmaputra River in Assam, India. Geomorphology 2004, 60, 1–19. [Google Scholar] [CrossRef]
- Singh, S.K.; France-Lanord, C. Tracing the distribution of erosion in the Brahmaputra watershed from isotopic compositions of stream sediments. Earth Planet. Sci. Lett. 2002, 202, 645–662. [Google Scholar] [CrossRef]
- Singh, S.K.; Sarin, M.M.; France-Lanord, C. Chemical erosion in the eastern Himalaya: Major ion composition of the Brahmaputra and δ13C of dissolved inorganic carbon. Geochim. Cosmochim. Acta 2005, 69, 3573–3588. [Google Scholar] [CrossRef]
- Coleman, J.M. Brahmaputra River: Channel process and sedimentation. Sediment. Geol. 1969, 3, 129–239. [Google Scholar] [CrossRef]
- Bristow, C.S. Brahmaputra River: Channel Migration and Deposition. In Recent Development in Fluvial Sedimentology; Ethridge, F.G., Flores, R.M., Harvey, M.D., Eds.; SEPM Special Publication: Broken Arrow, OK, USA, 1987; Volume 39, pp. 63–74. [Google Scholar]
- Bristow, C.S. Sedimentary structures exposed in bar tops in the Brahmaputra River, Bangladesh. Geol. Soc. Lond. Spec. Publ. 1993, 75, 277–289. [Google Scholar] [CrossRef]
- Klaassen, G.J.; Vermeer, K.; Uddin, N. Sedimentological processes in the Jamuna (Lower Brahmaputra) river, Bangladesh. In Proceedings of the International Conference on Fluvial Hydraulics, Budapest, Hungary, 1988; pp. 381–394. [Google Scholar]
- Thorne, C.R.; Russell, A.P.G.; Alam, M.K. Planform pattern and channel evolution of the Brahmaputra River, Bangladesh. Geol. Soc. Lond. Spec. Publ. 1993, 75, 257–276. [Google Scholar] [CrossRef]
- Richardson, W.R.R.; Thorne, C.R. Secondary currents around braid bar in Brahmaputra River, Bangladesh. J. Hydraul. Eng. 1998, 124, 325–328. [Google Scholar] [CrossRef]
- Sarma, J.N.; Phukan, M.K. Bank erosion and bankline migration of the river Brahmaputra in Assam, India, during the twentieth century. J. Geol. Soc. India 2006, 68, 1023. [Google Scholar]
- Sarma, J.N.; Acharjee, S. Bank erosion of the Brahmaputra River and Neotectonic activity around Rohmoria Assam, India. Commun. Geol. 2012, 99, 33–38. [Google Scholar]
- Leopold, L.B.; Wolman, M.G. River Channel Patterns: Braided, Meandering and Straight; US Government Printing Office: Washington, DC, USA, 1957.
- Eaton, B.C.; Millar, R.G.; Davidson, S. Channel patterns: Braided, anabranching and single-thread. Geomorphology 2010, 120, 353–364. [Google Scholar] [CrossRef]
- Hay, W.W. Detrital sediment fluxes from continents to oceans. Chem. Geol. 1998, 145, 287–323. [Google Scholar] [CrossRef]
- Milliman, J.D.; Robert, H.M. World-wide delivery of river sediment to the oceans. J. Geol. 1983, 91, 1–21. [Google Scholar] [CrossRef]
- Piegay, H.; Grant, G.; Nakamura, F.; Trustrum, N. Braided river management: From assessment of river behaviour to improved sustainable development. In Braided Rivers: Process, Deposits, Ecology and Management; International Association of Sedimentologists: Ghent, Belgium, 2006; Volume 36, pp. 257–275. [Google Scholar]
- Sarin, M.M.; Krishnaswami, S.; Dilli, K.; Somayajulu, B.L.K.; Moore, W.S. Major ion chemistry of the Ganga-Brahmaputra river system: Weathering processes and fluxes to the Bay of Bengal. Geochim. Cosmochim. Acta 1989, 53, 997–1009. [Google Scholar] [CrossRef]
- Goswami, D.C. Brahmaputra River, Assam, India: Physiography, basin denudation, and channel aggradation. Water Resour. Res. 1985, 21, 959–978. [Google Scholar] [CrossRef]
- Pandit, M.K.; Sodhi, N.S.; Koh, L.P.; Bhaskar, A.; Brook, B.W. Unreported yet massive deforestation driving loss of endemic biodiversity in Indian Himalaya. Biodivers. Conserv. 2007, 16, 153–163. [Google Scholar] [CrossRef]
- Milliman, J.D.; Syvitski, P.M. Geomorphic/tectonic control of sediment discharge to the ocean: The importance of small mountainous rivers. J. Geol. 1992, 100, 525–544. [Google Scholar] [CrossRef]
- Water Resources Department. The Morphology of the Brahmaputra River. Available online: https://waterresources.assam.gov.in/ (accessed on 11 September 2018).
- Fredsoe, J. Meandering and Braiding of Rivers. J. Fluid Mech. 1978, 84, 609–624. [Google Scholar] [CrossRef]
- Kington, D. Fluvial Forms and Processes: A New Perspective; Routledge: Abingdon, UK, 2014. [Google Scholar]
Figure 1.
Location map of the course of the Brahmaputra River under study from Kobo to Dhubri.

Figure 2.
The Brahmaputra River in Assam (Indian Remote Sensing (IRS) LISS 3 False Colour Composite, 2007).
Figure 2.
The Brahmaputra River in Assam (Indian Remote Sensing (IRS) LISS 3 False Colour Composite, 2007).

Figure 3.
Brahmaputra River channel showing (a) narrow single channel (node) reach at Pandu (width = 1.1 km) near Guwahati, (b) anabranching-cum-braided channel reach near Rohmoria, R.F. stands for Reserve Forest and (c) braided (island/bar) reach near Tezpur.
Figure 3.
Brahmaputra River channel showing (a) narrow single channel (node) reach at Pandu (width = 1.1 km) near Guwahati, (b) anabranching-cum-braided channel reach near Rohmoria, R.F. stands for Reserve Forest and (c) braided (island/bar) reach near Tezpur.


Figure 4.
Superimposed channel width graphs along the course of the Brahmaputra River in four different time periods.
Figure 4.
Superimposed channel width graphs along the course of the Brahmaputra River in four different time periods.

Figure 5.
Widening of the Brahmaputra River channel around Rohmoria situated 20 km the east of Dibrugarh.
Figure 5.
Widening of the Brahmaputra River channel around Rohmoria situated 20 km the east of Dibrugarh.

Figure 6.
A sharp rise in the low-water level of the Brahmaputra River at Dibrugarh gauging station as a result of deposition of an enormous amount of sediment on its bed following the 1950 great earthquake.
Figure 6.
A sharp rise in the low-water level of the Brahmaputra River at Dibrugarh gauging station as a result of deposition of an enormous amount of sediment on its bed following the 1950 great earthquake.

Figure 7.
Superimposed graphs of variation of BI along the course of the Brahmaputra for the periods 1963–1975, 1996 and 2009.
Figure 7.
Superimposed graphs of variation of BI along the course of the Brahmaputra for the periods 1963–1975, 1996 and 2009.

Figure 8.
(a) The relationship between channel width and BI of different segments along the Brahmaputra River course of the 1963–1975 period. (b) The plot of changes in width and BI between 1963–1975 and 2009 at different segments along the Brahmaputra River course, and (c) scatter plot of the changes in channel width against BI between 1963–1975 and 2009.


Figure 9.
Scatter plots of channel width and BI for the years 1963–1975, 1996 and 2009.

Figure 10.
Hydrographs of the Brahmaputra at Bessamora in (a) 1979, (b) 1985.


Table 1.
Width of the Brahmaputra River along its course from Dhubri (90°00′–90°05′ E) to Kobo (95°15′–95°20′ E) in different times.
Table 1.
Width of the Brahmaputra River along its course from Dhubri (90°00′–90°05′ E) to Kobo (95°15′–95°20′ E) in different times.
| Location (East Longitude in Degrees and Minutes) | Channel Width in the Years (in m) | |||||
|---|---|---|---|---|---|---|
| 1912–1928 | 1963–1975 | 1996 | 2000 | 2007 | 2009 | |
| 90°00′–90°05′ | 10,234 | 11,833 | 6247 | 13,171 | 10,200 | 9912 |
| 90°05′–10′ | 12,115 | 12,640 | 6727 | 9656 | 10,415 | 9324 |
| 90°10′–15′ | 12,266 | 13,523 | 7406 | 8749 | 8897 | 10,080 |
| 19°15′–20′ | 3044 | 9295 | 9807 | 7379 | 10,088 | 8964 |
| 90°20′–25′ | 5097 | 11,327 | 11,728 | 9290 | 9101 | 12,271 |
| 90°25′–30′ | 4309 | 8003 | 7519 | 10,475 | 7773 | 6953 |
| 90°30′–35′ | 2159 | 2787 | 2324 | 7084 | 7026 | 2343 |
| 90°35′–40′ | 3524 | 6089 | 4609 | 2807 | 3000 | 7745 |
| 90°40′–45′ | 6357 | 10,240 | 12,020 | 4253 | 7486 | 15,718 |
| 90°45′–50′ | 5669 | 6533 | 11,084 | 14,760 | 13,367 | 14,937 |
| 90°50′–55′ | 8135 | 12263 | 12968 | 14,524 | 13,800 | 15,458 |
| 90°55′–91°00′ | 8720 | 8587 | 9142 | 14,675 | 15,789 | 12,040 |
| 91°00′–05′ | 6750 | 6810 | 8620 | 11273 | 12,315 | 10,414 |
| 91°05′–10′ | 4450 | 7367 | 7196 | 7019 | 10,342 | 8851 |
| 91°10′–15′ | 4938 | 11,594 | 11,388 | 8082 | 9000 | 16,367 |
| 91°15′–20′ | 8407 | 14,571 | 16,275 | 12,251 | 16,578 | 17,364 |
| 91°20′–25′ | 13,070 | 11,744 | 14,556 | 17,738 | 17,578 | 14,466 |
| 91°25′–30′ | 2923 | 4636 | 4692 | 14930 | 14,946 | 5544 |
| 91°30′–35′ | 2150 | 2211 | 2286 | 5615 | 5552 | 2745 |
| 91°35′–40′ | 1260 | 1230 | 1390 | 2937 | 2947 | 1267 |
| 91°40′–45′ | 1322 | 1374 | 1125 | 1319 | 1184 | 1417 |
| 91°45′–50′ | 2161 | 2420 | 2402 | 1541 | 1378 | 2739 |
| 91°50′–55′ | 6464 | 6847 | 2707 | 2549 | 2729 | 6808 |
| 91°55′–92°00′ | 12,896 | 9621 | 8625 | 2086 | 3036 | 9768 |
| 92°00′–05′ | 6505 | 9142 | 10,330 | 8678 | 6260 | 13,598 |
| 92°05′–10′ | 6090 | 7840 | 7590 | 11,575 | 10,404 | 10,682 |
| 92°10′–15′ | 9490 | 6680 | 6230 | 6565 | 7378 | 7592 |
| 92°15′–20′ | 7420 | 4880 | 8830 | 7282 | 4041 | 9993 |
| 92°20′–25′ | 2750 | 5050 | 6520 | 8900 | 10,276 | 7423 |
| 92°25′–30′ | 7206 | 10,568 | 5660 | 7562 | 7673 | 9040 |
| 92°30′–35′ | 6867 | 10,067 | 4136 | 6750 | 6320 | 12,459 |
| 92°35′–40′ | 10,180 | 9950 | 7215 | 7331 | 8525 | 9960 |
| 92°40′–45′ | 11,605 | 6188 | 7542 | 9082 | 8420 | 8258 |
| 92°45′–50′ | 3231 | 3913 | 4239 | 8188 | 7236 | 4299 |
| 92°50′–55′ | 5057 | 4681 | 2231 | 5331 | 3684 | 2724 |
| 92°55′–93°00′ | 1602 | 2888 | 1546 | 2464 | 3105 | 4183 |
| 93°00′–05′ | 4747 | 4973 | 6023 | 4801 | 3369 | 8094 |
| 93°05′–10′ | 3960 | 4990 | 3765 | 7779 | 7187 | 4171 |
| 93°10′–15′ | 3316 | 5798 | 7774 | 4861 | 3733 | 7844 |
| 93°15′–20′ | 3736 | 6009 | 6386 | 8092 | 7796 | 7123 |
| 93°20′–25′ | 2910 | 5430 | 5062 | 6929 | 6848 | 4689 |
| 93°25′–30′ | 6457 | 5147 | 5287 | 4473 | 4763 | 5463 |
| 93°30′–35′ | 6047 | 7688 | 9897 | 4202 | 5682 | 7267 |
| 93°35′–40′ | 6250 | 10,677 | 8625 | 5542 | 7164 | 11,220 |
| 93°40′–45′ | 6477 | 4222 | 8034 | 3765 | 6374 | 8587 |
| 93°45′–50′ | 7400 | 8196 | 12,366 | 6300 | 7233 | 11,808 |
| 93°50′–55′ | 4460 | 5860 | 10,260 | 9694 | 11,645 | 9688 |
| 93°55′–94°00′ | 4460 | 5860 | 10,260 | 8328 | 9405 | 9640 |
| 94°00′–05′ | 6230 | 10,060 | 9550 | 10,855 | 10,581 | 7971 |
| 94°05′–10′ | 6570 | 8488 | 8450 | 8378 | 8571 | 9793 |
| 94°10′–15′ | 4328 | 4898 | 5288 | 9979 | 9299 | 6215 |
| 94°15′–20′ | 3615 | 3781 | 4082 | 5830 | 6057 | 6546 |
| 94°20′–25′ | 6078 | 8908 | 9164 | 6511 | 6442 | 6099 |
| 94°25′–30′ | 3616 | 5691 | 7583 | 5876 | 5837 | 10,032 |
| 94°30′–35′ | 4117 | 7621 | 8917 | 7272 | 9401 | 9434.3 |
| 94°35′–40′ | 8469 | 9187 | 5913 | 9997 | 9841 | 9298 |
| 94°40′–45′ | 6843 | 8250 | 5518 | 8045 | 9308 | 7433 |
| 94°45′–50′ | 6175 | 8032 | 6363 | 7850 | 7347 | 8272 |
| 94°50′–55′ | 7695 | 9400 | 9317 | 7305 | 7819 | 9800 |
| 94°55′–95°00′ | 8241 | 11,690 | 13,621 | 9305 | 9643 | 13,605 |
| 95°00′–05′ | 7950 | 10,695 | 15,468 | 13,558 | 14,080 | 16,896 |
| 95°05′–10′ | 5713 | 9285 | 11,245 | 15,076 | 16,400 | 16,595 |
| 95°10′–15′ | 6288 | 6984 | 7896 | 11,793 | 13,504 | 7862 |
| 95°15′–95°20′ | 2137 | 3894 | 3260 | 8141 | 8556 | 11,634 |
| Mean | 5949 | 7455 | 7504 | 8008 | 8308 | 9012 |
Table 2.
Braiding index of the Brahmaputra River along its course from Dhubri (90°00′–90°05′ E) to Kobo (95°15′–95°20′ E) in different times.
Table 2.
Braiding index of the Brahmaputra River along its course from Dhubri (90°00′–90°05′ E) to Kobo (95°15′–95°20′ E) in different times.
| Location (East longitude in Degrees and Minutes) | Braiding Index in the Years | ||||
|---|---|---|---|---|---|
| 1963–1975 | 1996 | 2000 | 2007 | 2009 | |
| 90°00′–90°05′ | 17.33 | 5.83 | 5.79 | 8.28 | 7.64 |
| 90°05′–10′ | 14.55 | 9.61 | 6.33 | 6.66 | 8.12 |
| 90°10′–15′ | 11.34 | 11.6 | 4.89 | 4.42 | 4.22 |
| 19°15′–20′ | 13.09 | 11.26 | 7.45 | 5.40 | 5.88 |
| 90°20′–25′ | 9.82 | 9.48 | 8.83 | 9.46 | 8.35 |
| 90°25′–30′ | 8.3 | 12.55 | 7.63 | 8.24 | 9.3 |
| 90°30′–35′ | 5.95 | 5.16 | 2.66 | 2.10 | 3.04 |
| 90°35′–40′ | 7.08 | 7.39 | 2.68 | 4.52 | 4.32 |
| 90°40′–45′ | 7.9 | 10.71 | 5.43 | 8.80 | 7.22 |
| 90°45′–50′ | 8.24 | 13.55 | 17.65 | 10.16 | 6.76 |
| 90°50′–55′ | 10.24 | 14.36 | 6.71 | 7.44 | 9.22 |
| 90°55′–91°00′ | 9.94 | 13.44 | 5.99 | 8.00 | 7.34 |
| 91°00′–05′ | 8.6 | 8.56 | 6.09 | 5.76 | 7.48 |
| 91°05′–10′ | 9.65 | 7.79 | 6.48 | 6.04 | 8.78 |
| 91°10′–15′ | 9.29 | 17.22 | 12.45 | 13.04 | 14.92 |
| 91°15′–20′ | 11.37 | 14.28 | 12.62 | 13.36 | 15.4 |
| 91°20′–25′ | 14.85 | 17.22 | 12.69 | 10.56 | 13.62 |
| 91°25′–30′ | 4.69 | 7.1 | 6.89 | 5.60 | 5.52 |
| 91°30′–35′ | 3.69 | 4.4 | 3.06 | 2.26 | 3.52 |
| 91°35′–40′ | 3.17 | 3.54 | 2.28 | 2.60 | 3.72 |
| 91°40′–45′ | 1.21 | 0.18 | 0.38 | 1.02 | 0.7 |
| 91°45′–50′ | 3.24 | 2.73 | 2.46 | 3.14 | 5.8 |
| 91°50′–55′ | 6.9 | 3.49 | 5.54 | 3.02 | 7.56 |
| 91°55′–92°00′ | 5.91 | 2.3 | 3.26 | 3.74 | 7.54 |
| 92°00′–05′ | 9.68 | 9.6 | 9.73 | 10.18 | 10.44 |
| 92°05′–10′ | 11.37 | 11.04 | 4.17 | 7.48 | 9.8 |
| 92°10′–15′ | 9.61 | 7.22 | 6.18 | 7.90 | 8.62 |
| 92°15′–20′ | 5.46 | 5.66 | 5.67 | 5.90 | 6.92 |
| 92°20′–25′ | 6.04 | 12.54 | 5.47 | 6.66 | 9.52 |
| 92°25′–30′ | 9.14 | 9.81 | 4.33 | 7.08 | 8.7 |
| 92°30′–35′ | 12.32 | 5.97 | 4.89 | 6.34 | 9.02 |
| 92°35′–40′ | 16.43 | 6.64 | 6.26 | 8.06 | 7.08 |
| 92°40′–45′ | 9.94 | 5.74 | 6.30 | 7.76 | 7.8 |
| 92°45′–50′ | 9.29 | 5.17 | 5.23 | 3.7 | 5.2 |
| 92°50′–55′ | 4.81 | 3.38 | 2.37 | 2.44 | 2.1 |
| 92°55′–93°00′ | 3.54 | 1.24 | 1.16 | 1.54 | 1.8 |
| 93°00′–05′ | 3.85 | 5.83 | 4.70 | 5.52 | 7.22 |
| 93°05′–10′ | 8.1 | 7.77 | 6.29 | 3.42 | 7.1 |
| 93°10′–15′ | 5.51 | 9.5 | 8.34 | 6.92 | 6.52 |
| 93°15′–20′ | 8.42 | 6.71 | 4.73 | 7.66 | 6.66 |
| 93°20′–25′ | 7.74 | 6.19 | 6.00 | 6.00 | 6.24 |
| 93°25′–30′ | 7.01 | 7.66 | 2.98 | 1.62 | 2.58 |
| 93°30′–35′ | 10.96 | 9.04 | 7.06 | 5.14 | 7.16 |
| 93°35′–40′ | 7.56 | 12.49 | 7.77 | 8.18 | 9.82 |
| 93°40′–45′ | 6.73 | 8.13 | 6.82 | 6.80 | 5.76 |
| 93°45′–50′ | 11.77 | 7.09 | 10.72 | 8.32 | 10.14 |
| 93°50′–55′ | 9.18 | 7.33 | 5.62 | 4.78 | 6.46 |
| 93°55′–94°00′ | 12.73 | 9.27 | 7.14 | 7.34 | 8.88 |
| 94°00′–05′ | 7.87 | 6.37 | 6.32 | 7.38 | 7.32 |
| 94°05′–10′ | 4.8 | 7.45 | 8.07 | 7.22 | 8.2 |
| 94°10′–15′ | 6.28 | 4.52 | 4.85 | 5.74 | 6.68 |
| 94°15′–20′ | 8.39 | 7.55 | 3.10 | 3.40 | 5.1 |
| 94°20′–25′ | 7.1 | 9.52 | 5.22 | 4.94 | 6.12 |
| 94°25′–30′ | 7.92 | 5.88 | 6.31 | 4.38 | 4.8 |
| 94°30′–35′ | 13.88 | 11.71 | 6.17 | 5.74 | 6.86 |
| 94°35′–40′ | 9.08 | 7.58 | 11.01 | 7.5 | 8.48 |
| 94°40′–45′ | 13.42 | 7.47 | 6.12 | 8.38 | 7.56 |
| 94°45′–50′ | 10.21 | 11.42 | 7.09 | 7.76 | 7.38 |
| 94°50′–55′ | 10.12 | 14.68 | 8.14 | 9.78 | 10.06 |
| 94°55′–95°00′ | 10.98 | 9.92 | 12.46 | 11.84 | 11.66 |
| 95°00′–05′ | 11.92 | 12.8 | 16.25 | 16.46 | 16.66 |
| 95°05′–10′ | 7.13 | 14.73 | 16.06 | 11.70 | 19.48 |
| 95°10′–15′ | 4.68 | 5.67 | 7.16 | 8.32 | 9.88 |
| 95°15′–95°20′ | 2.82 | 7.24 | 6.58 | 8.60 | 9.24 |
| Mean | 8.59 | 8.43 | 6.67 | 6.58 | 7.7 |
Table 3.
Changes in the braiding index and channel width of the Brahmaputra River along its course from Dhubri (90°00′–90°05′ E) to Kobo ( 95°15′–95°20′ E) between 1963–1975 and 2009 (positive values indicates an increase and negative values an decrease in width and BI in 2009 as compared to 1963–1975).
| Location (East Longitude in Degrees and Minutes) | Change in Channel Width in m | Change in Braiding Index |
|---|---|---|
| 90°00′–90°05′ | 1921 | 9.69 |
| 90°05′–10′ | 3316 | 6.43 |
| 90°10′–15′ | 3443 | 7.12 |
| 19°15′–20′ | 331 | 7.21 |
| 90°20′–25′ | −944 | 1.47 |
| 90°25′–30′ | 1050 | −1.00 |
| 90°30′–35′ | 444 | 2.91 |
| 90°35′–40′ | −1656 | 2.76 |
| 90°40′–45′ | −5478 | 0.68 |
| 90°45′–50′ | −8404 | 1.48 |
| 90°50′–55′ | −3195 | 1.02 |
| 90°55′–91°00′ | −3453 | 2.60 |
| 91°00′–05′ | −3604 | 1.12 |
| 91°05′–10′ | −1484 | 0.87 |
| 91°10′–15′ | −4773 | –5.63 |
| 91°15′–20′ | −2793 | −4.03 |
| 91°20′–25′ | −2722 | 1.23 |
| 91°25′–30′ | −908 | −0.83 |
| 91°30′–35′ | −534 | 0.17 |
| 91°35′–40′ | −37 | −0.55 |
| 91°40′–45′ | −43 | 0.51 |
| 91°45′–50′ | −319 | −2.56 |
| 91°50′–55′ | 39 | −0.66 |
| 91°55′–92°00′ | −147 | −1.63 |
| 92°00′–05′ | −4456 | −0.76 |
| 92°05′–10′ | −2842 | 1.57 |
| 92°10′–15′ | −912 | 0.99 |
| 92°15′–20′ | −5113 | −1.46 |
| 92°20′–25′ | −2373 | −3.48 |
| 92°25′–30′ | 1528 | 0.44 |
| 92°30′–35′ | −2392 | 3.30 |
| 92°35′–40′ | −10 | 9.35 |
| 92°40′–45′ | −2070 | 2.14 |
| 92°45′–50′ | −386 | 4.09 |
| 92°50′–55′ | 1957 | 2.71 |
| 92°55′–93°00′ | −1295 | 1.74 |
| 93°00′–05′ | −3121 | −3.37 |
| 93°05′–10′ | 819 | 1.00 |
| 93°10′–15′ | −2046 | −1.01 |
| 93°15′–20′ | −1114 | 1.76 |
| 93°20′–25′ | 741 | 1.50 |
| 93°25′–30′ | −316 | 4.43 |
| 93°30′–35′ | 421 | 3.80 |
| 93°35′–40′ | −543 | −2.26 |
| 93°40′–45′ | −4365 | 0.97 |
| 93°45′–50′ | −3612 | 1.63 |
| 93°50′–55′ | −3828 | 2.72 |
| 93°55′–94°00′ | −3780 | 3.85 |
| 94°00′–05′ | 2089 | 0.55 |
| 94°05′–10′ | −1305 | −3.40 |
| 94°10′–15′ | −1317 | −0.40 |
| 94°15′–20′ | −2765 | 3.29 |
| 94°20′–25′ | 2809 | 0.98 |
| 94°25′–30′ | −4341 | 3.12 |
| 94°30′–35′ | −1813.3 | 7.02 |
| 94°35′–40′ | −111 | 0.60 |
| 94°40′–45′ | 817 | 5.86 |
| 94°45′–50′ | −240 | 2.83 |
| 94°50′–55′ | −400 | 0.06 |
| 94°55′–95°00′ | −1915 | −0.68 |
| 95°00′–05′ | −6201 | −4.74 |
| 95°05′–10′ | −7310 | −12.35 |
| 95°10′–15′ | −878 | −5.20 |
| 95°15′–95°20′ | −7740 | −6.42 |
| Mean | −1557 | 0.89 |
© 2018 by the authors. Licensee MDPI, Basel, Switzerland. This article is an open access article distributed under the terms and conditions of the Creative Commons Attribution (CC BY) license (http://creativecommons.org/licenses/by/4.0/).
Share and Cite
MDPI and ACS Style
Sarma, J.N.; Acharjee, S. A Study on Variation in Channel Width and Braiding Intensity of the Brahmaputra River in Assam, India. Geosciences 2018, 8, 343. https://doi.org/10.3390/geosciences8090343
AMA Style
Sarma JN, Acharjee S. A Study on Variation in Channel Width and Braiding Intensity of the Brahmaputra River in Assam, India. Geosciences. 2018; 8(9):343. https://doi.org/10.3390/geosciences8090343
Chicago/Turabian StyleSarma, Jogendra Nath, and Shukla Acharjee. 2018. "A Study on Variation in Channel Width and Braiding Intensity of the Brahmaputra River in Assam, India" Geosciences 8, no. 9: 343. https://doi.org/10.3390/geosciences8090343
Note that from the first issue of 2016, this journal uses article numbers instead of page numbers. See further details here.