Landslide Disasters Triggered by Extreme Rainfall Events: The Case of Montescaglioso (Basilicata, Southern Italy)


1
IBAM (Institute for Monumental and Archaelogical Heritage), CNR (Consiglio Nazionale delle Ricerche), C/da S. Loja-Zona Industriale, 85050 Tito Scalo (PZ), Italy
2
MIUR (Ministero dell’Istruzione, dell’Università e della Ricerca), 70121 Bari, Italy
*
Author to whom correspondence should be addressed.
Geosciences 2018, 8(10), 377; https://doi.org/10.3390/geosciences8100377
Submission received: 11 August 2018
/
Revised: 23 September 2018
/
Accepted: 9 October 2018
/
Published: 15 October 2018
(This article belongs to the Special Issue Quantitative Geomorphology)
Abstract
:We present the results of the study of a large and rapid landslide disaster event, which occurred in Montescaglioso, southern Italy, on 3 December 2013. The studied landslide developed following extreme rainfalls in a zone characterized by a stabilized paleo-landslide body and anthropized in time, filling some streams of the original hydrographic network. The morpho-topographic setting characterizing the slope before the new landslide, has showed, in fact, a substantial stability confirmed also by the application of SINMAP (Stability Index MAPping) analysis. Nevertheless, heavy rains and floods caused a powerful and spectacular landslide event because of the anthropic removal of the old drainage network, which has caused the heaviness of the slope located upstream of the 20 collapsed buildings and along the ill-drained quick-road, built transversely to the slope.
1. Introduction
The Basilicata region (southern Italy) has the highest density of landslides, with more than 27 landslide areas every 100 km2 [1,2,3]. This high landslide density is related to predisposing conditions, such as prevailing clay materials as well as the morphological setting of the slopes, and to conditions such as extreme rainfall events [4,5] or human activity, such as cave excavation [6], deforestation [7] and intense urbanization and industrialization. Many landslide events have been historically triggered by extreme rainfall or snowmelt occurrences [8,9]. Landslides are typical features of this landscape in this region and affect about 90% of its towns. Over recent decades, large and frequent landslides have affected urbanized areas of Basilicata causing severe and extensive damage to structures and infrastructures. In particular, the south-eastern portion of the region was affected from October 2013 to March 2014 by several landslides, due to extreme precipitation events, of which the most important occurred on 3 December 2013 in Montescaglioso, a hilltop town located in the south-eastern part of the Basilicata close to Matera town. The landslide caused powerful and spectacular geomorphological effects and widespread damage, including collapses of resident buildings and of a supermarket, but fortunately, no fatalities.
A few weeks are the new landslide occurrence, Manconi et al. [10] and in the following years Raspini et al. [11] and Carlà et al. [12] published a report about the event, providing a rapid mapping of the landslide by using low resolution aerial photographs obtained from the online catalogue of the Istituto Geografico Militare Italiano and by using high spatio-temporal resolution Synthetic Aperture Radar (SAR) images captured by the COSMO-SkyMed (Constellation of small Satellites for the Mediterranean basin Observation) satellites. They used a multi-interferogram SqueeSAR analysis applied to SAR images acquired by the COSMO-SkyMed (CSK) sensors before and after the landslide the event, to obtain a synoptic view of pre-existing surface deformation phenomena. However, their work not has considered a hydrological model calibrated on the Montescaglioso rainfall station, but on Matera and Ginosa stations, distant several kilometres from the site, as well as the calculation of triggering thresholds of the historical and recent landslides. Therefore, in this paper we illustrate new data from a detailed field survey, multitemporal aerial photo interpretation and UAV (Unmanned aerial vehicle) survey, discussing the landslide susceptibility map and the calculated triggering-rainfall threshold.
2. Geological and Geomorphological Setting and Landslide Event of 3 December 2013
The Montescaglioso little town is located at the top of a hill bounded by steep slopes (Figure 1), showing widespread development of landslides of different typologies. The area is also known in literature to have been affected by the Madonna La Nova landslide system [13], which is located not far from the landslide area studied in this paper (Figure 1), analyzed using remote-sensing techniques to detect changes that might lead to failure.
In particular, the slope affected by the new landslide is characterized by several morphologies related to ancient gravitational movements, as also reported in the official geological map [14], produced during the 1960s, when extensive landslide bodies were mapped.
The geological context is characterized by sediments of the “Bradanic Trough”, lower-middle Pleistocene in age [15,16,17], represented by a regression sequence (coarsening upward) of clay (at the bottom), sand, and conglomerates (at the top). Along the slope, where the recent Montescaglioso landslide occurred, the fluvial conglomerates terraced deposits are also present. These deposits are characterized by large boulders (max size about 5 m × 3 m), displaced at different elevations on the slope, but that cannot be individually mapped to a regional scale. We cannot rule out that this displacement and the irregular distribution of the materials along the slope are also due to old and very old landslides that occurred in the past.
The landslide was triggered at 13:00 in the area known as “Le Cinque Bocche”, a place name referring to the water springs historically located in this sector, due to the outcropping of the water table (piezometric surface). The movement immediately involved the main road named “Piani Bradano” and progressively moved south-east, affecting the area along the right bank of the Capo Iazzo creek. Afterward, in a second phase, the movements affected the north-western part of the slope. The landslide can be categorized in the “rapid” class (1.8 m/h ≤ vel < 3 m/min): in fact, most of the movement occurred within a period of 20 minutes, resulting in a maximum displacement of more than 15 m, corresponding to a velocity of 0.75 m/min. The landslide area extends from an elevation of 250 m a.s.l. at the crown area to 130 m a.s.l. at the toe.
The multitemporal analysis of aerial photographs (1955, 1974, 2008, 2011, 2013) has highlighted how, over time, the hydrographical network and geomorphological characteristics of the slope, where the new landslide took place, has been substantially modified. Figure 2 clearly shows how from 1955 to 2011, some channels (filled to allow the construction of new commercial buildings, industrial and residential) are missing and trenches were made to allow for the quick construction of a road between the valley of the Bradano river and the town of Montescaglioso (Figure 2).
In addition, the multitemporal analysis has also highlighted how, over time, there has been a considerable urban sprawl of the urban area of Montescaglioso (Figure 3). This last factor has produced a considerable increase in vulnerability of the area and the consequent risk assessed by the basin regional authority of Basilicata. However, comparing the landslide areas mapped by the basin regional authority with the landslide surveyed in the geological map of Italy (sheet 201 “Matera”) in 1968 (at the scale of 1:100,000) and the current perimeter of the landslide (see Figure 3), it can be observed that the new landslide is only partially included in the perimeter of 1968 and that it does not correspond to the risk areas provided by the basin regional authority.
A field survey permitted mapping and georeferencing the landslide features and perimeter, which is equal to 3.073 m, affecting a total surface of 398.072 m2 (Figure 2, Figure 3 and Figure 4), calculated by GIS (Geographic Information System) platform. The length of the landslide deposits, measured along its main axis, is 1.200 m, and the width varies from 350 m in the front detachment of the landslide, up to 880 m in the lower part of the valley floor.
The slope failure damaged the freeway connecting the town of Montescaglioso to the SP175 provincial road, disrupting more than 720 m of the road. The failure also involved a number of warehouses, destroyed a supermarket, artisan activities and private homes located on the right bank of a channel in the area of “Cinque Bocche” (Figure 3 and Figure 4). For security reasons, 10 houses were evacuated after the landslide.
3. Material and Methods
To define the perimeter, the geomorphological characteristics and ground deformation of the landslides and the assessment of the damage suffered by structures, a detailed field survey (GPS survey, geomorphological analysis and field analysis), integrated by UAV images, and multitemporal aerial photo-interpretation have been carried out.
The UAV images have been acquired by an octorotor microdrone platform, equipped with a high-resolution reflex photocamera, immediately after the landslide occurrence, from safety conditions. The reflex camera was located on a movable mechanical arm, which could be rotated during the flight in order to acquire zenital or perspective pictures. The UAV was controlled by a radio with a telemetry system, which transferred, in real time, the flight information (battery level, geolocation, flight time, velocity and distance from the start point) to the base station. A user-friendly navigation software allowed us to define the automatic plan flight (point of acquisition, altitude and timing of flight) through the simple delimitation of the area to be surveyed.
Elaboration of the image acquired by UAV was performed through the use of a commercial software package able to perform the orientation and alignment of the images, extraction of ortophotos and generation of DTM (Digital Terrain Model) and DEM (Digital Elevation Model) models. The comparison between UAV images and historical photos and maps permitted us to acquire key data to extract rates of slope processes and landscape transformation.
3.1. Landslide Susceptibility Model
To calculate landslide susceptibility of the area before the landslide events of the second half of 2013, we have applied the Stability Index Mapping approach (SINMAP, [18]).
SINMAP (Stability Index MAPping) is a mapping tool that uses an infinite slope model and also completes other existing methods [19]. It derives a terrain stability classification based on certain basin characteristics, such as topographic slope, material properties and climate. Each of these variables is numerically identified within the study area. Topographic parameters are automatically obtained from a digital terrain model. The primary output of this model approach is a stability index (SI), which is a numerical value used to classify terrain in each grid cell of the study area. This value is defined as the probability of estimating the standard distribution of parameters, expressed as a value between 0 (most unstable) and 1 (stable). When the more conservative set of parameters of the model coincides with a situation of stability (i.e., the set with the most unfavorable combination of parameters for stability), then the stability index is defined as the safety factor.
The infinite slope stability model factor of safety, expressed by the ratio of stabilizing forces (shear strength) to destabilizing forces (shear stress) on a failure plane parallel to the ground surface, is given by:
where Cr is the root cohesion (N·m−2), Cs is the soil cohesion (N m−2), θ is the slope angle, ρs is the wet soil density (kg m−3), ρw is the density of water (kg m−3), g is the gravitational acceleration (9.81 m s−2), D is the vertical soil depth (m), Dw is the vertical height of the water table within the soil layer (m) and Φ is the internal friction angle of the soil (°).
Following TOPMODEL, the TOPography based hydrological MODEL proposed by Beven and Kirkby [20], SINMAP makes the following assumptions:
- Shallow lateral subsurface flow follows topographic gradients with the area contributing to flow at any point that is given by the specific catchment area (a) defined from the surface topography.
- The lateral discharge q at each point is in equilibrium with a steady-state recharge R (m h−1).
- The capacity for lateral flux at each point is T sinθ, where T is the soil transmissivity (m2 h−1), i.e., hydraulic conductivity (m h−1) times soil thickness, h (m).
The assumptions 1 and 2 together imply lateral discharge q, depth integrated per unit contour length (m2 h−1), is q = R a (m2 h−1). Based on assumption 3, the relative wetness, which defines the relative depth of the perched water table within the soil layer, is given by:
The relative wetness has an upper bound of 1, with any excess assumed to form overland flow. The ratio R/T in Equation (2) quantifies the relative wetness in terms of the assumed steady-state recharge relative to the soil’s capacity for the lateral drainage of water and combines both climate and hydrogeological factors. The quantity (T/R) sinθ (m) may be considered as the length of hillslope (planar, not convergent) required to develop saturation in the critical wet period being considered.
To define the stability index, the wetness index from Equation (2) is incorporated into the dimensionless factor of safety, Equation (3), which becomes:
The variables a and θ are derived from the Digital Elevation Model topography, whereas the values of C, tan Φ, r and R/T are input by the user. The cohesion is formerly retained in the infinite slope stability model. A dimensionless cohesion factor C is established, combining cohesion due to soil and root properties and soil density and thickness.
SINMAP differentiates between six different classes of SI (Table 1). Terms such as “stable”, “moderately stable”, quasi stable” are used to classify the study area according to the success of the model within determined parameter ranges. SI is also considered as a safety criterion providing the magnitude of factors (regional loads, road drainage and increased moisture due to the effects of pore pressure) that cause instability in the area [18]. The terms “lower threshold” and “upper threshold” are used to characterize the regions with 50% lower or higher probability of instability according to parameter ranges determined by the model. In these regions, instability can occur in the absence of external factors, due to interactions between the parameters even within limits where uncertainty and variability can be determined [20]. The term “defended slope” is used to characterize regions where, according to the types of parameters defined in the model, the slope is variable; and the model is inappropriate for cases of bedrock outcrops [21].
A digital elevation model (DEM) of 1954 with a grid size of 20 m × 20 m provided the topographic basis. For the parameters calibration the study area was divided into three regions characterized by homogeneous in situ conditions and soil geotechnical properties and corresponding to the lithostratigraphic units (Table 2).
Data relative to cohesion and internal friction angle limits of alluvial deposits, conglomerates and clays, was acquired from literature [22,23,24,25,26], whereas for the R/T parameter the default values were used (Table 2). These geotechnical parameters are compatible with those obtained in the laboratory on thirteen undisturbed samples taken in drilling boreholes carried out by ISPRA (Istituto Superiore per la Protezione e la Ricerca Ambientale) in the months following the landslide event.
3.2. Climatic Analysis
The general consensus is that the principal climatic agent on erosive and landslide processes is precipitation, since it is the major determinant cause of the vegetation cover and of overland flow [27,28]. In particular, the erosive power depends on precipitation regimes, expressed as total annual precipitation.
Daily rainfall data from 1984 to 2013 of Montescaglioso area were obtained from the weather station of Montescaglioso (Lat. 40.480373; Long. 16.720097; Locality Cozzo del Presepe, see Figure 1) belonging to the Lucano Agrometereological Service (ALSIA; http://www.alsia.it/opencms/opencms/Servizio/SAL/rete.html).
To evaluate changes in the precipitation patterns and extremes during the whole period, some indices recommended by the World Meteorological Organization were used. Total annual precipitation (TP) and the mean amount of precipitation per wet day (precipitation intensity, hereinafter PI) were calculated to describe the general rainfall conditions.
To detect possible trends in daily precipitation extremes we used the approach by Piccarreta et al. [29] by calculating the threshold of 95th (very wet days) and 99th (extreme) percentile and examined the fraction of total precipitation from events > long-term 95th and 99th percentile (fraction of total from heavy events, PFL95 and PFL99) and the number of events > long-term 95th and 99th percentile (number of heavy events, PNL95 and PNL99). These indices account for short-term heavy precipitation, possibly of a convective nature, which may have triggered a slope failure.
Moreover, we also examined the greatest 3-day total precipitation (P3M) and the greatest 5-day total precipitation (P5M) which represent extended heavy rainfall periods, related to synoptic disturbances or persistent flow conditions. The multi-day rainfall amounts are particularly important because larger-scale impacts from heavy precipitation are mostly due to multi-day episodes, and 5-day amounts are frequently considered measures of the occurrence of floods and landslides in Regional Climate Model studies [30].
4. Results
4.1. Landslide Susceptibility Map
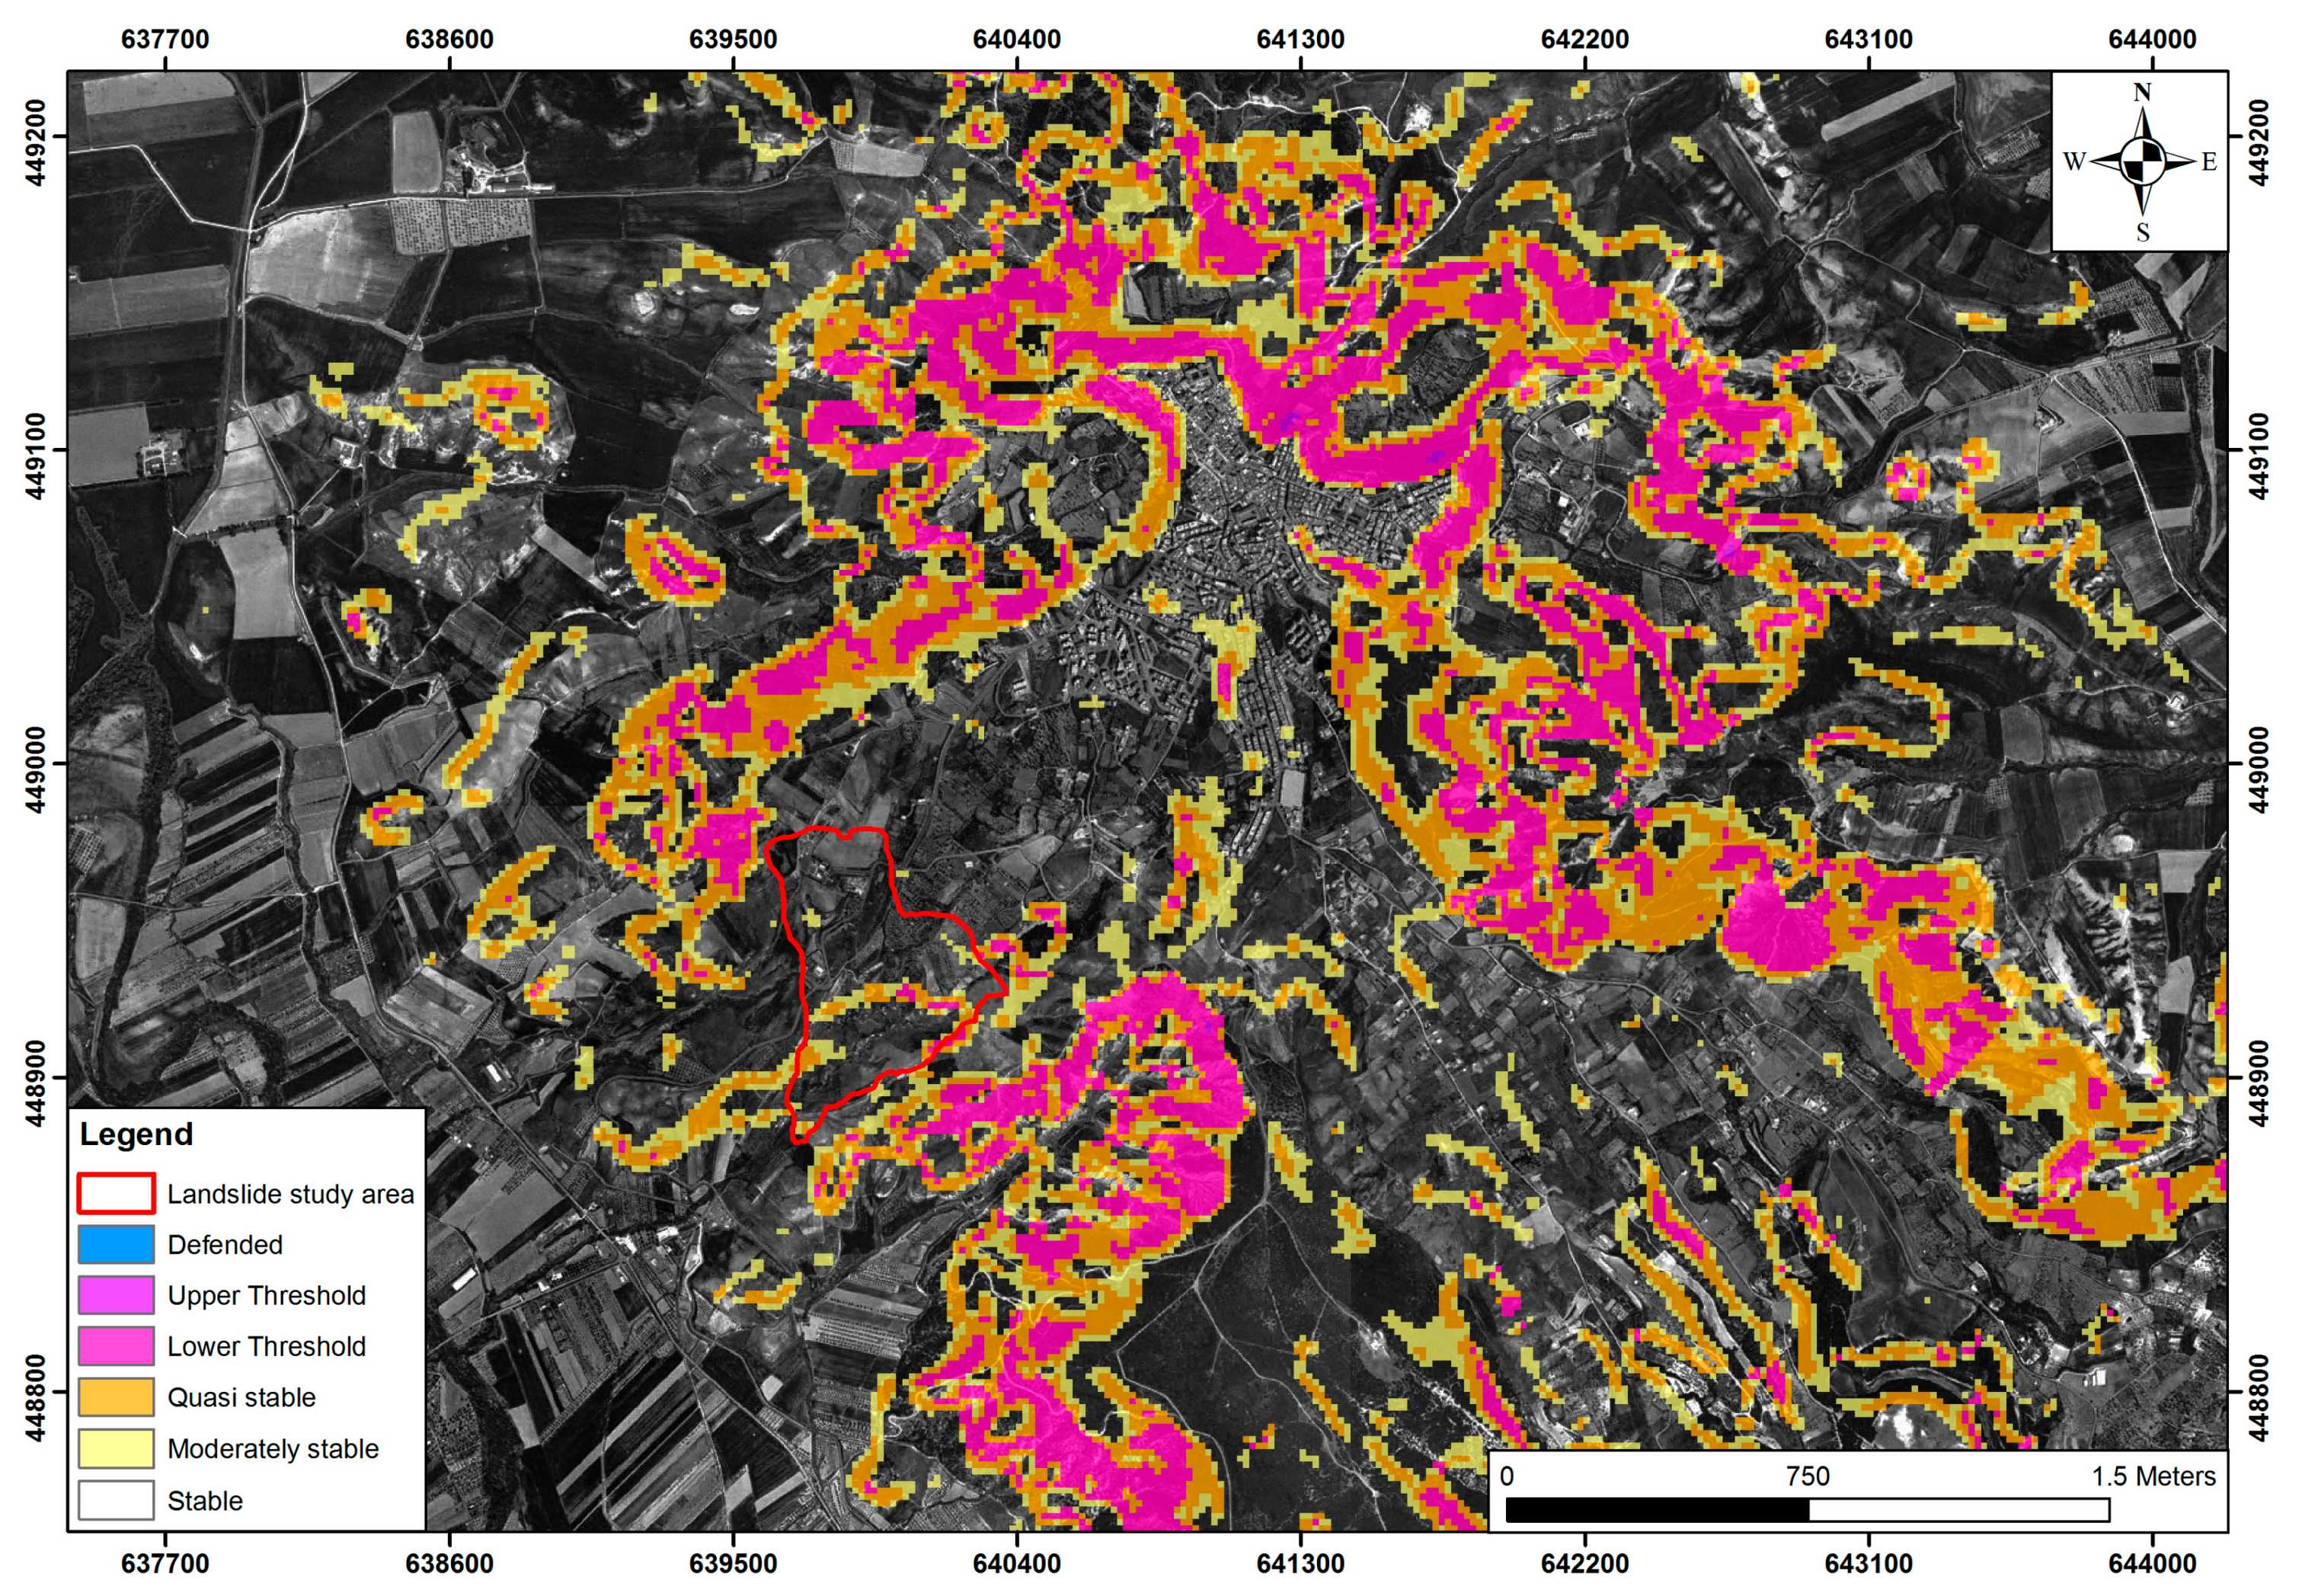
The application of the SINMAP method permitted us to obtain a landslide vulnerability map of the conditions prior to the event of 3 December 2018.
The results are reported on Figure 5 and show that the area affected by the recent movement has been classified from moderately stable to stable, although much of the landslide-area has been classified as stable. This result is in agreement with the official landslide risk map of PAI (Piano Assetto Idrogeologico, Plan of Hydrogeologic Setting) and the landslide hazard map for the 2013 year (1:10,000 scale), realized on behalf of the Basilicata regional authority. However, according to Zizioli et al. [31] and Michel et al. [32], who compared SINMAP with other landslide susceptibility model, the method classification over the basin results in an overestimation of stability areas.
4.2. Rainfall Patterns and Landslides Triggering in Montescaglioso
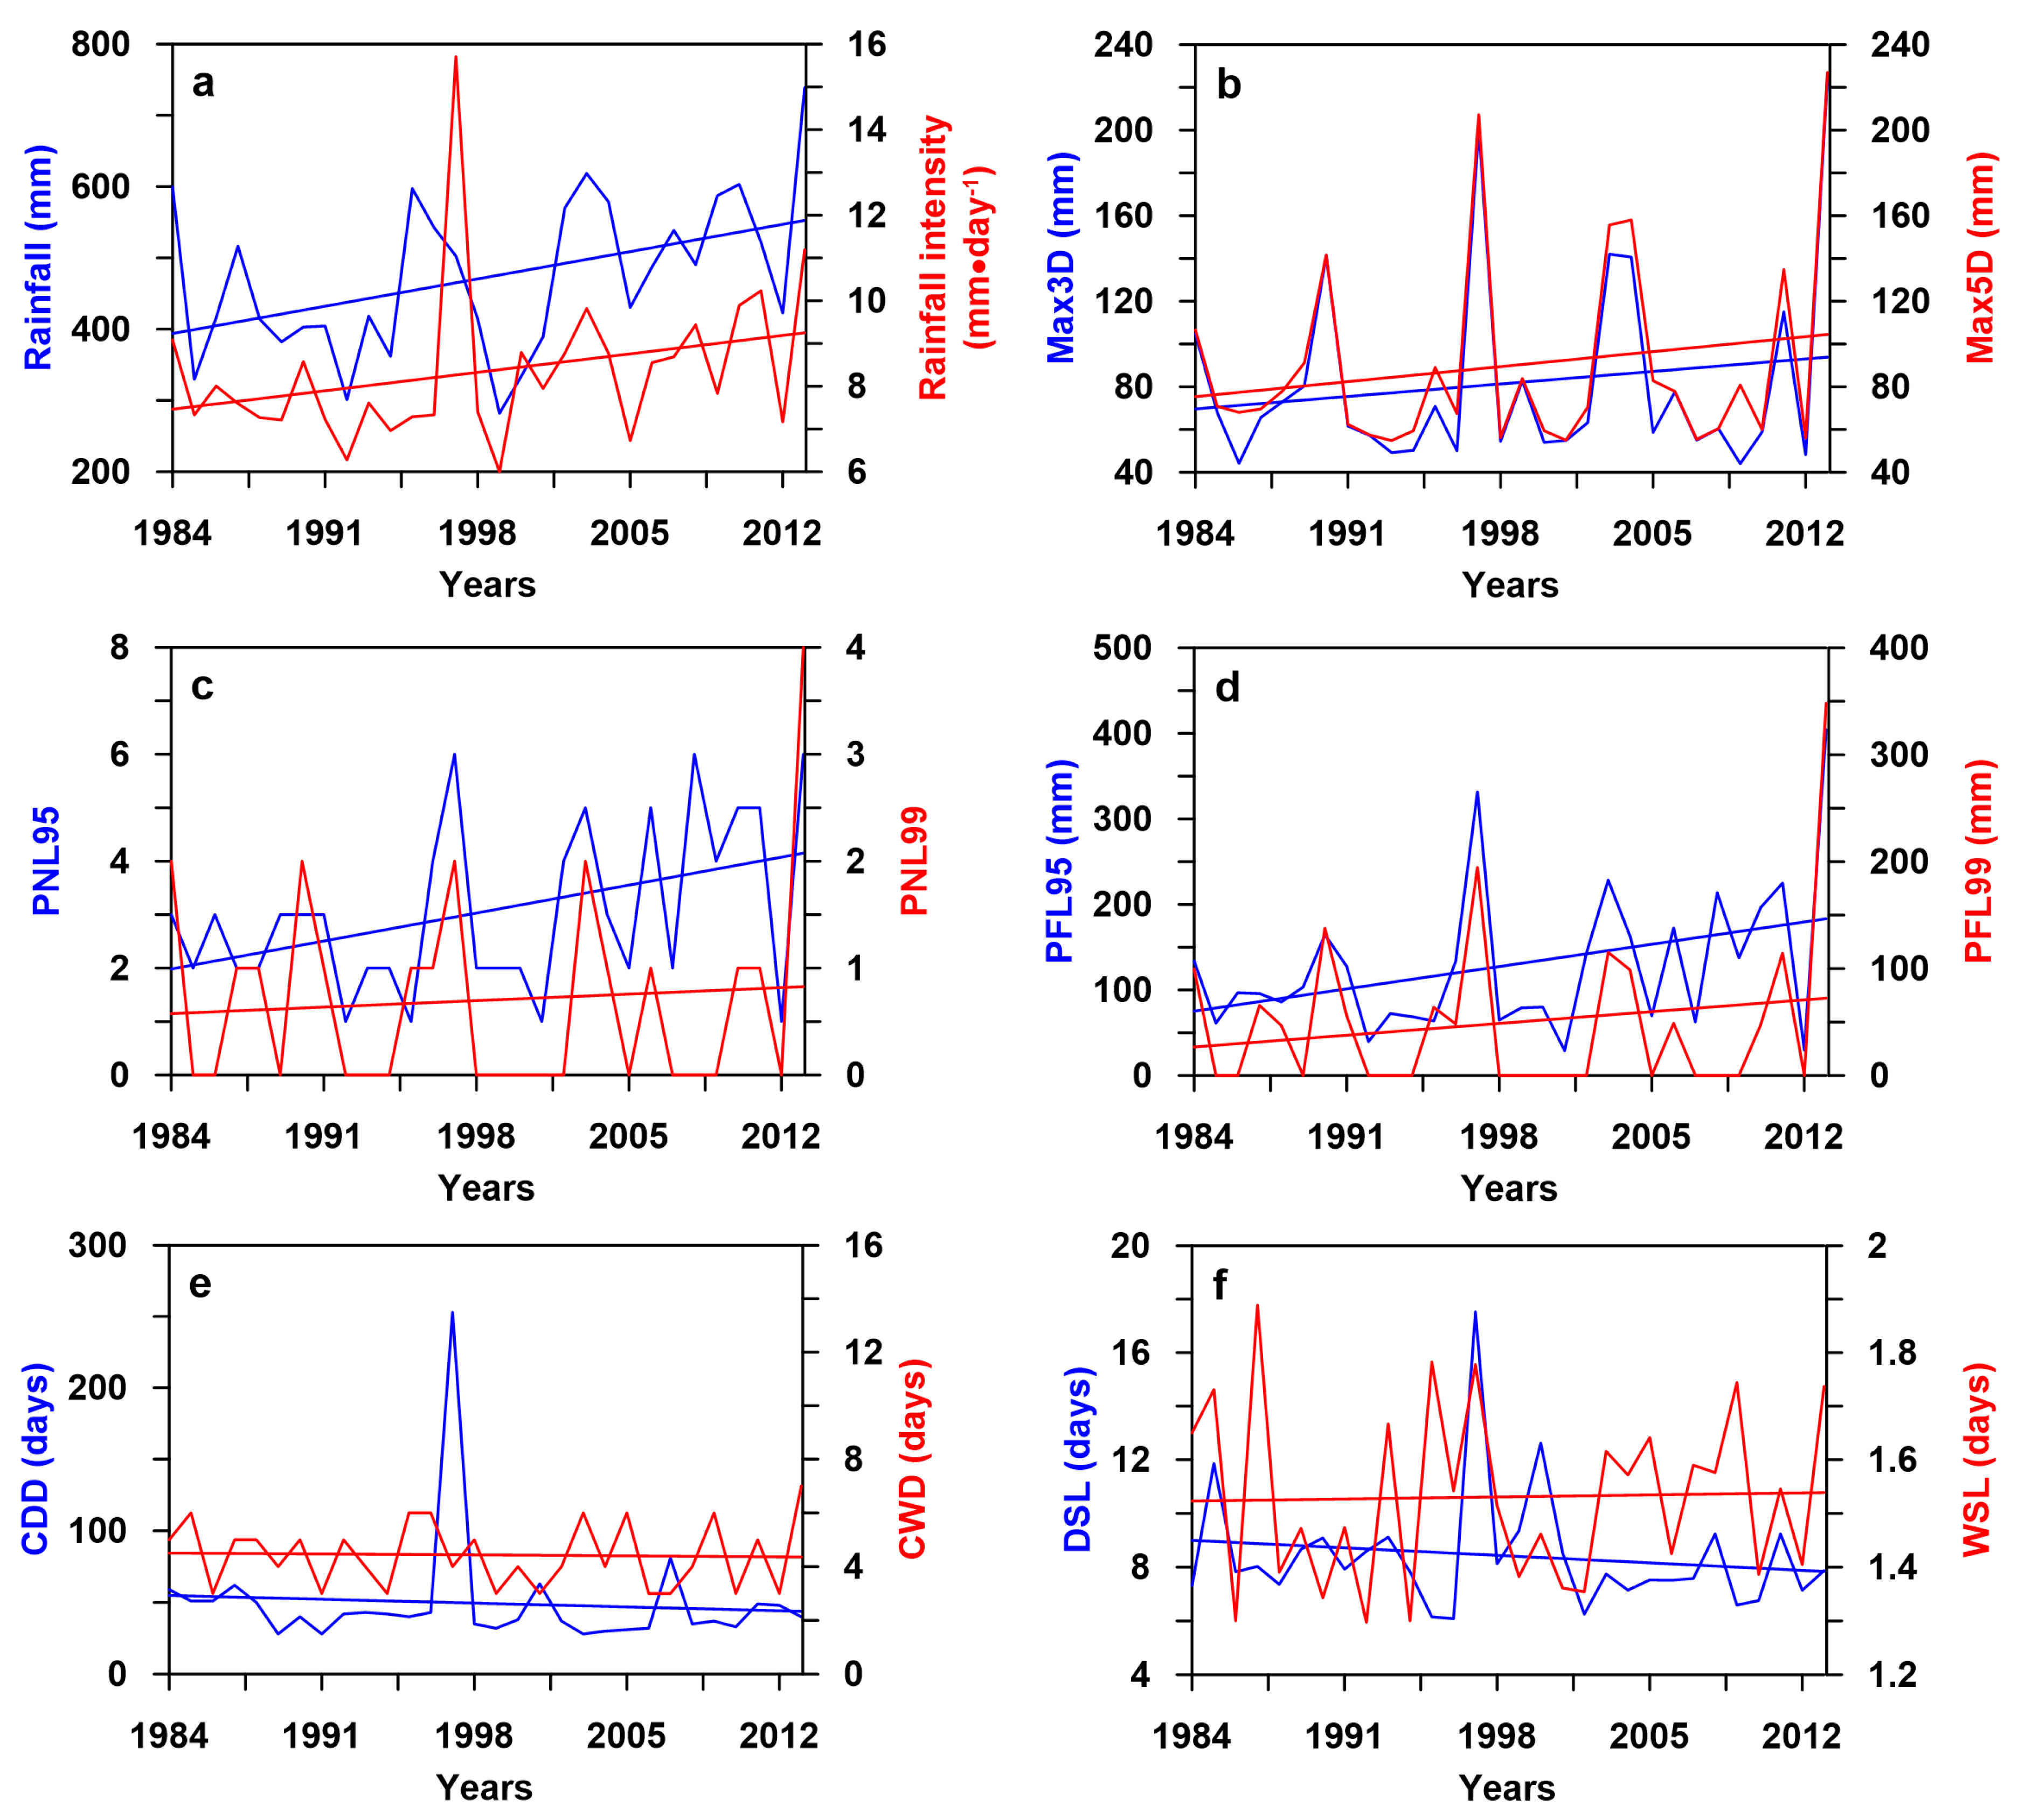
The annual precipitation for the studied period varies from 282 to 713 mm, with an average value of 472 mm with the highest monthly value typically occurring in November (187 mm). From 1984 to 2013 both total annual rainfalls and precipitation intensity have increased (Figure 6a). Similar behaviour is also recognised for the maximum quantity of precipitation in both three and five consecutive days (Max3d and Max5d) (Figure 6b).
To verify the extreme events trend, the 95th and the 99th percentile of the daily precipitation have been calculated. Results are that the 95th percentile evaluated for the whole year corresponds to 26.0 mm and the 99th percentile evaluated for the whole year to 45.4 mm. Consequently, the number of days (PNL95, PNL99) and the fractions of annual total precipitation due to events exceeding the 95th percentile (PFL95) and the 99th percentile (PFL99) have been determined.
The trend of these indices (Figure 6c,d) points out that the number and the fractions of the precipitation for the very wet days and the extreme events increase clearly during the period of observation.
The mean dry spell lengths (DSM) and the maximum number of consecutive dry days (CDD) decrease constantly during the investigated period (Figure 6e,f), whereas both the maximum number of consecutive wet days (CWD) and the mean wet spell lengths (WSM) show a weak positive trend. This last information reflects a progressive enlargement of the wet horizon with respect to a moderate decrease in the dry period length.
This analysis is useful to understand the relationships between the landslides and rainfall extreme event that occurred in the study area, where the landslide was triggered, considering two main conditions:
- Storm rainfall–rainfall intensity >13 mm/hr, continuously sustained for a duration of at least several hours. Starting from 1 January 2009 to 31 December 2013, five well-recognized landslide episodes occurred in the Montescaglioso area, the largest of which occurred on 3 December 2013. The intensity/duration thresholds for landslides that have occurred in the Bradanic Foredeep have been definined by Lazzari et al. [33].
- Antecedent moisture before an intense storm can produce the positive pore pressures that trigger debris flows; the hillslope materials must already contain a certain amount of moisture [34].
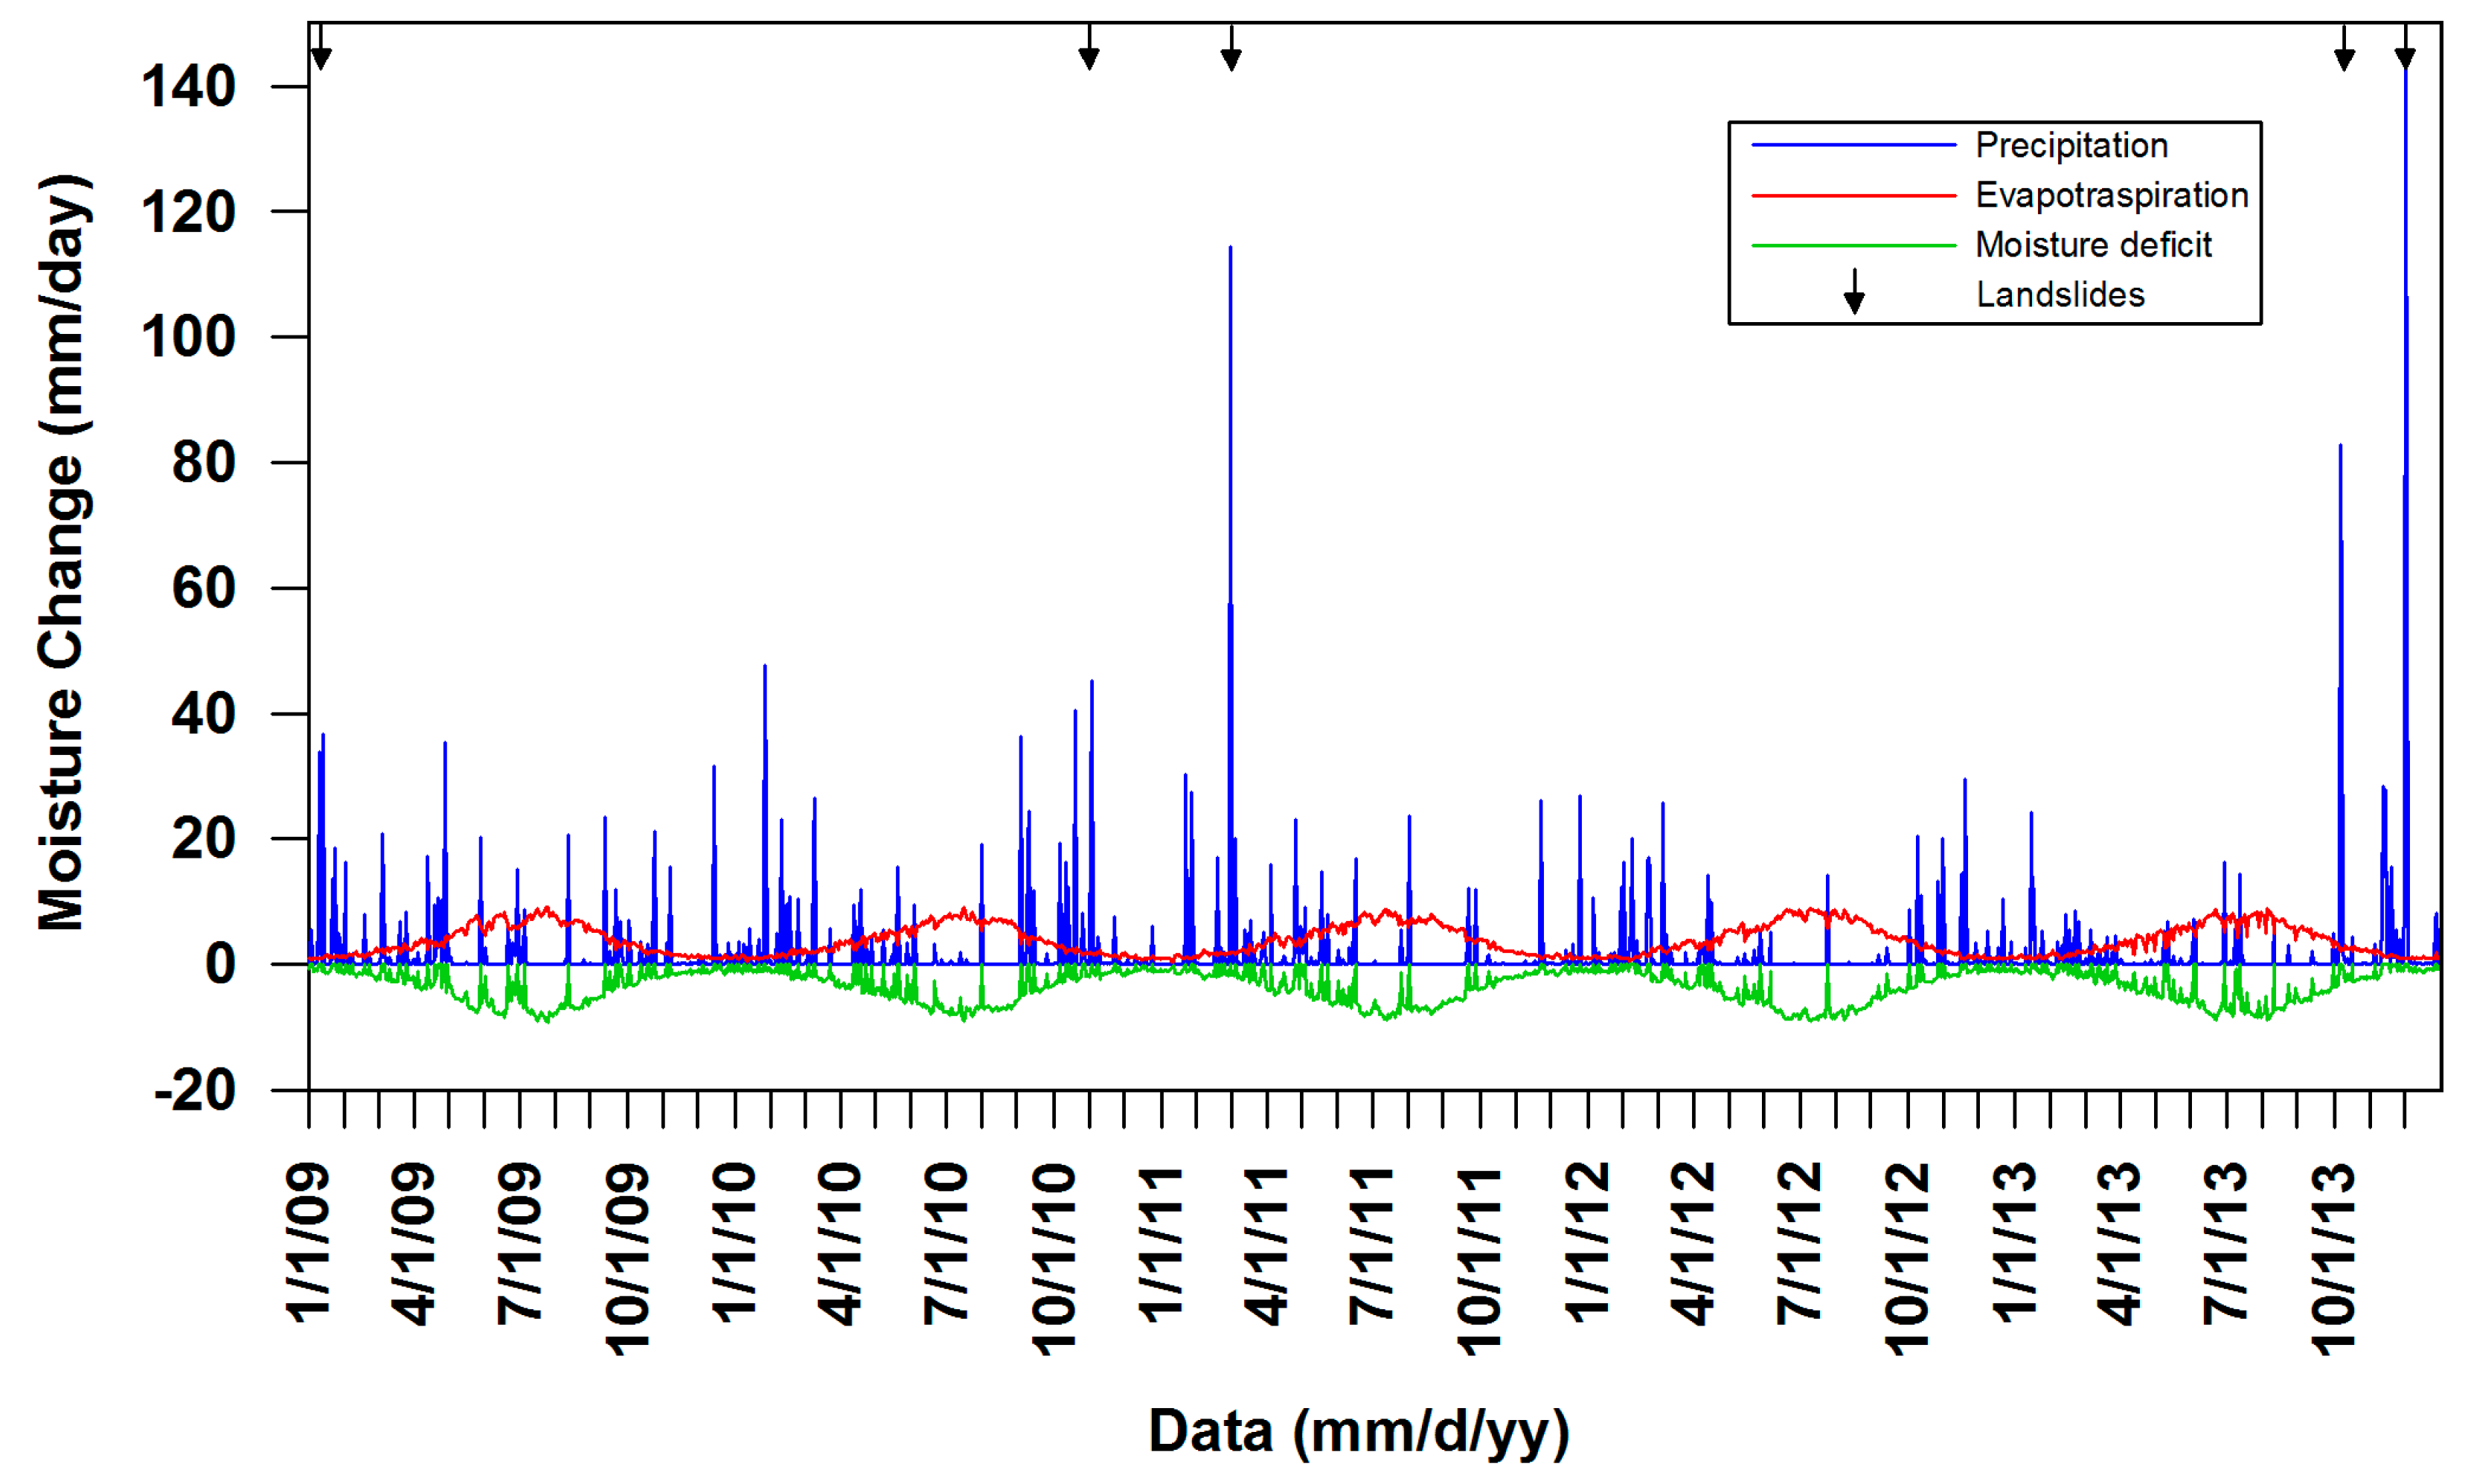
The moisture balance in hillslope soils is mainly affected by the input from precipitation and loss from evapotranspiration (ET). According to Thornthwaite and Mather [35], a moisture deficit is defined as the accumulated difference between evapotranspiration and precipitation over a period when ET exceeds the precipitation, referenced to an equilibrium moisture state. Conversely, a moisture surplus is attained when precipitation exceeds ET after the soil moisture has reached the equilibrium state. This equilibrium state correlates closely with the Campbell [36] field capacity, considered as the maximum soil moisture that can be held against gravitational drainage. While moisture deficits may be accumulated over long periods of time, Thornthwaite assumes that any excess moisture would quickly dissipate as surface drainage.
The relation between daily rainfall, daily real evapotranspiration and daily soil moisture deficit has been investigated (Figure 7). Data of real evapotraspiration was acquired from the climatic station of Montescaglioso of the Servizio Agrometereologico Lucano. It is quite evident that all the landslides occurred when soil moisture was in excess. This condition takes place during early winter and spring, whereas a strong soil moisture deficit occurs during the dry months of summer and early fall (June through September).
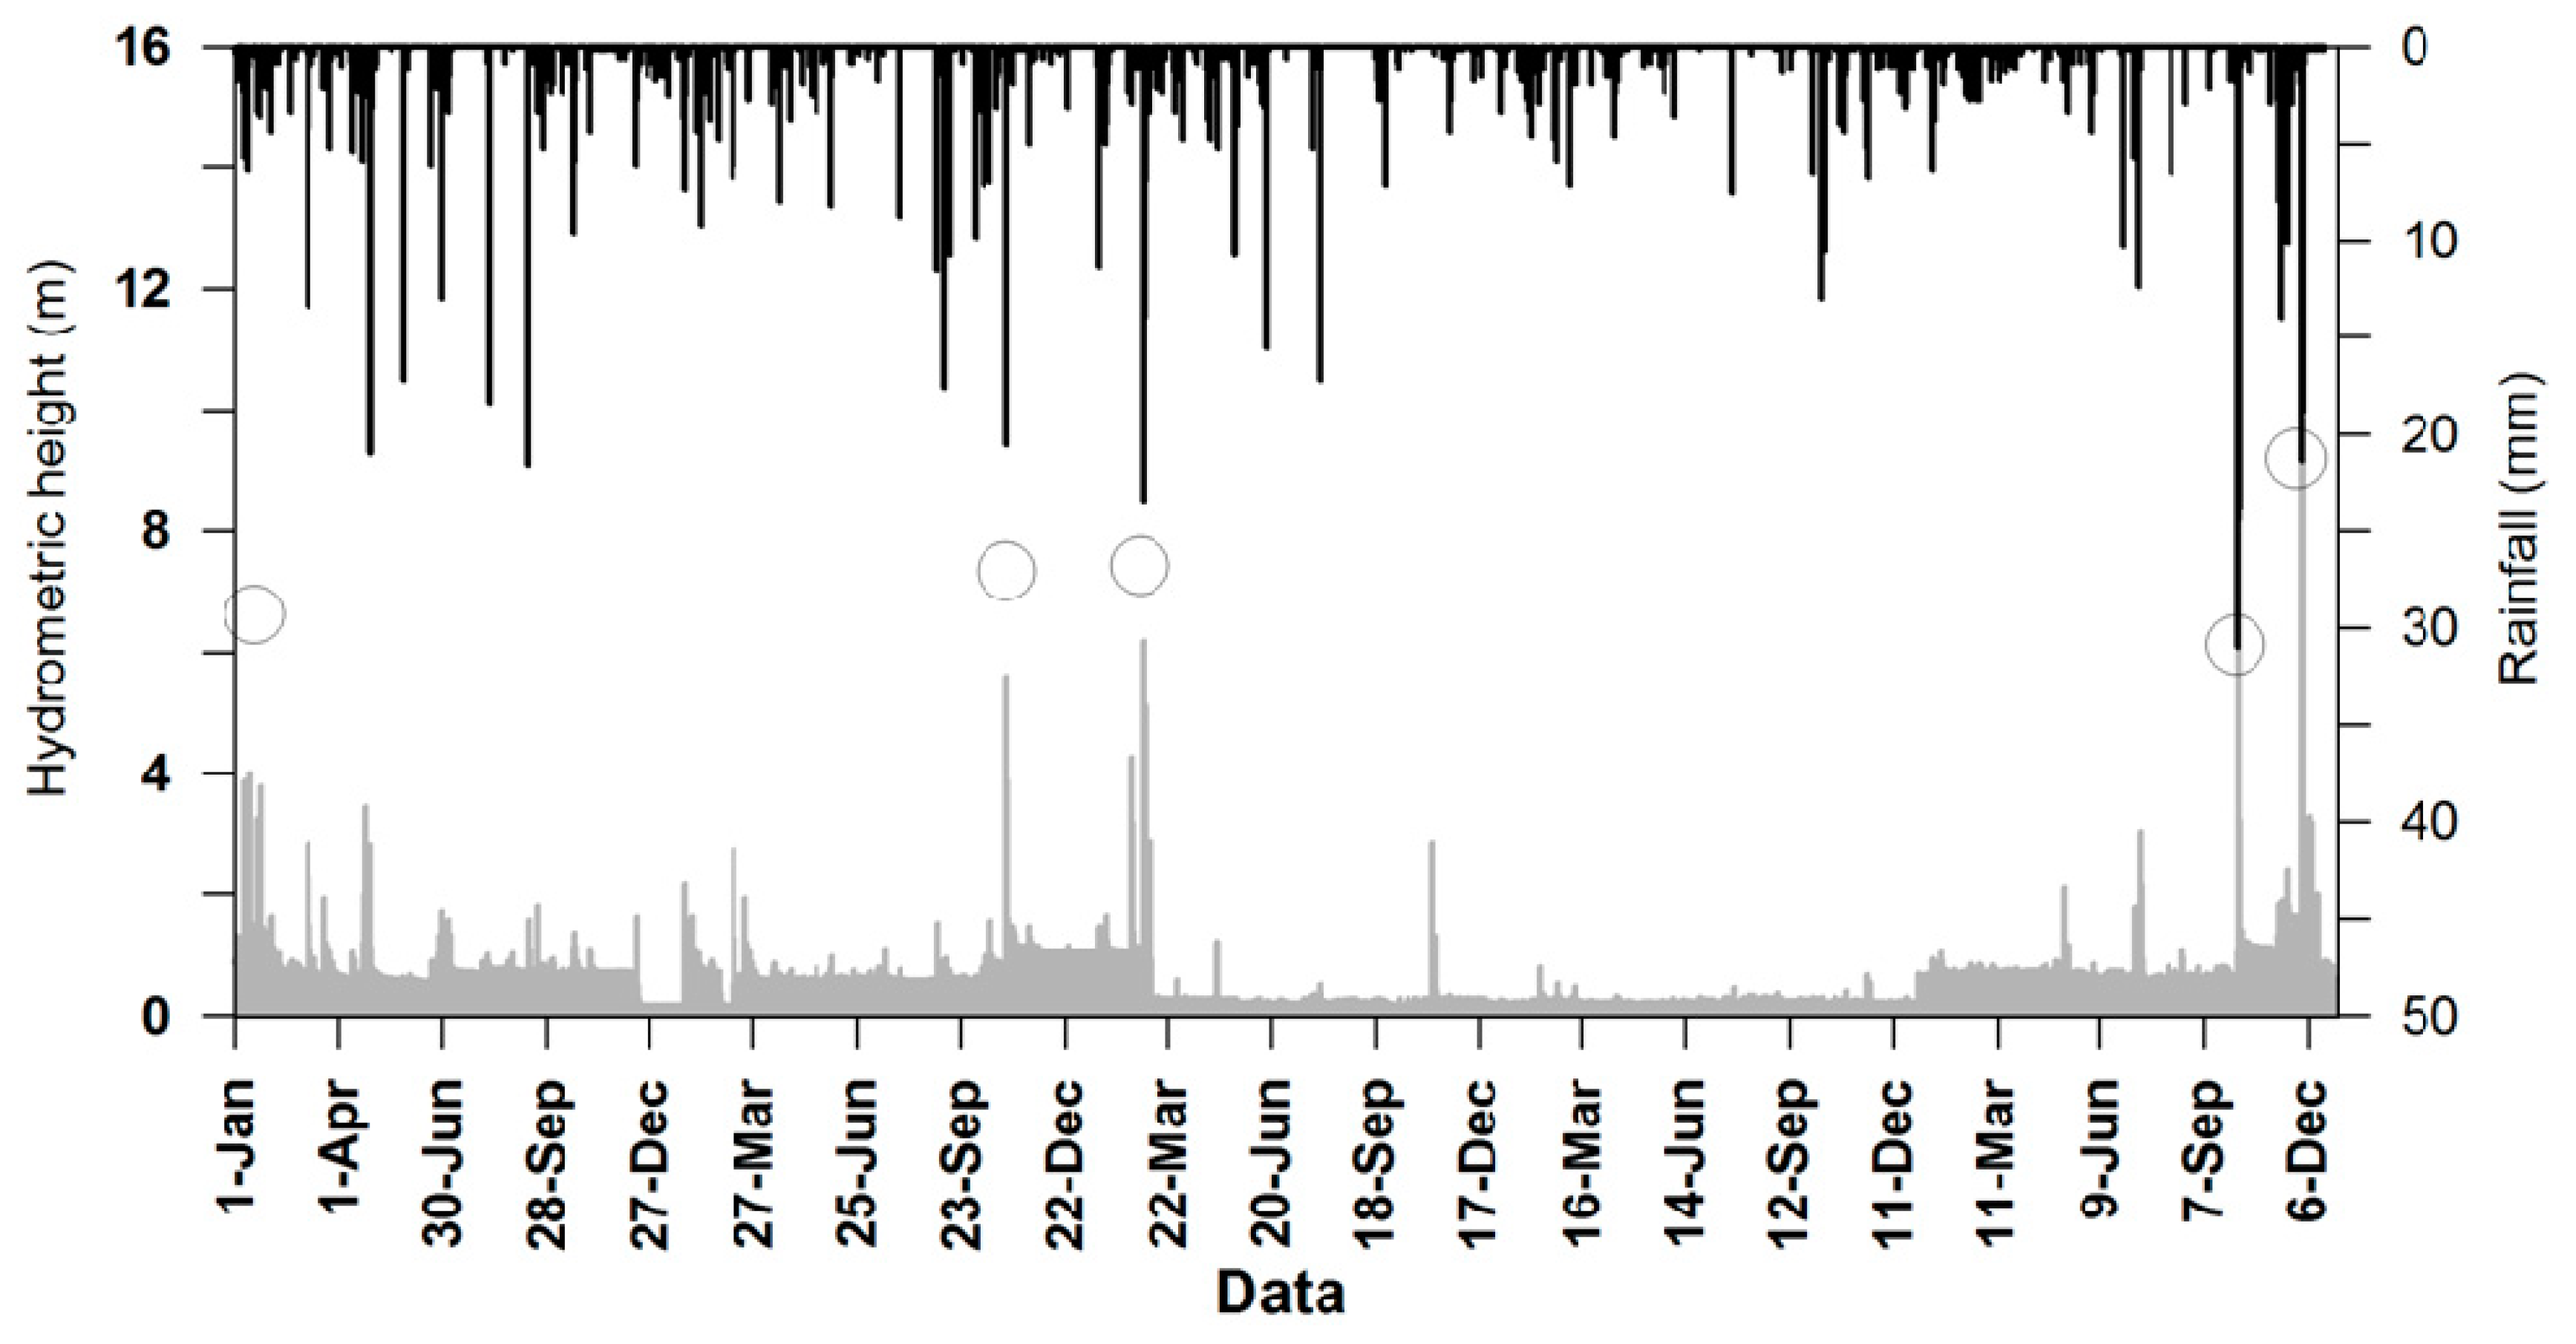
To better evaluate the role of climatic conditions on landslide hazard in the area we have also considered the relationships between hourly precipitation and hydrometric height of the Gravina stream, which is approximately 3 km NE from the town of Montescaglioso.
The interaction between the hourly precipitation (mm) and the hydrometric height of Gravina stream during landslide events is illustrated in Figure 8. The analysis reveals that the hydrometric height seems to play a decisive role in landslide triggering. In fact, many hourly rainfalls have reached really high values without provoking landslide events, whereas, each of the recorded landslide events has been preceded by a hydrometric height higher than 4.0 m. Hydrometric height value of 4 m may be considered as a threshold of hillslope soils saturation at Montescaglioso; when this peak has been reached, even a moderate rainfall event can trigger landslides.
The combined analysis of Figure 7 and Figure 8 shows that in the area, during the summer season the soils become dehydrated and soil suctions are strong and stream flows are very low, fed by ground water drained from bedrock (base flow). Early season rainfall is simply absorbed into the soil. Until the autumnal moisture deficit is made up, even heavy rainfall may have little effect on slope stability, and landslides are very unlikely. During the early winter, rainstorms become more frequent and evapotranspiration (ET) losses decrease, leading to a reduction in the moisture deficit. If winter rainfall is sufficient, eventually the soil moisture becomes completely restored to equilibrium (zero deficit). Once the antecedent threshold is passed, subsequent rainfall may produce a soil-moisture surplus, which is removed within a few days by stream runoff. Heavy rainfall may even create significant positive pore pressures, which reduces the frictional shear resistance of the soils, and may result in debris flows or other types of landslides.
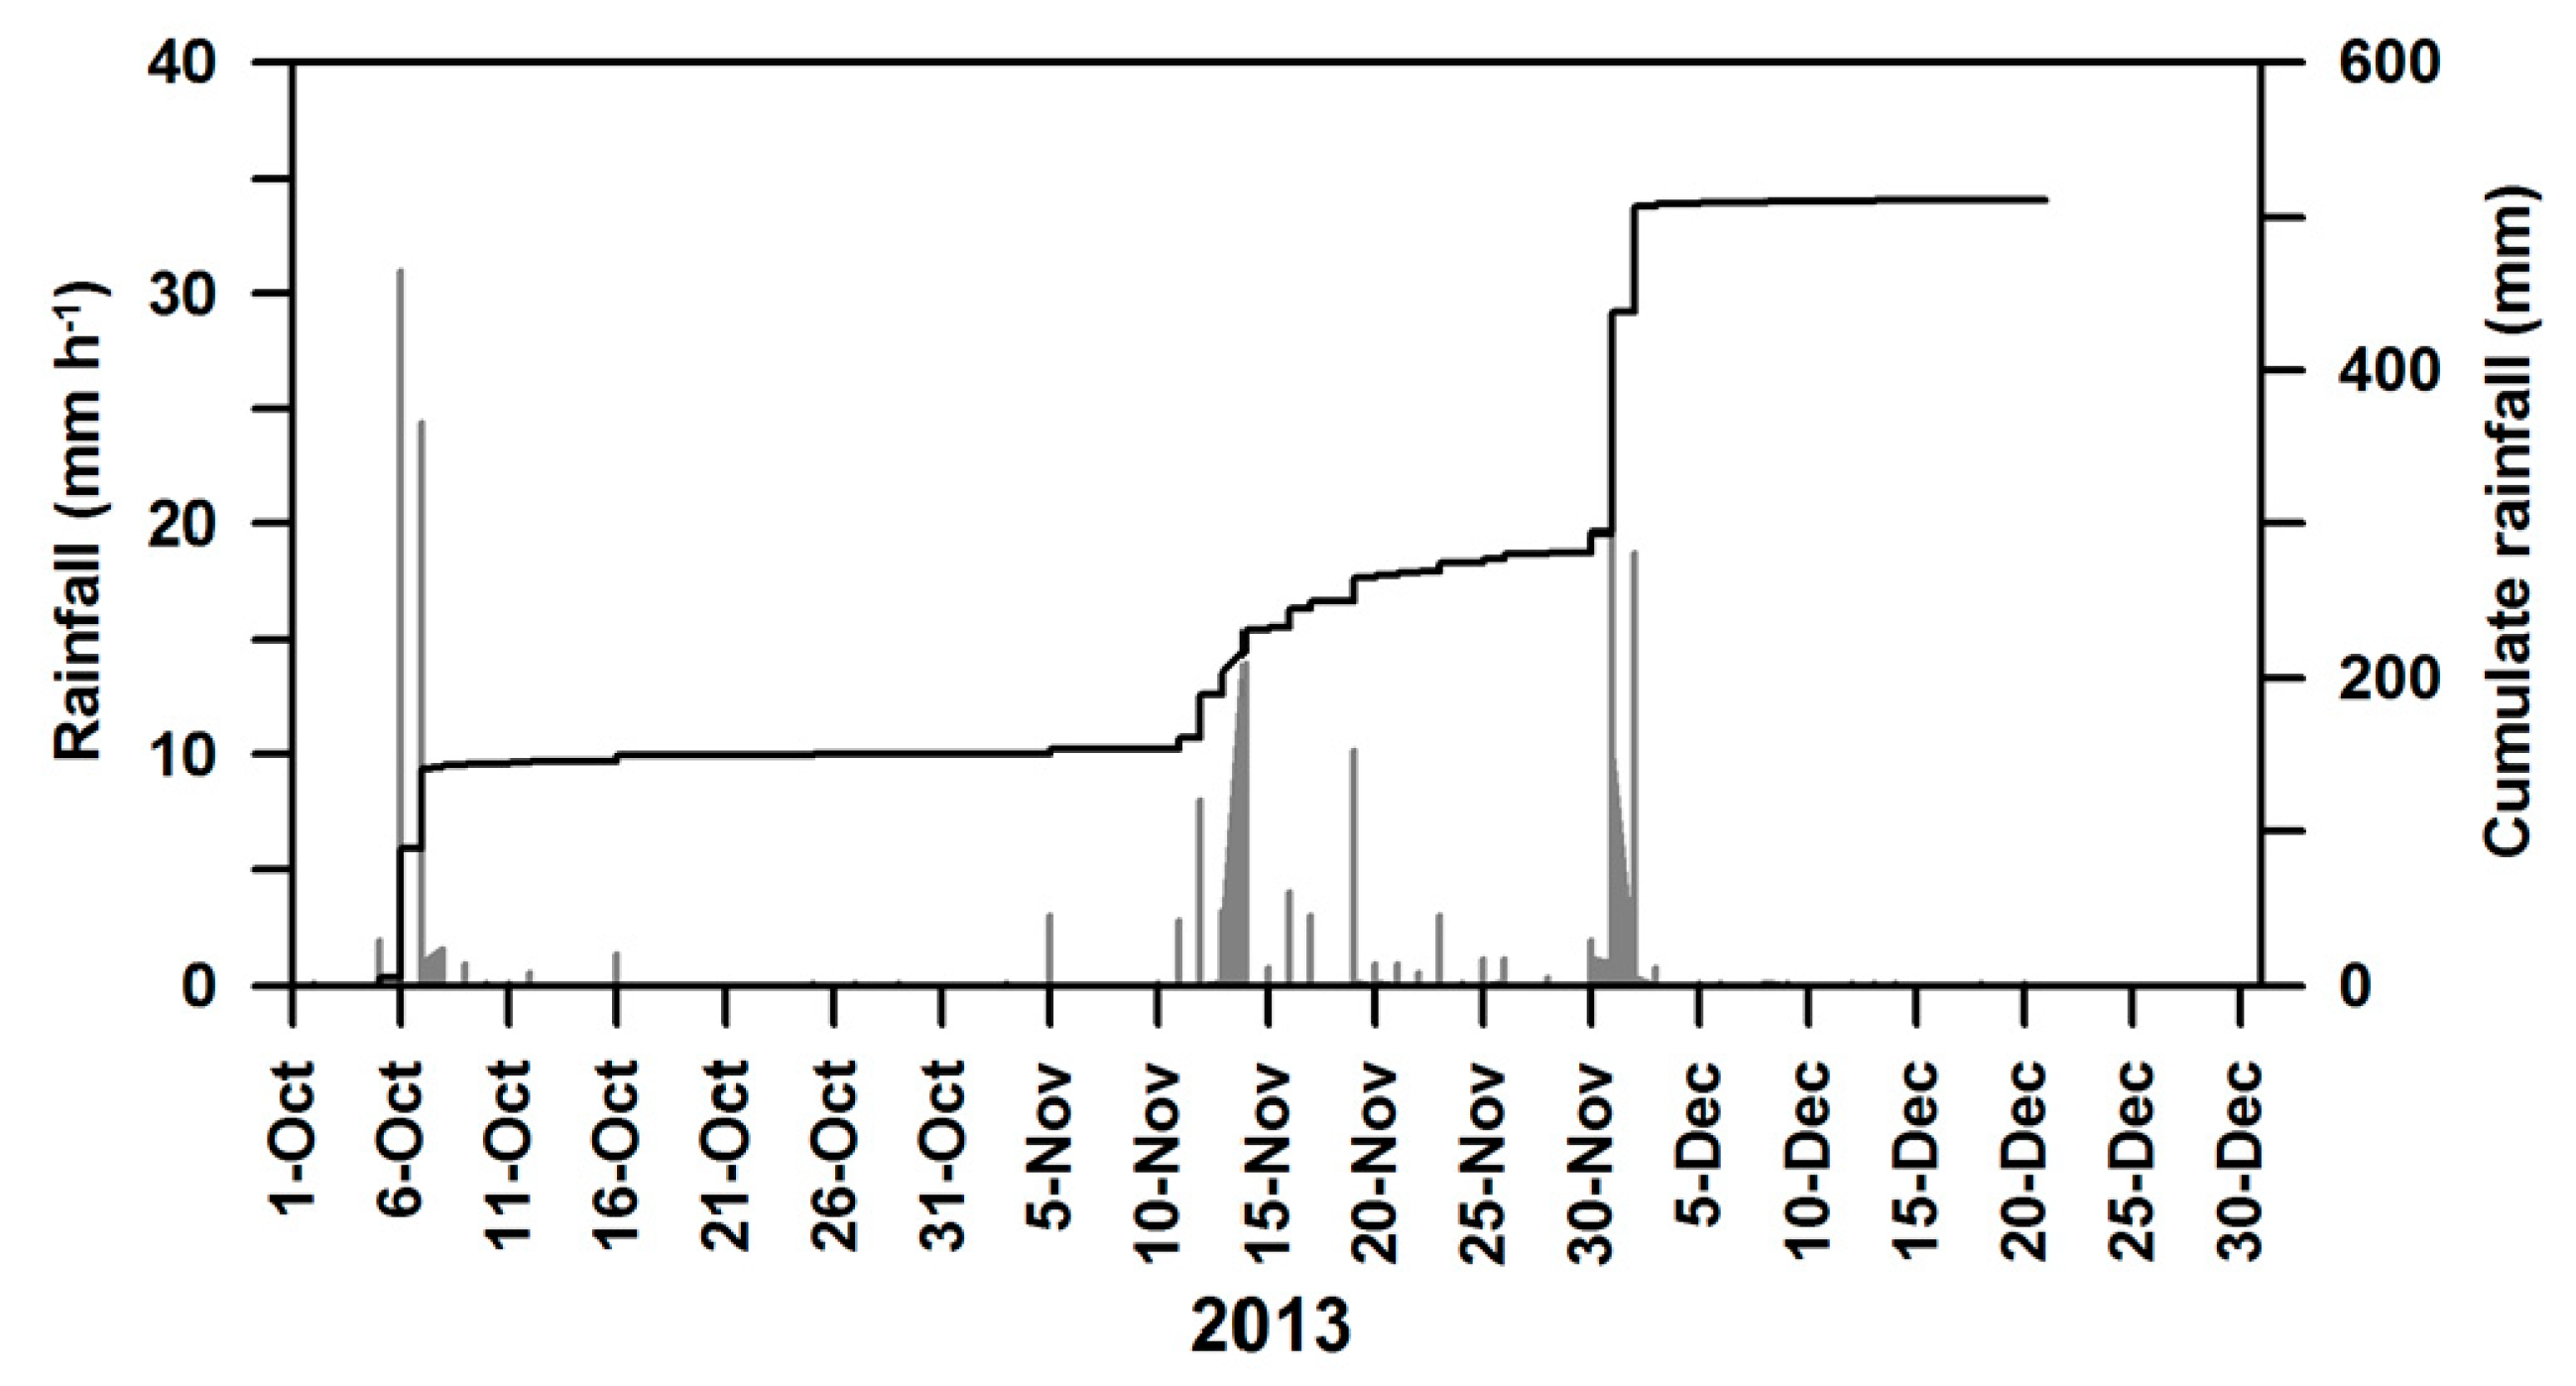
Extremely high precipitation totals were recorded in the Montescaglioso territory on 1–2 December 2013 (before the last large landslide), with a cumulate rainfall of 212 mm (Figure 9), corresponding to 45% of average annual rainfall. Specifically, the cumulative rainfall event was the highest value within the whole historical dataset. The intensity of rainfall events that preceded and determined the landslide triggering should be seen in context of where the average annual rainfall is very modest.
The shallow subsurface was already well water-saturated before this precipitation event due to another extreme event that occurred 6–7 October 2013, when around 135 mm of rain fell (Figure 8).
These data are also confirmed by two other meteorological stations available nearby the area, at Ginosa and Matera, 8 km SE and 13 km NW of the landslide, respectively. From the afternoon of 30 November to the late evening of 2 December, the cumulative rainfall was 152 mm and 157 mm at the Ginosa and Matera rain gauge respectively. This intense precipitation, immediately before the event, further contributed to the critical state caused by the significant accumulation of rainfall occurred during the month of October and November, which led the soil to complete saturation.
5. Discussion
The movement started affecting the freeway shortly afterward, involving also the lower-left flank of the landslide, resulting in the formation of a swarm of scarps and counterscarps, tens of meters in length and with a maximum height of seven to eight meters, damaging several buildings (15 homes evacuated), as shown by the damage map (Figure 4). We agree with Manconi et al. [10] about the fast velocity of landslide development with the main movement which occurred in a short period of 15–20 min.
The landslide causes land fractures varying from a few meters to about 10 m.
The surface drainage network, obliterated by the landslide, is currently not able to ensure the smooth flow of sewage. In particular, the main channel, capo Iazzo-Cinque Bocche, is blocked for about 1200 m, as a result of debris from the landslide.
Stability conditions assumed in time from the studied slope and confirmed by the application of the SINMAP have changed in recent years, due to the uncontrolled filling and obstruction of natural river channels, which, in conditions of extreme rainfall event, determine the conditions of supersaturation in the areas of upstream and the slope; additionally, cuts to the road across the slope is not adequately supported by bulkheads that are properly designed.
The landslide, in fact, has completely overturned the bulkhead at several points, highlighting that it had not been founded on deep piles.
The landslide movement determined the formation of pressure ridges, thrusts for some hundreds of meters and trenches (5–6 m wide in agreement with [37]), as well as the damming of Fosso Capoiazzo, with consequent formation of several lakes. In particular, the area of the original confluence between the two water lines (Cinque Bocche and Fosso Capoiazzo streams) was considerably modified, being strongly altered by the hydrographic network due to the accumulation of the material pushed from upstream.
The morphological characters observed and mapped indicate that the phenomenon was a translational slide, with main directions of movement towards SW. In its middle-lower portion, because of the obstacle constituted by the body of an ancient paleo-landslide (mapped in geological map of Italy in 1968 sheet 201 “Matera”), delimited by the two streams mentioned above, the direction of the main movement changed toward SSW.
The greatest positive differences in altitude due to landslide accumulation are concentrated at the foot of the landslide, while the depressed areas are located in the NE sector, in sub-parallel bands, due to depressions (small grabens) (Figure 10). These forms (graben) can be related [38] to an abrupt variation in the position of the breaking/sliding surface.
As already reported by [10] and [11], ground deformation has dominant SW components, with values ranging between 8 and 12 m within the landslide. Surface deformation generally increases moving towards Capo Iazzo creek, which is the left limit of the landslide, with values up to 18–20 m for both NS and EW components. Vertical displacements are generally smaller than planimetric components, ranging from 2 to about 3 m, with a maximum of 5 m in the upper part of the slope, where most of the damage occurred. The deposit area is clearly visible in the lower part of the landslide, with an uplift of about 7–8 m.
The Fosso Cinque Bocche has undergone a slight rigid translation towards South-South-East of its terminal part, for a development approximately 700 m upstream of the confluence, with modest translations of solid material for the part upstream of Fosso itself, and up to the margins of inhabited space and no significant changes were made to the hydrographic network.
On the other hand, Fosso Capo iazzo shows significant changes in both planimetric and altimetric trends that can be differentiated into five zones, with the exception of its portion of the mountain.
In connection with the landslide area adjacent to the SS 175, Fosso Capo Iazzo has a large translation towards South-South East connected to the gravitational phenomenon identified along the left side of the ditch and then from its foot, that has invaded the original course of the Fosso, transferring the route, raising the sliding altitude and producing the formation of a water storage area (lake). Where the confluence of the Fosso Capo Jazzo and Fosso Cinque Bocche (Figure 2) is, coinciding with the foot of the landslide, important changes can be seen in the trend of the hydrographic network, with considerable amounts of material coming from the landslide, which produced conspicuous accumulations with the consequent translation of the fluvial canal eastward, about 5–30 m and upwards about 2–12 m.
6. Conclusions
In this paper we focus on a recent large rainfall-triggered landslide that occurred close to Montescaglioso town on 3 December 2013. The landslide caused significant structural damage to buildings, roads and power lines and gas pipelines. It developed along a slope, apparently stable for last 40 years, as suggested by the analysis of susceptibility by SINMAP, but deeply modified during recent years by a heavy anthropization action. A dependence between rainfalls and slope displacement was also verified. In fact, the climatic analysis has shown that the last few extreme events have produced critical conditions along the side for the weighting produced by supersaturation, in turn due to the absence of natural drainage networks and the insufficiency of anthropogenic ones.
The analysis of the data in Figure 6 shows that in 1997, an event similar to that of 3 December 2013, took place in Montescaglioso, but it did not produce any damage, as the area of study had not yet been anthropized with the road structures and buildings that subsequently were collapsed, nor had the natural channels of the pre-existing hydrographic network yet been filled.
In light of this, we can reasonably assert that other causes of triggering the landslide are due to anthropic actions and can be summarized in the following points:
- the obliteration of the hydrographic network determined by the arrangements made to the left of the fast-flowing road (where the LIDL Italia hypermarket and a marble factory are located), where the embankment on which the LIDL structure was built has effectively blocked the water flow, previously interrupted by the formation of a pond in the area immediately behind the containment wall;
- the interruption of the various ramifications of the hydrographic network produced by the same fast-flowing road, which is also free of gutters on the upstream side and of crossing drains able to guarantee the hydraulic continuity of the intersected ditches;
- the modification of the confluence zone of the two streams, produced by the regularization and extension of the sub-horizontal area located to the left of the fast-flowing road, where there is a storage area for various building materials (pipes, containers, etc.).
As already mentioned in the text, an interesting question to ask in these cases is: how it was possible to allow an action of urbanization this invasive, in a sector of the territory characterized by a geomorphological structure that was apparently stable, as evidenced by the large surrounding areas affected by important historical landslides, greatly increasing the level of vulnerability and risk induced. The question is probably rhetorical, but the point of this work is raise awareness, and shake the feeling of municipalities who are often blind and cynical.
Finally, the complexity and the proximity to intensely inhabited areas of the landslide phenomenon of 3 December 2013 requires the establishment of measures of sensitive parameters, mainly aimed at an early warning system with respect to reactivation or retrogressive extensions of the landslide.
Author Contributions
Individual contributions of authors: Conceptualization, M.L. and M.P.; Methodology, M.L. and M.P.; Software, M.P.; Validation, M.L. and M.P.; Climate Analysis, M.P.; Field Investigation and mapping, M.L.; Resources, M.L.; Data Curation, M.L. and M.P.; Writing-Original Draft Preparation, M.L. and M.P.; Writing-Review & Editing, M.L. and M.P.
Funding
This research received no external funding.
Acknowledgments
The authors would like to thank the unknown referees that have made it possible to significantly improve the manuscript.
Conflicts of Interest
The authors declare no conflict of interest.
References
- Guzzetti, F. Landslide fatalities and the evaluation of landslide risk in Italy. Eng. Geol. 2006, 58, 89–107. [Google Scholar] [CrossRef]
- Lazzari, M.; Gioia, D. Regional-scale landslide inventory, central-western sector of the Basilicata region (Southern Apennines, Italy). J. Maps 2015, 12, 852–859. [Google Scholar] [CrossRef] [Green Version]
- Lazzari, M.; Gioia, D.; Anzidei, B. Landslide inventory of the Basilicata region (Southern Italy). J. Maps 2018, 14, 348–356. [Google Scholar] [CrossRef]
- Piccarreta, M.; Capolongo, D.; Boenzi, F. Trend analysis of precipitation and drought in Basilicata from 1923 to 2000 within a southern Italy context. Int. J. Climatol. 2004, 24, 907–922. [Google Scholar] [CrossRef] [Green Version]
- Lazzari, M.; Piccarreta, M.; Capolongo, D. Landslide triggering and local rainfall thresholds in Bradanic Foredeep, Basilicata region (southern Italy). Landslide Science and Practice. Volume 2. Early warning, instrumentation and modeling. In Proceedings of the Second World Landslide Forum, Rome, Italy, 3–9 October 2011; Volume 2, pp. 671–678, ISBN 9783642314445. [Google Scholar]
- Lazzari, M.; Geraldi, E.; Lapenna, V.; Loperte, A. Natural hazards vs human impact: An integrated methodological approach in geomorphological risk assessing on Tursi historical site, southern Italy. Landslides 2006, 3, 275–287. [Google Scholar] [CrossRef]
- Boenzi, F.; Giura Longo, R. La Basilicata: I Tempi, gli Uomini, L’ambiente; Edipuglia: Bari, Italy, 1994; p. 254. [Google Scholar]
- Naudet, V.; Lazzari, M.; Perrone, A.; Loperte, A.; Piscitelli, S.; Lapenna, V. Integrated geophysical techniques and geomorphological approach to investigate the snowmelt-triggered landslide of Bosco Piccolo village (Basilicata, southern Italy). Eng. Geol. 2008, 98, 156–167. [Google Scholar] [CrossRef]
- Lazzari, M. The Bosco Piccolo snow-melt triggered-landslide (southern Italy): A natural laboratory to apply integrated techniques to mapping, monitoring and damage assessment. In Proceedings of the Conference on Landslide Processes: From Geomorphologic Mapping to Dynamic Modelling, Strasbourg, France, 6–7 February 2009; pp. 163–168. [Google Scholar]
- Manconi, A.; Casu, F.; Ardizzone, F.; Bonano, M.; Cardinali, M.; De Luca, C.; Gueguen, E.; Marchesini, I.; Parise, M.; Vennari, C.; et al. Rapid mapping of event landslides: The 3 December 2013 Montescaglioso landslide (Italy). Nat. Hazards Earth Syst. Sci. 2014, 2, 1465–1479. [Google Scholar] [CrossRef]
- Raspini, F.; Ciampalini, A.; del Conte, S.; Lombardi, L.; Nocentini, M.; Gigli, G.; Ferretti, A.; Casagli, N. Exploitation of amplitude and phase of satellite SAR images for landslide mapping: The case of Montescaglioso (south Italy). Remote Sens. 2015, 7, 14576–14596. [Google Scholar] [CrossRef]
- Carlà, T.; Raspini, F.; Intrieri, E.; Casagli, N. A simple method to help determine landslide susceptibility from spaceborne InSAR data: The Montescaglioso case study. Environ. Earth Sci. 2016, 75, 1492. [Google Scholar] [CrossRef]
- Pascale, S.; Pastore, V.; Sdao, F.; Sole, A.; Roubis, D.; Lorenzo, P. Use of remote sensing data to landslide change detection: Montescaglioso large landslide (Basilicata, southern Italy). Int. J. Agric. Environ. Inf. Syst. 2012, 3, 14–25. [Google Scholar] [CrossRef]
- Boenzi, F.; Radina, B.; Ricchetti, G.; Valduga, A. Note Illustrative Della Carta Geologica D’italia Alla Scala 1:100000 Foglio 201 “Matera”; Servizio Geologico d’Italia: Roma, Italy, 1971.
- Pieri, P.; Tropeano, M.; Sabato, L.; Lazzari, M.; Moretti, M. Quadro stratigrafico dei depositi regressivi della Fossa bradanica (Pleistocene) nell’area compresa fra Venosa e il Mar Ionio. J. Geol. 1998, 60, 318–320. [Google Scholar]
- Lazzari, M.; Pieri, P. Modello stratigrafico-deposizionale della successione regressiva infrapleistocenica della Fossa bradanica nell’area compresa tra Lavello, Genzano e Spinazzola. Mem. Soc. Geol. It. 2002, 57, 231–237. [Google Scholar]
- Lazzari, M. Il comportamento tettonico e sedimentario del bacino d’avanfossa Bradanica durante il Pleistocene inferiore. Volume in memoria di Alfredo Jacobacci “Evoluzione delle conoscenze geologiche dell’Appennino Apulo-Campano e Tosco-Umbro-Marchigiano. Mem. Descr. Carta Geol. It. 2008, 77, 61–76. [Google Scholar]
- Pack, R.T.; Tarboton, D.G.; Goodwin, C.N. The SINMAP approach to terrain stability mapping. In Proceedings of the 8th Congress of the International Association of Engineering Geology, Vancouver, BC, Canada, 21–25 September 1998. [Google Scholar]
- Montgomery, D.R.; Dietrich, W.E. A physically based model for the topographic control of shallow landsliding. Water Resour. Res. 1994, 30, 1153–1171. [Google Scholar] [CrossRef]
- Beven, K.J.; Kirby, M.J. A physically based variable contributing area model of basin hydrology. Hydrol. Sci. Bull. 1979, 24, 43–69. [Google Scholar] [CrossRef]
- Pack, R.; Tarboton, D.; Goodwin, C. Assessing terrain stability in a GIS using SINMAP. In Proceedings of the 15th Annual GIS Conference, Vancouver, BC, Canada, 19–22 February 2001. [Google Scholar]
- Del Prete, M.; Valentini, G. Le caratteristiche geotecniche delle argille azzurre dell’Italia sudorientale in relazione alle differenti situazioni stratigrafiche e tettoniche. Geol. Appl. Idrogeol. 1971, 6, 195–215. [Google Scholar]
- Valentini, G.; Cherubini, C.; Guadagno, F.M. Caratteristiche geotecniche dei sedimenti argillosi pleistocenici tra Pisticci ed il mare. Geol. Appl. Idrogeol. 1979, 14, 569–599. [Google Scholar]
- Cherubini, C.; Walsh, N. Caratteristiche geolitologiche e geotecniche delle. Sabbie di Monte Marano. Geol. Appl. Idrogeol. 1982, 17, 319–338. [Google Scholar]
- Cherubini, C.; Genevois, R.; Guadagno, F.M.; Prestininzi, A.; Valentini, G. Sulle correlazioni geotecniche spaziali, l’erosione e la stabilità dei pendii dei depositi argillosi pleistocenici della fossa Bradanica. Geol. Appl. Idrogeol. 1985, 20, 671–690. [Google Scholar]
- Bozzano, F.; Cherubini, C.; Floris, M.; Lupo, M.; Paccapelo, F. Landslide phenomena in the area of Pomarico (Basilicata-Italy): Methods for modelling and monitoring. Phys. Chem. Earth 2002, 27, 1601–1607. [Google Scholar] [CrossRef]
- Molligan, M. Modelling the geomorphoogical impact of climatic variability and extreme events in a semi-arid environment. Geomorphology 1998, 24, 59–78. [Google Scholar] [CrossRef]
- Soil and Water Conservation Society. Conservation Implications of Climate Change: Soil Erosion and Runoff from Cropland; A Report from the Soil and Water Conservation Society; Soil and Water Conservation Society: Ankeny, IA, USA, 2003. [Google Scholar]
- Piccarreta, M.; Pasini, A.; Capolongo, D.; Lazzari, M. Changes in daily precipitation extremes in the Mediterranean from 1951 to 2010: The Basilicata region, southern Italy. Int. J. Climatol. 2013, 33, 3229–3248. [Google Scholar] [CrossRef]
- Gao, X.; Pal, J.S.; Giorgi, F. Projected changes in mean and extreme precipitation over the Mediterranean region from a high resolution double nested RCM simulation. Geophys. Res. Lett. 2006, 33, L03706. [Google Scholar] [CrossRef]
- Zizioli, D.; Meisina, C.; Valentino, R.; Montrasio, L. Comparison between different approaches to modeling shallow landslide susceptibility: A case history in Oltrepo Pavese, Northern Italy. Nat. Hazards Earth Syst. Sci. 2013, 13, 559–573. [Google Scholar] [CrossRef]
- Michel, G.P.; Kobiyama, M.; Goerl, R.F. Comparative analysis of SHALSTAB and SINMAP for landslide susceptibility mapping in the Cunha River basin, southern Brazil. J. Soils Sediments 2014, 14, 1266–1277. [Google Scholar] [CrossRef]
- Lazzari, M.; Piccarreta, M.; Capolongo, D. Landslide triggering and local rainfall thresholds in bradanic foredeep, Basilicata Region (Southern Italy). In Landslide Science and Practice Volume 2: Early Warning, Instrumentation and Monitoring; Margottini, C., Canuti, P., Sassa, K., Eds.; Springer: Heidelberg, Germany, 2013; pp. 671–677. [Google Scholar]
- Wilson, R. Overture to a landslide—A seasonal moisture prerequisite. In Proceedings of the 9th Annual Pacific Climate Workshop, Pacific Grove, CA, USA, 3–6 March 2002; pp. 149–157. [Google Scholar]
- Thornthwaite, C.W.; Mather, J.R. The Water Balance: Publications in Climatology; Laboratory of Climatology, Drexel Institute of Technology: Centerton, NJ, USA, 1955; p. 104. [Google Scholar]
- Campbell, R.H. Soil Slips, Debris Flows, and Rainstorms in the Santa Monica Mountains and Vicinity, Southern California. Available online: https://pubs.usgs.gov/pp/0851/report.pdf (accessed on 5 October 2018).
- Parise, M.; Gueguen, E.; Vennari, C. Mapping Surface Features Produced by an Active Landslide. IOP Conf. Ser. Earth Environ. Sci. 2016, 44, 022029. [Google Scholar] [CrossRef] [Green Version]
- Cruden, DM. A simple definition of a landslide. Bull. Int. Assoc. Eng. Geol. 1991, 43, 27–29. [Google Scholar] [CrossRef]
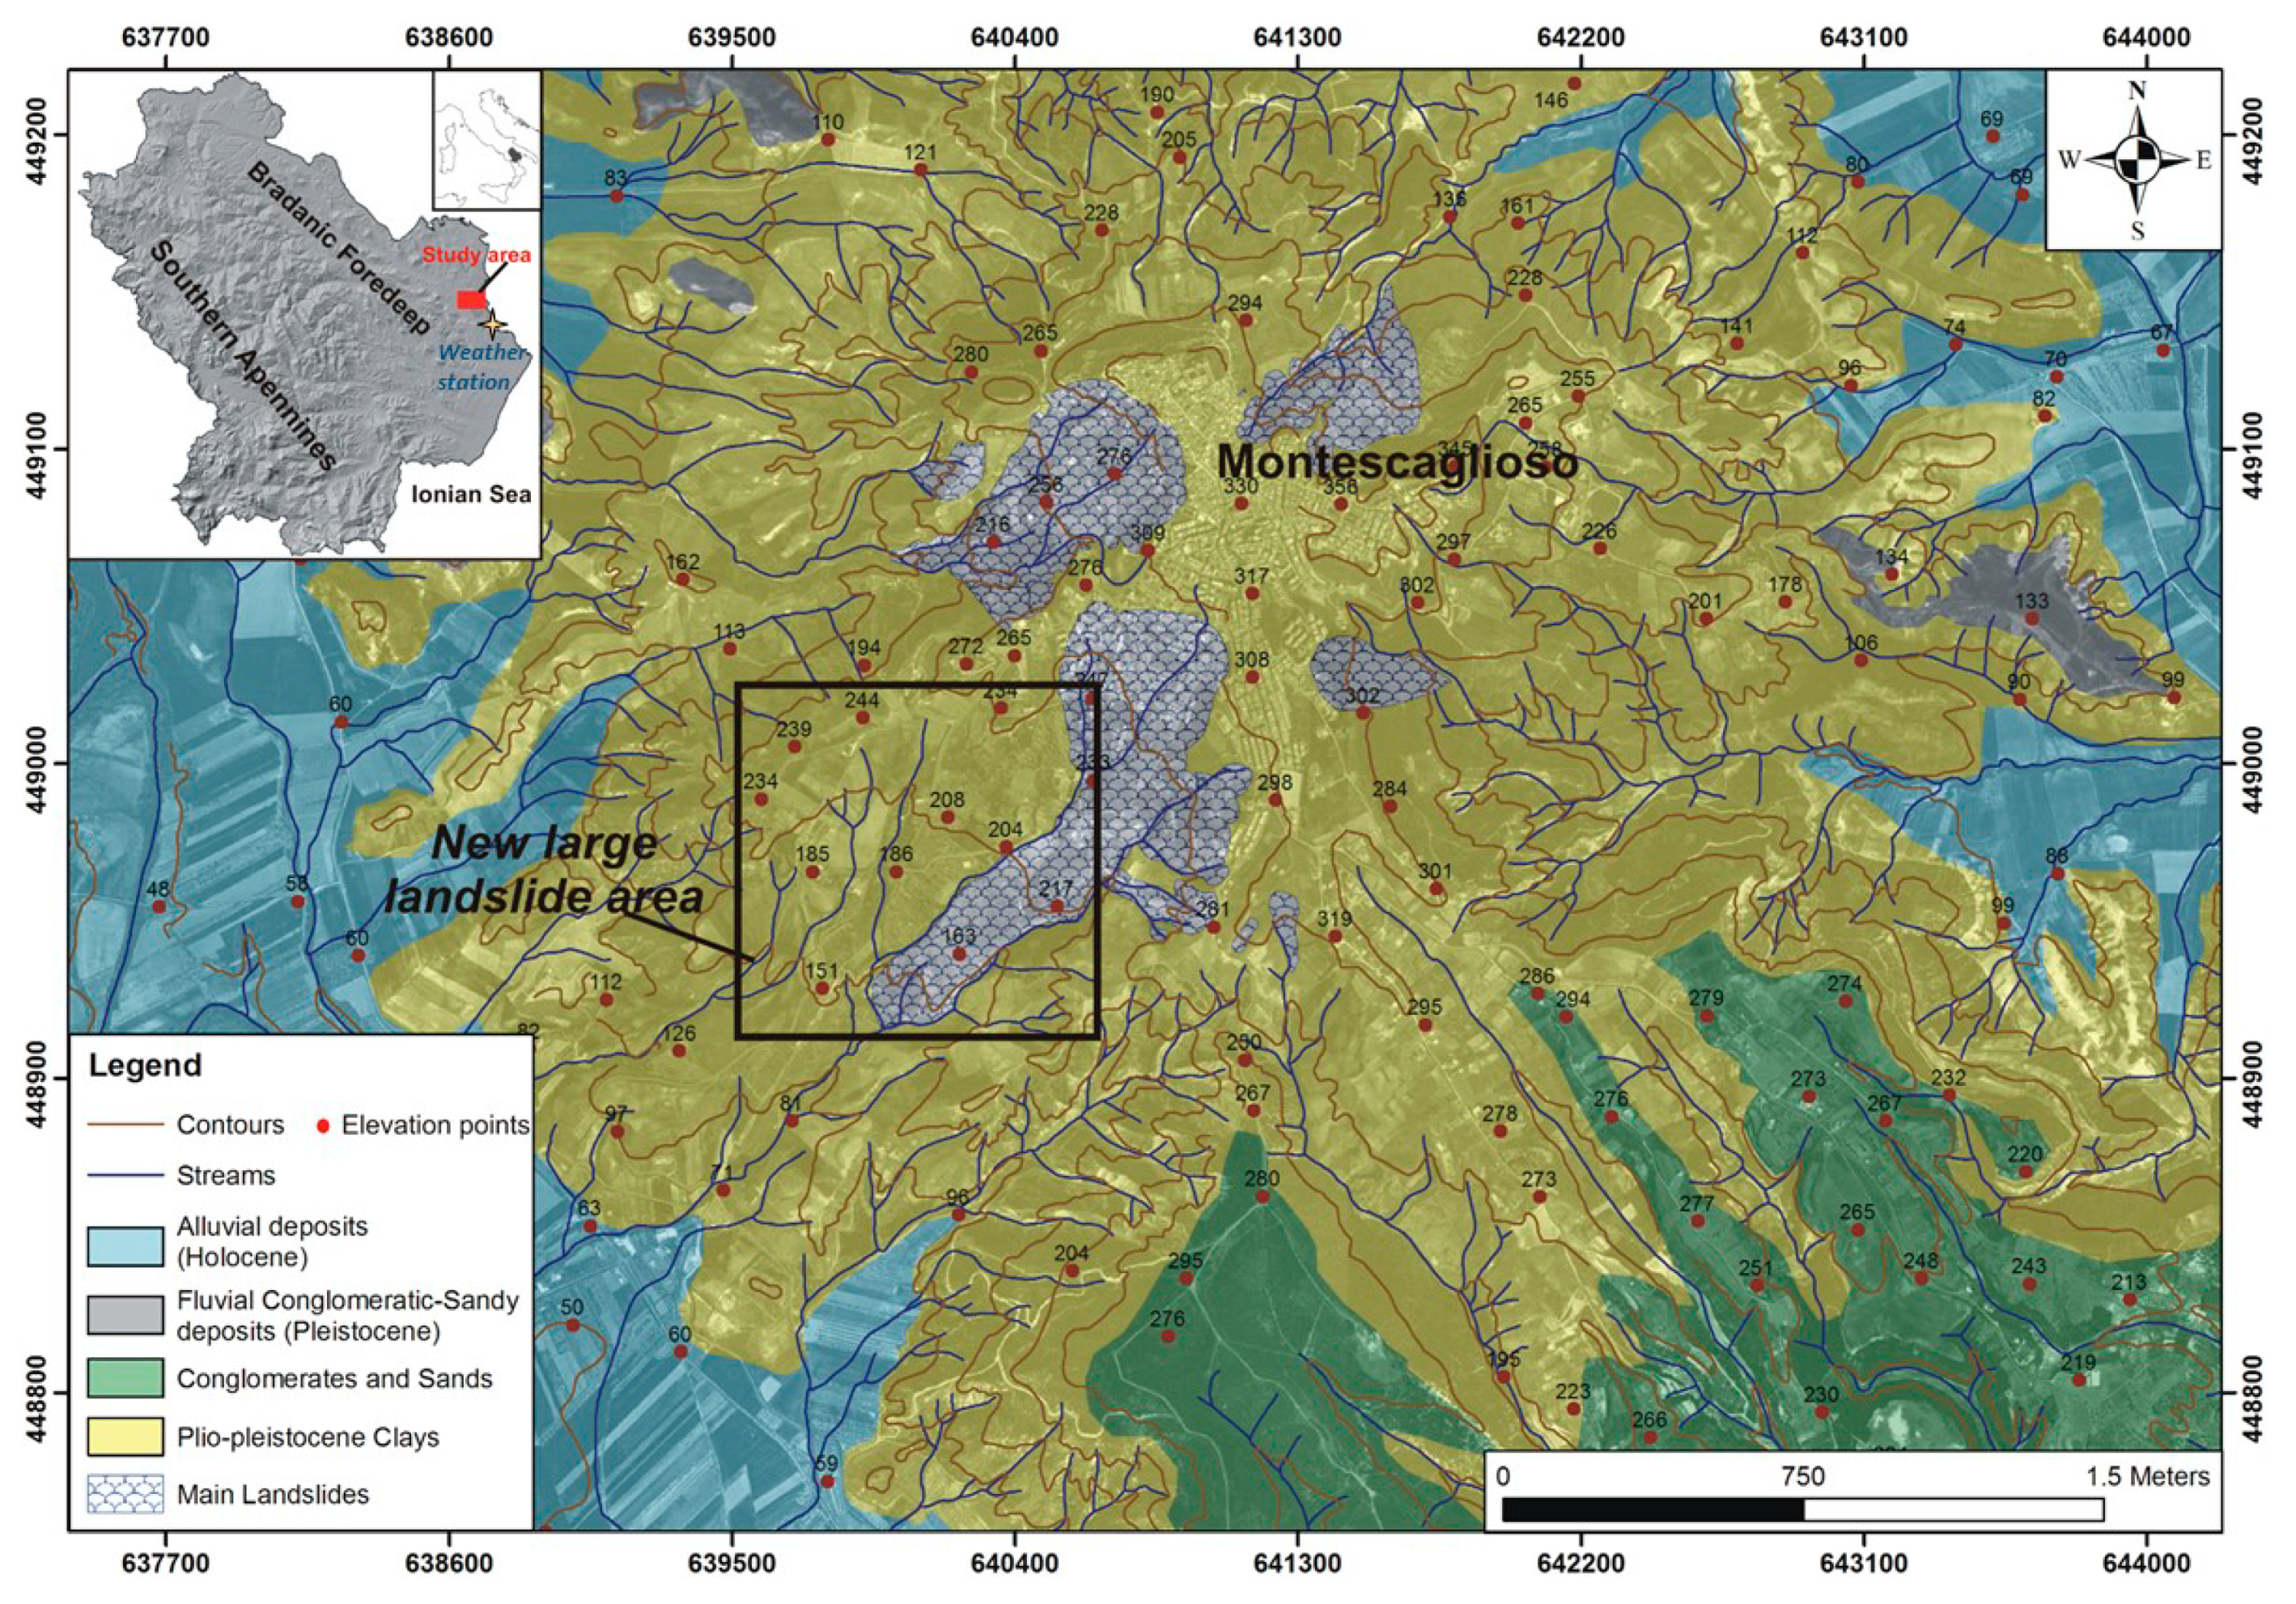
Figure 1.
Geographic location and geological map of the study area. The black box shows the studied area, while the small window at the top left, shows the location of the weather station, used for climatic analysis (yellow cross).
Figure 1.
Geographic location and geological map of the study area. The black box shows the studied area, while the small window at the top left, shows the location of the weather station, used for climatic analysis (yellow cross).

Figure 2.
Damage map of the study area. The streams in light blue were filled and diverted during the anthropization of the area that occurred at the end 1990s.
Figure 2.
Damage map of the study area. The streams in light blue were filled and diverted during the anthropization of the area that occurred at the end 1990s.

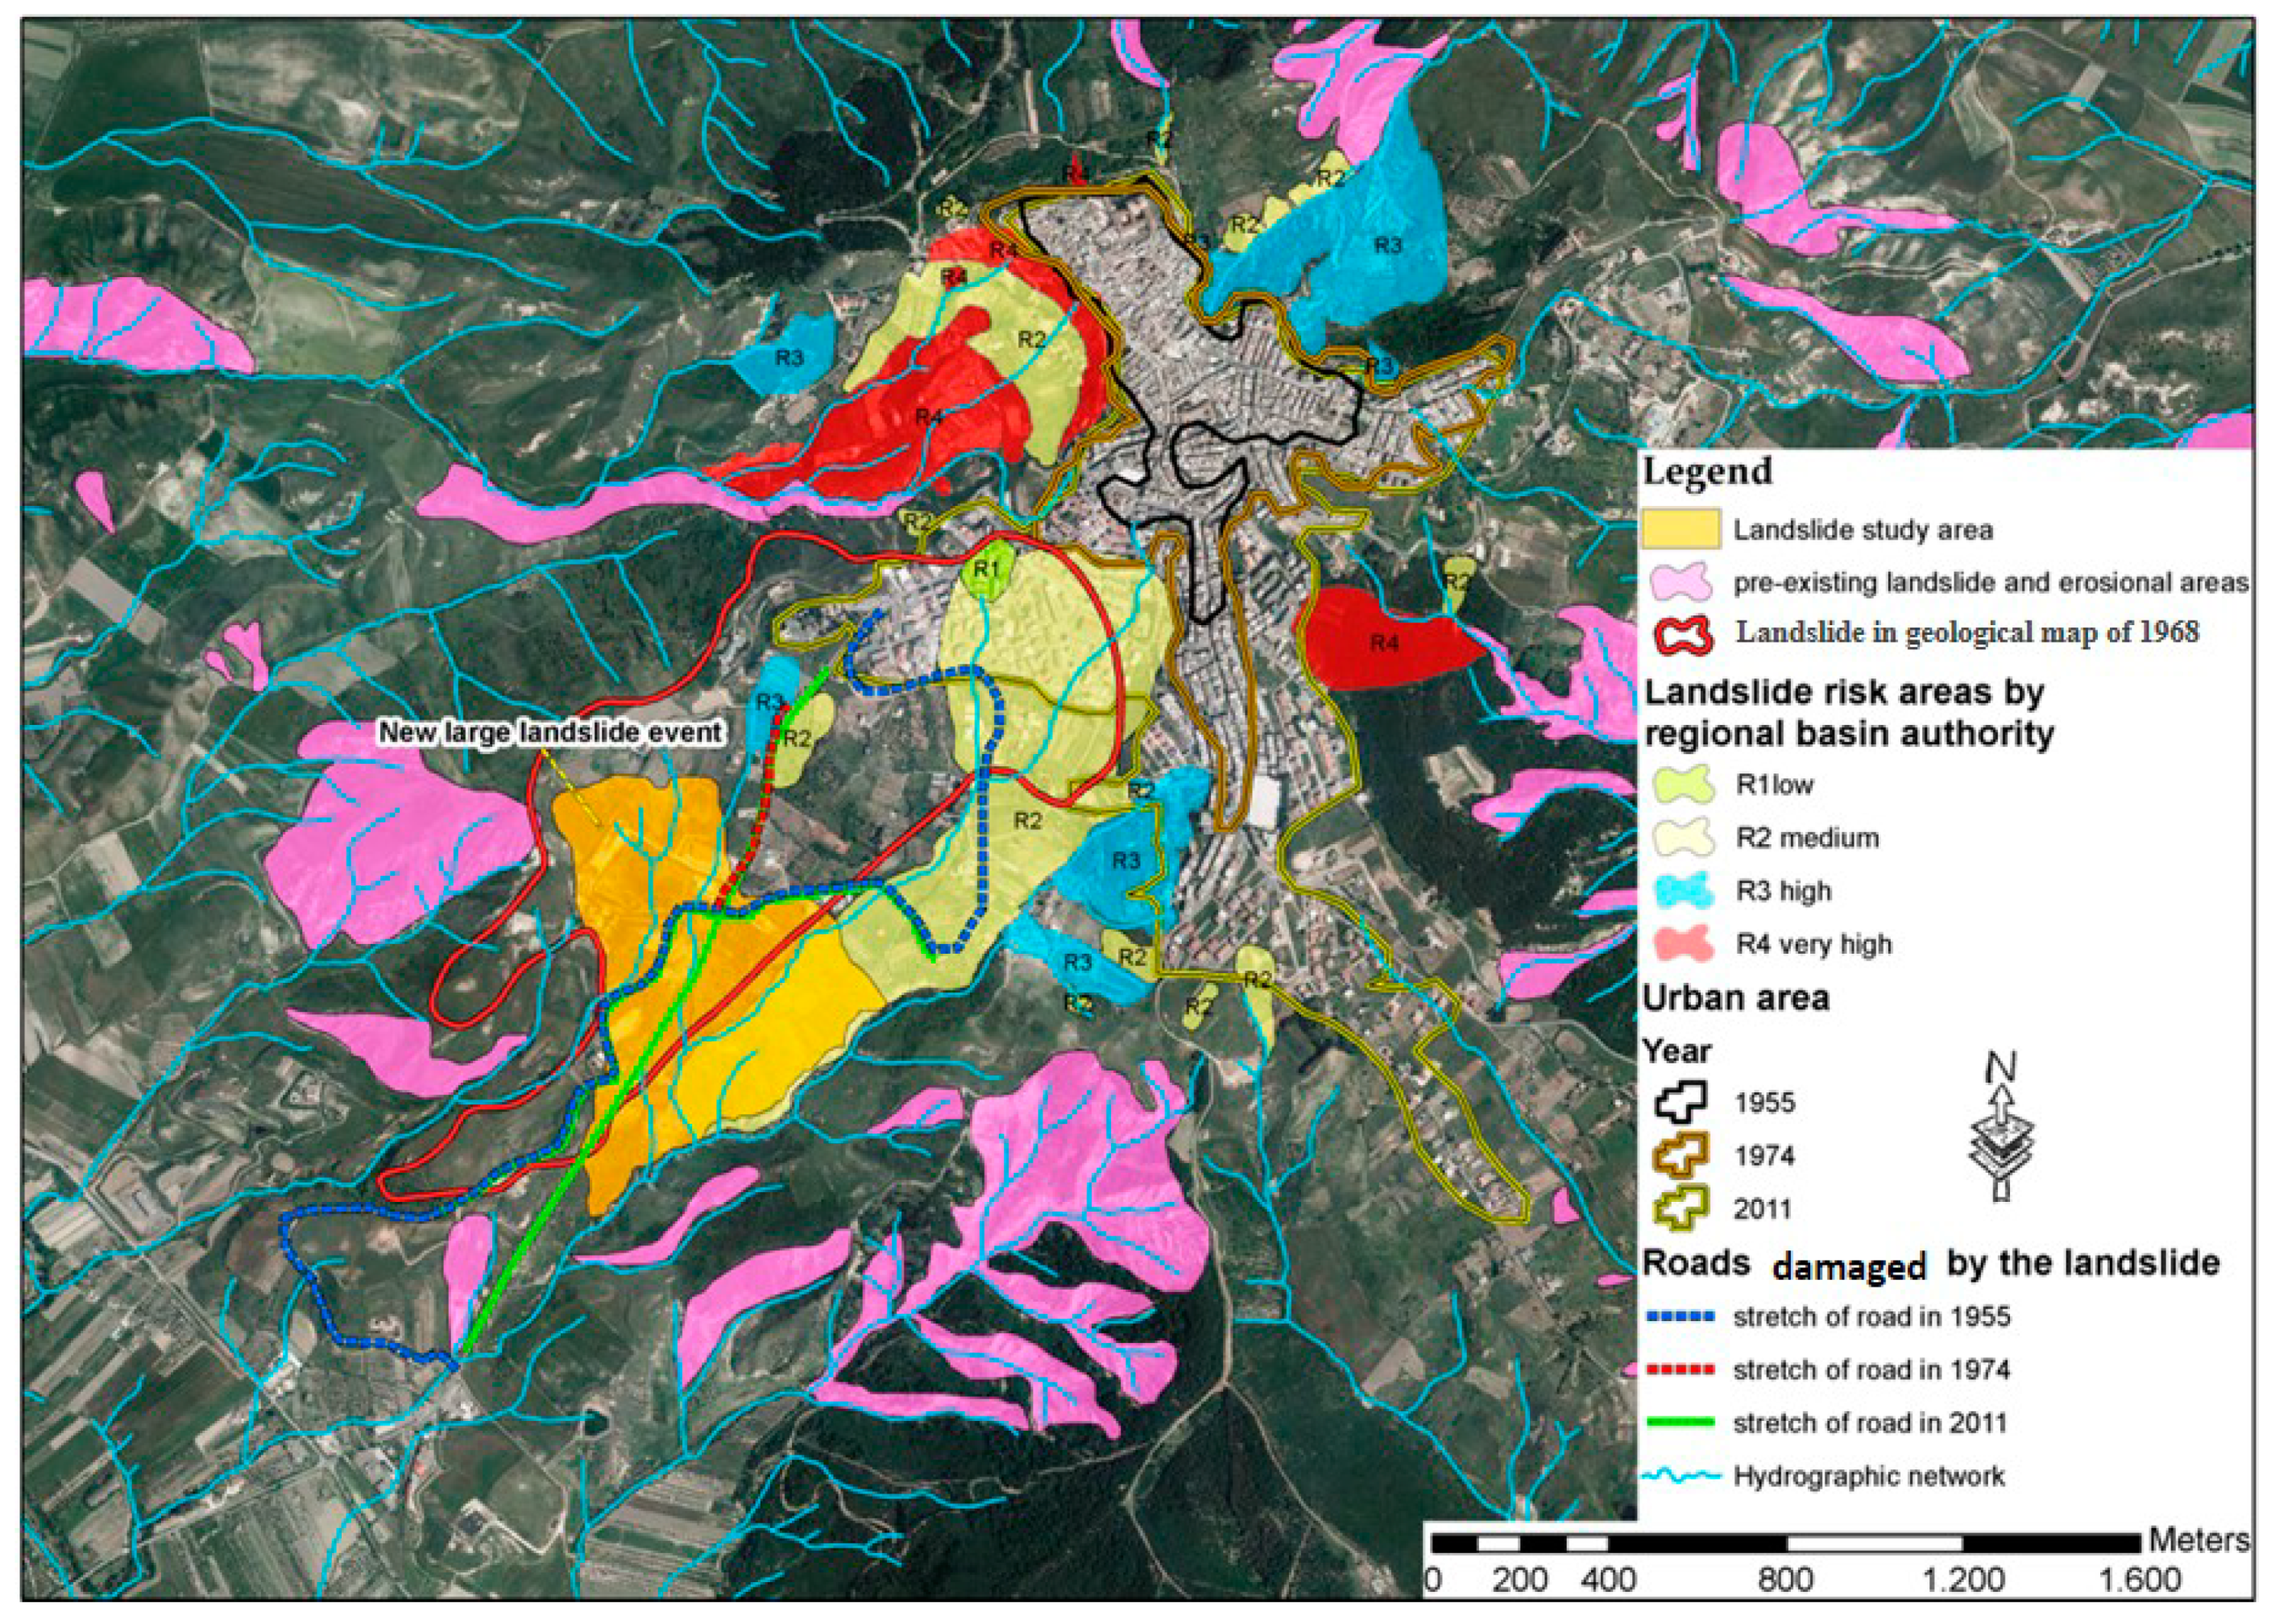
Figure 3.
The figure shows the overlapping between the landslide risk areas by regional basin authority of Basilicata (R1–R4) with the old landslide mapped in the geological map of 1968 and the new landslide event. Moreover, the expansion of the urban area of Montescaglioso from 1955 to 2011 is also shown.

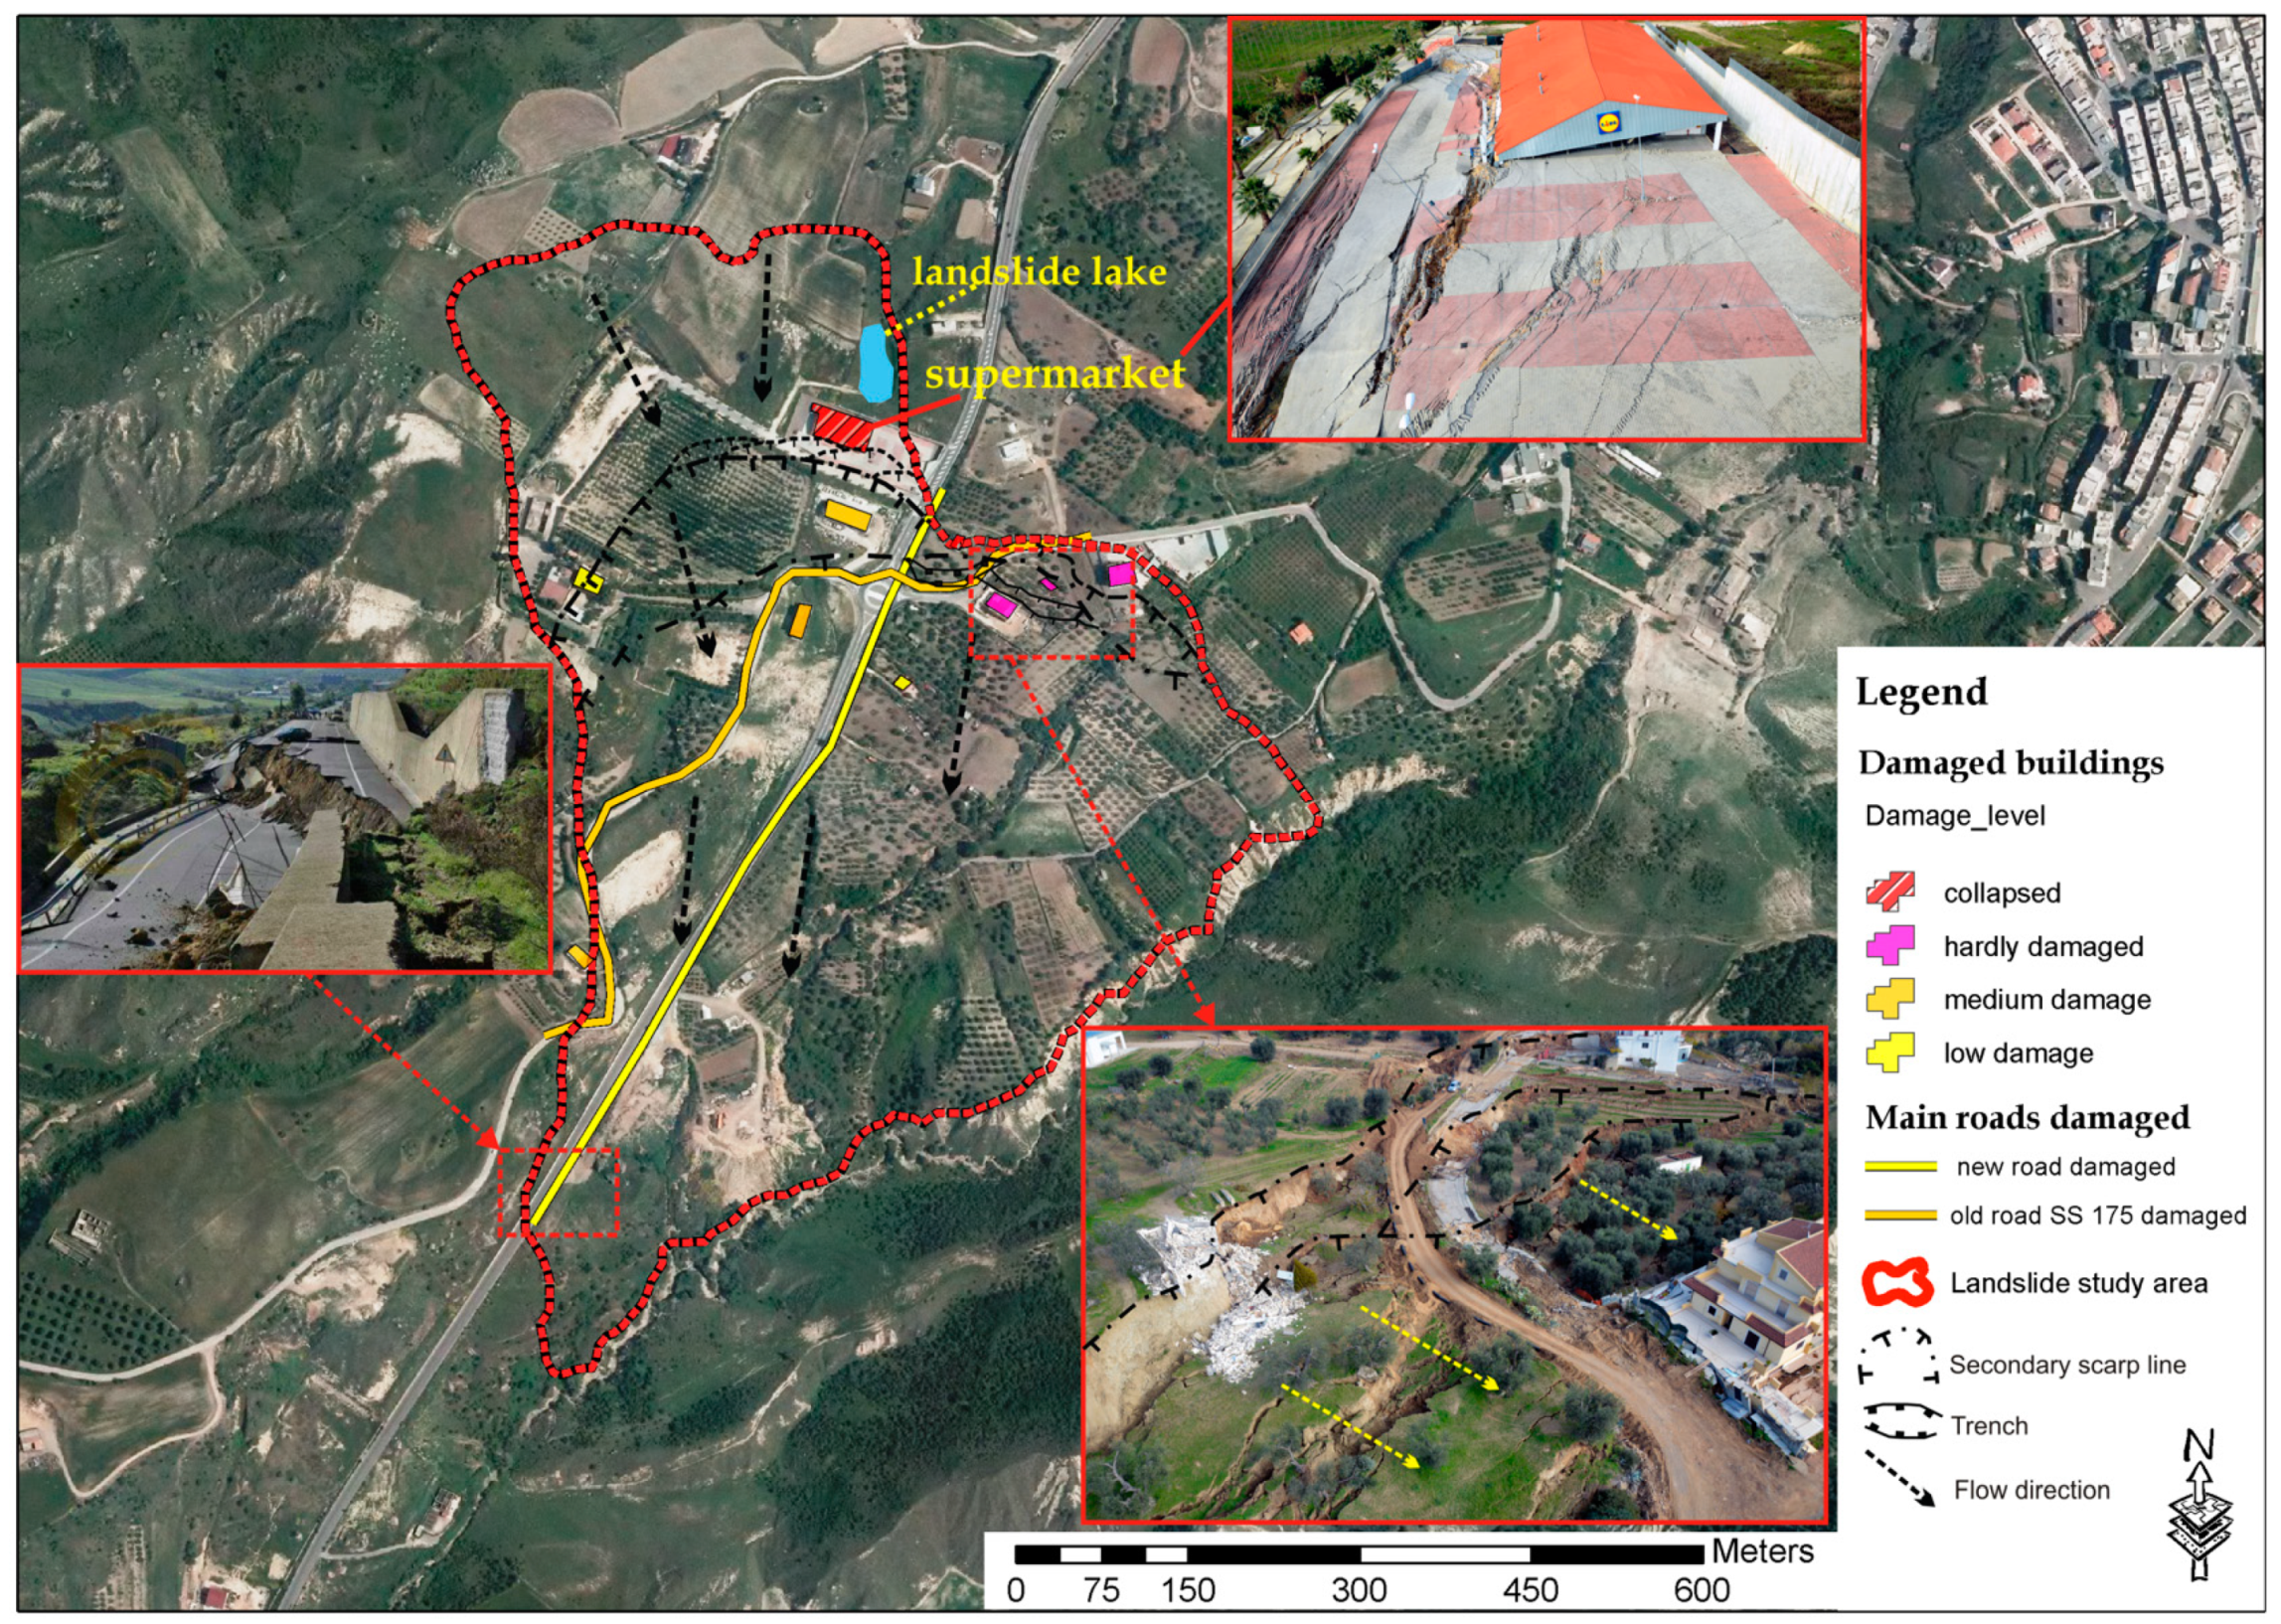
Figure 4.
Landslide map showing the main geomorphological features, the damaged buildings, the flow directions and damaged roads in the study area. In the three windows, some details of the damage caused by the landslide, detected by UAV (Unmanned aerial vehicle) images, are also shown.
Figure 4.
Landslide map showing the main geomorphological features, the damaged buildings, the flow directions and damaged roads in the study area. In the three windows, some details of the damage caused by the landslide, detected by UAV (Unmanned aerial vehicle) images, are also shown.

Figure 5.
Susceptibility landslide map of the study area obtained by SINMAP analysis. The legend used in the figure is the one originally used by Pack et al. [21], the explanation of which is shown in Table 1.

Figure 6.
Pluviometric indices for the Montescaglioso normal rain gauge, 1984–2013.

Figure 7.
Plots of rainfall, evapotranspiration (ET), and soil moisture deficit for Montescaglioso from 1 January 2009 to 31 December 2013.
Figure 7.
Plots of rainfall, evapotranspiration (ET), and soil moisture deficit for Montescaglioso from 1 January 2009 to 31 December 2013.

Figure 8.
Hourly hydrometric height of Gravina stream (m; in gray) versus hourly rainfall (mm; in black) from 1 January 2009 to 31 December 2013 at Montescaglioso. Circles indicate landslide events.
Figure 8.
Hourly hydrometric height of Gravina stream (m; in gray) versus hourly rainfall (mm; in black) from 1 January 2009 to 31 December 2013 at Montescaglioso. Circles indicate landslide events.

Figure 9.
Hourly and cumulative rainfalls measured at Montescaglioso weather station over the period from 1 October to 23 December 2013 at Montescaglioso.
Figure 9.
Hourly and cumulative rainfalls measured at Montescaglioso weather station over the period from 1 October to 23 December 2013 at Montescaglioso.

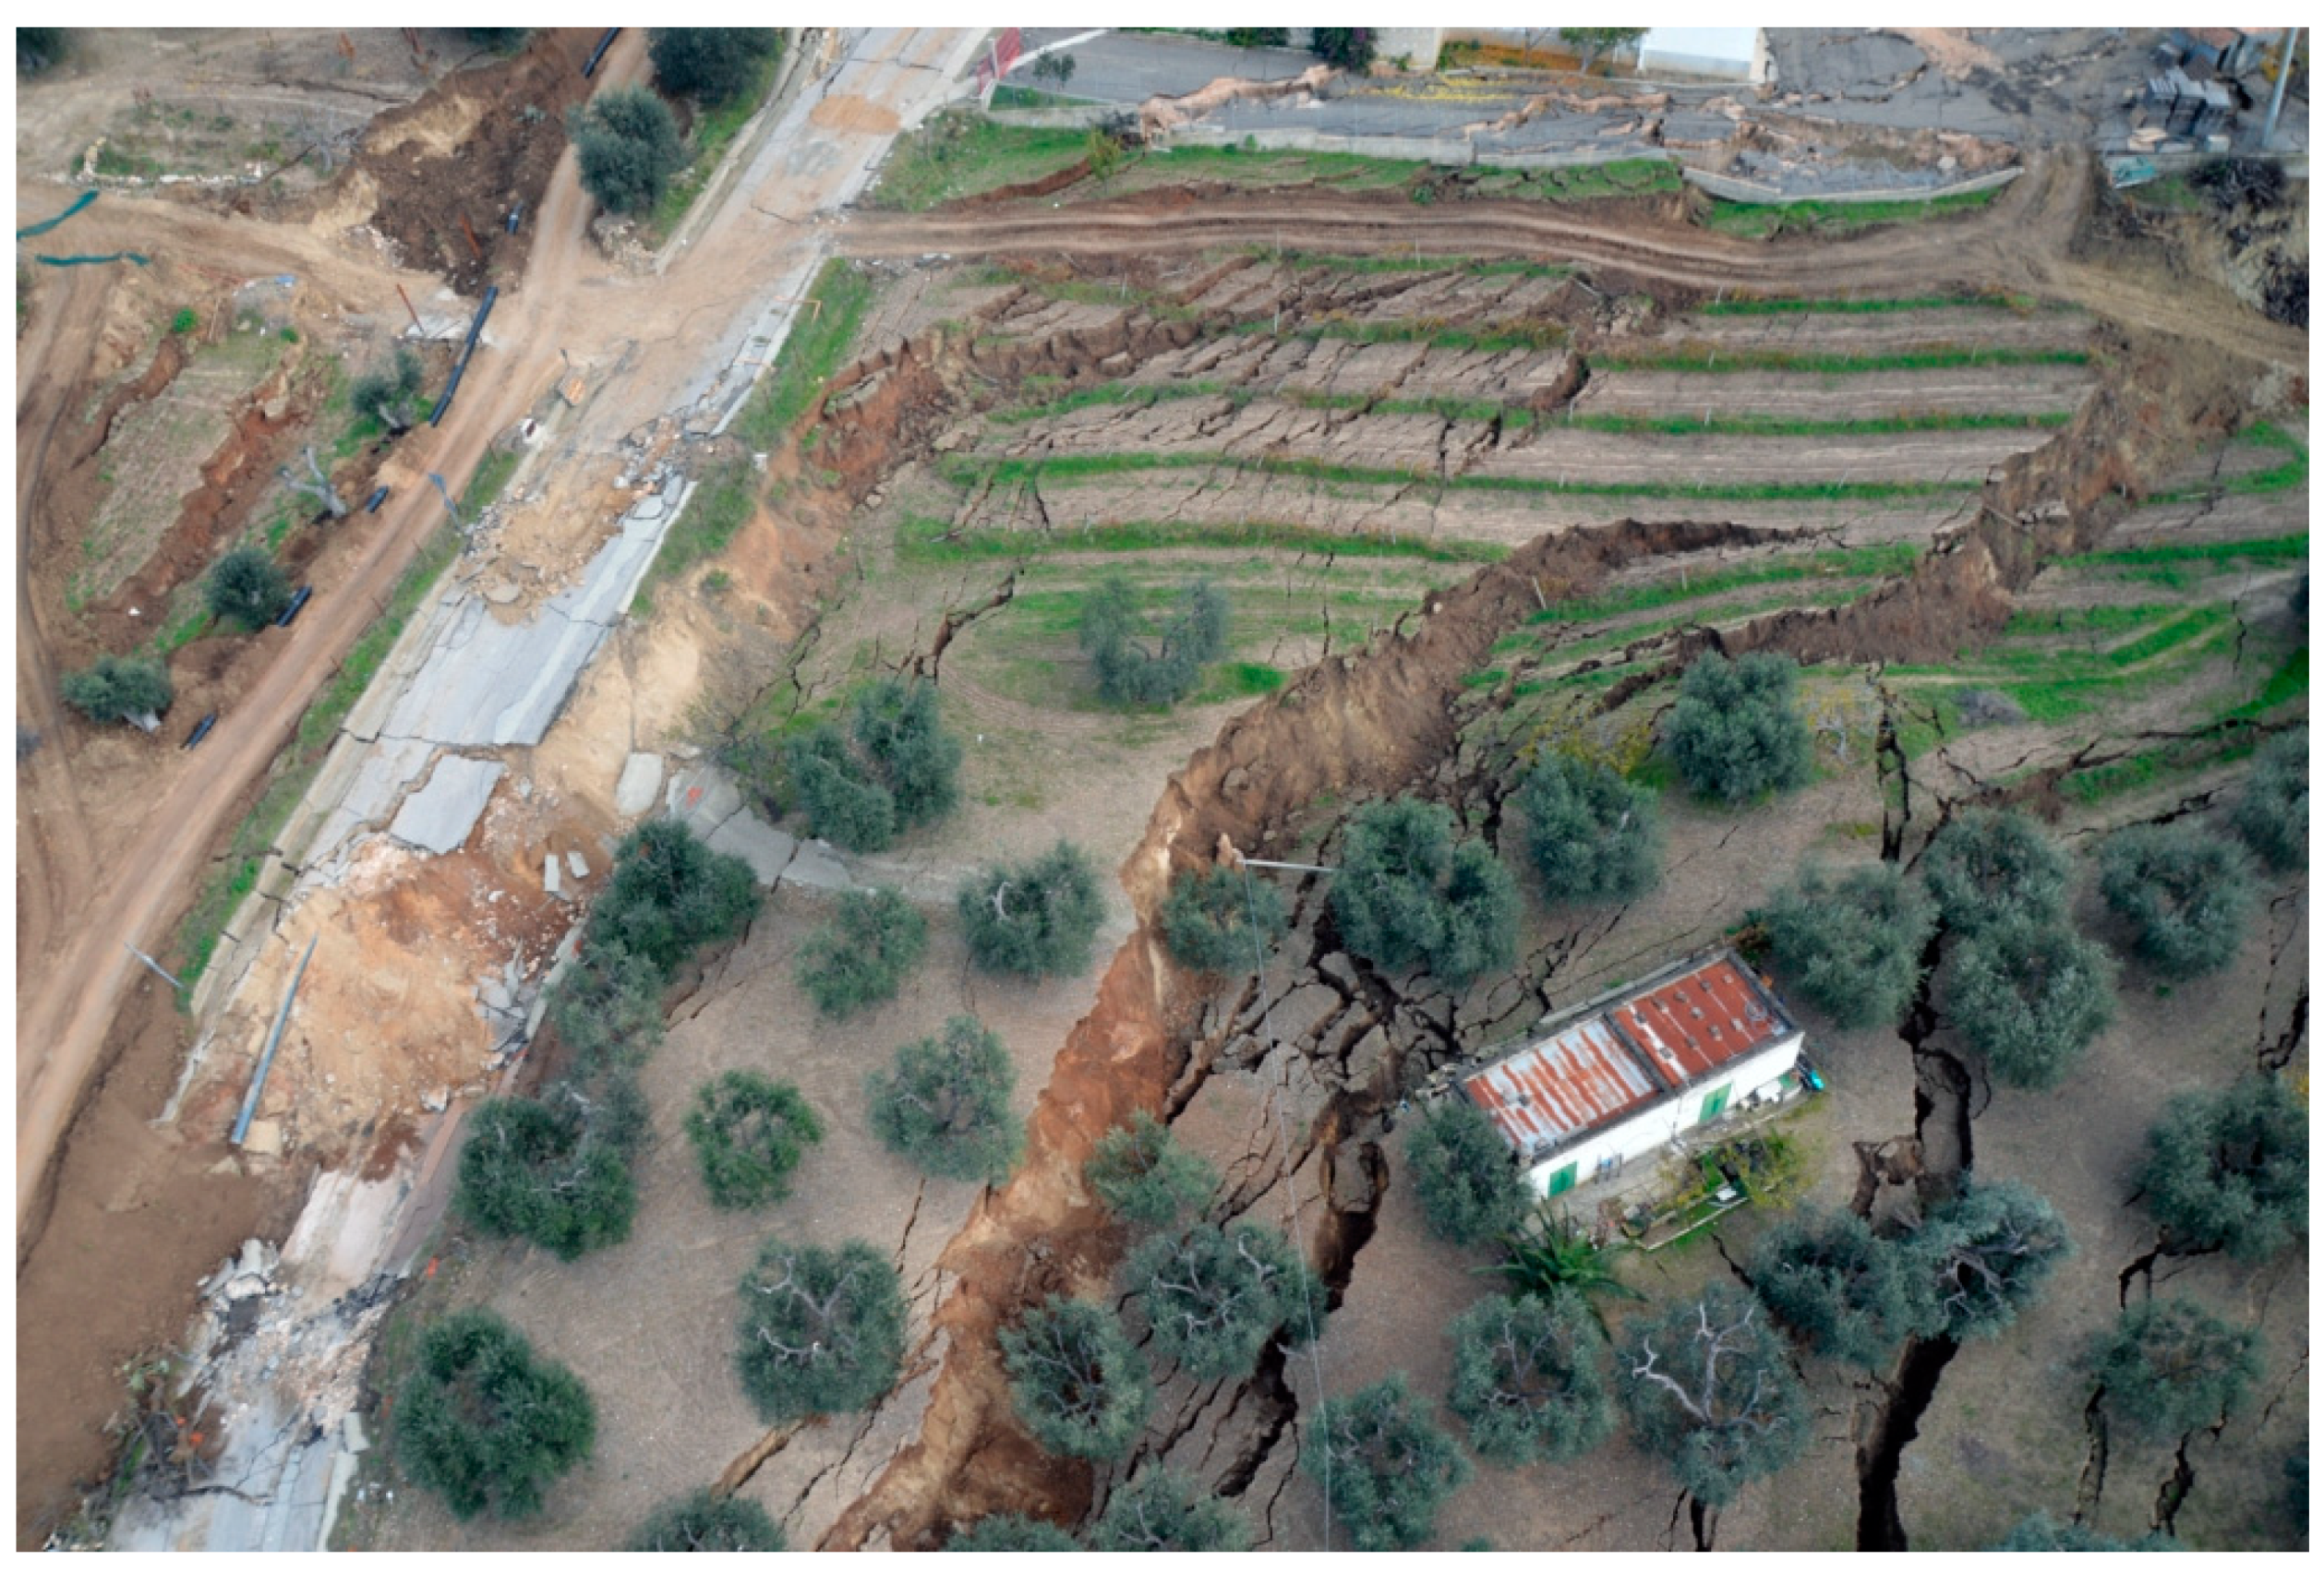
Figure 10.
The picture (UAV image) shows clear and spectacular examples of decompression and graben structures developed by the landslide with the destruction of a road and a building.
Figure 10.
The picture (UAV image) shows clear and spectacular examples of decompression and graben structures developed by the landslide with the destruction of a road and a building.


Table 1.
Classes used in SINMAP (Stability Index MAPping) to define the stability/instability of the study area.
Table 1.
Classes used in SINMAP (Stability Index MAPping) to define the stability/instability of the study area.
| Condition | Class | Predicted State | Parameter Range | Possible Influence of Factors Not Modeled |
|---|---|---|---|---|
| SI > 1.5 | 1 | Stable slope zone | Range cannot model instability | Significant destabilizing factors are required forinstability |
| 1.5 > SI > 1.25 | 2 | Moderately stable zone | Range cannot model instability | Moderate destabilizing factors are required forinstability |
| 1.25 > SI > 1.0 | 3 | Quasi-stable slope zone | Range cannot model instability | Minor destabilizing factors could lead to instability |
| 1.0 > SI > 0.5 | 4 | Lower threshold slope zone | Pessimistic half of range required for instability | Destabilizing factors are not required forinstability |
| 0.5 > SI > 0.0 | 5 | Upper threshold slope zone | Optimistic half of range required for stability | Stabilizing factors may be responsiblefor stability |
| 0.0 > SI | 6 | Defended slope zone | Range cannot model stability | Stabilizing factors are required for stability |
Table 2.
Synthesis of the geotechnical parameters used for the 4th classes considered in SINMAP.
| VALUE | COUNT | REGION | Lithological Classes | T_R MIN | T_R MAX | Coesion MIN | Coesion MAX | PHI MIN | PHI MAX |
|---|---|---|---|---|---|---|---|---|---|
| 1 | 125,759 | Region 1 | Heterogeneous alluvial deposits | 2000.0 | 3000.0 | 0.12 | 0.28 | 20.12 | 23.15 |
| 2 | 147,756 | Region 2 | Clay formations consist of marly and silty clays | 2000.0 | 3000.0 | 0.15 | 0.47 | 15.00 | 26.00 |
| 3 | 143,331 | Region 3 | Conglomerates with alternating sandy-loam levels | 2000.0 | 3000.0 | 0.00 | 0.42 | 27.00 | 36.00 |
| 4 | 18,033 | Region 4 | Very cemented sandstones | 2000.0 | 3000.0 | 0.00 | 0.25 | 32.00 | 33.00 |
© 2018 by the authors. Licensee MDPI, Basel, Switzerland. This article is an open access article distributed under the terms and conditions of the Creative Commons Attribution (CC BY) license (http://creativecommons.org/licenses/by/4.0/).
Share and Cite
MDPI and ACS Style
Lazzari, M.; Piccarreta, M. Landslide Disasters Triggered by Extreme Rainfall Events: The Case of Montescaglioso (Basilicata, Southern Italy). Geosciences 2018, 8, 377. https://doi.org/10.3390/geosciences8100377
AMA Style
Lazzari M, Piccarreta M. Landslide Disasters Triggered by Extreme Rainfall Events: The Case of Montescaglioso (Basilicata, Southern Italy). Geosciences. 2018; 8(10):377. https://doi.org/10.3390/geosciences8100377
Chicago/Turabian StyleLazzari, Maurizio, and Marco Piccarreta. 2018. "Landslide Disasters Triggered by Extreme Rainfall Events: The Case of Montescaglioso (Basilicata, Southern Italy)" Geosciences 8, no. 10: 377. https://doi.org/10.3390/geosciences8100377
Note that from the first issue of 2016, this journal uses article numbers instead of page numbers. See further details here.