Article

Enhanced Characterization of the Krania–Elassona Structure and Functioning Allogenic Karst Aquifer in Central Greece

by
Antonios Manakos
1,
Maria Margarita Ntona
2,
Nerantzis Kazakis
2,* and
Konstantinos Chalikakis
3
1
Aristotelous 46, 57013 Thessaloniki, Greece
2
Lab. of Engineering Geology and Hydrogeology, School of Geology, Aristotle University of Thessaloniki, 54124 Thessaloniki, Greece
3
UMR 1114 EMMAH (INRA-UAPV), 301 rue Baruch de Spinoza, 84916 Avignon, France
*
Author to whom correspondence should be addressed.
Geosciences 2019, 9(1), 15; https://doi.org/10.3390/geosciences9010015
Submission received: 12 November 2018 / Revised: 16 December 2018 / Accepted: 17 December 2018 / Published: 27 December 2018

Abstract

:
The present study highlights the importance of geological, hydrogeological, and hydrogeochemical characterization of a karst aquifer in building a conceptual model of the system. The karst system of Krania–Elassona in central Greece was chosen for this application. Hydrogeological research included geological mapping and hydrogeological analysis. Additionally, hydrochemical analysis of water samples was performed in boreholes, rivers, and the system’s main spring. The Krania–Elassona aquifer consists of three horizons of marbles and is characterized by mature karstification. The karst aquifer is characterized by allogenic recharge mainly from the River Deskatis that accounts for up to 92% of the total flow. Groundwater and spring water are generally characterized as good quality and are suitable for irrigation and domestic use. The water type of the spring water is classified as Mg-HCO3. The application of a SARIMA (Seasonal Autoregressive Integrated Moving Average Model) model verified the conceptual model and successfully simulated spring discharge for a two-year period. The results of this study highlight the importance of basic hydrogeological research and the initial conceptualization of karst systems in reliably assessing groundwater vulnerability and modeling.

1. Introduction

Karst aquifers are a valuable source of fresh water worldwide [1] but are usually characterized by high vulnerability rendering them prone to external pollution [2]. Additionally, karst aquifers are susceptible to quantitative deterioration due to overexploitation [3]. However, they rarely coexist with human activities potentially harmful to groundwater and hence retain a good qualitative status. Nevertheless, increasing livestock activities and demands for agricultural land result in land use changes above karst hydrosystems and the abstraction of groundwater from these complex geological environments has increased along with their pollution risk.
In Greece, karst aquifers are of utmost importance as they sustain the water supply for agricultural, domestic, and industrial activities. Additionally, they significantly contribute to surface river runoff. However, in some cases surface runoff recharges the karst aquifers and contributes to the sustainability of these systems. The main karst hydrosystems are located in the western part of Greece where high levels of precipitation are observed and water demands are lower than in the eastern part of the country [4]. The exploitation of these systems is direct via spring discharge or wells. The majority of Greek karst aquifers are characterized by good qualitative and quantitative status. The challenge is to sustain this status and adopt a sustainable management plan for future years [5].
Groundwater pollution of karst aquifers depends on: (1) aquifer structure and hydrodynamic function, (2) the nature of the pollutant(s), and (3) the hydrological regime [6,7,8]. Therefore, an interdisciplinary approach is necessary for the protection of karst aquifers [9]. Prevention is the most convenient strategy against groundwater pollution. Vulnerability maps are prevention tools that can be used as the basis for land use changes, well allocation, and the design of monitoring plans [10,11]. Several methods exist for the assessment of groundwater vulnerability in karst aquifers, and some of the most well-known of these are PaPRIKa [12,13], EPIK [14], PI [15], the European Approach [16], VULK [17], and COP [18]. Nevertheless, the assessment of groundwater vulnerability requires detailed hydrogeological research that combines both field measurements and analysis. In Greece, aquifer vulnerability mapping has improved significantly in the last decade due to technological advances in geographic information systems (GIS) and many different methods have been applied to specific karst aquifers [5]. However, the lack of detailed hydrogeological analysis and elaboration of existing data has been a limiting factor for the assessment of groundwater vulnerability, especially in allogenic karst hydrosystems.
The quantitative status of karst aquifers is critical for the sustainable water supply of a region. Forecasting karst spring discharge contributes to decision-making regarding abstraction from the system. Stochastic models, known as Box–Jenkins or seasonal and nonseasonal ARIMA (Auto Regressive Integrated Moving Average) models are useful for predicting karst spring discharge and have also been applied in other scientific, economic, and engineering applications for time series analysis and forecasting [19]. Some useful applications of these models can be found in the literature for the simulation of time series of flow data, groundwater head, and water quality parameters [19,20,21,22,23,24,25,26,27,28]. SARIMA models have become very popular due to their simple mathematical structure, convenient representation of data in terms of a relatively small number of parameters, and their applicability to both stationary and nonstationary processes.
An initial conceptual model is essential to assess a karst aquifer qualitatively and quantitatively. In recent years, the use of a wide variety of certain models and methods has resulted in underrating the importance of building conceptual models. Field work and qualitative analysis are often lacking and, hence, the evaluation and verification of simulation, statistical, and vulnerability models is based mainly on statistical indicators alone.
This study aims to highlight the importance of building an integrated conceptual model in order to fully comprehend the function of a karst hydrosystem. The Krania–Elassona allogenic karst hydrosystem located in central Greece was chosen as a case study and its hydrogeological regime was determined. Enhanced characterization of its structure and functioning constitutes the required basic, initial step before proceeding with statistical analyses, hydrodynamic modeling, and vulnerability and risk assessments. Additionally, SARIMA models were applied to test the conceptual model of the Krania–Elassona allogenic karst hydrosystem that was derived from the initial hydrogeological analysis.

2. Materials and Methods

2.1. Study Area

The karst aquifer of Krania–Elassona is located in central Greece (Figure 1). Its catchment basin covers an area of 118 km2. The main cities in the study area are Elassona and Krania, while many small villages occur in the wider area (e.g., Kefalovriso and Valanidia). The region’s climate is classified as continental, with cold dry winters and hot summers. According to data from the meteorological station of Elassona, the mean annual temperature is 13.7 °C and the mean annual precipitation recorded from 1974 to 1993 was 506 mm. The water demands of Elassona, Krania, Kefalovriso, and Valanidia are met exclusively by groundwater from the karstic aquifer of Krania.
According to census data of the Hellenic Statistical Authority (2011), the permanent population of these settlements is about 14,500. Agriculture and livestock farming are the main economic activities occurring within the study area. Two rivers, Deskatis and Palaiomantanos, cross the north and south parts of the karst aquifer, respectively. The presence of the karst aquifer ensures the water supply and socioeconomic development of the study area. Moreover, the allogenic recharge of the karst aquifer is of special interest as such systems have rarely been investigated in Greece.

2.2. Hydrogeological Research

Determination of the hydrogeological regime of a karst aquifer constitutes the initial and possibly the most important stage to be performed before statistical analysis, hydrodynamic modeling, and vulnerability mapping. Hence, field work including geological mapping, measurement of tectonic features, hydrogeological mapping of karst features, groundwater water level measurements, groundwater sample collection, and pumping tests were carried out in the study area. The field work was supplemented with a detailed literature review and the evaluation of geoelectrical soundings and lithological profiles from previous studies [29], digitization of the geological and topographic maps in a GIS environment, creation of the site’s digital elevation map, and analysis of the hydrochemical data using Aquachem and pumping tests.
Geological mapping was performed to update and verify the existing geological maps [30]. Geological mapping also helped identify the presence of marble horizons within the aquifer. Identification of tectonic features in the wider area is critical to determine the structure of the karst aquifer. Hence, faults, lineaments, and the stratification of the geological formations were identified to verify the existing data and/or include new features in the geological map.
Groundwater level measurements were taken from eleven wells, and the surface water flow of R. Deskatis was measured in three sites: the first located in the upper boundary of the aquifer, the second in the center of the system, and the third at the aquifer’s outlet. Spring discharge was measured daily for four consecutive years (1989–1993) followed by monthly measurements until 2017. Hydrochemical analysis was performed in four groundwater samples, one from Kefalovriso spring and three from Deskatis River (Figure 1).

2.3. SARIMA Models

SARIMA models were used to simulate the discrete time series of monthly discharge values at Kefalovriso spring (1974–1993) for the Krania–Elassona karst aquifer. Their suitability to forecast monthly discharge values was also investigated. The most suitable SARIMA model was then used to forecast monthly discharge values of Kefalovriso spring for a two-year period (1992–1993).
For the description of the seasonal SARIMA models (Seasonal Autoregressive Integrated Moving Average), the notations (p, d, q) (P, D, Q)S were used.
Where or with p = non-seasonal AR order, d = non-seasonal differencing, q = non-seasonal MA order, P = seasonal AR order, D = seasonal differencing, Q = seasonal MA order, and S = time span of repeating seasonal pattern.
Without differencing operations, the model could be written more formally as
Φ(BS)φ(B)(xt − μ) = Θ(BS)θ(B)et
The non-seasonal components are:
AR: φ(B) = 1 − φ1B − … − φpBp and MA: θ(B) = 1 + θ1B + … + θqBq.
The seasonal components are:
Seasonal AR: Φ(BS) = 1 − Φ1BS − … − ΦPBPS and Seasonal MA: Θ(BS) = 1 + Θ1BS + … + ΘQBQS.
Note that on the left side of Equation (1) the seasonal and non-seasonal AR components multiply each other, and on the right side of Equation (1) the seasonal and non-seasonal MA components multiply each other.
Application of the SARIMA models requires stationarity of time series data obtained by different transformations. Logarithmic transformation is chosen to stabilize series variance and transform the usually skewed distribution into a normal distribution.
The construction of SARIMA models requires stages of identification, estimation, and diagnostic checking [19,20,31]. The purpose of the identification stage is to determine the differencing required to produce stationarity and to estimate the order of both the seasonal and nonseasonal AR and MA operators (p, d, q, P, D, Q) for the stationary series. The identification is examined by the cumulative periodogram [C(fk)], the autocorrelation function (ACF), and the partial autocorrelation function (PACF) [19]. This information is then used to determine the general form of the univariate model to be fit. The estimation stage involves the estimation of the time series model parameters. This estimation is obtained by the residual sum of squares minimization using the Marquardt optimization algorithm for nonlinear least squares.
The value of the parameters is associated standard errors, T-values, and P-values. Finally, diagnostic checking involves examination of the residuals fitted model which can, or cannot, prove the model’s inadequacy and also provide information regarding model improvement. This determination can be achieved by using the identification stage tests and, furthermore, the Portmanteau test [32], the Akaike Information Criterion (AIC) [33] and the residual variance (σe2). For the log transformed series, the AIC criterions are given, respectively, as:
AIC = N ln σ e 2 + 2 n + 2 N ln Z t ¯
where σe2 is the estimated residual variance, ln Z t ¯ is the sample mean of the logarithms of measured values, and n is the number of parameters.
For a SARIMA model, the number of parameters n is given as:
n = p + P + q + Q + p P + q Q + 1

3. Results and Discussion

3.1. Geological and Geomorphological Settings

The karst aquifer is crossed by the River Deskatis in the north and the River Palaiomantanos in the south. The hydrological basin of River Deskatis covers an area of 192 km2 and crosses the karst aquifer for a distance of 19 km. The mean altitude is 759 m and the mean slope is 24.93%. The basin has a well-developed dendritic drainage network. The hydrological basin of River Palaiomantanos coincides with the karst aquifer over a relatively short zone (1000 m).
The study area belongs to the Pelagonian geotectonic zone, which consists of an underlying slightly transformed carbonate series known as the “Krania Carbonate Unity” [34,35] and the “Pelagonian tectonic cover”. The latter tectonic cover comprises pro-alpine and alpine geological formations (gneiss, gneiss–schist, ortho–gneiss and marble layers) with plutonium boulders [36]. These formations are stone-paved in the Pelagonian zone and are covered by the Krania carbonate series. The “tectonic window” of Krania is the geological background of the Kam37vounion mountain range. It is distinguished by the appearance of three lithostromatographic horizons [30]:
  • Lower horizon: The lower horizon occupies the eastern part of the tectonic window. It consists of medium- to thick-bedded, coarse to microcrystalline marbles, locally dolomitic, and is of light grey to white-grey color with a thickness of about 750 m.
  • Mid horizon: The marbles of the intermediate horizon appear to be thin-bedded, locally foliated and rarely medium-bedded. The dark grey marbles of this horizon occupy the central part of the tectonic window. Their thickness reaches 700 m.
  • Upper horizon: This horizon occupies the western part of the carbonate series and has a total thickness of about 400 m. It consists of medium-bedded and rarely thick-bedded marbles, locally dolomitic. They are mainly white in the lower parts of this horizon and grey at lesser depths. Very small percentages of lens-shaped mica schists occur in this section, which interfere with the crystalline marble of the top layer. The upper horizon is also characterized by sporadic mica schists. In many locations, such as NE of Loutro village, it is especially difficult to distinguish them from the expanded mica schists of the crystalline Pelagonian base.
The study site’s tectonic cover is divided into two horizons. The lower horizon consists of ophiolite rocks (pyroxenes, serpentinites) in lenticular form, whereas the upper horizon is characteristic of Pelagonian cover and overlies the carbonate unity of Krania. Neogene deposits (marls, clays, and conglomerates) cover the tectonic drafts created by the tensile tectonics that took place from the Miocene onwards. The Quaternary formations comprise unlinked clay–sandy materials, pebbles, conglomerates, and gravel. The floodplain deposits of the Pleio–Pleistocene are sands and clays interfered with course materials, while the alluvial Holocene deposits are of river-basin origin and consist of sands, clays with loose pebbles, conglomerates, and gravel of various compositions.
The area is a tectonic basin and the main directions of the initial faults are NE to SW. The fault of Kefalovriso is located in the southeastern part of the study area. Hence, the fault adjacent to Kleisoura village indicates the NE boundary of the karstic aquifer [22]. In the broader area of Krania’s tectonic window, only the tectonic structures created by the movements occurring during the alpine orogenetic phase of corrugations can be recognized [36]. Large anticline and convergent structures with curvature lengths of up to several kilometers can be distinguished. Their b-axes generally lie NW–SE and rarely ENE–WSW. According to the available geological maps of Elassona and Deskatis [30] and the field investigation, the following six groups of normal faults are present: (1) faults of NW–SE direction, (2) faults of NE–SW direction, (3) faults of NNE–SSW direction, (4) faults of ESE–WNW direction, (5) faults of NNW–SSE direction, and (6) faults of ENE–WSW direction. The second group (NE–SW) has played a significant role in the formation of the area’s present geology, which is also due to the discontinuation of the Krania carbonates in the east.

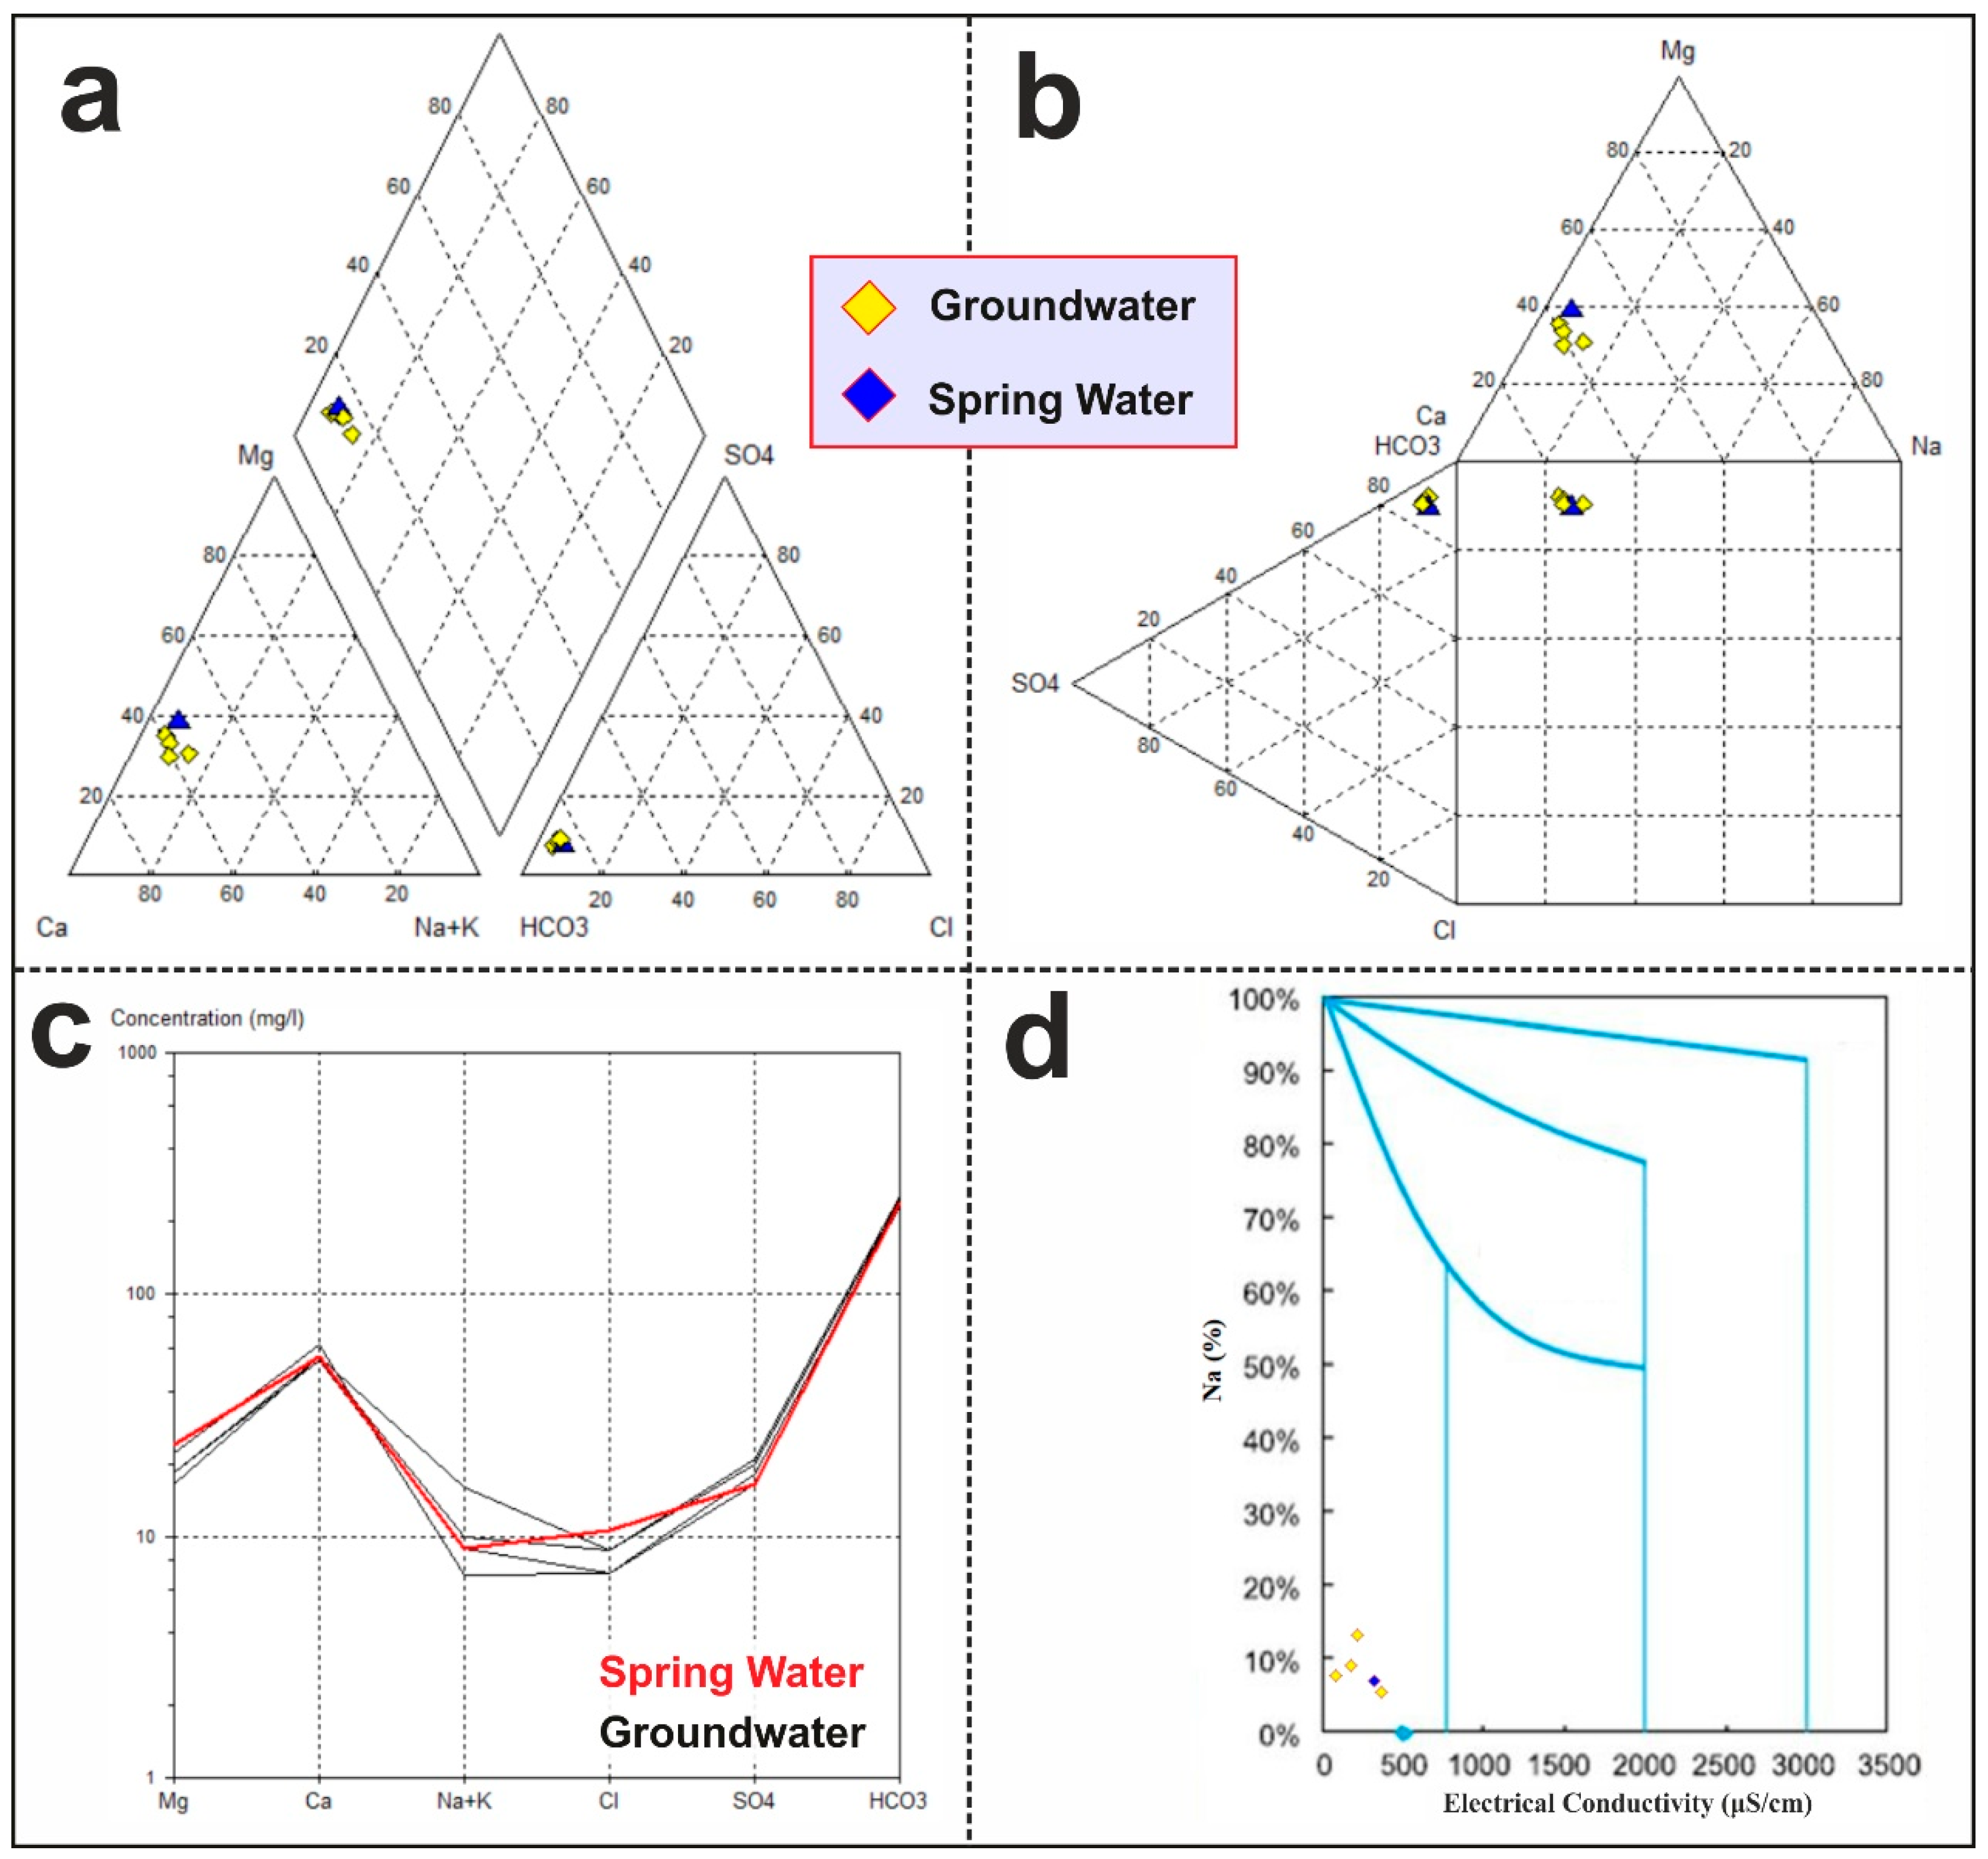
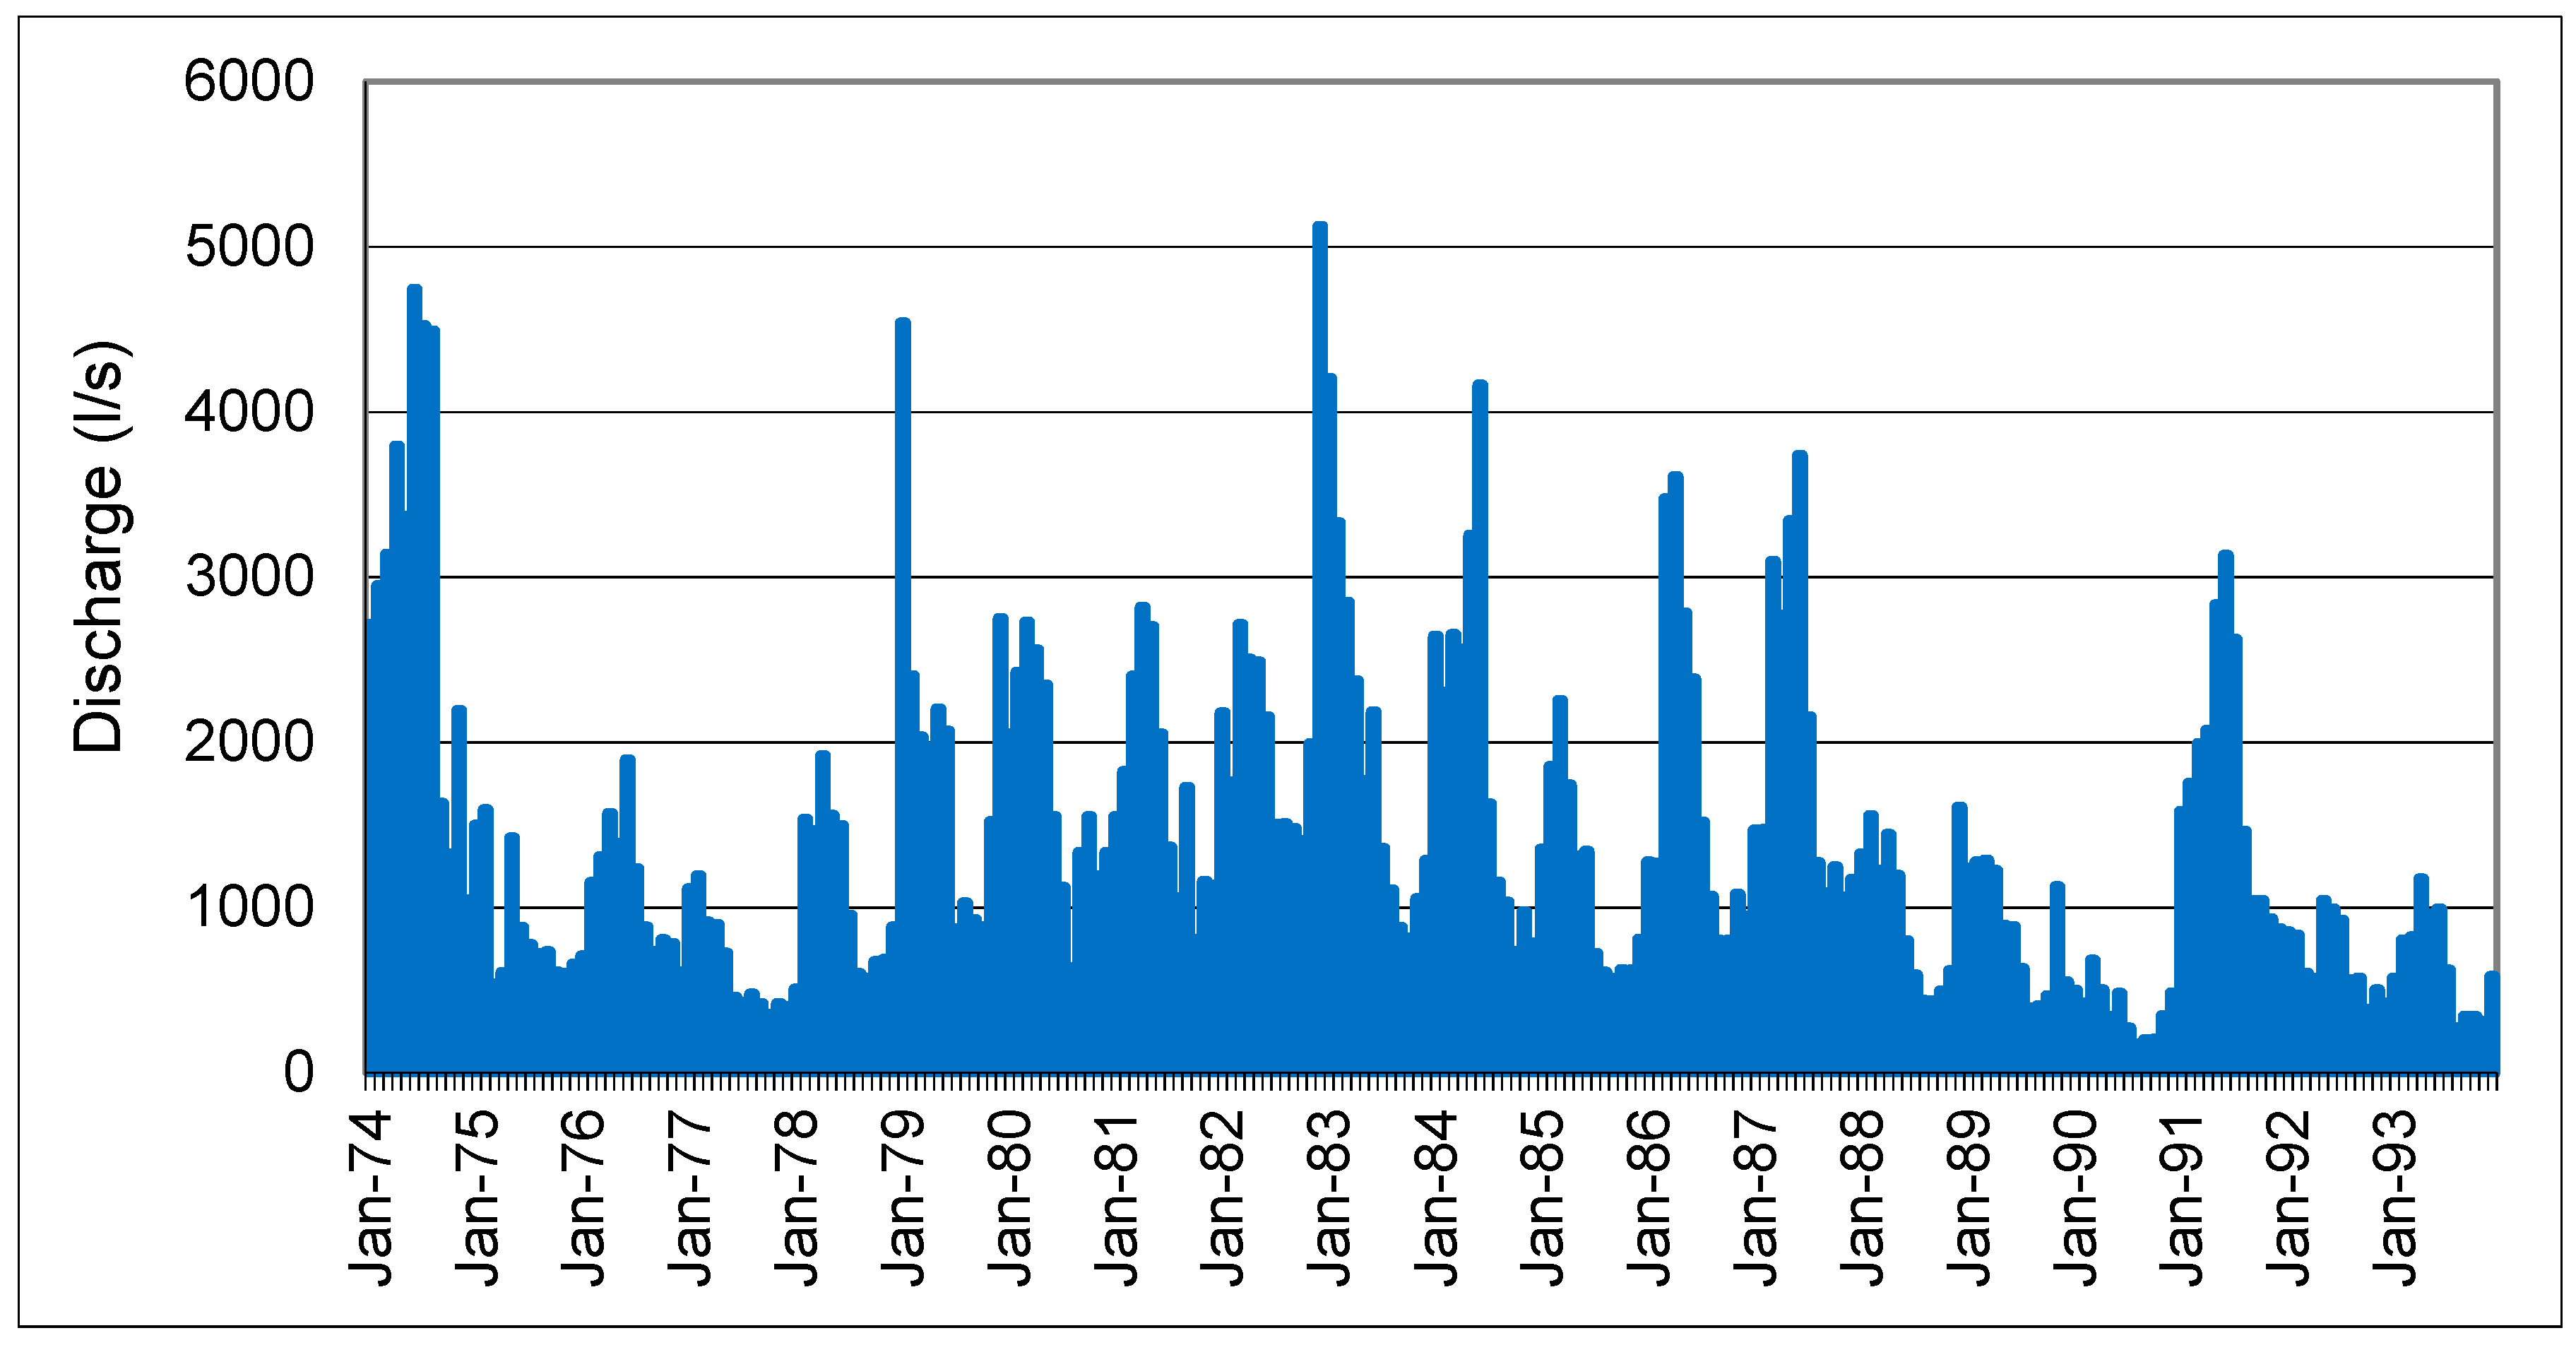
3.2. Hydrogeological Setting
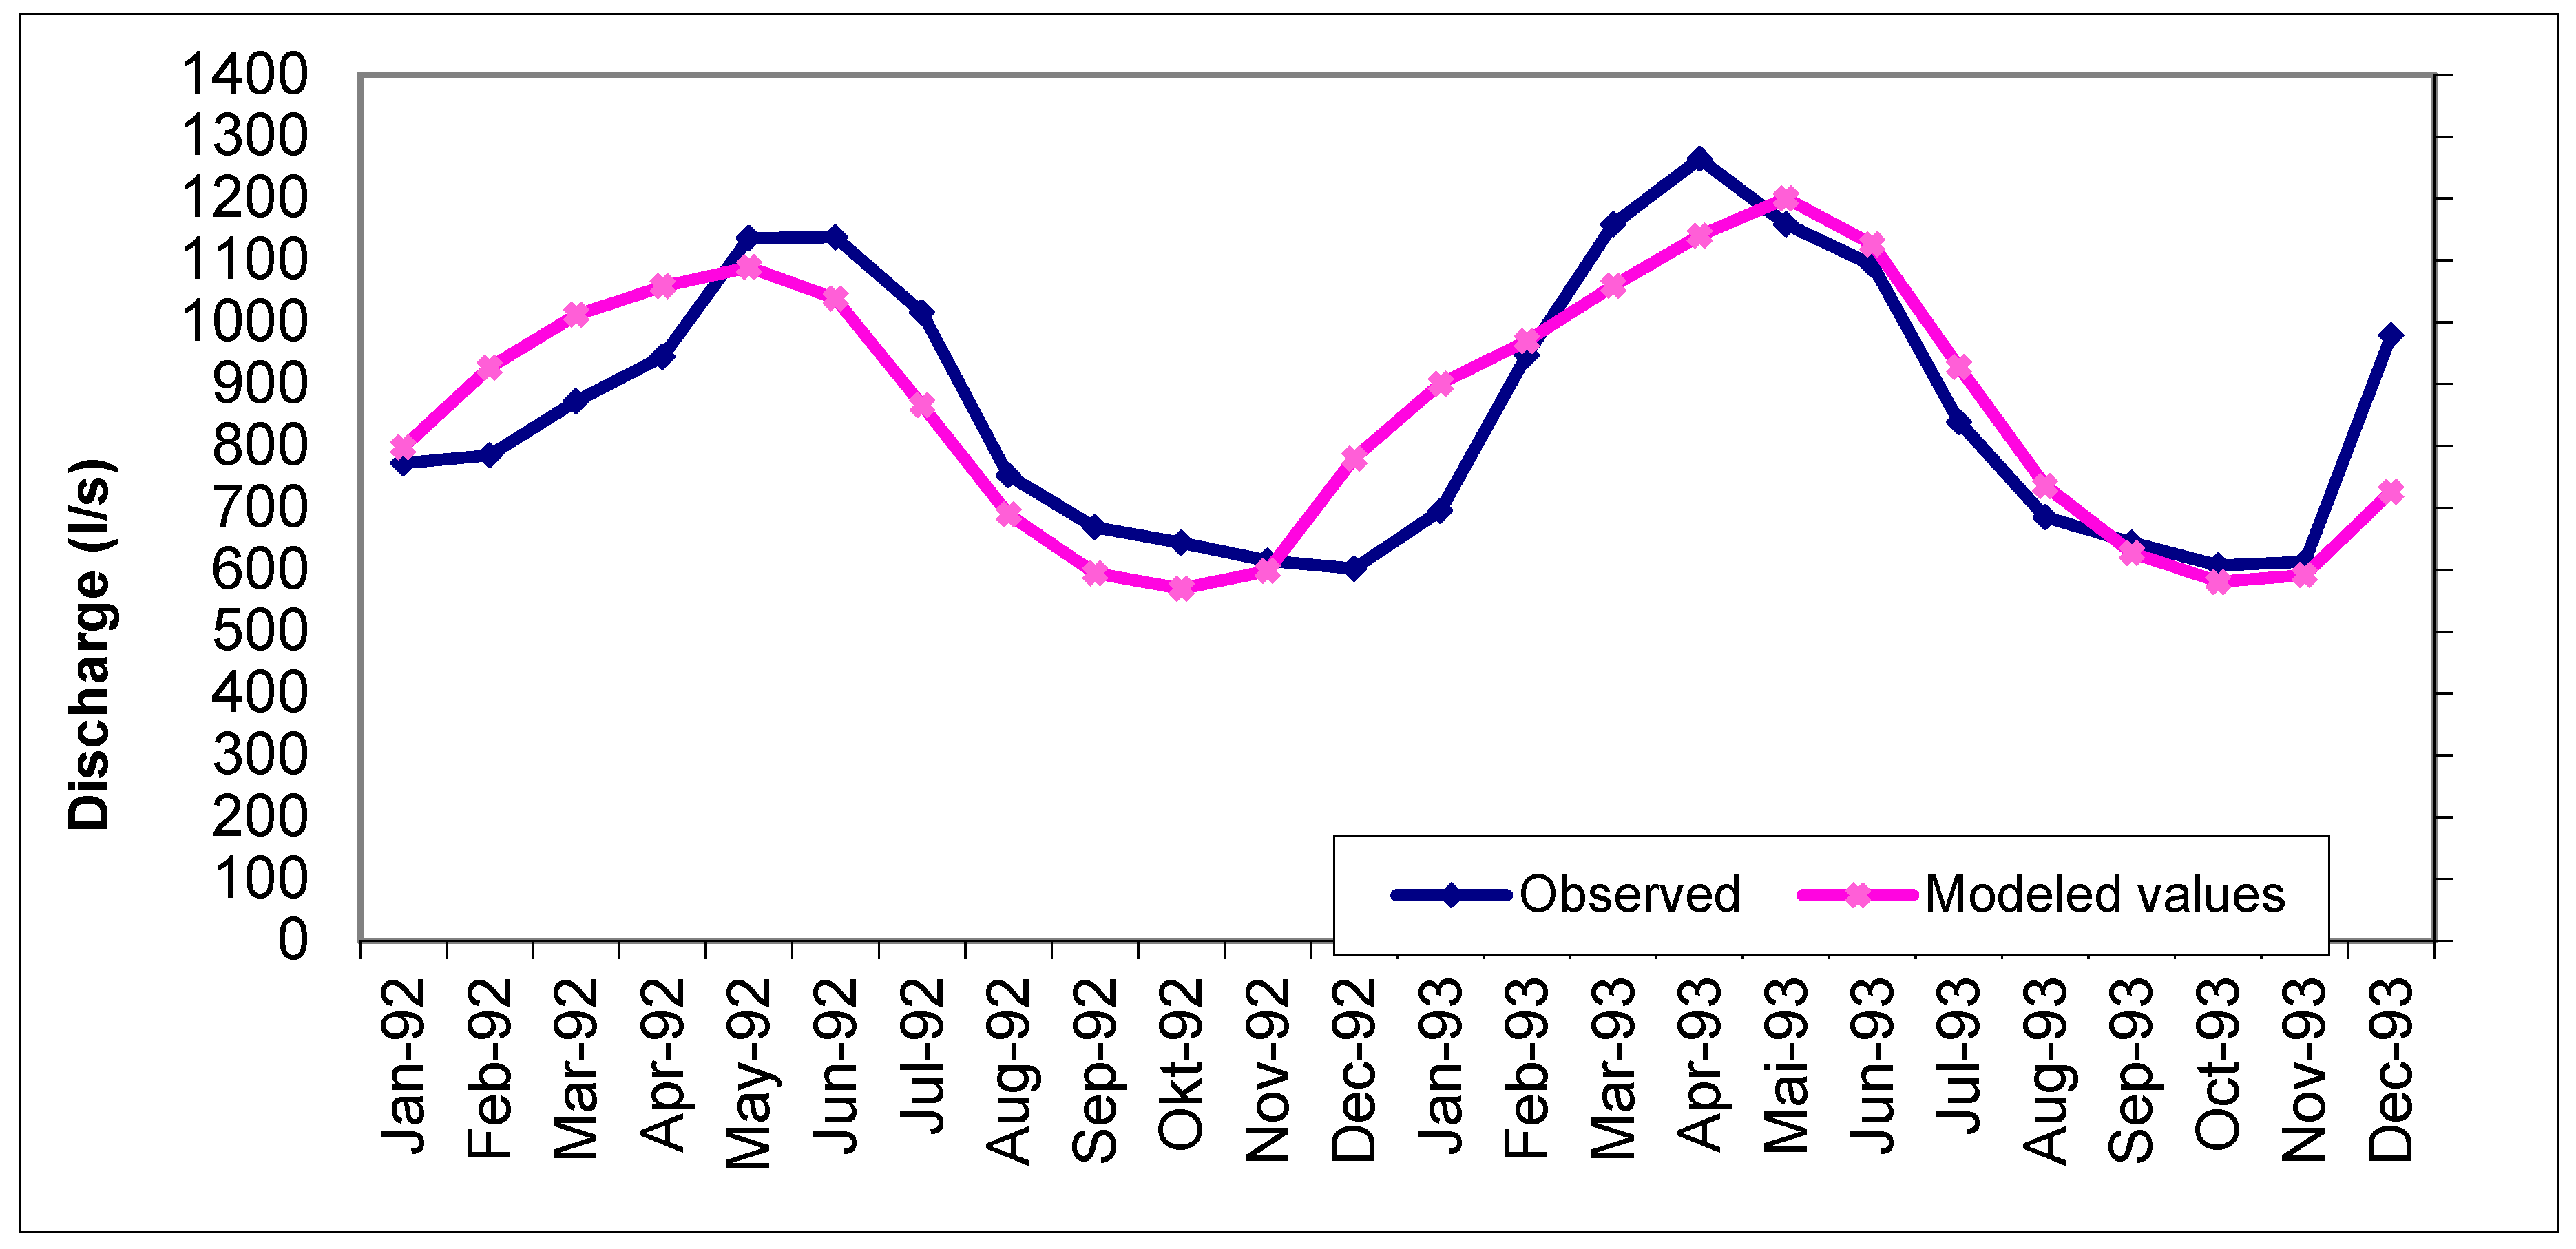
The karst aquifer of Krania–Elassona is characterized by mature karstification and consists of Mesozoic marbles. Three horizons of marbles occur within the aquifer. The upper horizon is highly karstified due to the tectonic stresses that occurred during the Pelagonian and that created adequate karstification conditions. The main karst forms are karren and dolines, the largest of which have diameters of up to 200 m and depths of 6 m. The distribution of the karst formations is basically controlled by the tectonic fractures with NW–SE and NE–SW direction. The high degree of marble karstification in the upper series was verified during drilling at depths of up to 150 m. The second horizon has similar karst formations. However, karst cavities are partially filled with red clay. In this layer, karstification reaches 300 m below the surface. The upper horizons recharge the lower horizon, while no springs are present in the first two horizons. In the lower horizon, surface karst formation rarely appears, and dolomite lines were detected during drilling. At greater depths of the lower horizon, the karstification degree is high. The aquifer is about 2000 m thick.
The central part of the karst aquifer is covered by Holocene sediments (alluvial and recent deposits), and the eastern part is covered by Neogene sediments. The aquifer has a mean elevation of 610 m and a perimeter of 62 km. The karst system is well defined by gneiss and schist outcrops located on its southern, northern, and western boundaries. The eastern boundary was delineated by using geoelectrical measurements [29]. The aquifer discharges from Kefalovriso spring. According to the pumping test, the transmissivity of the karst aquifer ranges between 1.1 × 10⁻¹ and 1.5 × 10⁻¹ m2/s, while the yield of the boreholes is up to 250 m3/h. Data from 1988 to 1993 showed that the piezometric head of the karst aquifer at this time varied from 255 to 257 m (Table 1). Groundwater flows mainly in a NW to SE direction (Figure 2); however, on the eastern edge groundwater flows from north to south parallel to the aquifer’s boundary (Figure 3). The main characteristic of the system is its allogenic recharge from the River Deskatis. Figure 4 shows the monthly discharge of the river recorded from 1989 to 1993 in three sampling sites: (1) Deskatis bridge located before the aquifer’s entrance, (2) Loutro site located 1.5 km from site 1 and within the karst aquifer, and (3) Valanida site located 12 km from site 1 and also within the karst aquifer. The three-dimensional graphic of Figure 4 presents the surface water losses that incur as they leave the crystalline rocks of the Pelagonian cover and continue to flow on the karstified marbles of the upper horizon of the Krania carbonate series.
The total surface flow recorded in the five-year period 1989–1993 at the measuring point of Deskatis bridge was 20.5 × 10⁶ m3. At the second sampling point of Loutro, the total amount of surface runoff recorded was 11.7 × 10⁶ m3, while in the third site (Valanida), surface runoff did not exceed 1.8 × 10⁶ m3. Percolation into the karst aquifer reaches 43% in the first 1.5 km of the river from its initial discharge, while at the 12 km point, up to 92% of the surface runoff percolates into the aquifer. It is worth mentioning that changes in these values are observed due to local contributions from tributaries and torrents of River Deskatis. In the south, River Palaiomantanos also crosses the karst aquifer for a distance of up to 300 m; however, it was not possible to obtain measurements in these sites. The aquifer discharges from the spring of Kefalovriso (Figure 1). The spring is a typical rising fault spring and is the only discharge point of the karst hydrosystem. Maximum discharge of the spring was recorded during the hydrological year 1990–1991 (3210 lit/sec), while the minimum discharge was recorded during the hydrological year 1989–1990 (259 lit/sec). The relatively low mean ratio between the minimum and maximum discharges recorded indicates a well-developed karst network within the aquifer. A representative hydrograph of Kefalovriso spring is presented in Figure 5. The hydrogeological analysis revealed the interactions between River Deskatis and the karst aquifer in terms of quantity. Nevertheless, rivers are usually recipients of nutrients originating from agricultural activities and these pollutants may influence aquifer quality.
The hydrochemical analysis was performed to determine the qualitative status of the groundwater, surface, and spring waters. The hydrochemical status of the system as well as the minimum, maximum, standard deviation, and mean values of the chemical analysis are shown in Table 2. The concentrations of calcium cations ( Ca + ) observed in the three water types ranged from 30 to 68 mg/L, with 59 mg/L recorded at Kefalovriso spring. The concentration of Na+ was significantly lower in groundwater samples than surface water samples with a mean value of 13 mg/L. The highest concentrations of SO 4 were recorded in surface water samples as compared to groundwater samples. The highest concentration of NO 3 (21 mg/L) was recorded in the surface water, while the concentration in Kefalovriso spring was 10 mg/L, highlighting the low impact of agricultural and livestock activities in this area. The concentrations of Mg 2 + ranged from 9.7 to 22.4 mg/L. The dominant water types are Mg- HCO 3 and Ca-Mg- HCO 3 . The Mg- HCO 3 water type can be attributed to Mg-bearing minerals found in dolomites, whereas the Ca-Mg- HCO 3 water type indicates groundwater of meteoric origin. The ion concentration plots of Piper, Durov, Schoeller, and Wilcox are presented in Figure 6. The ionic ratios of Ca 2 + + Mg 2 + / HCO 3 , Mg 2 + / Ca 2 + were also calculated and are shown in Table 2. The Na + / Cl ratio ranges from 1.0 to 2.9 indicating that waters are mainly meteoric in origin. According to the Wilcox plot, the samples are characterized by excellent-to-good quality and are thus suitable for irrigation.

3.3. SARIMA Model

SARIMA models were used in this research to simulate the discrete time series data of historical monthly discharge at Kefalovriso spring. The available historical monthly data cover twenty years (from January 1974 to December 1993) and are shown in Figure 7. The discharge measurements were obtained from the Land Reclamation Service (YEB) of Larissa and the Institute of Geology and Mineral Exploration (IGME). Of the available time series data, the period 1974–1993 was used to construct a suitable SARIMA model, and the years 1992–1993 were used as a forecasting period to check the model’s reliability.
SARIMA models take into account both the seasonality, which was introduced by the length of seasons S, and the persistence of the time series. The stationarity of the time series data was obtained by logarithmic transformation. The Cumulative Periodogram [C(fk)], Autocorrelation Function (ACF), and Partial Autocorrelation Function (PACF) were computed for the logarithmic-transformed time series of monthly discharge (1974–1993) at Kefalovriso spring (Figure 8).
Figure 8 shows that the logarithmic-transformed time series of monthly discharge is not “white noise”, the length of seasons S equals 12, and the model with structure (4,1,1) (1,1,1)12 is a candidate model. To allow for possible identification errors, a set of six models (Table 3) was considered. The number of parameters (n), the residual variance (σe2), the Akaike Information Criterion (AIC), and the Portmanteau test (Qp) were applied to select the most suitable model (Table 3). Model (4,1,1) (1,1,1)12 had the lowest AIC and was selected to simulate the logarithmic-transformed time series of monthly discharge. As shown in Table 4, the model that satisfactorily fulfils most of the criteria is the (4,1,1) (1,1,1)12, which can be controlled [22].
To verify the appropriateness of model (4,1,1) (1,1,1)12, its residuals were examined using the ACF, the PACF, and the Cumulative Periodogram [C(fk)] of the residuals shown in Figure 9a–c. These figures revealed that the residuals constitute “white noise”, and are, therefore, uncorrelated [22].
The suitable seasonal stochastic model SARIMA (4,1,1) (1,1,1)12 can also be used to predict the monthly discharge of Kefalovriso karst spring. The above model has the form:
(1 − φ1B − φ2B2 − φ3B3 − φ4B4)(1 − B)(1 − Φ1B12)(1 − B12)Zt = (1 − θ1B)(1 − Θ1 B12)et
Therefore, SARIMA model (4,1,1) (1,1,1)12 can be used to forecast monthly spring discharge for one or more time steps and was applied for the period 1992–1993. The observed and forecasted values of discharge at Kefalovriso spring were calculated using model (4,1,1) (1,1,1)12 for the period 1992–1993 and are shown in Figure 10. The SARIMA model (4,1,1) (1,1,1)12 predicted the spring’s monthly discharge with sufficient accuracy.
Some basic statistics of the observed and forecasted discharge data at Kefalovriso spring for the period 1992–1993 are given in Table 5. The hypothesis that the mean and variance values of the forecasted data are not significantly different from those of the observed data can be accepted at the 5% significance level (Table 5). Thus, the results show that the forecasted data preserve the basic statistical properties of the observed data.
From the above analysis, it can be concluded that SARIMA models can be used successfully to predict short-term discharge values at Kefalovriso spring. Additionally, they can also generate sequences of synthetic monthly time series of unlimited duration. Therefore, their use can aid decision-making for the integrated protection and management of groundwater resources and lead to the appropriate programming of various management plans.

3.4. Research Challenges

The karst aquifer of Krania–Elassona is the main supply source of fresh water for the cities of Elassona and Krania, as well as the villages of Kefalovriso and Valanidia. Undeniably, the protection of the aquifer is crucial for the sustainability of the region. Thorough understanding of the geological and hydrogeological regime is the first step required to assess groundwater vulnerability and pollution risk of the Krania–Elassona system. According to the literature, various vulnerability methods have been applied to assess karst aquifers in Greece [37], including the COP methods applied to the Ziria system of Peloponnesus [38], the PaPRIKa method applied to the Palaiokastro–Chochlakies system on the island of Crete [39], and EPIK in Anthemountas basin [40]. However, in our opinion, statistical analysis and simulation of a karst system should precede groundwater vulnerability assessment. Statistical analysis has proven useful to determine the characteristics of a system [41]. Additionally, the large amount of high frequency data of the system could be used for rainfall–discharge analysis and modeling [42]. The determination of the conceptual model is the basis for a detailed model-based sustainable management plan for any karst system and its surrounding area. Kefalovriso spring discharges into the River Voulgaris, which is a tributary of the River Pineios. In this study, the allogenic recharge of the Elassona–Krania karst system was also quantified. The allogenic inflow contributes to the dissolution process introducing water that is undersaturated with respect to calcite [43,44]. Nevertheless, allogenic recharge should also be studied in respect to the diffuse recharge of karst aquifers [45,46] by using trace element analysis to distinguish allogenic runoff from karst waters. Future research in the karst system of Krania–Elassona should combine both hydrological modeling and hydrogeochemical analyses.

4. Conclusions

The karst aquifer of Krania–Elassona located in central Greece is the main supply source of fresh water for the local community. The geotectonic evolution of the Hellenic region determined the tectonic window of Krania–Elassona. The main direction of the initial faults is NE–SW. The karst aquifer consists of three horizons of marbles and is characterized by mature karstification. Two rivers crossing the karst aquifer contribute to the recharge of the aquifer. The allogenic input from the River Deskatis accounts for up to 93% of the total runoff. The allogenic recharge from the Paliomantanos River is predicted to be much less than that of Deskatis. The karst aquifer discharges from Kefalovriso spring, which is a typical contact rising spring. The aquifer’s groundwater quality is good, and the water type of the spring water is Mg- HCO 3 . Application of the SARIMA model verified the established conceptual model. Additionally, logarithms of monthly spring discharge time series can be simulated using SARIMA model. This model is suitable to simulate the Krania aquifer and can be utilised as a tool to predict monthly discharge values of Kefalovriso spring for, at least, a two-year period. Seasonal stochastic SARIMA models appear efficient to simulate both runoff and groundwater flow conditions of a karst system and can also be easily adapted to account for local conditions. Adapting a suitable stochastic model to specific karst groundwater flow conditions allows the user to obtain accurate short-term predictions that can aid rational groundwater resources exploitation and management planning.
The results of this study highlight the importance of basic hydrogeological research including geological mapping, detailed monitoring, and hydrochemical analyses, which constitute the basis for any model application. The successful application of SARIMA models enhanced system conceptualization and successful conceptualization constitutes the basis of reliable groundwater vulnerability assessment and modeling of any karst system.

Author Contributions

Conceptualization, A.M.; Formal analysis, M.M.N. and K.C.; Writing—review & editing, N.K.

Funding

This research received no external funding.

Conflicts of Interest

The authors declare no conflict of interest.

References

  1. Ford, D.C.; Williams, P.W. Karst Geomorphology and Hydrology; Unwin Hyman: London, UK, 1989; Volume 601, ISBN 9401177805. [Google Scholar]
  2. Bakalowicz, M. Karst groundwater: A challenge for new resources. Hydrogeol. J. 2005, 13, 148–160. [Google Scholar] [CrossRef]
  3. Stevanović, Z. Karst Aquifers—Characterization and Engineering; Springer International Publishing: Basel, Switzerland, 2015. [Google Scholar]
  4. Daskalaki, P.; Voudouris, K. Groundwater quality of porous aquifers in Greece: A synoptic review. Environ. Geol. 2008, 54, 505–513. [Google Scholar] [CrossRef]
  5. Kazakis, N.; Chalikakis, K.; Mazzilli, N.; Ollivier, C.; Manakos, A.; Voudouris, K. Management and research strategies of karst aquifers in Greece: Literature overview and exemplification based on hydrodynamic modelling and vulnerability assessment of a strategic karst aquifer. Sci. Total Environ. 2018, 643, 592–609. [Google Scholar] [CrossRef]
  6. Perrin, J.; Jeannin, P.Y.; Zwahlen, F. Epikarst storage in a karst aquifer: A conceptual model based on isotopic data, milandre test site, Switzerland. J. Hydrol. 2003, 279, 106–124. [Google Scholar] [CrossRef]
  7. Goldscheider, N.; Drew, D. Methods in Karst Hydrogeology; CRC Press: London, UK, 2007; ISBN 9780415428736. [Google Scholar]
  8. Knez, M.; Petrič, M.; Slabe, T.; Šebela, S. The Beka-Ocizla Cave System, Karstological Railway Planning in Slovenia; Springer International Publishing: Basel, Switzerland, 2015. [Google Scholar]
  9. Ficco, K.K.; Sasowsky, I.D. An interdisciplinary framework for the protection of karst aquifers. Environ. Sci. Policy 2018, 89, 41–48. [Google Scholar] [CrossRef]
  10. Patrikaki, O.; Kazakis, N.; Voudouris, K. Vulnerability map: A useful tool for groundwater protection: An example from Mouriki basin, North Greece. Fresenius Environ. Bull. 2012, 21, 2516–2521. [Google Scholar]
  11. Kazakis, N.; Spiliotis, M.; Voudouris, K.; Pliakas, F.K.; Papadopoulos, B. A fuzzy multicriteria categorization of the GALDIT method to assess seawater intrusion vulnerability of coastal aquifers. Sci. Total Environ. 2018, 621, 552–566. [Google Scholar] [CrossRef]
  12. Dörfliger, N.; Plagnes, V.; Kavouri, K. PaPRIKa a multicriteria vulnerability method as a tool for sustainable management of karst aquifers, example of application on a test site in SW France. In Proceedings of the International Interdisciplinary Scientific Conference “Sustainability of the Karst Environment: Dinaric Karst and Other Karst Regions”, Plitvice Lakes, Croatia, 23–26 September 2009. [Google Scholar]
  13. Dörfliger, N.; Plagnes, V.; Kavouri, K.; Balayre, S.; Paris, C.; Muet, P.; Subias, C.; Jaunat, J.; Huneau, F.; Prévost, V.; et al. PaPRIKa, une méthode multicritère de cartographie de la vulnérabilité pour une gestion des ressources et des captages en milieu karstique: Exemples d’application dans le Sud-Ouest de la France. Géologues 2009, 163, 86–92. [Google Scholar]
  14. Dörfliger, N. Advances in Karst Groundwater Protection Strategy Using Artificial Tracer Tests Analysis and Multiattribute Vulnerability Mapping (EPIK Method). Ph.D. Thesis, Neuchatel University, Neuchatel, Switzerland, 1996. [Google Scholar]
  15. Goldscheider, N.; Klute, M.; Sturm, S.; Hötzl, H. The PI method—A GIS-based approach to mapping groundwater vulnerability with special consideration of karst aquifers. Z. Angew. Geol. 2000, 46, 157–166. [Google Scholar]
  16. Daly, D.; Dassargues, A.; Drew, D.; Dunne, S.; Goldscheider, N.; Neale, S.; Popescu, I.; Zwahlen, F. Main concepts of the “European approach” to karst groundwater-vulnerability assessment and mapping. Hydrogeol. J. 2002, 10, 340–345. [Google Scholar] [CrossRef]
  17. Jeannin, P.Y.; Cornaton, F.; Zwahlen, F.; Perrochet, P. VULK: A tool for intrinsic vulnerability assessment and validation. Sci. Tech. L’environ. Mém. Hors-Sér. 2001, 13, 185–190. [Google Scholar]
  18. Vias, J.M.; Andreo, B.; Perles, M.J.; Carrasco, F.; Vadillo, I.; Jimenez, P. Proposed method for groundwater vulnerability mapping in carbonate (karstic) aquifers: The COP method. Hydrogeol. J. 2006, 14, 912–925. [Google Scholar] [CrossRef]
  19. Box, G.E.P.; Jenkins, G.M. Time Series Analysis: Forecasting and Control, Revised ed.; Holden Day, Inc.: San Francisco, CA, USA, 1976; p. 532. [Google Scholar]
  20. Hipel, K.W.; McLeod, A.I. Time Series Modelling of Water Resources and Environmental Systems; Elsevier: Amsterdam, The Netherlands, 1994; Volume 45, p. 1013. [Google Scholar]
  21. Ahn, H.; Salas, J.D. Groundwater head sampling based on stochastic analysis. Water Resour. Res. 1997, 33, 2769–2780. [Google Scholar] [CrossRef] [Green Version]
  22. Manakos, A. Hydrogeological Behavior and Stochastic Simulation of Krania Elassona Karstic Aquifer Thessaly. Ph.D. Thesis, Aristotle University of Thessaloniki, Thessaloniki, Greece, 1999. [Google Scholar]
  23. Papamichail, D.M.; Antonopoulos, V.Z.; Georgiou, P.E. Stochastic models for Strymon river flow and water quality parameters. In Proceedings of the International Conference Protection and Restoration of the Environment V, Thassos, Greece, 2–6 July 2000; pp. 219–226. [Google Scholar]
  24. Papamichail, D.M.; Georgiou, P.E. Seasonal ARIMA inflow models for reservoir sizing. J. Am. Water Resour. Assoc. 2001, 37, 877–885. [Google Scholar] [CrossRef]
  25. Manakos, A.; Dimopoulos, G. Contribution of stochastic models to the sustainable water management. The example of Krania Elassona karstic aquifer in Thessaly. In Proceedings of the 10th International Conference of Greek Geol. Society, Thessaloniki, Greece, 15–17 April 2004; pp. 361–368. [Google Scholar]
  26. Manakos, A.; Georgiou, P. Time series modeling of groundwater head using seasonal stochastic models SARIMA. In Proceedings of the common Conference of the 11th Hellenic Hydrotechnical Society and of the 7th Conference of the Hellenic Committee of Water Management, Volos, Greece, 27–30 May 2009; pp. 709–716. [Google Scholar]
  27. Voudouris, K.; Georgiou, P.; Stiakakis, E.; Monopolis, D. Comparative analysis of stochastic models for simulation of discharge and chloride concentration in Almyros Karstic Spring in Greece. In Proceedings of the 14th Annual Conference of the International Association of Mathematical Geo-sciences, IAMG, Budapest, Hungary, 10–16 August 2010; p. 15. [Google Scholar]
  28. Manakos, A.; Georgiou, P.; Mouratidis, I. Application of stochastic models to rational management of water resources at the Damasi Titanos karstic aquifer in Thessaly Greece. In Advances in the Research of Aquatic Environment; Springer: Berlin/Heidelberg, Germany, 2011; Volume 1, pp. 435–442. ISBN 978-3-642-19901. [Google Scholar]
  29. Manakos, A.; Tasios, N. Hydrogeological Research of Large Carbonated Masses in Thessaly; Krania Karstic Aquifer, Institouto Geologikon Kai Metalleftikon Erevnon (I.G.M.E.): Thessaloniki, Greece, 1999. [Google Scholar]
  30. Triantafyllis, E. Geological Maps of Greece, Scale 1:50000, Sheets: Elassona, Deskati; I.G.M.E.: Thessaloniki, Greece, 1982. [Google Scholar]
  31. Mohan, S.; Vedula, S. Multiplicative seasonal arima model for longterm forecasting of inflows. Water Resour. Manag. 1995, 9, 115–126. [Google Scholar] [CrossRef]
  32. Box, G.E.P.; Pierce, D.A. Distribution of autocorrelations in autoregressive integrated moving average time series models. J. Am. Stat. Assoc. 1970, 65, 1509–1526. [Google Scholar] [CrossRef]
  33. Akaike, H. A new look at the statistical model identification. IEEE Trans. Autom. Control 1974, 19, 716–723. [Google Scholar] [CrossRef]
  34. Katsikatsos, G.; Migiros, G.; Triantaphyllis, M.; Mettos, A. Geological structure of internal Hellenides (E. Thessaly—SW. Macedonia, Euboea—Attica—Northern Cyclades islands and Lesvos). Geol. Geophys. Res. Spec. Issue 1986, 191–212. [Google Scholar]
  35. Stamatis, A.; Migiros, G. Das tektonische Fenster von Kranea-Elasson (NW Thessalien/Griechenland), Neues Jahrbuch für Geologie und Paläontologie. 1993; 49–64. [Google Scholar]
  36. Kilias, A.; Mountrakis, D. The Pelagonian Nappe. Tectonics, metamorphism and magmatism. In Proceedings of the 4th Congress of the Geological Society of Greece XXIII, Athens, Greece, 25–27 May 1988; pp. 16–38. [Google Scholar]
  37. Voudouris, K.; Mandrali, P.; Kazakis, N. Preventing Groundwater Pollution Using Vulnerability and Risk Mapping: The Case of the Florina Basin, NW Greece. Geosciences 2018, 8, 129. [Google Scholar] [CrossRef]
  38. Nanou, E.A.; Zagana, E. Groundwater vulnerability to pollution map for karst aquifer protection (Ziria Karst System, Southern Greece). Geosciences 2018, 8, 125. [Google Scholar] [CrossRef]
  39. Kavouri, K.P.; Karatzas, G.P.; Plagnes, V. A coupled groundwater-flow-modelling and vulnerability-mapping methodology for karstic terrain management. Hydrogeol. J. 2017, 25, 1301–1307. [Google Scholar] [CrossRef]
  40. Kazakis, N.; Oikonomidis, D.; Voudouris, K. Groundwater vulnerability and pollution risk assessment with disparate models in karstic, porous and fissured rock aquifers using remote sensing techniques and GIS in Anthemountas basin, Greece. Environ. Earth Sci. 2015, 74, 6199–6209. [Google Scholar] [CrossRef]
  41. Panagopoulos, G.; Lambrakis, N. The contribution of TSA to the study of the hydrodynamic characteristics of the karst systems: Application on two typical karst aquifers of Greece (Trifilia, Almyros Crete). Hydrol. J. 2006, 329, 368–376. [Google Scholar] [CrossRef]
  42. Mazzilli, N.; Guinot, V.; Jourde, H.; Lecoq, N.; Labat, D.; Arfib, B.; Baudement, C.; Danquigny, C.; Dal Soglio, L.; Bertin, D. KarstMod: A modelling platform for rainfall—discharge analysis and modelling dedicated to karst systems. Environ. Model. Softw. 2017. In Press, Corrected Proof. [Google Scholar] [CrossRef]
  43. Vacher, H.L.; Mylroie, J.E. Eogenetic Karst from the Perspective of an Equivalent Porous Medium. Carbonates Evaporites 2002, 17, 182–196. [Google Scholar] [CrossRef]
  44. Mylroie, J.E.; Carew, J.L. Karst development on carbonate islands. Speleogenesis and Evolution of Karst Aquifers. Virtual Sci. J. 2003, 1, 1–21. [Google Scholar]
  45. Langston, A.L.; Screaton, E.J.; Martin, J.B.; Vincent, B.C. Interactions of diffuse and focused allogenic recharge in an eogenetic karst aquifer (Florida, USA). Hydrogeol. J. 2012, 20, 767–781. [Google Scholar] [CrossRef]
  46. Gill, L.W.; Babechuk, M.G.; Kamber, B.S.; McCormack, T.; Murphy, C. Use of trace and rare earth elements to quantify autogenic and allogenic inputs within a lowland karst network. Appl. Geochem. 2018, 90, 101–114. [Google Scholar] [CrossRef]
Figure 1. Topographic map of the study area showing sampling and measurement points.
Geosciences 09 00015 g001
Figure 2. Geological map of the study area.
Geosciences 09 00015 g002
Figure 3. Three-dimensional (3-D) piezometric map of the karst aquifer.
Geosciences 09 00015 g003
Figure 4. Monthly discharge of Deskatis River as measured at (1) before the karst aquifer (Deskatis bridge sampling point—in orange), (2) 1.5 km from Deskatis bridge and within the karst aquifer (Loutro sampling point—in yellow), and (3) 12 km from Deskatis bridge and within the karst aquifer (Valanidas sampling point–in green).
Geosciences 09 00015 g004
Figure 5. Representative hydrograph of Kefalovriso spring for the hydrological year 1990–1991.
Geosciences 09 00015 g005
Figure 6. (a) Piper, (b) Durov, (c) Schoeller and (d) Wilcox plots of ion concentrations recorded in the groundwater and spring water.
Geosciences 09 00015 g006
Figure 7. Monthly discharge of Kefalovriso spring.
Geosciences 09 00015 g007
Figure 8. (a) Autocorrelation Function (ACF), (b) Partial Autocorrelation function (PACF), and (c) Cumulative Periodogram [C(fk)] of the logarithmically modified time series data of Kefalovriso spring discharge from 1974 to 1993.
Geosciences 09 00015 g008
Figure 9. (a) Autocorrelation Function (ACF) (b) Partial Autocorrelation Function (PACF) and (c) Cumulative Periodogram [C(fk)] of the residuals of Kefalovriso karst spring using SARIMA model (4,1,1) (1,1,1)12 for the time period 1974–1993.
Geosciences 09 00015 g009
Figure 10. Comparison of observed and modeled discharge of Kefalovriso spring produced by SARIMA model (4,1,1) (1,1,1)12 for the period 1992–1993.
Geosciences 09 00015 g010
Table 1. Discharge and temperature values of Kefalovriso spring.
Hydrological YearMean Annual Discharge [Qj] lit/secMax. Discharge [Qmax] lit/secMin. Discharge [Qmin] lit/secMean Annual Temperature T [°C]Ratio of Min./Max. Discharge Qmax/Qmin
1988/1989843189147912.53.80
1989/199054489325914.13.45
1990/19911878321031611.710.16
1991/1992721114851513.22.23
1992/1993830130133412.33.90
Mean963168938112.84.71
Table 2. Results and statistical analysis of the hydrochemical data. (DL: Limit of Detection).
SampleTypepHEC (μS/cm)TDS (mg/L)Ca (mg/L)Mg (mg/L)Na (mg/L)K (mg/L)HCO3 (mg/L)Cl (mg/L)SO4 (mg/L)NO3 (mg/L)NO2 (mg/L)NH4 (mg/L)Ca+Mg/HCO3Mg/CaNa/Cl
ELP1Spring7.804203595916102239517100.0020.0011.10.42.9
ELR1Surface water7.484253454613225190214170.0050.0011.10.51.6
ELR2Surface water7.6047739969161022481230130.0060.0011.20.41.2
ELR3Surface water7.24297225301011787164321<DL0.1131.60.51.1
ELR4Surface water8.247104716025304244217890.0020.051.30.72.2
ERL5Surface water8.06480337511512221572690.0120.0221.10.52.6
B-25Groundwater7.704703726222612497169<DL0.0181.20.61.3
B-6Groundwater7.76414351541872232111890.010.0011.10.61.0
PZ37/90Groundwater7.9043336555179124592090.0040.0591.00.51.6
PZ45/90Groundwater8.00441382551814225392110<DL0.0441.00.62.4
Min.7.202972253010618751670.0020.0011.00.41.0
Max.8.2071047169253072532178210.0120.1131.60.72.9
SD0.3010361.310.44.47.41.950.65.819.13.80.0040.0360.20.10.7
Mean7.80456.736054.217.013.12.8220.111.931.010.60.00.01.20.51.8
Table 3. Number of parameters (n), residual variance (σe2) Akaike Information Criterion (AIC), and Portmanteau test (Qp) of the logarithmic-transformed time series data of monthly discharge at Kefalovriso spring (1974–1993).
CNModelAICPPnσe2Qp
1(1,0,1)(0,1,1)12229,1551272,907950,053698213,2792
2(2,0,0)(0,1,1)12235,7214270,723440,055870617,9667
3(4,1,0)(1,1,1)12232,4000328,656110,051565310,0651
4(3,1,0)(1,1,1)12232,5456311,300690,052564416,1979
5(4,1,1) (1,1,1)12227,4535297,4580130,05181739,95088
6(4,1,0)(1,1,2)12235,2279340,2346120,051763210,1882
Table 4. Parameter value, Confidence interval (95%), Standard error, T-value and P-value for SARIMA model (4,1,1) (1,1,1)12 of the logarithmic-transformed time series data of monthly discharge at Kefalovriso spring (1974–1993).
Model ParameterParameter ValueConfidence Interval (95%)Standard ErrorT-ValueP-Value
φ10.428620.29648–0.560760.067046.393650.00000
φ2−0.39013−0.53080–0.249460.07137−5.466540.00000
φ30.233330.09215–0.374510.716303.257450.00130
φ4−0.15361−2.28582–0.021400.67080−2.290120.02296
Φ1−0.13274−1.97641–1.710930.09354−1.419100.15728
θ1−0.17472−1.06035–0.710910.44933−0.388840.69781
Θ10.662860.53221–0.793510.071989.209020.00000
Table 5. Statistical properties of the observed and forecasted values of discharge at Kefalovriso spring using SARIMA model (4,1,1) (1,1,1)12 for the two-year period 1992–1993.
Modelling EfficiencyIndex of Agreement
Observed859.37215.42
Forecasted858.40205.81

