Mapping Mountain Permafrost Landscapes in Siberia Using Landsat Thermal Imagery

1
Melnikov Permafrost Institute SB RAS, Merzlotnaya str.,36, 677010 Yakutsk, Russia
2
International Center BEST, North-Eastern Federal University, Belinskogo str., 58, 677000 Yakutsk, Russia
*
Author to whom correspondence should be addressed.
Geosciences 2019, 9(1), 4; https://doi.org/10.3390/geosciences9010004
Submission received: 31 October 2018
/
Revised: 7 December 2018
/
Accepted: 14 December 2018
/
Published: 20 December 2018
(This article belongs to the Special Issue Permafrost Landscapes: Classification and Mapping)
Abstract
:Intensive development of South Yakutia, a mountainous area in the Russian sporadic permafrost zone, must be founded on knowledge about regional permafrost conditions. New permafrost maps for mountainous areas in South Yakutia (the Elkon Mountains and the Olekma-Chara Upland) are presented that provide a more detailed and updated description of permafrost distribution in the area than those that were hitherto available. These maps are based on the previously-developed and tested method of detecting permafrost and unfrozen ground using Landsat-5/TM satellite data with relatively high resolution. The method represents a scheme for permafrost identification based on a set of landscape indicators: terrain elevation, slope angle and exposition, vegetation, snow cover, and land surface temperature (LST). A correlation analysis of satellite data to full-scale field data has been carried out for the two areas under consideration. Indicator properties of LST obtained by Landsat-5/TM Band 6 Infrared have been characterized in detail for detection and regional mapping of permafrost. The effect of landscape factors (landscape cryo-indicators) on ground temperature and condition, frozen or unfrozen reflected in LST intensity, is demonstrated.
1. Introduction
Exploration of the mountainous areas in South Yakutia is of special significance due to concentration of various natural resources and their economic value. Intensive development of the territory requires effective measures for environmental management and protection, construction principles and techniques for the difficult permafrost conditions. The solution to these and many other issues must be based on knowledge about permafrost conditions in the area. With scarce spatial data on environment parameters, one way of addressing this challenge might be the use of satellite images attributable to their accessibility, wide spatial coverage, frequency, and up-to-date processing techniques.
The use of remote sensing data (RSD) in geocryological studies is possible because most factors controlling ground temperature (which, in turn, determines whether ground is in frozen or unfrozen condition) in mountain terrain are physiognomic, and therefore, they are reflected in RSD (terrain elevation, slope angle and exposition, vegetation and snow cover). This allows a landscape-cryoindication study to be made using satellite imagery. Apart from indirect landscape indicators of permafrost (cryo-indicators), direct geocryological identification, in this instance using surface thermal infrared radiation of the landscape, is possible. Thermal infrared imagery indicates the intensity of the land surface radiation depending on the condition of bedrock, usually referred to as “radiation temperature” in Russia [1] (p. 22) and ”land surface temperature” (LST) elsewhere [2]. In this paper, we shall use the latter term.
At present, thermal infrared imagery is adequately used to survey permafrost through various satellite data, such as the TM/ETM data of the Landsat satellites, the MODIS data of the Terra/Aqua satellites and the Aster data of the Terra satellites [3,4,5,6,7].
However, there is a lack of detailed local surveys in mountainous areas of Siberia that could provide a deep analysis of this parameter along with other temperature forming factors.
A survey of this nature enabled us to develop a method (scheme) of detecting permafrost and unfrozen ground in mountainous areas of the permafrost zone by the example of the Elkon Massif that involved the aforementioned above landscape cryoindicators and LST [8]. Later, this method was applied to the Tarinnakh area in the Olekma-Chara Upland [9].
The purpose of this research is to summarize previously performed surveys in two mountainous areas of South Yakutia, the Elkon Massif and the Olekma-Chara Upland, at the Tarinnakh field.
2. Study Area
The study areas included the Elkon Massif and the central Olekma-Chara Upland (the Tarinnakh field) where near-watershed and slope landscapes at true altitude 700 to 1200 m were investigated. These areas are situated in South Yakutia, Elkon Massif between 58°24′ and 58°48′ N lat and between 125°45′ and 126°36′ E longitude; Olekma-Chara Upland—between 58°10′ and 58°22′ N and between 119°10′ and 119°25′ E (Figure 1).
Both study sites have similar geological and geographical settings. In terms of geology, the areas under consideration are predominantly Archaean and Early Proterozoic crystalline rocks overlain by a surficial mantle of Quaternary deposits. These deposits are up to 17 m thick in near-watershed and slope areas of the Elkon Massif; in the Olekma-Chara Upland, they are represented by a relatively thin mantle.
The relief of the study area is represented by medium-altitude mountains characterized by significant dissection. The asl altitudes of the watershed areas range from 900 to 1449 m (1200 to 1449 m in the Elkon Massif, and 900 to 1400 m in the Olekma-Chara Upland). The absolute elevations of watersheds above river valley bottoms are from 350 to 900 m.
The climate of the study area is extremely continental. Mean annual air temperature ranges from −6 to −10 °C. There is a relatively large amount of precipitation for Yakutia (from 430 to 700 mm) [10]. In the studied areas, the snow thickness varies from 10 to 100 cm (in some places higher).
Landscape structure of the study area is represented by subalpine, mountain sparse woodland, middle-taiga, and intrazonal valley mountain-taiga landscapes characterized by four landscape types: plateau-ridge-top, montane ridge-top, montane slope, and montane valley [11].
Permafrost in the study area is characterized by significant spatial diversity. Permafrost is predominantly discontinuous, occurring mainly on steep north- and west-facing slopes, as well as on cone-shaped watersheds of bald mountain and subalpine mountain zones. Unfrozen ground chiefly occurs in stream valleys, flat watersheds (up to 1050–1100 m asl), gentle slopes of various expositions, and the south and east slopes of various steepness. Mean annual temperature ranges from 1.5 to −4.5 °C in the Elkon Massif, and Upland from 2.5 to −3.8 °C in the Olekmo-Chara Upland [12,13].
3. Materials and Methods
3.1. Temperature Measurements and Methods of Processing Satellite Images for the Analysis of Landscape Factors
The present study is based on ground temperature data from 45 boreholes in the Elkon Massif and 13 boreholes at the Olekmo-Chara Upland. The boreholes are 10 to 500 m deep and are located in various landscapes types [12,13,14,15].
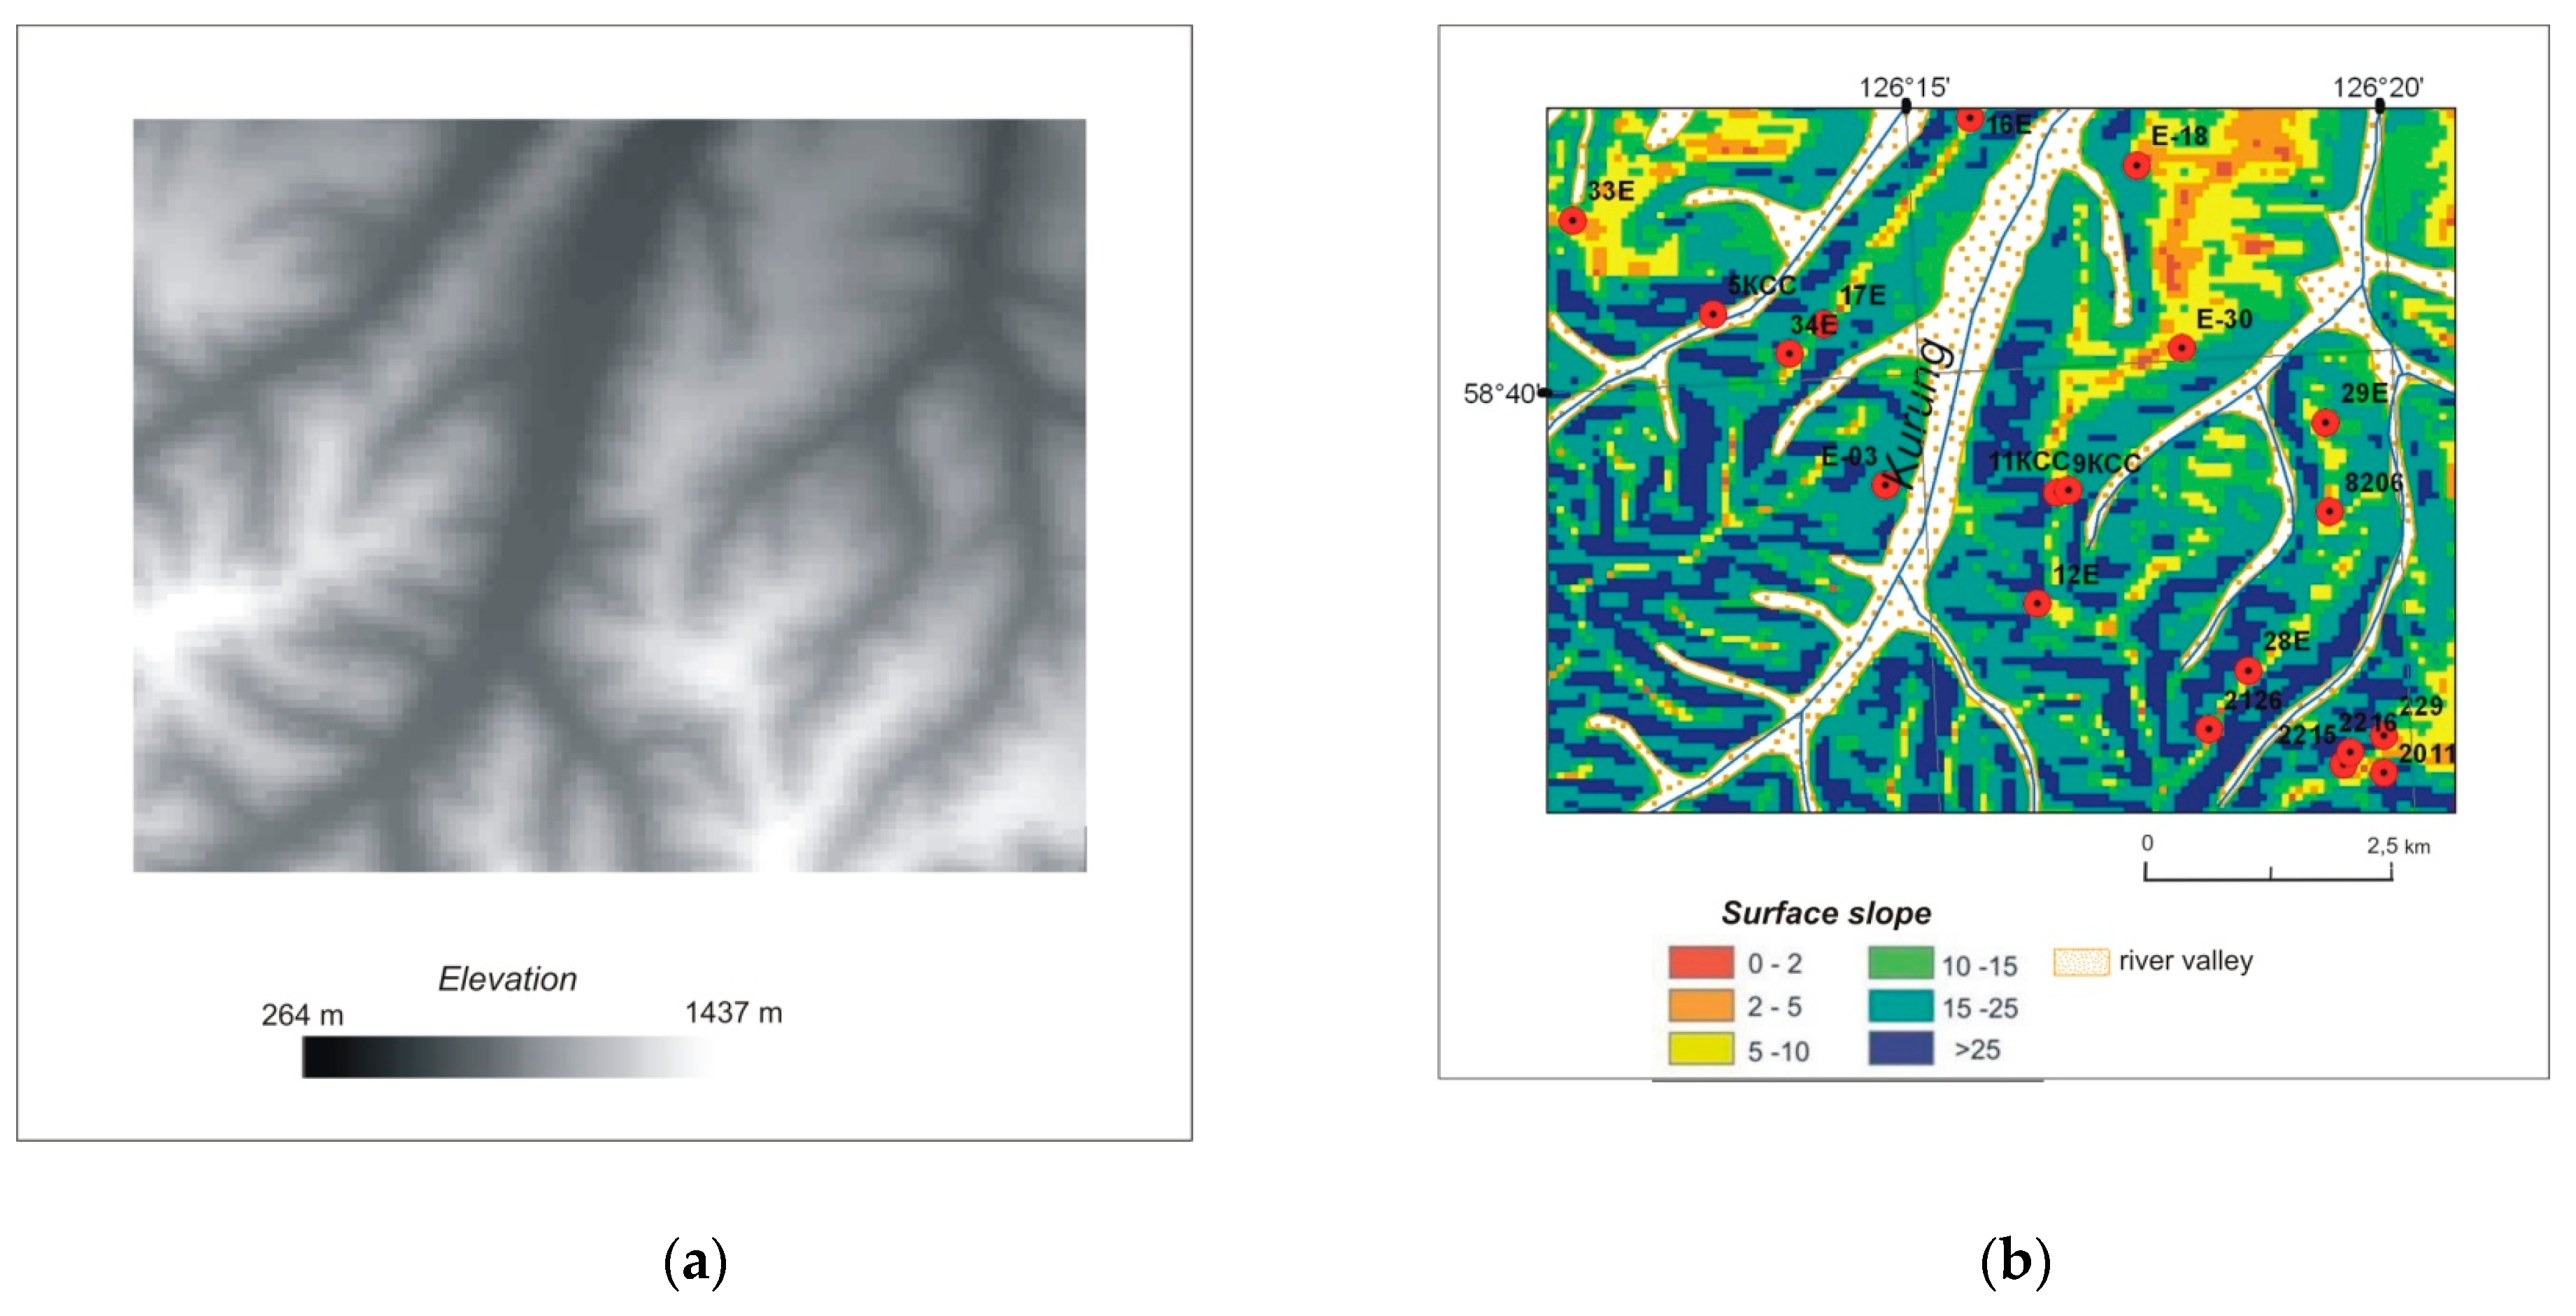
The data on snow cover were analyzed on snow depth measurements obtained during field work. Later, these data were interpreted together with the remotely sensed Landsat-5/TM data. For this study of mountain permafrost areas, we used available satellite data of SRTM (Shuttle Radar Topography Mission) [16] and images of relatively high resolution Landsat-5/TM (bands 1–5 with resolution 30 m and band 6 (thermal) with resolution 120 m). Using the obtained digital model SRTM, slope expositions and surface slopes were detected. The latter were classified into the following gradations: 2–5°, 5–10°, 10–15°, 15–25° and greater (Figure 2a,b).
Landsat-5/TM data were used to survey the vegetation and snow cover, as well as LST. Thus, the images made in August were used as permafrost indicators to study plant communities. From a series of images for a number of years, the most representative ones with zero cloud cover were selected for this season. In particular, the image received on 21 August 2009 for the Elkon Massif and on 7 August 2011 for the Olekma-Chara Upland.
To reveal variations in distribution of snow cover depth, the image on 6 May 2005 for the Elkon Massif and that on 13 May 2005 for the Olekma-Chara Upland were taken as reference images in terms of the average date of snow cover disturbance and zero cloudiness. To identify snow patches, these images were analyzed along with the ones on later dates.
Spatial differentiation of vegetation and snow cover was analyzed from band combination 4-5-3 and 4-3-2 respectively. The difference in illumination of north and south slopes, when identifying vegetation types, was compensated using ERDAS Imagine (Madison, WI, USA) [17]. To interpret vegetation types and snow cover depth, multi-spectral images were separated using the unclassified image classification [18]. Thus, to interpret vegetation types, the obtained classes were compared to field landscape descriptions and vegetation maps (Figure 3a,b). Snow cover thickness was determined through analysis of the obtained classes with field snow cover measurements (Figure 3c,d).
Images with greater thermal contrasts for the study areas (when the active layer of permafrost reaches its maximum depth and seasonally-frozen ground thaws completely) and meeting the requirements of thermal imaging were selected from a number of satellite images for different months to calculate LST [19]. For the Elkon Massif, it was the image taken on 21 August 2009, and for the Olekma-Chara Upland, that of 18 September 2009.
3.2. LST Retrieval from Landsat Images
The scanning radiometer TM of the satellite Landsat-5/TM receives thermal radiation of objects on the Earth surface in infrared 10.40–12.50 μm (band 6) with resolution 120 m.
LST was calculated in two stages using the algorithm described in [20]. Thus, the first stage includes radiometric data correction that consists of their conversion into radiation indicators on the sensor and further radiation temperatures. TM data are converted into radiation values on the sensor using ArcGis10.1 (ESRI, Redlands, CA, USA) according to the formula:
where Lmin λ is the minimum amount of received radiation that, after scaling, equals Qcal min; Lmax λ is the maximum amount of received radiation that after scaling equals Qcal max; Qcal min is the minimum calibrated value DN (0 or 1); Qcal max is the maximum calibrated value DN (255); and Qcal is the calibrated value (DN). DN (digital numbers) is a two-dimensional array of raw digital numbers.
The conversion parameters included in the formula data are provided in a special metafile along with space images. For TM, the conversion parameters of thermal band data into radiation indicated on the sensor are the following:
Lmin λ = 1.2378; Lmax λ = 15.303.
The second stages involves conversion of radiation values on the sensor into LST values using the formula:
where T is the absolute temperature, Kelvin
K1 (calibration constant 1) = 607.76 Watts/(m2∙ster∙μm);
K2 (calibration constant 2) = 1260.56 K.
Lλ is the radiation on the sensor received at the stage 1.
Further, LST is calculated in centigrade (°C):
The result of the thermal image obtained by means of the above formulas is shown in Figure 4.
Multispec and ArcGis10.1. were used for the spatial-temporal analysis, when working with Landsat-5/TM data.
3.3. Steps in Permafrost Identification and Mapping
- A conjugate analysis of field geothermal data, snow depth surveys and field landscape descriptions with landscape indicators and LST was conducted using the cartographic method. Separate layers were compared by overlay in GIS, and correlations between them were estimated. It was established in which landscapes permafrost exists and as which LST they may be characterized.
- Then, landscape-cryoindicator tables summarizing the analyzed data were prepared. After analyzing the landscape-correlation tables, the schemes of detecting permafrost were made.
- On the basis of those schemes, permafrost-landscape maps of the study area were compiled using ARC\INFO (ArcGis 10.1) (ESRI, Redlands, CA, USA).
4. Results
4.1. Identifying Permafrost and Unfrozen Ground
The major factors controlling ground temperature and frozen or unfrozen condition in mountainous areas include relief (elevation, slope and exposition), vegetation and snow cover. LST is one of the main methods to indicate permafrost conditions. They are embodied in remote sensing data. The same landscape components induce, directly or indirectly, the presence or absence of permafrost.
Relief plays a special role in the formation of mountain permafrost. It affects the thermal regime of rock through exposition and slope steepness, asl elevation, landscape variety. Due to orographic factors, solar radiation reaching the surface is distributed unevenly. This is the major cause of differences in microclimate, depth of seasonal thawing, and surface temperature.
Vegetation cover plays a significant role in heat exchange of the Earth surface and the atmosphere, contributing to radiation absorption and counterradiation [21]. In mountainous areas, vegetation cover affects the thermal regime of ground in different manner depending on the type. With high crown density, it has a cooling effect due to absorption of solar radiation in summer and thinning of the snow cover in winter. This is usually characteristic for larch forests mainly occurring at the foot of windward slopes (north, north-west, and west), as well as the middle and the top of slopes, where they can grow in hollows at up to 1150 m. A sparse mountain pine forest with rock debris patches is most likely to develop permafrost. This vegetation type is characteristic for the upper subalpine landscape belt and grows predominantly at 1000–1200 m. Permafrost occurs in areas without vegetation cover with stone fields and fragments of lichen associations. Stone fields are found at 800 to 1200 m, stretching from watersheds to the foot on leeward slopes of various steepness. Mountain pine thickets and larch forests with mountain pine may develop, under certain conditions, on both frozen and unfrozen ground.
Snow cover. The warming effect of snow depends on thickness and density of the snow cover. Its effect on the depth of seasonal thawing and ground temperature is discussed by V.A. Kudryavtsev [22], G.M. Feldman [23], and elsewhere. In areas with extremely continental climate and high relief, snow is one of the most effective factors preventing ground from freezing in winter, resulting in the increase of its mean annual temperature. Relief contributes to changes in circulation of air mass in mountainous areas that is responsible for snow transport. As a result, snow depths may vary significantly over short distances. Besides snowstorm transport, accumulation of snow is strongly affected by microrelief as well as by tree and bush layers of the vegetation cover.
The study area is dominated by westerly and north-westerly winds. This is why north, north-west, and west expositions of slopes are windward, with the snow cover varying from 10 to 90 cm (mostly 55–90 cm in the Elkon Massif, 10–90 cm in the Olekma-Chara Upland). Permafrost predominantly develops within those areas. The east, south-east, south, and south-west exposition are leeward, with the snow cover reaching 90 cm or more in both study areas. Here, unfrozen ground is predominant. The north-east exposition is transitional from windward to leeward, showing medium thickness of snow cover. Within this exposition, ground temperatures are normally around 0 °C.
Snow cover thickness may vary extensively depending on elevation, slope, and exposition of the surface. Snow cover in depressions, on flat watersheds at 700–1100 m and on near-watershed gentle slopes exceeds 100 cm. Here, the materials are predominantly unfrozen.
Land Surface Temperature. As mentioned above, summer-fall images from late August to early September were selected to calculate LST with regard to the period when thaw depths are at a maximum.
Using the selected image (dated 21 August 2009) we obtained the LST range from 9 to 26 °C for the Elkon Massif at the survey time. The analysis of the LST map (Figure 5a) along with the field data show that, all other factors being equal, the intensity of thermal radiation in permafrost areas is, as a rule, lower (9–15 °C) than in landscapes on unfrozen ground (16–19 °C). However, in the areas with rock debris and stone streams, LST in summer is higher than in unfrozen ground (17–26 °C). The reason for this is that areas with exposed rock heat up more than those covered with vegetation.
Figure 5b presents the LST map at the Tarinnakh field (Olekma-Chara Upland). The comparison of boreholes temperature data with the rates of thermal infrared radiation of the surface in the study area showed that LST 8 °C or lower indicate permafrost, while LST 9–12 °C indicate unfrozen ground. LST 8–9 °C represents ground with a transitive temperature (near 0 °C). Areas with stone fields overlaying permafrost are found, as mentioned above, in various landscapes with high LST rates (9–20 °C) due to intensive heating of the surface during the thawing season.
Further, the above cryoindicators were analyzed with temperature data of geothermal boreholes. Table 1 shows the average annual temperature of the ground of the study areas, measured at the depth of zero annual amplitude of 10–30 m.
4.2. Landscape-Cryoindicator Tables
The conjugate analysis of the borehole temperature data with the landscape factors and LST revealed correlations, and the results are presented as a landscape-cryoindicator table for the study areas (Table 2).
4.3. Permafrost-Landscape Mapping
Using this table, the schemes of detecting permafrost and unfrozen ground were compiled for each exposition (Figure 6a,b).
The scheme involves the overlay of the analyzed separate layers, i.e., relief, vegetation, snow cover, LST, that were used for digital maps. The concept of mapping permafrost consists of subsequent mapping and specification of limits according to the selected natural factors. The combination of relief and vegetation provides a base for landscape mapping [24]. A.N. Fedorov used this principle to differentiate various systematic units of permafrost landscapes [25].
The landscape base (combination of relief and vegetation) is overlain by maps of snow cover thickness, specifying the conditions of ground freezing, formation and condition of frozen ground. Further overlay of a LST map refines the condition of landscapes once again, differentiating permafrost and unfrozen ground.
The presented method of permafrost identification and mapping using the landscape factors and remote sensing techniques which was developed on the basis of field permafrost investigations made it possible to determine the spatial distribution of permafrost in the Elkon Massif and the Olekma-Chara Upland (Tarinnakh field) (Figure 7a,b).
4.3.1. Elkon Mountain
Permafrost occurs almost throughout north and north-west slopes (boreholes 229, 2215, 2216), except on gentle slopes with woodland with low crown density represented by mountain pine thickets and open larch forests with dwarf birch and mountain pine forests, with a thick snow cover (100 cm and more) and LST 16–17 °C that are underlain by unfrozen ground.
On west-exposed slopes, permafrost is found in areas with snow cover up to 100 cm (LST 13–15 °C) (borehole 34 E) and in stone streams with LST 17–19 °C. Unfrozen ground occurs in areas with snow cover 100 cm thick and more, their LST being 15–18 °C (borehole 34 E).
North-eastern slopes are transitional from windward to leeward. According to this connection, this exposition has a number of specific features. Here, the snow cover reaches more than 120 cm in the areas with sparse larch forest and mountain pine forest at the top of slopes. Low solar radiation with great snow cover thickness result in ground temperatures near 0 °C., with LST of those areas being 15–16 °C (boreholes 246, 263).
Permafrost are found on moderate and steep slopes of this exposition with snow cover of less than 100 cm; their LST makes up 14–15 °C.
Eastern and south-eastern slopes are characterized by a thick snow cover. Unfrozen ground develops here preferably (boreholes 296, 26 E). However, permafrost with LST 14–15 °C occurs in areas with dense pine-larch forests and snow cover less than 100 cm in the middle and lower part of slopes. Stone streams and rock debris are also characterized by permafrost development.
A specific feature of southern and south-western slopes is that permafrost patches are extremely rare there, only occurring on steep colluvial slopes with stone fields.
4.3.2. Olekma-Chara Upland
Minimum LST rates (<5 °C) are observed on steep, rarer moderate windward slopes. These bare areas demonstrate minimum snow cover (10–40 cm), in some areas with larch forest up to
40–90 cm. In the former case, minimum snow thickness occurs; in the latter, significant shade forms severe permafrost conditions (borehole 106).
Further, the increase of LST (5–6 °C) in the area with developing permafrost (borehole 116) is characteristic for windward slopes, rarer north-eastern moderate slopes. The latter factor (inclination) determines a moderate increase of the incoming solar radiation; yet it is, as a rule, not enough to form positive mean annual ground temperatures.
Areas with LST 6–7 °C are found on the top of windward and north-eastern, predominantly gentle slopes (boreholes 49, 79). The minimum (10–40 cm), rarer-than-average (40–90 cm) thickness of snow cover on rock debris, thick larch forests and mountain pine thickets result in formation of permafrost.
Some watershed and near-watershed areas of very gentle and gentle slopes with various exposition (windward, north-east, and east) show LST 7–8 °C. Here, the development of permafrost is also noted (borehole 64). Stone fields occur almost throughout windward, partially north-eastern slopes that cool down greatly in wintertime. Negative ground temperatures on eastern and north-eastern slopes are related to the cooling effect of snow patches. Further, the LST of 8–9 ° C, due to the lack of data on the ground temperature, is interpreted by analogy with the previously-studied site of the Elkon Massif as a transition zone from permafrost to unfrozen ground, and is characterized by the occurrence of transitional temperatures near 0 °C in this thermal range.
Areas with LST 9–12 °C generally identify unfrozen ground, which is mainly characteristic of leeward slopes. The almost universal development of unfrozen ground on leeward slopes is caused by a thicker snow cover (90–110 cm in average and more) and a greater direct solar radiation in summer. LST 9–10 °C indicate unfrozen ground on very gentle windward slopes with maximum snow cover (90–110 cm). The exceptions are small areas on very gentle windward slopes with rock debris on the surface that heat up greatly in summer, and thus, show LST 9–10 °C. However, these areas also cool down greatly in winter, resulting in formation of ground with negative temperature.
The amount of incoming solar radiation increases on leeward slopes with increasing inclination. Thus, LST 9–10 °C marks gentle leeward slopes (boreholes 4, 27, 110), LST 10–11 °C indicates areas with unfrozen ground predominantly on moderate slopes (boreholes 105, 107), with 11–12 °C on steep ones. The exceptions are almost all stone fields in which permafrost exists.
5. Conclusions
The conducted analysis of space images, field data, and, first of all, distribution of snow cover and LST on key sites of the Elkon Massif and the Olekma-Chara Upland revealed distribution peculiarities of permafrost and unfrozen ground.
The identified quantitative criteria of snow cover differentiation according to its thickness and different thawing dates recorded in spring images showed the potential of using this factor for permafrost mapping. The use of the Landsat-5 thermal band indicating thermal infrared radiation of the land surface provided a way of obtaining LST and completing the landscape description by this parameter.
Interpretation of space images to differentiate snow cover and LST will make permafrost mapping of remote areas more detailed. As a result of the survey, the permafrost-landscape maps of the Elkon Massif and the Tarinnakh field were compiled.
Compared to the traditional permafrost mapping by V.A. Kudryavtsev [22], K.A. Kondratieva [26] et al. where generally sporadic, extensivesporadic, discontinuous, and continuous permafrost are differentiated, the method presented in this study allows more accurate identification of areas with permafrost and unfrozen ground. However, this method has some limitations: (1) The choice of the season (date) of a thermal image best suited to accurate identification of ground condition in the study area. (2) Elimination of shaded effects of north slopes when identifying types of plant associations based on satellite images, e.g., through topographic normalization. (3) Obligatory snow cover measurements during such permafrost studies. (4) Selection of representative geocryological data.
Author Contributions
Analysis, processing of field and satellite data, development of the scheme, permafrost map, as well as the linking of various data sources was performed by S.V.K., A.N.F. supervised the project and compiled the initial version of this manuscript. M.N.Z. provides information on the temperature of the ground (permafrost characteristic of the study areas), data on vegetation and snow cover. All authors contributed to the writing of various sections of the article and equally participated in revisions and final editing of this text prior to its presentation.
Funding
This study was part of the project sponsored by the Siberian Branch of the Russian Academy of Sciences IX.127.2.3 and IX.135.2.
Acknowledgments
We express our gratitude to A.R. Kirillin for conducting the snow-measuring survey in the Elkon horst, to V.S. Makarov for recommendations on working with remote sensing data, to Y.I. Torgovkin and A.A. Shestakova for guidance when working with ArcGis10.1.
Conflicts of Interest
The authors declare no conflict of interest.
References
- Dagurov, P.N.; Chimitdorzhiev, T.N. Methods for Remote Study of the Earth's Surface; Federal State Educational Institution of Higher Education “Buryat State Agricultural Academy named after V.R. Filippova: Ulan-Ude, Russia, 2005. [Google Scholar]
- Coll, С.; Caselles, V.; Galve, J.M.; Valor, E.; Niclos, R.; Sanchez, J.M.; Rivas, R. Ground measurements for the validation of land surface temperatures derived from AATSR and MODIS data. Remote Sens. Environ. 2005, 97, 288–300. [Google Scholar] [CrossRef]
- Kornienko, S.G. Features of the application of the thermal method for the study and monitoring of frozen ground. Drill. Oil 2007, 7–8, 72–75. [Google Scholar]
- Medvedkov, A.A. Mapping of permafrost landscapes based on the analysis of thermal images. In Proceedings of the International Conference “InterCarto/InterGIS”, Protvino, Moscow Region, Russia, 31 August–3 September 2016. [Google Scholar] [CrossRef]
- Hachem, S.; Allard, M.; Duguay, С. Using the MODIS Land Surface Temperature Product for Mapping Permafrost: An Application to Northern Quebec and Labrador, Canada. Permafr. Periglac. Process. 2009, 20, 407–416. [Google Scholar] [CrossRef]
- Westermann, S.; Ostby, T.; Gisnas, K.; Schuler, T.; Etzelmuller, B. A ground temperature map of the North Atlantic permafrost region based on remote sensing and reanalysis data. Cryosphere 2015, 9, 1303–1319. [Google Scholar] [CrossRef]
- Zhao, S.; Nan, Z.; Huang, Y.; Zhao, L. The Application and Evaluation of Simple Permafrost Distribution Models on the Qinghai-Tibet Plateau. Permafr. Periglac. Process. 2017, 2, 391–404. [Google Scholar] [CrossRef]
- Kalinicheva, S.V.; Zheleznyak, M.N.; Kirillin, A.R.; Fedorov, А.N. Identification and mapping of permafrost using satellite images (on the example of the Elkon mountain in Southern Yakutia). Sci. Educ. 2017, 3, 30–37. [Google Scholar]
- Kalinicheva, S.V. Identification and mapping of permafrost and taliks using satellite images (on the example of the Olekma-Charskiy highland in Southern Yakutia). In Proceedings of the International conference “InterCarto/InterGIS”, Petrozavodsk, Russia, 19–22 July 2018. [Google Scholar] [CrossRef]
- Karausheva, A.I. Climate and Microclimate of the Kodar-Chara-Udokan Region; Hydrometeoizdat: Leningrad, Russia, 1977. [Google Scholar]
- Fedorov, A.N.; Botulu, T.A.; Varlamov, S.P.; Vasiliev, I.S.; Gribanov, S.P.; Dorofeev, I.V.; Klimovskii, I.V.; Samsonova, V.V.; Soloviev, P.A. Permafrost Landscapes of Yakutia (Explanatory Note to the Permafrost Landscape Map of the Yakut ASSR (Scale 1: 2,500,000); GUGK: Novosibirsk, Russia, 1989. [Google Scholar]
- Zheleznyak, M.N.; Serikov, S.I.; Zhizhin, V.I.; Osipov, E.A. Temperature of rocks and feature of distribution of a cryolithozone of the Elkonsky horst. Ammosov 2012, IX, 57–65. [Google Scholar]
- Zheleznyak, M.N.; Zhizhin, V.I.; Serikov, S.I. Geocryological conditions of the Olekmo-Charsky uplift in the area of projected linear construction in the Ikabekan-Tarynnakh site. Mod. Probl. Sci. Educ. 2014, 6, 1675. [Google Scholar]
- Zheleznyak, M.N.; Dorofeev, I.V.; Serikov, S.I.; Osipov, E.A. Geocryological conditions of Elkon horst. In Scientific Support for the Implementation of Megaprojects of the Republic of Sakha (Yakutia); Dani Almas Company: Yakutsk, Russia, 2009; pp. 67–72. [Google Scholar]
- Dorofeev, I.V.; Zheleznyak, M.N.; Volodko, B.V.; Sarzhin, M.S. Geothermal conditions of the Charo-Tokka interfluve. In Thematic and Regional Studies of Permafrost of Northern Eurasia; Permafrost Institute: Yakutsk, Russia, 1981; pp. 65–74. [Google Scholar]
- CGIAR–CSI. Available online: http://srtm.csi.cgiar.org (accessed on 10 September 2016).
- Per Aspera Ad Astra. Available online: http://www.giscraft.ru/methods/method9.shtml (accessed on 18 September 2013).
- ArcGIS Resources. Available online: http://resources.arcgis.com/ru/help/main/10.1 /index.html#//009z000000pn000000 (accessed on 06 April 2016).
- Gorny, V.I.; Shilin, B.V.; Yasinsky, G.I. Thermal Aerospace Shooting; Nedra: Moscow, Russia, 1993. [Google Scholar]
- GIS-Lab. Available online: http://gis-lab.info/qa/dn2temperature.html (accessed on 1 April 2016).
- General Permafrost Studies (Geocryology); Kudryavtsev, V.A. (Ed.) Moscow State University: Moscow, Russia, 1978. [Google Scholar]
- Kudryavtsev, V.A. Temperature of Permafrost in the USSR; USSR Academy of Sciences: Moscow, Russia, 1954. [Google Scholar]
- Feldman, G.M. Forecast of the Temperature Regime of the Ground and the Development of Cryogenic Processes; Nauka: Novosibirsk, Russia, 1977. [Google Scholar]
- Sochava, V.B. Introduction to the Study of Geosystems; Nauka: Novosibirsk, Russia, 1978. [Google Scholar]
- Fedorov, A.N. Permafrost Landscapes of Yakutia: The Method of Allocation and Mapping Issues; Permafrost Institute: Yakutsk, Russia, 1991. [Google Scholar]
- Kondratieva, K.A. For the method of small-scale (from 1: 500,000 to 1 000,000) mapping of permafrost (by the example of South Yakutia). Permafr. Res. 1966, 6, 76–87. [Google Scholar]
Figure 1.
Study areas. (a) Location of study areas shown on the permafrost map of Russia (1—permafrost islands; 2—discontinuous permafrost; 3—continuous permafrost). (b) Location of study areas shown on the geomorphological map of Yakutia (1—plain; 2—plateau; 3—mountains).
Figure 1.
Study areas. (a) Location of study areas shown on the permafrost map of Russia (1—permafrost islands; 2—discontinuous permafrost; 3—continuous permafrost). (b) Location of study areas shown on the geomorphological map of Yakutia (1—plain; 2—plateau; 3—mountains).

Figure 2.
SRTM data processing for relief analysis (on the example Elkon Massif). (a) Digital model SRTM; (b) The surface slope map. Numbered dots—numbers of geothermal boreholes.
Figure 2.
SRTM data processing for relief analysis (on the example Elkon Massif). (a) Digital model SRTM; (b) The surface slope map. Numbered dots—numbers of geothermal boreholes.

Figure 3.
Processing of satellite images of Landsat-5/TM to interpret vegetation types and snow depth (on the example Elkon Massif). (a) Original multispectral image (band combination 4-5-3); (b) The resulting map of vegetation. Numbered dots—numbers of geothermal boreholes. 1—water bodies; 2—fires and deforestation; 3—larch forest; 4—sparse larch forest with mountain pine thickets; 5—open larch forest with alder, dwarf birch and mountain pine; 6—mountain pine thickets; 7—thinned mountain pine forest with rock debris; 8—stone fields (with lichen); 9—river valley. (c) Original multispectral image (band combination 4-3-2); (d) The resulting snow cover map. Numbered dots—numbers of geothermal boreholes. 1—Snow cover depth of 50–80 cm; 2—Snow cover depth of 80–100 cm; 3—Snow cover depth of 100–120 cm; 4—Snow depth 120 cm and more; 5—river valley.

Figure 4.
Converting Landsat TM data in values of temperature (on the example Elkon Massif). (a) Original space image of the thermal band of 6 (Landsat-5/TM); (b) The resulting image by converting the radiation values at the sensor to the values of the radiation temperature of the earth’s surface (LST).

Figure 5.
(a) LST, Elkon Massif, 21 August 2009. (b) LST, Olekma-Chara Upland (Tarinnakh field), 18 September 2009. Temperature in °C. Numbered dots—numbers of geothermal boreholes.
Figure 5.
(a) LST, Elkon Massif, 21 August 2009. (b) LST, Olekma-Chara Upland (Tarinnakh field), 18 September 2009. Temperature in °C. Numbered dots—numbers of geothermal boreholes.

Figure 6.
(a) Example of the compilation of the scheme for identifying permafrost and unfrozen ground in windward north and north-west slopes, Elkon Massif. (b) Example of the compilation of the scheme for identifying permafrost, ground with temperature near 0 °C and unfrozen ground in north-eastern slope, Elkon Massif.

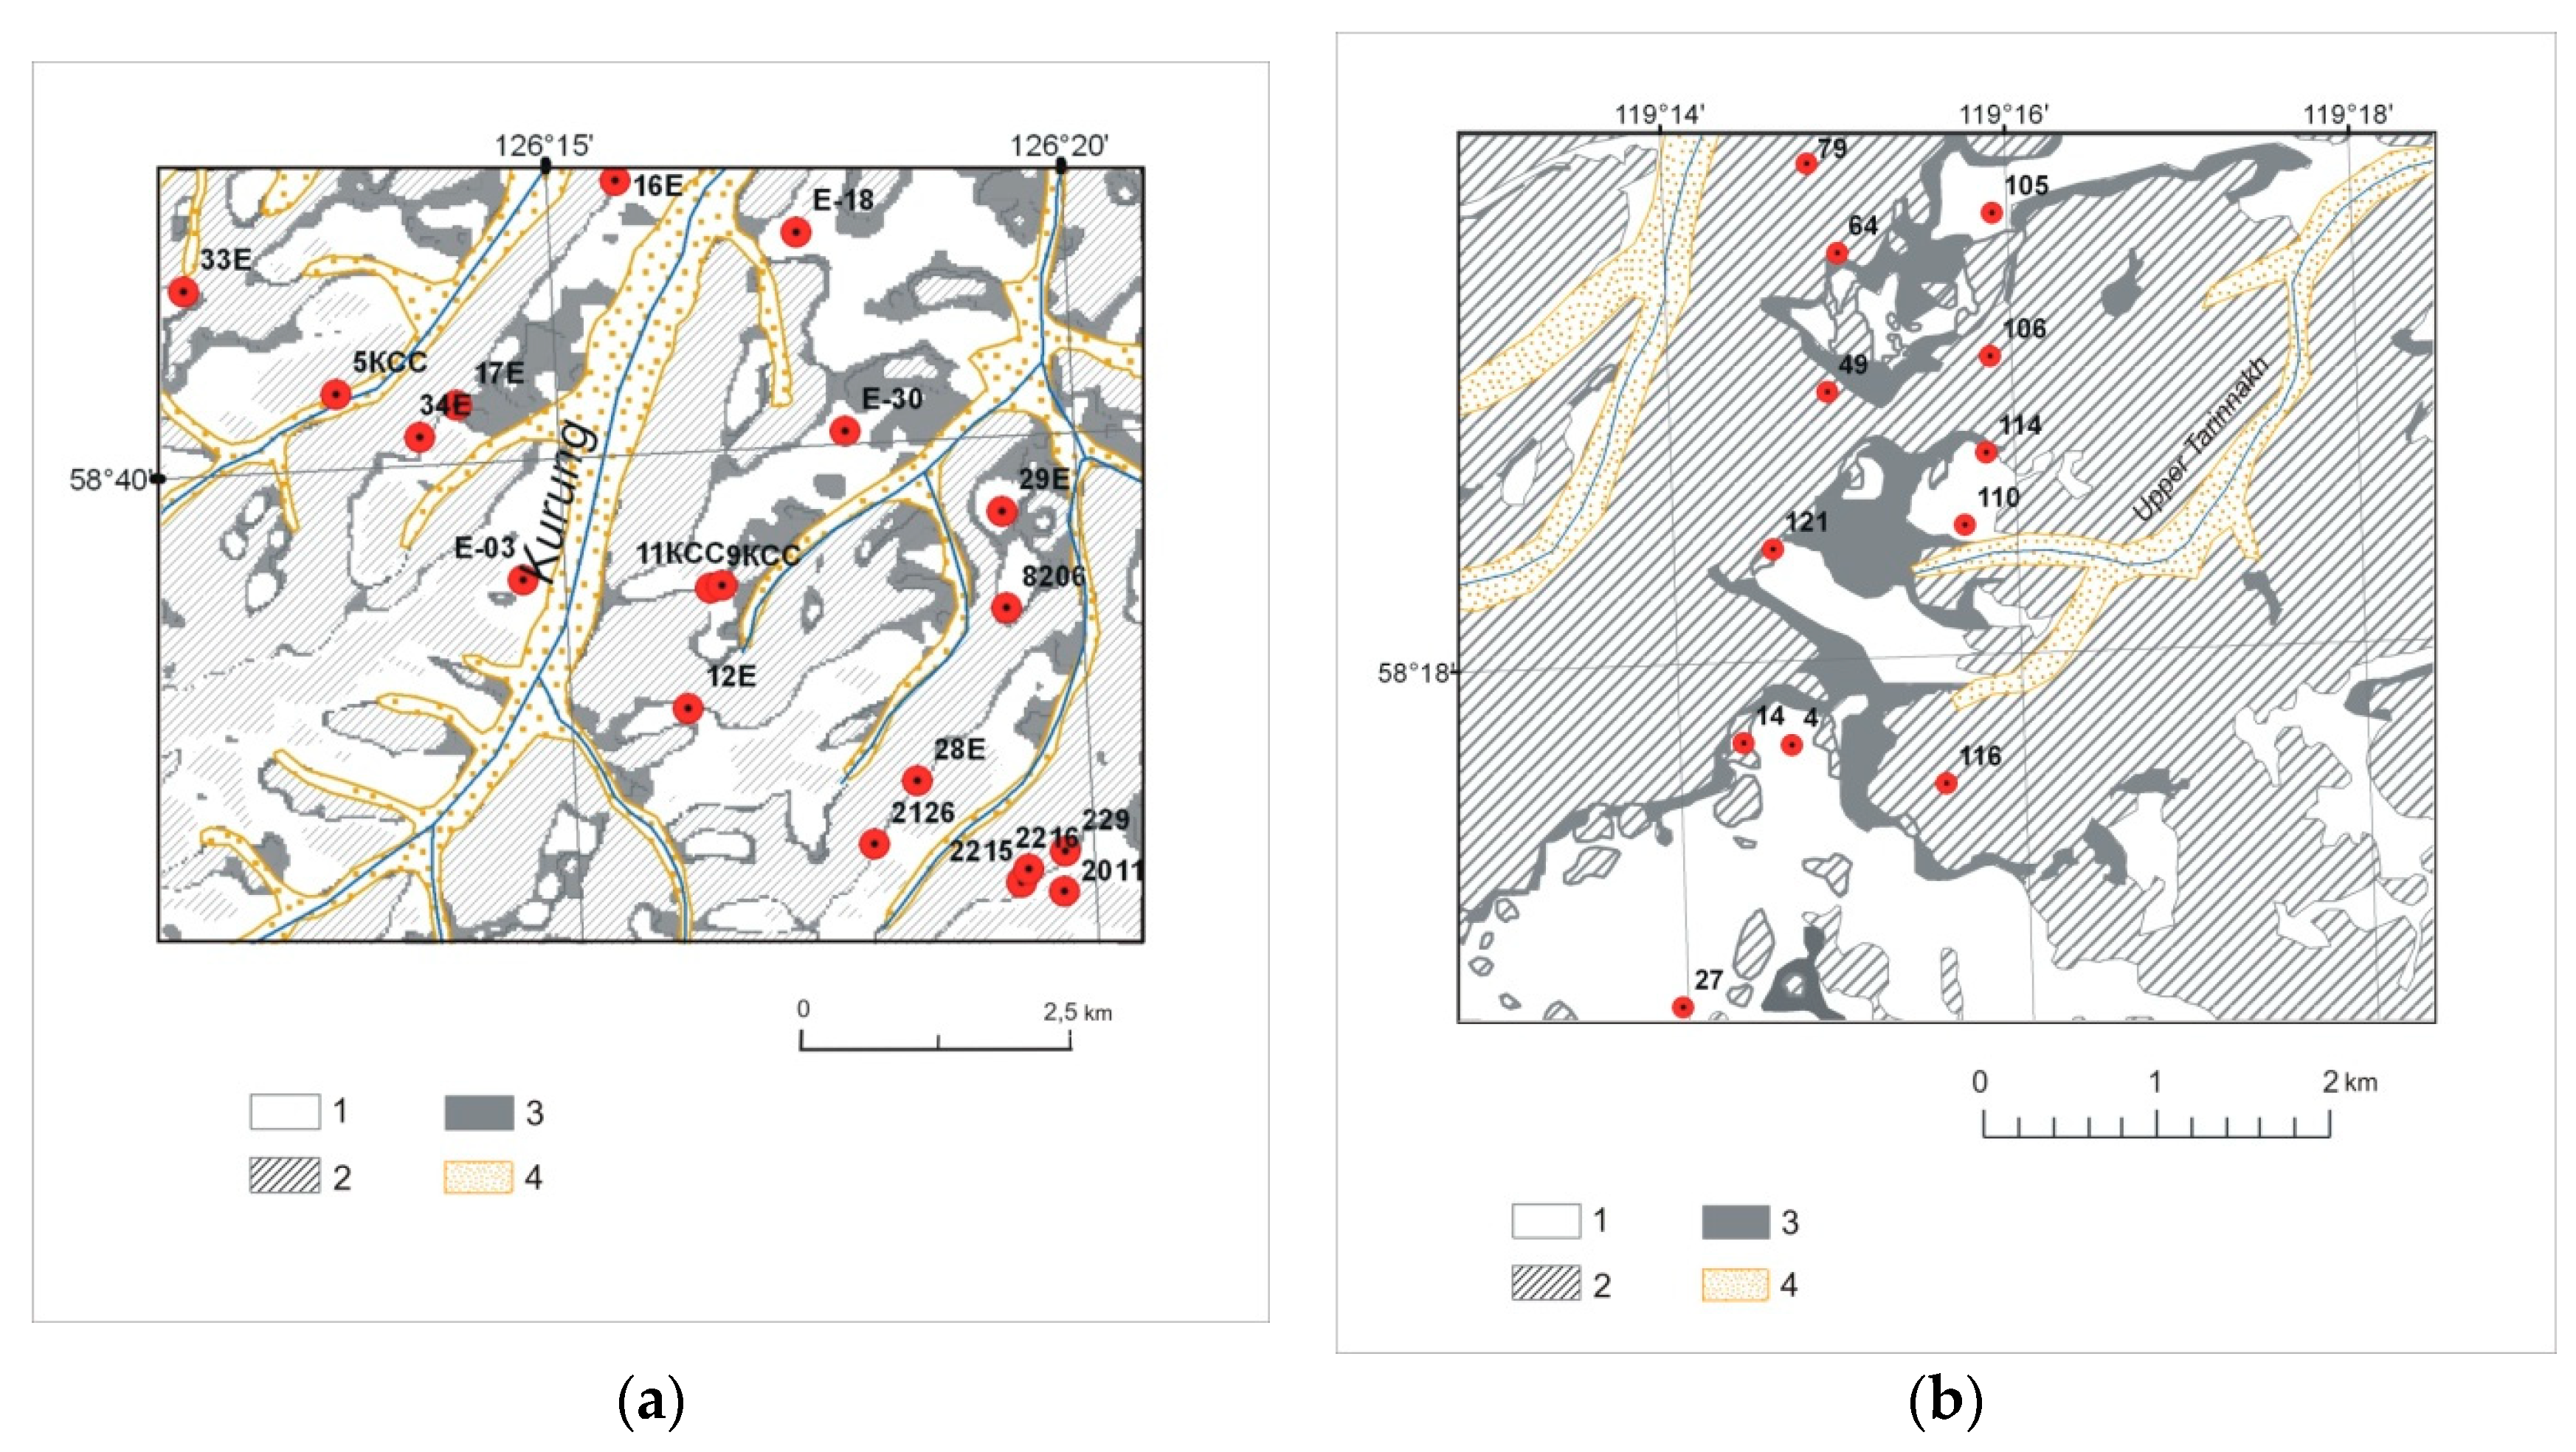
Figure 7.
(a) Permafrost map of the Elkon Massif, fragment. (b) Permafrost map of the Olekma-Chara Upland (Tarinnakh field), fragment. Numbered dots—numbers of geothermal boreholes. 1—unfrozen ground; 2—permafrost; 3—ground with the temperature near 0 °C; 4—river valley.
Figure 7.
(a) Permafrost map of the Elkon Massif, fragment. (b) Permafrost map of the Olekma-Chara Upland (Tarinnakh field), fragment. Numbered dots—numbers of geothermal boreholes. 1—unfrozen ground; 2—permafrost; 3—ground with the temperature near 0 °C; 4—river valley.


Table 1.
Ground temperatures in boreholes (presented in map fragments).
| Permafrost Boreholes | |||
|---|---|---|---|
| Elkon Mountain | Olekma-Chara Upland (Tarinnakh field) | ||
| Borehole Number | Ground Tempera Ture (°C) | Borehole Number | Ground Tempera Ture (°C) |
| 34 E | −3.1 | 79 | −1.8 |
| 9 KCC | −1.2 | 64 | −3.3 |
| 28 E | −2.8 | 49 | −4.2 |
| 2126 | −1.4 | 106 | −1.7 |
| 229 | −1.5 | 121 | −4.0 |
| 2215 | −2.8 | 14 | −3.6 |
| 2216 | −3.1 | 116 | −1.6 |
| 2011 | -2.2 | ||
| Non-Permafrost Boreholes | |||
| 33 E | 1.6 | 105 | 0.1 |
| 5 KCC | 0.3 | 114 | 0.4 |
| 16 E | 1.9 | 110 | 0.5 |
| 17 E | 0.6 | 4 | 0.6 |
| E03 | 2.0 | 27 | 1.1 |
| E18 | 2.0 | ||
| E30 | 0.7 | ||
| 11 KCC | 1.0 | ||
| 12 E | 0.4 | ||
| 29 E | 0.4 | ||
| 8206 | 1.1 | ||
Table 2.
Indicators for permafrost and unfrozen ground, Elkon Massif, Olekma-Chara Upland (Tarinnakh field), (segment).
Table 2.
Indicators for permafrost and unfrozen ground, Elkon Massif, Olekma-Chara Upland (Tarinnakh field), (segment).
| Landscape Indicators | Actual Data ofGround Temperature | LST (°C) | ||||||
|---|---|---|---|---|---|---|---|---|
| Relief (H: 700–1200 m) | Vegetation Cover | Altitude Landscape Belt | Snow Cover, cm | Ground Condition | Ground Tempera Ture (°C) | Borehole Number | ||
| Exposition | Slope | |||||||
| Elkon mountain | ||||||||
| North-west | gentle (5–10°) | sparse larch forest with mountain pine thickets | mountain sparse woodland | 80–100 | Permafrost | −1.4 | 2126 | 14-15 |
| North-west | moderate (10–15°) | mountain pine thickets | subalpine shrub | 80–100 | Permafrost | −1.5 | 229 | 13–14 |
| North-west | steep (15–25°) | sparse larch forest with mountain pine thickets | mountain sparse woodland | 80–100 | Permafrost | −3.3 | 2215 | 9–13 |
| East | gentle (5–10°) | mountain pine thickets | subalpine shrub | 120 cm and above | Unfrozen ground | 0.9 | 296 | 16–17 |
| South-east | gentle (5–10°) | mountain pine thickets | subalpine shrub | 100–120 | Unfrozen ground | 1.1 | 8206 | 17–18 |
| Olekma-Chara Upland (Tarinnakh field) | ||||||||
| North-east | gentle (5–10°) | larch forest | mountain taiga | 60–90 | Permafrost | −1.6 | 116 | 5–6 |
| North-west | moderate (10–15°) | open larch forest with alder, dwarf birch and mountain pine | mountain sparse woodland | 40–60 | Permafrost | −4.2 | 49 | 6–7 |
| North-west | gentle (5–10°) | stone fields (with lichen) | azonal | 10–40 | Permafrost | −3.3 | 64 | 7–8 |
| South-east | gentle (5–10°) | mountain pine thickets | subalpine shrub | 90–110 | Unfrozen ground | 0.5 | 110 | 9–10 |
| South-east | moderate (10–15°) | open larch forest with alder, dwarf birch and mountain pine | mountain sparse woodland | 90–110 | Unfrozen ground | 0.7 | 107 | 10–11 |
© 2018 by the authors. Licensee MDPI, Basel, Switzerland. This article is an open access article distributed under the terms and conditions of the Creative Commons Attribution (CC BY) license (http://creativecommons.org/licenses/by/4.0/).
Share and Cite
MDPI and ACS Style
Kalinicheva, S.V.; Fedorov, A.N.; Zhelezniak, M.N. Mapping Mountain Permafrost Landscapes in Siberia Using Landsat Thermal Imagery. Geosciences 2019, 9, 4. https://doi.org/10.3390/geosciences9010004
AMA Style
Kalinicheva SV, Fedorov AN, Zhelezniak MN. Mapping Mountain Permafrost Landscapes in Siberia Using Landsat Thermal Imagery. Geosciences. 2019; 9(1):4. https://doi.org/10.3390/geosciences9010004
Chicago/Turabian StyleKalinicheva, Svetlana V., Alexander N. Fedorov, and Mikhail N. Zhelezniak. 2019. "Mapping Mountain Permafrost Landscapes in Siberia Using Landsat Thermal Imagery" Geosciences 9, no. 1: 4. https://doi.org/10.3390/geosciences9010004
Note that from the first issue of 2016, this journal uses article numbers instead of page numbers. See further details here.