Monitoring Network for Atmospheric and Soil Parameters Measurements in Permafrost Area of Buryatia, Russian Federation

1
Institute of General and Experimental Biology of the Siberian Branch, Russian Academy of Sciences, 6, Sakhyanovoy str., Ulan-Ude 670047, Russia
2
Faculty of Biology, Geography and Land Management, Buryat State University, 24a, Smolina str., Ulan-Ude 670000, Russia
3
Institute of Physical Material Science of the Siberian Branch, Russian Academy of Sciences, 6, Sakhyanovoy str., Ulan-Ude 670047, Russia
*
Author to whom correspondence should be addressed.
Geosciences 2019, 9(1), 6; https://doi.org/10.3390/geosciences9010006
Submission received: 29 October 2018
/
Revised: 15 December 2018
/
Accepted: 17 December 2018
/
Published: 21 December 2018
(This article belongs to the Special Issue Permafrost Landscapes: Classification and Mapping)
Abstract
:The monitoring network for the measurement of atmospheric and soil climate parameters was created at the southern boundary of the permafrost zone within the territory of the Republic of Buryatia, Russian Federation. Based on the obtained data, the processes of soil freezing and thawing were studied. Negative temperatures in cold soils occurred within 5.5–6 months, whereas the subsoil was in a thawed state most of the year. On the contrary, permafrost-affected soils were thawed for 4.5–5 months, remaining frozen in the subsoil for most of the year. We propose referring to the observed spatial–temporal differences in the temperature dynamics as the “mirror imaging” of the distribution of heat and cold (frost) in the studied soils of the permafrost zone.
1. Introduction
The environmental conditions of the Republic of Buryatia, Russian Federation, are characterized by a mountainous relief, a sharply continental climate, permafrost, spatial heterogeneity of parent rocks and vegetation, as well as a variety of soil cover [1]. The southern boundary of the cryolithozone stretches over the entire territory of the Republic (Figure 1a), and current global changes can cause permafrost degradation [2,3,4]. Permafrost, lithology, and plant cover are complicated and are related to terrain dissection, which is why different soils with contrasting weathering and soil formation regimes have formed in the study area [5,6].
In landscapes in the south of the Vitim Plateau in the period from 1909 to 2008, the ambiguous response of the seasonal soil thawing layer to global warming has been distinguished [7,8]. The maximum change in the depth of the thawing of soils (to 1.40–1.70 m) over the twentieth century has been revealed for open steppe spaces. In marshy meadows with sedge and birch shrubs, changes in permafrost thermal conditions have not been recorded. In larch forests of permafrost areas, a positive trend has been weakly expressed (0.25–0.30 m).
Thus, the territory of the Republic of Buryatia is characterized by a unique combination of soil forming factors, is located on the southern border of the permafrost zone, and therefore is an appropriate model for quantifying the processes of soil freezing and thawing in connection with global climate change.
2. Materials and Methods
In Russia, systematic measurements of the temperature profile of soils are performed manually [9]. Measurements from 0 to 0.20 m are only carried out in summer, and measurements from 0.20 to 3.20 m are performed daily year-round, including in winter.
The established atmosphere and soil measurement complex (ASMC) network [10] allows information to be promptly received on the indicators of the atmospheric and soil climate and at regular intervals. Similar data were shown, but only year-round, in Reference [11]. Soil temperatures at Toolik Station, Alaska, are represented only by daily average values along the profile 0.006, 0.087, 0.120, 0.160, 0.236, 0.280, 0.312, 0.387, 0.463, 0.616, 0.650, 0.768, and 0.978 m. Measurements are made with a Campbell 107 and MRC Temperature Probe. In such systems, each sensor has a cable. These cables are usually bundled, and each cable is a heat conductor. This heat adds an error to the measurement due to the thermal influence of the cables on each other. Therefore, the ASMC temperature probe is free from these disadvantages.
The ASMC allows the long-term automatic measurement of the vertical profile of temperature and moisture in the soil–atmosphere system from a depth of 3.20 m to a height of 10.00 m. Data were read remotely using a GSM modem via a cellular communication channel [12]. Soil temperature was measured every three hours at depths of 0, 0.02, 0.05, 0.10, 0.15, 0.20, 0.25, 0.30, 0.35, 0.40, 0.45, 0.50, 0.55, 0.60, 0.80, 1.00, 1.20, 1.60, 2.40, and 3.20 m. The temperature soil probe was constructed in the form of a three-wire circuit board with high-precision digital DS18B20 thermometers protected by heat shrink tubing. The sensor accuracy was adjusted to ±0.1 °C. Periods of soil temperature measurements were averaged data for 10 days, and air temperature and precipitation were monthly averaged data.
The conjugate analysis of the created cartographic information, according to Reference [13], of different thematic layers of climatic indicators displays their large heterogeneity. For example, the presented thematic layers showed the air temperature distribution during the coldest (January) and warmer (July) months, the thickness of the snow cover, and the amount of precipitation at the beginning (May) and the end (August) of summer in the Baikal region. Such a systematic approach and a cartographic method of research further allowed us to show the heterogeneous influx of heat and precipitation to the soil surface as well as their transition and distribution into the soil.
The classification of soils was based on the criteria of the World Reference Base (WRB) system [14]. Physical and chemical properties of soils were determined using conventional procedures [15,16].
Here, pH was determined by a potentiometer in a suspension at a soil/water (or 1 M KCl) ratio of 1:2.5 and single shaking, followed by settling for 30 min (pHH2O) or 18–20 hours with periodic mixing (pHKCl). Organic carbon was determined by the Tyurin method, which included the wet digestion of organic substance in a mixture of 0.4 N K2Cr2O7 and concn H2SO4 (1:1) under heating to 150 °C for 20 min. Later, measurements were performed by photometry on a SPECOL 211 spectrometer at 590 nm. Carbonates in the soil were determined using the Kozlovskii procedure. A soil sample was treated with 2 M HCl, and the released CaCO3 was absorbed by a 0.4 M NaOH solution. Then, a saturated BaCl2 solution was added to the tube with NaOH, and the excess alkali was titrated with 0.2 M HCl. Exchangeable cations were determined in nonsaline carbonate-free soils using the Schollenberger method. These were displaced by multiple washing of the sample with a 1 N ammonium acetate solution at pH 7. Saline soils were analyzed by the Pfeiffer method after preliminarily washing off soluble salts with 70% ethanol followed by displacing exchangeable cations with Pfeiffer reagent (0.1 M NH4Cl in 70% ethanol with pH 7) at a soil/solution ratio of 1:20. Exchangeable Ca and Mg in the extracts were determined using the atomic absorption technique. Exchangeable Na was determined by atomic emission spectroscopy on a Kvant-2A spectrometer. Particle-size analysis was performed for particles <1 mm. After pretreatment with a dispersing agent (4% Na pyrophosphate), the fraction 1–0.25 mm was separated by wet sieving. The content of silty and clay particles (<0.05 mm) was determined by sedimentation (pipette method).
To compare the soil climate, ASMC was established on different types of permafrost distribution (Figure 1a):
- Continuous: The central part of the Vitim Plateau (Turbic Cryosols (Humic), Bagdarin polygon, N54°37’326’’, E113°48’108’’, 947 m a.s.l.).
- Discontinuous: The south of the Vitim Plateau (Luvic Chernozems (Stagnic, Tonguic), Eravna polygon, N52°30’530’’, E111°32’443’’, 933 m a.s.l.).
- Sporadic: The north of the Selenginskoye Middle Mountains (Natric Chernozems (Stagnic), Kizhinga polygon, N51°82’384’’, E109°82’018’’, 726 m a.s.l.) and Eastern Pribaikalye (Entic Podzols, Goryachinsk polygon, N52°98’5606’’, E108°28’4349’’, 502 m a.s.l.).
The characteristics of these soils are given below (Table 1).
Turbic Cryosols (Humic) are formed on the terrace above the floodplain under meadow grasses. The soil surface is hummocky, with sinks and frost cracks up to 0.02 m width. These soils are characterized by a gray humus horizon, a weak subangular blocky structure, light texture, slightly acidic reaction, and a low humus and moisture content in the upper horizons. From a depth of 0.15–0.20 m, a heavy loamy cryometamorphic horizon is observed, moisture content increases, and signs of redoximorphism and cryoturbation appear. Permafrost is recorded at a depth of 1.90–1.95 m, and the moisture reserve (0–1.00 m) in these soils is average.
Luvic Chernozems (Stagnic, Tonguic) are found on the lacustrine plain of the Eravninskaya depression under meadow steppes, with grass communities and fragments of xerophytic communities. These soils are characterized by a loamy dark humus horizon with a high content of humus, a neutral pH, and a fine subangular structure. A yellow-brown moist heavy loamy carbonate horizon with a subangular and angular blocky structure begins from a depth of 0.53 (0.65) m. There are frost cracks and cryoturbations including gravel and stones throughout the soil profile. Soil moisture content increases with depth. Permafrost is found at a depth of 2.75–2.80 m, and the moisture reserve (0–1.00 m) in these soils is average.
Natric Chernozems (Stagnic) are formed in the transit part of the gentle long slope (1–2°) of the southern exposition of the Kizhinginskaya depression. Arable land is abandoned. Cereal forb vegetation has a 5%–10% projective cover. There are single drying cracks on the surface. Fine and medium gravel covers 10%–15% of the surface. The microrelief is hummocky with polygonal fracturing (0.20 m in width). These soils are characterized by a thin dry dark-gray turf, loamy texture, and a granular fine subangular blocky structure. Weak effervescence with HCl is present on the surface. There is a wet, brownish-dark-gray, very dense, loamy humus horizon in a depth of 0.02 (0.03) to 0.27 (0.29) m of the blocky-prismatic angular structure. In a dry state, the aggregates are very firm. The carbonate horizon (0.27 (0.29)–0.75 m) is moist, yellow-brown with dark gray vertical stripes and pockets, very dense, heavy loamy, and of a nutblocky prismatic angular structure. The clear effervescence with HCl appears from 0.29 m. There is a moist, light brown, dense, loamy, transitional carbonate horizon C (carbonate) from 0.75 to 1.05 m, characterized by a subangular and angular blocky structure and strong effervescence with HCl. The humus content is high in the upper horizons. The middle horizon contains Na, along with Ca and Mg. Soils freeze seasonally at 2.40–2.45 m, remaining constantly thawed in the subsoil. The moisture reserve (0–1.00 m) in these soils is low average.
Entic Podzols are found under pine-larch forests mixed with single cedars and birches on the eastern coast of Lake Baikal. The litter (A0–0.13 (0.16) m) is coarse, consisting of weakly decomposed remnants of moss, Empetrum nigrum, Vaccinium vitis-idaea, and Rhododendron dauricum roots. Below this is a 0.02-m-thick layer of wet, light-gray, bleached sand with semidecomposed roots. Middle horizons B are represented by moist fine-grained structureless and compacted sand, separated in density and color, from brown to ocher-brown. Horizon C is at a depth of 0.41 (0.44) m, and is moist, grayish-brown sand with fine gravel and small stones. Soils seasonally freeze at 1.60–1.65 m, remaining constantly thawed in the subsoil. The moisture reserve (0–1.00 m) in these soils is low average.
Thus, Turbic Cryosols (Humic) and Luvic Chernozems (Stagnic, Tonguic) form in harsh climatic conditions (cold and long winter, short summer), Natric Chernozems (Stugnic) form in an extracontinental climate with a cold winter and a dry short summer, and Entic Podzols form in a humid climate with a relatively “warm” winter and “cool” summer, with an abundance of precipitation in winter.
3. Results and Discussion
Our in situ measurements of the spatial–temporal variability of the temperature and permafrost soil regimes on the southern boundary of the cryolithozone are pioneering. Analysis of the obtained data shows that according to the WRB [14], only Turbic Cryosols (Humic) could be called permafrost-affected soil (Figure 2a). According to the U.S.S.R.’s classification of the thermal regime of soils [18], Luvic Chernozems (Stagnic, Tonguic) to the south of the Vitim Plateau also belong to permafrost soils (Figure 2b), and Natric Chernozems (Stagnic) of the Kizhinginskaya depression and Entic Podzols of the Eastern Baikal Region belong to the group of nonpermafrost soils (Figure 3).
The freezing process of Turbic Cryosols (Humic) in the central part of the Vitim Plateau began in late September–early October, which was 10, 15, and 30 days earlier than the case of the soils of the Eravna, Kizhinga, and Goryachinsk polygons, respectively. In Turbic Cryosols (Humic) and Luvic Chernozems (Stagnic, Tonguic), the active layer froze completely in late October and early November, with continuous frost at a depth of 1.90–1.95 m in Bagdarin and 2.75–2.80 m in Eravna. The thawing process of permafrost soils began in early April–mid May. The beginning of a stable freeze usually coincides with the first week in October. This is the end of the full cycle of freezing and thawing of the Turbic Cryosols (Humic) and the Luvic Chernozems (Stagnic, Tonguic) in the Vitim Plateau (Figure 2a,b).
A completely different temperature regime was observed in the nonpermafrost Natric Chernozems (Stagnic) in the Kizhinginskaya depression and the Entic Podzols of the Eastern Pribaikalye in comparison to the permafrost soils of the Vitim Plateau. These soils seasonally froze only in winter to a depth of more than 2.40–2.45 m and 1.60–1.65 m, respectively. The thawing process began on the soils at the Kizhinga polygon in early April, which was 10, 15, and 20 days earlier than on the soils of the Goryachinsk, Eravna, and Bagdarin polygons, respectively (Figure 3).
The number of days of freezing of the Turbic Cryosols (Humic) throughout the profile in Bagdarin averaged over 2 years and 25 days, with a freezing rate of more than 10 cm/day, which was 20, 85, and 90 days less than in Eravna, Goryachinsk, and Kizhinga, with a speed of 7 cm/day, 1 cm/day, and 2 cm/day, respectively.
The process of soil thawing occurred faster in the Entic Podzols and lasted 35 days at a rate of 2.0 cm/day. This was 70, 80, and 105 days less than at the Bagdarin, Eravna, and Kizhinga polygons, where the thawing rate was 1.5 cm/day, 2.0 cm/day, and 1.7 cm/day, respectively.
For the observation period from 2014 to 2016, nonpermafrost soils were in a frozen state for only 5.5–6 months, remaining thawed in the subsoil for most of the year, whereas in permafrost soils, the temperature gradients were fundamentally different. Permafrost-affected soils melted seasonally (4.5–5 months) in summer, and remained in a frozen state in the subsoil for most of the annual cycle. This is the above-mentioned “mirror imaging” of the temperature regimes of permafrost and nonpermafrost soils.
Comparing the thermoisoplethes of the continuous year-round measurements of the temperature of permafrost and nonpermafrost soils showed the difference in their depth–time soil profiles. These spatial–temporal distinctions in temperature are proposed as being called the “mirror imaging” of the heat and cold (frost) pictures in the studied soils of the cryolithozone.
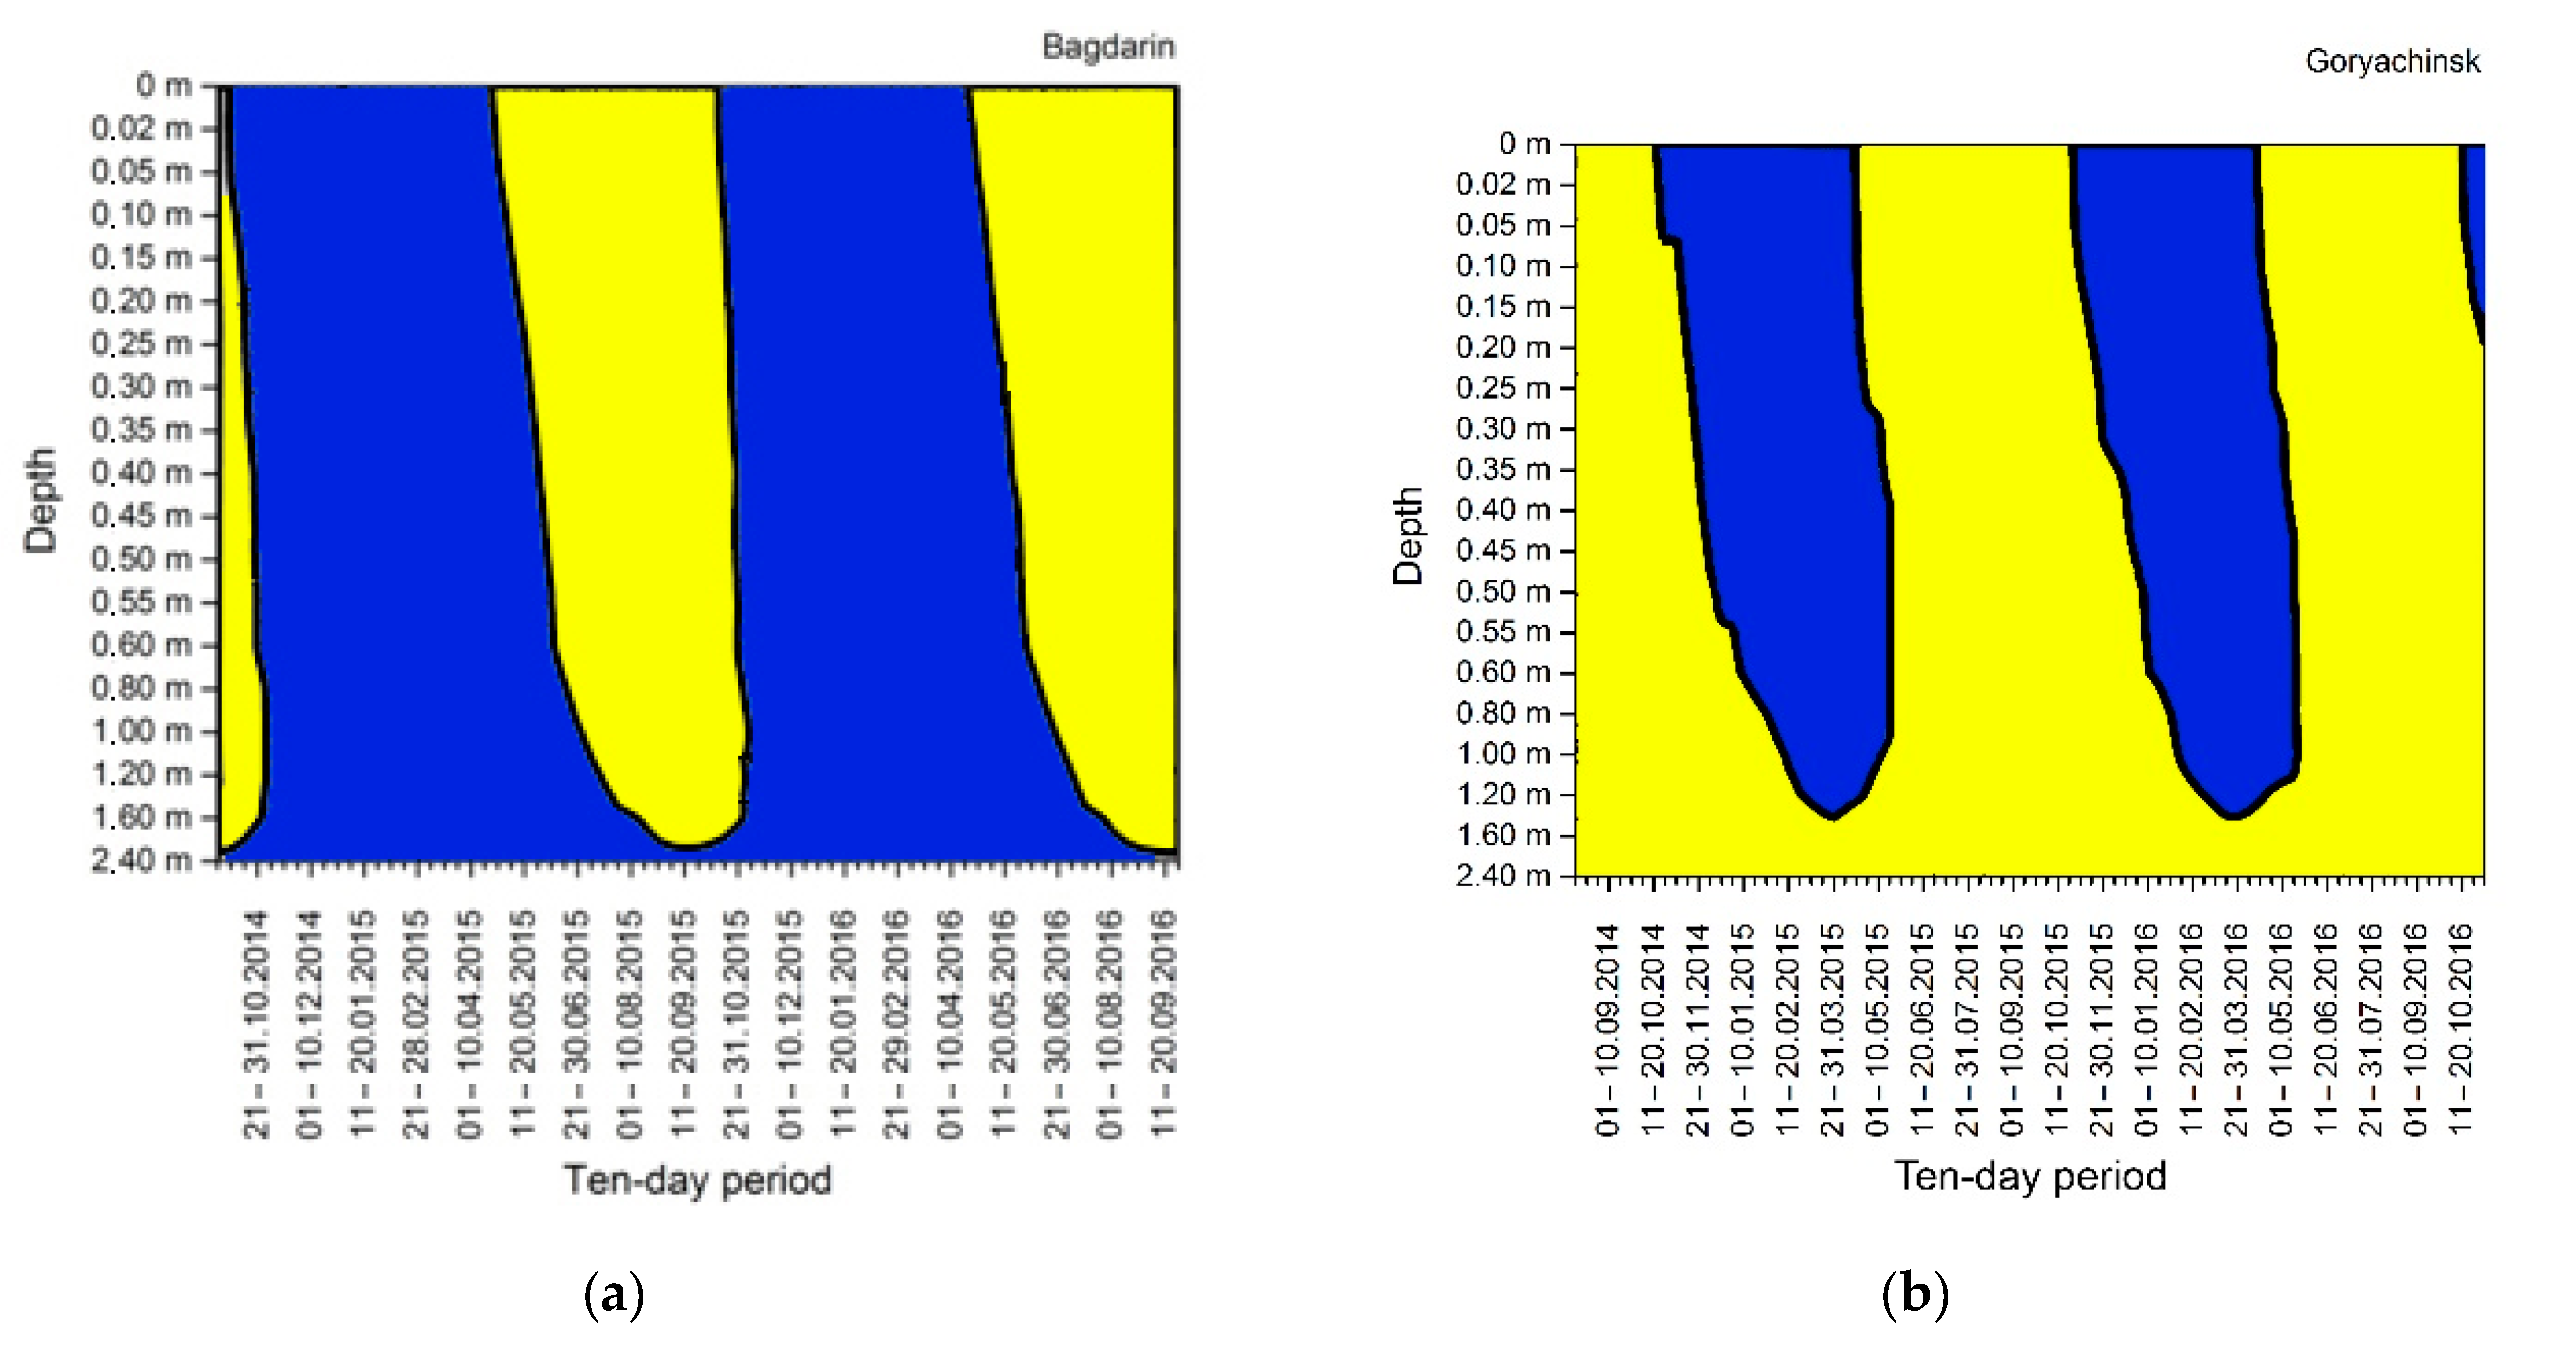
For an illustrative example, we present a comparison of thermoisoplethes of Turbic Cryosols (Humic) and Entic Podzols (Figure 4). Permafrost-affected soils of the central part of the Vitim Plateau thaw seasonally (4.5 months) in the summer, remaining frozen in the subsoil during most of the annual cycle. On the contrary, the cool soils of the Eastern Baikal region spend 5.5–6.0 months in a frozen state, remaining in a thawed state at the base of the rock for most of the year. These spatial–temporal differences in heat and cold (frost) are a clear picture of the “mirror image” of the processes of thawing and freezing in permafrost-affected and cool soils.
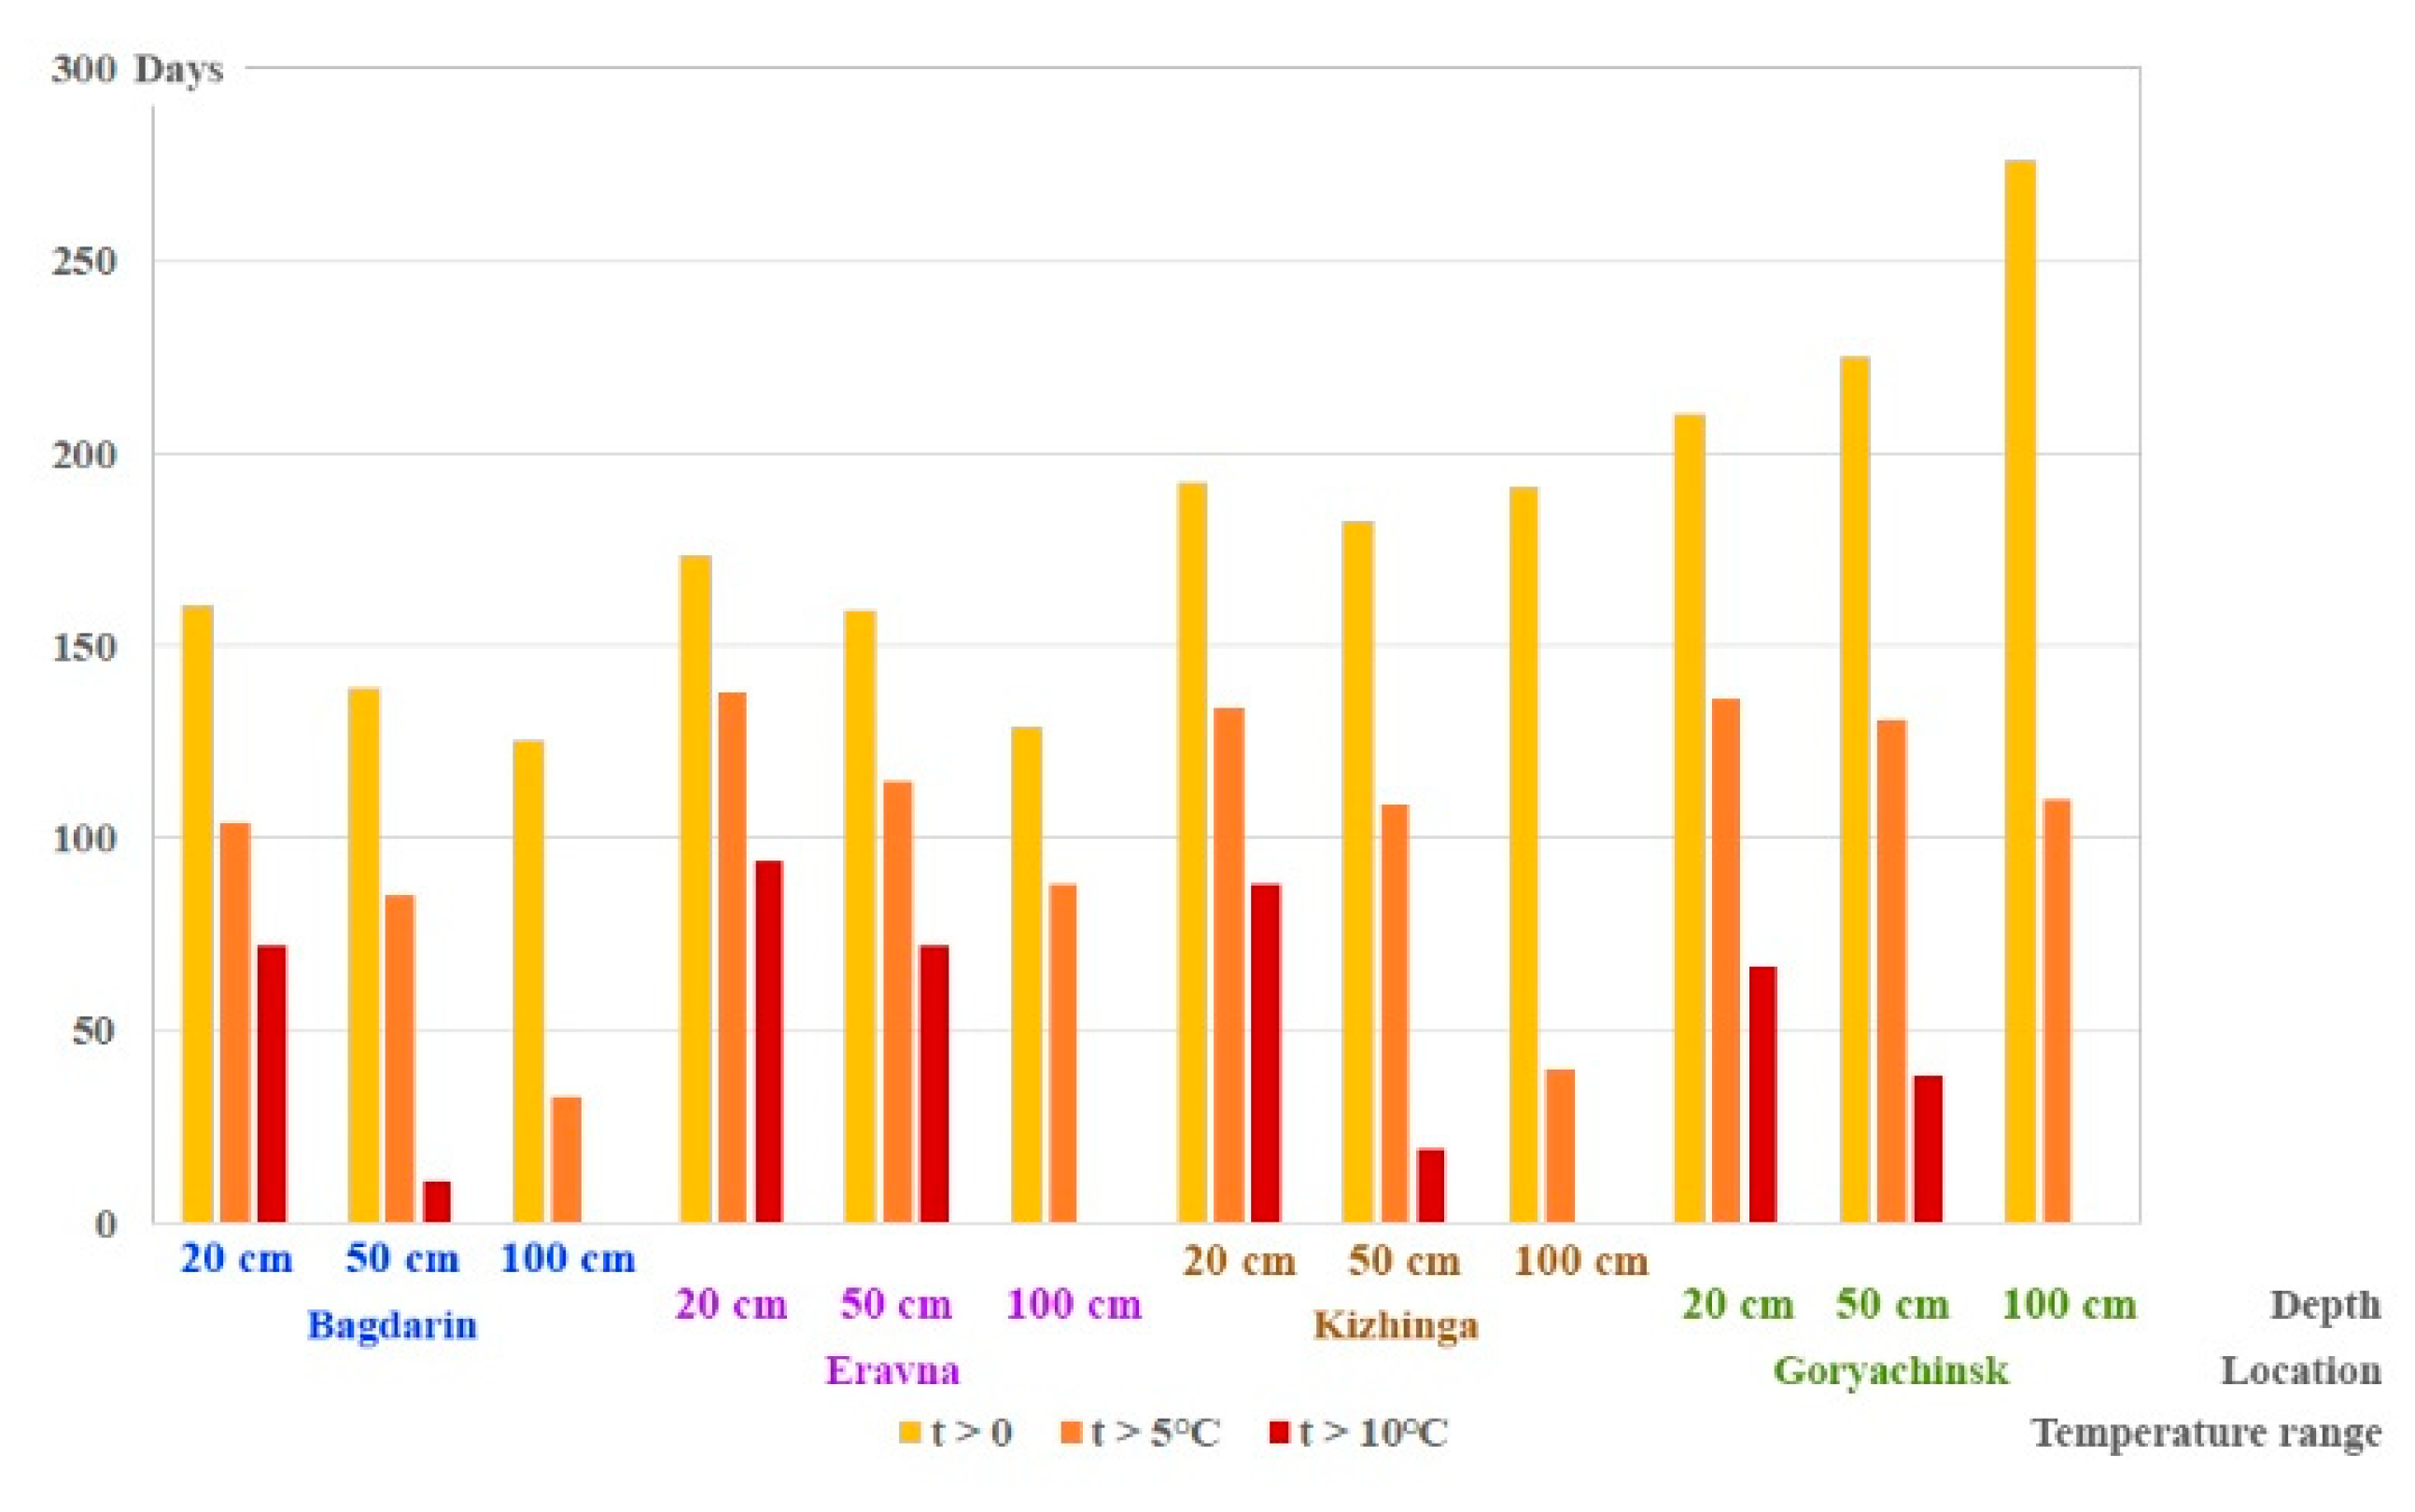
Of great interest is the penetration of positive temperatures and their duration at different depths of the studied soils. The collection, systematization, and analysis of these data showed a large heterogeneity of the temperature and permafrost soil regimes (Figure 5). For the analysis, of the three years studied, data were taken from the full calendar year from January to December of 2015. The greatest differences were found in the duration of positive temperatures over 0 °С at a depth of 1.00 m. Thus, in the Entic Podzols of the Goryachinsk in the Eastern Pribaikalye, this characteristic was equal to 276 days, which was 85, 147, and 151 days longer than the duration of temperatures in the soils of the Kizhinga, Eravna, and Bagdarin polygons, respectively.
The patterns of temperature distribution over 5 °C in these soils were somewhat different. The difference at the beginning and duration of these temperatures at a depth of 1.00 m was the same in both Kizhinga and Goryachinsk (109 and 110 days), and in permafrost soils, it was much less, at 33 days in Bagdarin and 88 days in Eravna.
A fundamentally different situation was observed in the distribution and duration of temperatures above 10 °C. Luvic Chernozems (Stagnic, Tonguic) already dominated in this case, with temperatures above 10 °C at a depth of 0.20 m for 94 days, which was 6, 22, and 27 days longer than in Kizhinga, Bagdarin, and Goryachinsk, respectively. The paradox of the permafrost soils at these depths being warmer than the nonpermafrost Natric Chernozems (Stagnic) and the Entic Podzols could be explained by the continental climate of the Vitim Plateau (hot dry summer and cold winter). Here, in May, the value of the precipitation/evaporation coefficient can reach 0.1–0.2, as if it is a semidesert [5]. Therefore, the heat transfer to the soil is quite active when compared to the “humid” climate of the Eastern Pribaikalye. These landscapes are characterized by relatively cool summers and mild winters due to the warming influence of Lake Baikal. It should also be noted that the temperature of 10 °C did not reach the depth of 1.00 m in all of the studied soils.
Thus, based on the collection and analysis of information using modern instruments (ASMC), it became possible to identify more accurate patterns of temperature dynamics, the rate of thawing, and the freezing depth of the soil. The “mirror imaging” of the processes of thawing in the permafrost soils of the Vitim Plateau and freezing in the nonpermafrost soils of the northern Selenginskoye Middle Mountains and Eastern Pribaikalye was established. The processes of thawing and freezing primarily depend on the input of solar radiation and the amount of precipitation. Further temperature distribution in the soil is related to the nature of the vegetation cover and soil properties (particle size distribution, humus content, structure and density, moisture supply). It was shown that freezing began at the Bagdarin polygon at the end of September, which was 10–15 days earlier than in Eravna and Kizhinga, and 30 days earlier than in Goryachinsk. Soils seasonally froze in winter in Kizhinga and Goryachinsk to depths of more than 2.40–2.45 m and 1.60–1.65 m, respectively. The freezing speed was five times faster in the permafrost soils (Vave = 9 cm/day) than in the nonpermafrost ones (Vave = 1.6 cm/day).
It was revealed that thawing started at the beginning of April in the Natric Chernozems (Stagnic). The thawing process was faster in the Entic Podzols and lasted 35 days at a speed of 2.0 cm/day. This was 70, 80, and 105 days less than at the soils of the Kizhinga, Eravna, and Bagdarin polygons.
The greatest differences were found in the duration of temperatures >0 °С at a depth of 1.00 m: 275 days in the Entic Podzols, and 190, 130, and 125 days in Kizhinga, Eravna, and Bagdarin, respectively. The number of days with temperatures above 10 °C at a depth of 0.20 m was 94 for Eravna, which was 27, 22, and 6 days longer than in Goryachinsk, Bagdarin, and Kizhinga, respectively.
During the period of measurement in the nonpermafrost soils, negative temperatures were observed for 5.5–6.0 months, remaining in the subsoil in a thawed state for most of the year. The permafrost soils seasonally thawed only in summer for 4.5–5.0 months, remaining frozen in the sole (rocks) for most of the year.
4. Conclusions
The monitoring network of observations, which was developed for the first time at the southern boundary of the cryolithozone of the Republic of Buryatia, the Russian Federation, allows data on the indicators of the atmospheric and soil climate to be received promptly and at regular intervals. Based on the collected information and analysis, it became possible to identify more accurate patterns of temperature dynamics and the rate of soil thawing and freezing. Thus, the ASMC network is ready to become part of the WMO’s Regional Climate Center Network [19].
The “mirror imaging” of the processes of thawing in the permafrost-affected soils of the Vitim Plateau and freezing in the nonpermafrost soils of the northern Selenginskoye Middle Mountains and Eastern Pribaikalye was established. During the period of observations, in nonpermafrost soils negative temperatures were observed for 5.5–6 months, remaining in a thawed state in the base of the rock for most of the year. On the contrary, permafrost soils seasonally melted for 4.5–5 months only in summer, remaining frozen in the subsoil for most of the year.
A comparison of the thermoisoplethes of the continuous year-round temperature measurements of permafrost and nonpermafrost soils showed the difference in the patterns of their depth–time soil profiles. These spatial–temporal differences in temperature are proposed as being called the “mirror imaging” of the patterns of heat and cold distribution (permafrost) in the soils of the cryolithozone that were studied.
Author Contributions
B.N.B. proposed a topic, conceived and developed research, methodology and data analysis, writing, viewing, editing, administration and financing of the project. B.A.V. provided instrumentation, data collection and systematization, preparation of tables and figures for analysis, manuscript design.
Funding
The study was supported by the budget projects of the Federal Agency of Scientific Organizations FASO 0337-2016-0005, “Evolution, functioning, and ecological biochemical role of the Baikal region soils under conditions of aridization and desertification; the development of methods f or control over their production processes”, FASO 0336-2016-0002 12.2.4; “Propagation of radiowaves in inhomogeneous impedance channels”, AAAA-A17-A117112870130-4; and "Spatio–temporal assessment of agricultural land in Eastern Siberia". The block of the project is the "Theoretical substantiation and methodology for the assessment of agricultural landscapes based on ground-based monitoring and remote sensing of the Earth" of the Integrated Basic Research Program of the SB RAS II.1.
Acknowledgements
We thank editors and anonymous reviewers for their helpful comments that improved the manuscript.
Conflicts of Interest
The authors declare no conflicts of interest.
References
- The Ecological Atlas of the Baikal Basin; V.B. Sochava Institute of Geography SB RAS: Irkutsk, Russia, 2015; 145p, ISBN 978-5-94797-243-6.
- Williams, P.J.; Michael, W.S. The Frozen Earth: Fundamentals of Geocryology; Cambridge University Press: Cambridge, UK, 1989; p. 306. [Google Scholar]
- McGuire, A.D.; Chapin, F.S.; Walsh, J.E.; Wirth, C. Integrated Regional Changes in Arctic Climate Feedbacks: Implications for the Global Climate System. Annu. Rev. Environ. Resour. 2006, 31, 61–91. [Google Scholar] [CrossRef]
- Hansen, J.; Sato, M.; Ruedy, R.; Lo, K.; Lea, D.W.; Medina-Elizade, M. Global Temperature Change. Proc. Natl. Acad. Sci. USA 2006, 103, 14288–14293. [Google Scholar] [CrossRef] [PubMed]
- Soils and Temperature Regimes of the Central Buryatia and the West Transbaikal Mountains. In Guidebook for Field Excursions of the V International Conference on Cryopedology, Ulan-Ude–Komsomolsk–Goryachinsk, 18–20 September 2009; Institute of Geography RAS: Moscow, Russia, 2009; p. 55.
- Soils of Cold Areas: Genesis, Geography, and Ecology (Devoted to 100-Anniversary of prof. O.V. Makeev). In Guidebook for Field Excursions of the All-Russian Conference with International Participation, Ulan-Ude–Sosnovo-Ozersk–Goryachinsk–Arshan, 31 August–9 September 2015; Institute of General and Experimental Biology SB RAS: Ulan-Ude, Russia, 2015; p. 177.
- Badmaev, N.; Kulikov, A.; Tsydypov, B. Seasonal, Interannual and Centennial Variability of Thawing Depth of Permafrost-Affected Soils in Transbaikalia. In Proceedings of the 6th International Conference on Cryopedology Frost-affected Soils—Dynamic Soils in the Dynamic World, Krakow, Poland, 24–29 August 2013; p. 5. [Google Scholar]
- Badmaev, N.; Kulikov, A.; Tsydypov, B.; Garmaev, E. Spatio-Temporal Variability of Thawing Depth of Permafrost Landscapes in the Southern Part of the Vitim Plateau. In Proceedings of the Joint Science and Education Conference “Arctic Dialogue in the Global World”, Ulan-Ude, Russia, 16–17 June 2015; pp. 352–356. [Google Scholar]
- Korneva, I.A.; Lokoshchenko, M.A. Soil Temperature in Moscow and its Contemporary Variations. Russ. Meteorol. Hydrol. 2015, 40, 25–33. [Google Scholar] [CrossRef]
- Gonchikov, B.-M.; Badmaev, N.; Bazarov, A.; Mangataev, A.; Kulikov, A.; Gyninova, A.; Tsybenov, Y. About Creation of Automatic System Monitoring of Atmospheric and Soil Climate in Western Transbaikalia. Cryosols in Perspective: A View from the Permafrost Heartland. In Proceedings of the VII International Conference on Cryopedologv, Yakutsk, Russia, 21–28 August 2017; Desyatkin, R.V., Konyushkov, D.E., Eds.; Publishing House of the Institute of Biological Problems of the Cryolithozone SB RAS: Yakutsk, Russia, 2017; pp. 57–59. [Google Scholar]
- Soil Climate Research Stations. Available online: https://www.nrcs.usda.gov/wps/portal/nrcs/detail/soils/survey/climate/?cid=nrcs142p2_053712 (accessed on 19 November 2018).
- Bazarov, A.V.; Badmaev, N.B.; Kurakov, S.A.; Gonchikov, B.-M.N.; Tsybenov, Y.B.; Kulikov, A.I. Measuring Equipment for Automatic Long-Term Monitoring of Atmospheric and Soil Climate Parameters. Instrum. Exp. Tech. 2016, 186–201. [Google Scholar] [CrossRef]
- Loupian, E.A.; Proshin, A.A.; Bourtsev, M.A.; Balashov, I.V.; Bartalev, S.A.; Efremov, V.Y.; Kashnitskiy, A.V.; Mazurov, A.A.; Matveev, A.M.; Sydneva, O.A.; et al. IKI Center for Collective Use of Satellite Data Archiving, Processing and Analysis Systems Aimed at Solving the Problems of Environmental Study and Monitoring. Sovremennye Problemy Distantsionnogo Zondirovaniya Zemli Kosmosa [Curr. Probl. Remote Sens. Earth Space] 2015, 12, 263–284. (In Russian) [Google Scholar]
- World Reference Base for Soil Resources 2014. In International Soil Classification System for Naming Soils and Creating Legends for Soil Maps, 3rd ed.; FAO: Rome, Italy, 2014; ISBN 978-92-5-108370-3.
- Vadyunina, A.F.; Korchagina, Z.A. Metody Issledovaniya Fizicheskikh Svoystv Pochv [Methods for Studying the Physical Properties of Soil], 3rd ed.; Agropromizdat: Moscow, Russia, 1986; p. 416. (In Russian) [Google Scholar]
- Vorob’yeva, L.A. Teoriya i Praktika Khimicheskogo Analiza Pochv [Theory and Practice of Chemical Analysis of Soils]; Geos: Moscow, Russia, 2006; p. 400. (In Russian) [Google Scholar]
- Badmaev, N.B.; Kulikov, A.I.; Mironov, I.A. Permafrost. In Buryatia. Encyclopedic Reference Book in 2 Volumes; Ecos: Ulan-Ude, Russia, 2011; Volume 1, pp. 54–55. (In Russian) [Google Scholar]
- Dimo, V.N. Teplovoy Rezhim Pochv SSSR [Thermal Regime of the Soil of the USSR]; Kolos: Moscow, Russia, 1972; p. 360. (In Russian) [Google Scholar]
- WMO Launches Arctic Regional Climate Centre Network. Available online: https://public.wmo.int/en/media/press-release/wmo-launches-arctic-regional-climate-centre-network (accessed on 21 November 2018).
Figure 1.
(a) Map of the distribution of permafrost types [17] and the scheme of the atmosphere and soil measurement complex (ASMC) locations; (b) an example of a cartographic method of investigation.
Figure 1.
(a) Map of the distribution of permafrost types [17] and the scheme of the atmosphere and soil measurement complex (ASMC) locations; (b) an example of a cartographic method of investigation.

Figure 2.
Temperature and permafrost regime: (a) Turbic Cryosols (Humic) (Bagdarin polygon); (b) Luvic Chernozems (Stagnic, Tonguic) (Eravna polygon). ![Geosciences 09 00006 i001]() = frozen layer;
= frozen layer; ![Geosciences 09 00006 i002]() = thawed layer.
= thawed layer.
 = frozen layer;
  = thawed layer.
Figure 2.
Temperature and permafrost regime: (a) Turbic Cryosols (Humic) (Bagdarin polygon); (b) Luvic Chernozems (Stagnic, Tonguic) (Eravna polygon). ![Geosciences 09 00006 i001]() = frozen layer;
= frozen layer; ![Geosciences 09 00006 i002]() = thawed layer.
= thawed layer.
= frozen layer; = thawed layer.
Figure 3.
Temperature and permafrost regime: (a) cold Natric Chernozems (Mollic) (Kizhinga polygon); (b) Entic Podzols (Goryachinsk polygon). ![Geosciences 09 00006 i003]() = frozen layer;
= frozen layer; ![Geosciences 09 00006 i004]() = thawed layer.
= thawed layer.
 = frozen layer;
  = thawed layer.
Figure 3.
Temperature and permafrost regime: (a) cold Natric Chernozems (Mollic) (Kizhinga polygon); (b) Entic Podzols (Goryachinsk polygon). ![Geosciences 09 00006 i003]() = frozen layer;
= frozen layer; ![Geosciences 09 00006 i004]() = thawed layer.
= thawed layer.
= frozen layer; = thawed layer.
Figure 4.
Temperature and permafrost regime and “mirror image” of the soil thawing and freezing process: (a) Turbic Cryosols (Mollic) (Bagdarin polygon); (b) Entic Podzols (Goryachinsk polygon). ![Geosciences 09 00006 i005]() = frozen layer;
= frozen layer; ![Geosciences 09 00006 i006]() = thawed layer.
= thawed layer.
 = frozen layer;
  = thawed layer.
Figure 4.
Temperature and permafrost regime and “mirror image” of the soil thawing and freezing process: (a) Turbic Cryosols (Mollic) (Bagdarin polygon); (b) Entic Podzols (Goryachinsk polygon). ![Geosciences 09 00006 i005]() = frozen layer;
= frozen layer; ![Geosciences 09 00006 i006]() = thawed layer.
= thawed layer.
= frozen layer; = thawed layer.
Figure 5.
Duration of positive temperatures at different soil depths.


Table 1.
Physicochemical properties of studied soils.
| Horizon | Depth (cm) | pH H2O | pH KCl | Bulk Density (g/cm3) | Corg (%) | CaCO3 (%) | Exchangeable Bases (meq/100 g soil) | «Clay <0.00» | Moisture Reserve (0–100 cm) (mm) | ||
|---|---|---|---|---|---|---|---|---|---|---|---|
| Na+ | Ca2+ | Mg2+ | |||||||||
| Turbic Cryosols (Humic) | |||||||||||
| AO | 0–1 | 5.88 | 5.84 | - | 6.85 | - | - | - | - | - | 270–290 |
| AY | 1–12 (15) | 5.87 | 4.99 | 0.92 | 3.34 | - | - | 20.32 | 10.84 | 2.02 | |
| CRM1 | 12 (15)–80 (90) | 5.58 | 4.96 | 1.26 | 1.18 | - | - | 15.09 | 8.33 | 6.71 | |
| CRM2 | 80 (90)–130 | 6.28 | 5.58 | 1.43 | 0.79 | - | - | 15.51 | 8.62 | 5.98 | |
| Luvic Chernozems (Stagnic, Tonguic) | |||||||||||
| AU | 0–4 (9) | 6.88 | 6.66 | 0.94 | 11.36 | - | - | 31.43 | 16.61 | 7.56 | 250–260 |
| AU | 4 (9)–24 (25) | 7.05 | 6.58 | 1.41 | 8.58 | - | 0.18 | 29.09 | 14.52 | 10.40 | |
| AUB1 | 24 (25)–38 (45) | 7.20 | 6.50 | 1.35 | 4.91 | - | 0.18 | 21.83 | 18.74 | 15.61 | |
| B1 | 38 (45)–53 (65) | 7.63 | 7.13 | 1.42 | 1.29 | - | - | 19.52 | 13.41 | 27.72 | |
| CAT | 53 (65)–89 (96) | 8.18 | 7.65 | 1.51 | 0.84 | 8,52 | - | 14.09 | 14.03 | 21.01 | |
| CATQ | 89 (96)–150 | 8.29 | 7.86 | 1.43 | 0.67 | 6,90 | - | 6.32 | 6.91 | 19.58 | |
| CQ | 150–180 | 7.85 | 7.30 | 1.42 | 0.38 | 0,30 | - | 23.12 | 12.74 | 8.98 | |
| Natric Chernozems (Stagnic) | |||||||||||
| AUsn | 0–2 (3) | 7.81 | 5.79 | 1.09 | 2.87 | 0.08 | 0.84 | 5.92 | 4.98 | 18.84 | 195–200 |
| AU | 2 (3)–22 (24) | 7.49 | 5.39 | 1.53 | 3.98 | 0.15 | 0.91 | 6.78 | 7.69 | 32.61 | |
| AUB | 22 (24)–27 (29) | 8.74 | 6.29 | 1.49 | 0.99 | 0.18 | 2.04 | 8.67 | 9.62 | 34.59 | |
| BCA | 27 (29)–75 | 8.59 | 7.76 | 1.61 | 0.67 | 14.84 | 2.72 | 9.65 | 10.64 | 46.57 | |
| Cca | 75–105 | 8.51 | 7.51 | 1.52 | 0.50 | 5.16 | 2.73 | 10.67 | 10.99 | 38.91 | |
| Entic Podzols | |||||||||||
| O | 0–13 (16) | 5.21 | 4.19 | 0.81 | 2.91 | - | - | 12.64 | 0.12 | 2.63 | 195–210 |
| E | 13 (16)–18 | 5.61 | 4.30 | 1.36 | 0.71 | - | - | 5.71 | 0.69 | 1.87 | |
| BHF | 18–41 (44) | 6.59 | 5.41 | 1.41 | 0.42 | - | - | 4.92 | 2.08 | 2.23 | |
| C | 41 (44)–75 | 6.51 | 5.31 | 1.52 | 0.26 | - | - | 4.73 | 0.39 | 1.92 | |
© 2018 by the authors. Licensee MDPI, Basel, Switzerland. This article is an open access article distributed under the terms and conditions of the Creative Commons Attribution (CC BY) license (http://creativecommons.org/licenses/by/4.0/).
Share and Cite
MDPI and ACS Style
Badmaev, N.; Bazarov, A. Monitoring Network for Atmospheric and Soil Parameters Measurements in Permafrost Area of Buryatia, Russian Federation. Geosciences 2019, 9, 6. https://doi.org/10.3390/geosciences9010006
AMA Style
Badmaev N, Bazarov A. Monitoring Network for Atmospheric and Soil Parameters Measurements in Permafrost Area of Buryatia, Russian Federation. Geosciences. 2019; 9(1):6. https://doi.org/10.3390/geosciences9010006
Chicago/Turabian StyleBadmaev, Nimazhap, and Aleksandr Bazarov. 2019. "Monitoring Network for Atmospheric and Soil Parameters Measurements in Permafrost Area of Buryatia, Russian Federation" Geosciences 9, no. 1: 6. https://doi.org/10.3390/geosciences9010006
Note that from the first issue of 2016, this journal uses article numbers instead of page numbers. See further details here.