Abstract
Understanding the physical properties of ultramafic rocks is important for evaluating a wide variety of petrologic models of the oceanic lithosphere, particularly upper mantle and lower crust. Hydration of oceanic peridotites results in increasing serpentine content, which affects lithospheric physical properties and the global bio/geochemical cycles of various elements. In understanding tectonic, magmatic, and metamorphic history of the oceanic crust, interpreting seismic velocities, rock composition, and elastic moduli are of fundamental importance. In this study, we show that as serpentine content increases, density decreases linearly with a slope of 7.85. Porosity of the samples does not show any systematic correlation with serpentine content, as it is more strongly affected by local weathering and erosional processes. We also correlate increase in serpentine content with a linear decline in shear, bulk, and Young’s moduli with slopes of 0.48, 0.77, and 0.45, respectively. Our results show that increase in serpentine content of mantle wedge and forearc mantle contributes to their brittle behavior and result in break-offs, obduction, and overthrusting. Therefore, serpentine content strongly affects tectonic processes at subduction zones, particularly serpentinization may be responsible for formation of weak fault zones. Also, serpentinization of fresh oceanic peridotite in slow and ultra-slow spreading ridges may be responsible for observed discontinuities in thin crust.
1. Introduction
Understanding the physical properties of ultramafic rocks (peridotites) is important for evaluating the wide variety of petrologic models for the Earth’s upper mantle and lower oceanic crust [1]. These properties have a key role in fluid flux and geochemical transport in magmatic systems at mid-oceanic ridges (e.g., [2,3,4]) and subduction zones (e.g., [5,6]), as well as in enhanced geothermal systems (e.g., [7,8]). Mass, heat, and chemical transport in fault zones plays a significant role in global seismicity (e.g., [9,10]).
Hydration and alteration of oceanic peridotites results in increasing serpentine content and formation of serpentinites, which affects lithospheric physical properties (e.g., [11,12,13,14]) and the global bio/geo chemical cycles of various elements (e.g., [15,16,17]).
In interpreting structure and seismic velocities of a region, a property of fundamental importance in understanding tectonic history is rock composition. Velocities of compressional and shear waves in ultramafic rocks decrease with increasing serpentine content (e.g., [18]). Various studies have reported seismic velocity measurements of dunites, partially serpentinized peridotites and serpentinites under pressure (e.g., [13,19,20,21,22,23,24,25]). Falcon-Suarez et al., [26] analyzed seismic velocities, electrical resistivity and permeability of four serpentinized peridotite samples from the southern wall of the Atlantis Massif, Mid-Atlantic Ridge, collected during International Ocean Discovery Program (IODP) Expedition 357. Horen et al., [27] analyzed the effect of serpentine content on seismic velocity of 6 samples from Xigaze Ophiolite and developed empirical correlations between the noted parameters, which we will use in this study to estimate seismic velocities. Ramana and Rao [28] reports density, porosity and seismic velocity of fresh (12%) to extensively altered ultramafic rocks (100%) from India.
Elastic moduli are also important in evaluating brittle behavior and understanding the tectonic, magmatic and metamorphic history of the oceanic crust. Evaluation of elastic moduli of oceanic rocks can be beneficial for future drilling strategies [13]. mineralogical composition, porosity and texture are some of the parameters that affect elastic moduli [26,28].
In this paper, we report density, porosity and serpentine content of 8 samples of slightly (5%) to extensively (95%) serpentinized rocks and develop a linear correlation between density and serpentine content. We also use the empirical equation of Horen et al., [27], to estimate seismic velocities of the samples used in this study and develop correlation between elastic moduli and serpentine content. We produce a series of linear functions that correlate serpentine content with elastic moduli. These models can be used in understanding tectonic evolution of oceanic crust and estimating crustal weakening as a result of serpentinization.
Although the elastic thickness of the oceanic lithosphere, is estimated in the range of 2–50 km [29], serpentinization of lower crust and upper mantle can result in reduction of elasticity and weakening at much shallower depths, depending on fluid access. Serpentinization will impact onset of brittle failure or dilatancy in the lower crust and upper mantle, forming weak faults and a brittle crust, in response to bending stresses and seismicity. Serpentine content is one of the factors that affect the amount of weakening resulting from the alteration of peridotite to serpentinite [12,30].
2. Materials and Methods
The measurements were performed on cubes (7.3–13.1 cm3) and mini cores (1.8–2.7 cm3) of serpentinized dunites, pyroxenites, and peridotites. The non-serpentine present phases in each sample is provided based on XRD patterns and peaks (Supplementary Materials A) and point counting on thin sections (Figure 1). Figure 1 contains photomicrographs of each sample in plain polarized (PPL) and crossed polarized (XPL) light. Three samples, denoted by symbols TS, JC, and ND, respectively, are dunites from the Twin Sisters Range in Washington (Figure 1a,b), Jackson County in North Carolina (Figure 1e,f), and Newdale from the Blue Ridge province in North Carolina (Figure 1g,h), respectively. They contain 60–95% Mg-rich olivine, the remainder composed of serpentine and 5% of minor minerals. One sample (BC) is a pyroxenite from the Bushveld Complex, South Africa (Figure 1c,d), containing more than 90% Mg-rich orthopyroxene, about 10% serpentine, and 5% other minor minerals. Four samples were selected from the Point Sal Ophiolite in California (Figure 1i–q) with major phase of serpentine composing 60–95% of the samples, with various other minor phases including olivine and pyroxene (Table 1).
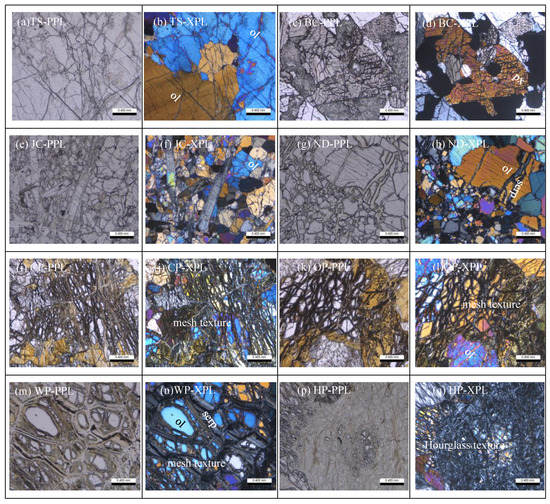
Figure 1.
Selected photomicrographs of the samples in the order of increasing serpentine content. PPL = Plain Polarized Light, XPL = Crossed Polarized Light, ol = olivine, serp = serpentine, px = pyroxene. (a) photomicrographs of TS sample in plain polarized light. (b) photomicrographs of TS sample in crossed polarized light. (c) photomicrographs of BC sample in plain polarized light. (d) photomicrographs of BC sample in crossed polarized light. (e) photomicrographs of JC sample in plain polarized light. (f) photomicrographs of JC sample in crossed polarized light (g) photomicrographs of ND sample in plain polarized light. (h) photomicrographs of ND sample in crossed polarized light. (i) photomicrographs of CP sample in plain polarized light. (j) photomicrographs of CP sample in crossed polarized light (k) photomicrographs of OP sample in plain polarized light. (l) photomicrographs of OP sample in crossed polarized light (m) photomicrographs of WP sample in plain polarized light. (n) photomicrographs of WP sample in crossed polarized light (p) photomicrographs of HP sample in plain polarized light. (q) photomicrographs of HP sample in crossed polarized light.

Table 1.
Description of the samples used for the experiments.
After identifying the non-serpentine phases and their concentration in each sample from XRD and point counting on thin sections, serpentine content was estimated through a combination of image analysis (Supplementary Materials B) and thin section observations. Serpentinization begins first along grain boundaries, cleavage traces, and fractures in the olivine-pyroxene grains. Thus, serpentine content is estimated based on the number and volume of serpentine veins using 1 thin section of each sample. The potential serpentine bearing zones (grain boundaries and fractures) in the photomicrographs provided in Figure 1 (which is a portion of the thin section of each sample) was identified by image analysis performed on Adobe Photoshop using high magnification images (Supplementary Materials B). Next, we examined the whole thin section of each sample under the microscope, with focusing on identified zones of interest, to estimate the serpentine content of each sample using the number and volume of serpentine bearing veins in each sample. The serpentine content estimates, provided on Table 1, is rounded to the nearest 0 or 5 percentile to avoid subjectivity (Supplementary Materials C).
Densities were calculated from the dimensions and weights of the cubes and mini cores. Porosity of the samples was measured by saturation under vacuum conditions, with the triple weighing technique similar to the method of Saad [31].
2.1. Geological Background
In this section we describe the relevant tectonic history associated with each sample.
2.1.1. TS Sample (Twin Sisters Dunite)
The Twin Sisters dunite is located in Whatcom County, Washington. The fabric of the Twin Sisters body is interpreted as having originated by recrystallization accompanying flow within the upper mantle. The dunite body appears to have been transported from the mantle as solid along a major thrust fault [32]. One of the main textures within the Twin Sisters dunite, consists of coarse, olivine grains with irregular interlocking boundaries [33]. The slab-like geometry of the Twin Sisters body, its metamorphic texture, its probable emplacement as a relatively cold slab, and its favorable structural settings along the deep-seated Shuksan thrust, confirm an upper mantle origin for this body [32,33,34].
2.1.2. BC Sample (Bushveld Complex Pyroxenite)
The Bushveld Complex is a large layered intrusion, emplaced into a stable cratonic setting and it has been inferred to be related to a mantle plume [35]. The Bushveld complex is the product of crystallization of numerous injections of magma [36]. BC sample is a pyroxenite collected near the Eastern Limb of the complex.
2.1.3. JC and ND Samples (Jackson County and Newdale Dunites)
JC and ND are dunites from the ultramafic bodies in the Blue Ridge province of southern Appalachians, specifically from Jackson County (JC) and Yancey County (ND), North Carolina. Both samples contain fine-grained forsterite olivine. The JC and ND dunite bodies were emplaced in the upper crust as solid bodies under tectonic stress gradients prior to a major episode of regional deformation [37,38]. Although much of the Blue Ridge dunites are fresh, they are metamorphic rocks and not primary unaltered mantle peridotites [39].
2.1.4. CP, OP, WP and HP Samples (Point Sal Samples 1–4)
CP, OP, WP and HP samples are serpentinized ophiolites from Point Sal ophiolite collected on the Vandenberg Air Force Base in California. The Point Sal ophiolite is one of the Jurassic California Coast Range ophiolites [40]. Point Sal ophiolite is partly dismembered by faulting. Most of the basal dunite is heavily serpentinized. The REE characteristics indicates similarities with modern oceanic rocks [41]. It is suggested that Point Sal remnant was recrystallized in a submarine hydrothermal system [42]. The pervasive metamorphism is pre-emplacement and supports the fact that large volumes of seawater flowed through these rocks during hydrothermal metamorphism [41,43].
3. Results
3.1. Measurements of Density and Porosity
Measured bulk density values ranged between 2540 kg/m3 for HP sample to 3200 kg/m3 for TS sample. The porosity of the samples ranges between 2.1% in the WP sample to 8.4% in ND sample (Table 2). Using measurements of bulk density and porosity, the grain density was estimated to range between 2644 kg/m3 for HP sample to 3328 kg/m3 for TS sample, which matches with the density of serpentine and un-serpentinized dunite, respectively.
Table 2.
Measurements of density and porosity and estimates of grain density.
Density Variation with Serpentine Content
To find the best fit for - correlation, we added published data from Falcon-Suarez et al., [26], Ramana and Rao, [28] and Horen et al., [27] to our data. In all of the above studies, is estimated by petrographic analysis. As shown in Figure 2 increase in results in linear decline in following Equation (1):
where = 3300 kg/m3. The R2 for this equation is 0.82. Miller and Christensen [13] report the same correlation between and of various serpentinized harzburgites and dunites from around the world with R2 = 0.98.
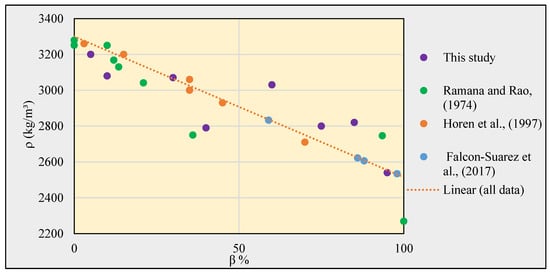
Figure 2.
The assumptions of the linear correlation between density and serpentine content is that serpentine content of peridotite with density of 3300 kg/m3 is 0 and serpentine content of serpentinite with density of 2500 kg/m3 is 100%.
Porosity of the samples does not correlate systematically with serpentine content (Figure 3). This could result from tectonic and erosional processes affecting porosity well beyond the impact of serpentinization.
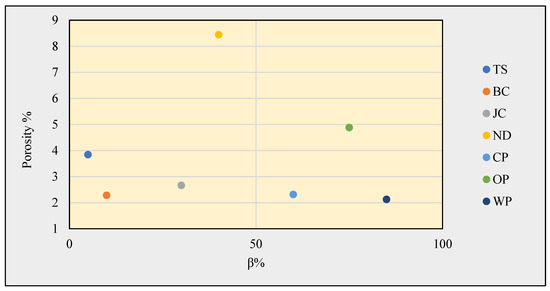
Figure 3.
Porosity vs. serpentine content. Modified from Karasch et al., [44].
3.2. Estimating Seismic Velocities
Various previous studies have proven a linear correlation between seismic velocities and serpentine content [13,20,25]. The empirical correlation between Compressional Velocity and Shear Velocity with serpentine content developed in Horen et al., [27] are provided in Equations (2) and (3):
where β refers to serpentine content. and values of the samples in this study were estimated in range of 4834.5–7759.5 m/s for and 2300–4262 m/s for of HP and TS samples, respectively (Table 3). Based on the data published in Christensen [1], the VP/Vs ratio is showing that most samples are possibly rich in Lizardite serpentine (Table 3).
Table 3.
Calculated seismic velocities and elastic moduli. Seismic velocities are calculated based on Equations (2) and (3) for Vp and Vs and elastic moduli are calculated based on Equations (4), (5), (6) and (7) for μ, K and E and ν, respectively.
Previous studies show serpentinized peridotites of Point Sal have around 5.5 km/s [18], which agrees with our estimates.
3.3. Estimating Elastic Moduli and Poisson’s Ratio
Elastic moduli are correlated with seismic velocities, based on equations below:
where is shear modulus or rigidity, is bulk modulus or incompressibility, is Young’s modulus and is Poisson’s ratio. By incorporating results of Equations (2) and (3) into (4), (5), (6) and (7), is estimated between 13.4–58.1 GPa, is between 41.5–115 GPa, and is between 32.5–76.4 GPa for HP and TS samples, respectively. Estimated values of ranges from 0.28 for the TS sample to 0.35 for the HP sample (Table 3). High is as a result of low shear wave velocities in serpentinized ultramafic rocks, which agrees with previous studies [1,45].
Elastic Moduli Variation with Serpentine Content
As shown in Figure 4 with increase in serpentine content, , and will decrease linearly following Equations (8), (9) and (10):
where subscript 0 refers to a fresh peridotite where , , and . and values are in agreement with reported values in Christensen [19], Christensen and Shaw [46], Christensen [20] and Turcotte and Schubert, [47]. The R2 of equations (8), (9) and (10) is 0.98.
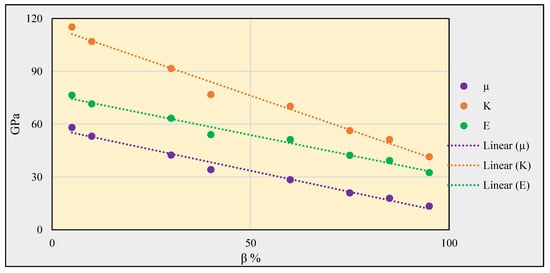
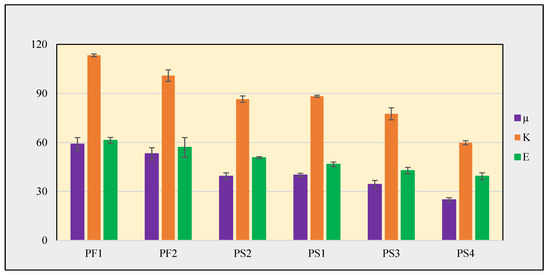
Figure 4.
Shows the trend of Elastic Moduli (, and ) with serpentine content.
The standard deviation of , and (Table 4, Figure 5) was calculated by estimating the elastic moduli of Horen et al., [27] samples using the measured seismic velocities in comparison to using the equations above.
Table 4.
Seismic velocities and elastic moduli of Horen et al., (1996) samples.
4. Discussion
Serpentine is the main hydrous mineral in the upper mantle [48]. Serpentine content in subducting slab and mantle wedge affects the kinematics of many subduction processes, such as decoupliong between a down going slab and the mantle above [49].
In most subduction zones, the mantle wedge is likely to be serpentinized [1], as serpentine and other hydrous minerals in the subducting slab dehydrate. In a subducting slab, serpentine will fully dehydrate between 150–250 km depth [50,51,52], and trigger intermediate depth earthquakes [53,54]. In cold slabs, serpentine may exist to greater depths and cause deep seismicity [55,56]. Our results show that brittle behavior of serpentinized slab will probably contribute to its seismicity.
Dehydration of slab, will result in serpentinization of the mantle wedge [57,58] and consequently brittle behavior.
Serpentine along with other alteration products in the fore-arc mantle could also exhibit brittle behavior [57]. The degree of serpentinization in the forearc mantle is estimated close to 30% [59,60].
Increase in serpentine content of lower crust and forearc mantle could decrease elasticity of lithosphere and result in break-offs (e.g., [12,30,61,62]), obduction and overthrusting in compressional tectonic settings.
Therefore, tectonic processes at subduction zones may be strongly affected by serpentine content, particularly serpentinization may be responsible for formation of weak fault zones.
Serpentinization of fresh oceanic peridotite in slow and ultra-slow spreading ridges may be responsible for observed discontinuities in thin crust (e.g., [12,63,64,65]). In understanding tectonic processes of peridotite rich oceanic crust, knowledge of serpentine content is as crucial as composition of the fluids involved in the process and the mechanisms that expose peridotites [66].
Understanding elasticity of serpentinized peridotites is essential for relating seismological observations to the degree of serpentinization and understanding thermal history of subduction zones [63]. The magnitude of seismic anisotropy increases with increasing serpentine content [67]. Our results show that increase in serpentine content will result in a linear decrease in density, and elastic moduli, which is in agreement with results of Christensen [19]. Our results also confirm the linear correlation of density and seismic velocity as well [56]. Porosity, however, is more strongly affected by weathering and erosion and does not show any systematic correlation with serpentine content.
Calculated elastic moduli of HP sample which is 95% serpentinized, is in great agreement with that for serpentinites reported in Christensen [20] and Carlson [68]. This agreement is slightly weaker between our freshest sample, TS, which is a slightly (5%) serpentinized dunite compared to estimates of fresh oceanic peridotite of Christensen [20], as a result of compositional difference between serpentinized dunites and oceanic peridotites.
Our results show that primary origin of the protolith (mantle (TS, BC, CP, WP, HP, OP) or metamorphic rock (JC, ND)) does not play an important role in evolution of elastic moduli with serpentine content.
To conclude, serpentinization of lower crust and upper mantle can result in reduction of elasticity and weakening at depths shallower than expected. Serpentinization impacts the onset of brittle failure or dilatancy, forming weak faults and a brittle lower crust and upper mantle.
5. Conclusions
In this study, we show that in serpentinized dunites and pyroxenites as serpentine content increases, density decreases linearly with a slope of 7.85. Porosity of the samples does not show any systematic correlation with serpentine content, as it is more strongly affected by local weathering and erosional processes.
We also correlate increase in serpentine content with a linear decline in shear, bulk, and Young’s moduli with slopes of 0.48, 0.77, 0.45, respectively. The primary origin does not play an important role in evolution of elastic moduli with serpentine content. Our results show that brittle behavior of serpentinized slab will probably contribute to intermediate and deep seismic activity in subduction zones.
Our results show that increase in serpentine content of mantle wedge and forearc mantle contributes to their brittle behavior and result in break-offs, obduction, and overthrusting. Therefore, serpentine content strongly affects tectonic processes at subduction zones, particularly serpentinization may be responsible for formation of weak fault zones. Also, serpentinization of fresh oceanic peridotite in slow and ultra-slow spreading ridges may be responsible for observed discontinuities in thin crust. Thus, increase in serpentine content, results in formation of weak faults and a brittle lower crust and upper mantle.
Supplementary Materials
The following are available online at https://www.mdpi.com/2076-3263/9/12/494/s1, (A) XRD results, (B) Sample product of image analysis for estimating serpentine content, (C) Calculation methodology for estimating Serpentine content of each sample.
Author Contributions
Conceptualization, A.F.; methodology, A.F.; formal analysis, A.F.; investigation, A.K.K.; resources, A.F.; data curation, A.K.K.; writing—original draft preparation, A.F.; writing—review and editing, A.F.; visualization, A.F.; supervision, A.F.; project administration, A.F.
Funding
This research received no external funding
Acknowledgments
All the data are provided in Tables section of this manuscript. The authors would like to thank Kayleigh Rogers for help with microscopic analysis. We are also thankful to William Dinklage for providing the Point Sal samples. Authors would also like to acknowledge help and support from Robert P. Lowell (deceased) on earlier versions of this manuscript.
Conflicts of Interest
The authors declare no conflict of interest.
References
- Christensen, N.I. Serpentinites, peridotites, and seismology. Int. Geol. Rev. 2004, 46, 795–816. [Google Scholar] [CrossRef]
- Lowell, R.P. Circulation in fractures, hot springs, and convective heat transport on mid-ocean ridge crests. Geophys. J. R. Astron. Soc. 1975, 40, 351–365. [Google Scholar] [CrossRef]
- Bickle, M.J.; Teagle, D.A. Strontium alteration in the Troodos ophiolite: Implications for fluid fluxes and geochemical transport in mid-ocean ridge hydrothermal systems. Earth Planet. Sci. Lett. 1992, 113, 219–237. [Google Scholar] [CrossRef]
- Elderfield, H.; Wheat, C.G.; Mottl, M.J.; Monnin, C.; Spiro, B. Fluid and geochemical transport through oceanic crust: A transect across the eastern flank of the Juan de Fuca Ridge. Earth Planet. Sci. Lett. 1999, 172, 151–165. [Google Scholar] [CrossRef]
- Hyndman, R.D.; Wang, K. Thermal constraints on the zone of major thrust earthquake failure: The Cascadia subduction zone. J. Geophys. Res. Solid Earth 1993, 98, 2039–2060. [Google Scholar] [CrossRef]
- Gamage, K.; Screaton, E.; Bekins, B.; Aiello, I. Permeability–porosity relationships of subduction zone sediments. Mar. Geol. 2011, 279, 19–36. [Google Scholar] [CrossRef]
- Pruess, K. Enhanced geothermal systems (EGS) using CO2 as working fluid—A novel approach for generating renewable energy with simultaneous sequestration of carbon. Geothermics 2006, 35, 351–367. [Google Scholar] [CrossRef]
- Taron, J.; Elsworth, D. Thermal–hydrologic–mechanical–chemical processes in the evolution of engineered geothermal reservoirs. Int. J. Rock Mech. Min. Sci. 2009, 46, 855–864. [Google Scholar] [CrossRef]
- Byerlee, J.D. Model for episodic flow of high-pressure water in fault zones before earthquakes. Geology 1993, 21, 303–306. [Google Scholar] [CrossRef]
- Sleep, N.H.; Blanpied, M.L. Ductile creep and compaction: A mechanism for transiently increasing fluid pressure in mostly sealed fault zones. Pure Appl. Geophys. 1994, 143, 9–40. [Google Scholar] [CrossRef]
- O’Hanley, D.S. Solution to the volume problem in serpentinization. Geology 1992, 20, 705–708. [Google Scholar] [CrossRef]
- Escartin, J.; Hirth, G.; Evans, B. Nondilatant brittle deformation of serpentinites: Implications for Mohr-Coulomb theory and the strength of faults. J. Geophys. Res. Solid Earth 1997, 102, 2897–2913. [Google Scholar] [CrossRef]
- Miller, D.J.; Christensen, N.I. Seismic Velocities of Lower Crustal and Upper Mantle Rocks from the Slow-Spreading Mid-Atlantic Ridge, South of the Kane Transform Zone (MARK). In Proceedings-Ocean Drilling Program Scientific Results; National Science Foundation: Alexandria, VA, USA, 1997; pp. 437–456. [Google Scholar]
- Oufi, O.; Cannat, M.; Horen, H. Magnetic properties of variably serpentinized abyssal peridotites. J. Geophys. Res. Solid Earth 2002, 107, EPM-3. [Google Scholar] [CrossRef]
- Früh-Green, G.L.; Connolly, J.A.; Plas, A.; Kelley, D.S.; Grobéty, B. Serpentinization of oceanic peridotites: Implications for geochemical cycles and biological activity. Subseafloor Biosph. Mid-Ocean Ridges 2004, 144, 119–136. [Google Scholar]
- Paulick, H.; Bach, W.; Godard, M.; De Hoog, J.C.M.; Suhr, G.; Harvey, J. Geochemistry of abyssal peridotites (Mid-Atlantic Ridge, 15 20′ N, ODP Leg 209): Implications for fluid/rock interaction in slow spreading environments. Chem. Geol. 2006, 234, 179–210. [Google Scholar] [CrossRef]
- Deschamps, F.; Godard, M.; Guillot, S.; Hattori, K. Geochemistry of subduction zone serpentinites: A review. Lithos 2013, 178, 96–127. [Google Scholar] [CrossRef]
- Nichols, J.; Warren, N.; Luyendyk, B.P.; Spudich, P. Seismic velocity structure of the ophiolite at Point Sal, southern California, determined from laboratory measurements. Geophys. J. Int. 1980, 63, 165–185. [Google Scholar] [CrossRef]
- Christensen, N.I. Elasticity of ultrabasic rocks. J. Geophys. Res. 1966, 71, 5921–5931. [Google Scholar] [CrossRef]
- Christensen, N.I. The abundance of serpentinites in the oceanic crust. J. Geol. 1972, 80, 709–719. [Google Scholar] [CrossRef]
- Christensen, N.I. Ophiolites, seismic velocities and oceanic crustal structure. Tectonophysics 1978, 47, 131–157. [Google Scholar] [CrossRef]
- Schreiber, E.; Fox, P.J. Density and P-wave velocity of rocks from the FAMOUS region and their implication to the structure of the oceanic crust. Geol. Soc. Am. Bull. 1977, 88, 600–608. [Google Scholar] [CrossRef]
- Christensen, N.I.; Smewing, J.D. Geology and seismic structure of the northern section of the Oman ophiolite. J. Geophys. Res. Solid Earth 1981, 86, 2545–2555. [Google Scholar] [CrossRef]
- Iturrino, G.J.; Miller, D.J.; Christensen, N.I. Velocity Behavior of Lower Crustal and Upper Mantle Rocks from a Fast-Spreading Ridge at Hess DEEP1. Proc. Ocean Drill. Program Sci. Results 1996, 147, 417–440. [Google Scholar]
- Escartin, J.; Hirth, G.; Evans, B. Strength of slightly serpentinized peridotites: Implications for the tectonics of oceanic lithosphere. Geology 2001, 29, 1023–1026. [Google Scholar] [CrossRef]
- Falcon-Suarez, I.; Bayrakci, G.; Minshull, T.A.; North, L.J.; Best, A.I.; Rouméjon, S. Elastic and electrical properties and permeability of serpentinites from Atlantis Massif, Mid-Atlantic Ridge. Geophys. J. Int. 2017, 211, 686–699. [Google Scholar] [CrossRef]
- Horen, H.; Zamora, M.; Dubuisson, G. Seismic waves velocities and anisotropy in serpentinized peridotites from xigaze ophiolite: Abundance of serpentine in slow spreading ridge. Geophys. Res. Lett. 1996, 23, 9–12. [Google Scholar] [CrossRef]
- Ramana, Y.V.; Rao, M.V.M.S. Compressional Velocities in Ultramafic Rocks of India at Pressures to Five Kilobars. Geophys. J. Int. 1974, 37, 207–212. [Google Scholar] [CrossRef]
- Watts, A.; Burov, E. Lithospheric strength and its relationship to the elastic and seismogenic layer thickness. Earth Planet. Sci. Lett. 2003, 213, 113–131. [Google Scholar] [CrossRef]
- Brace, W.F.; Paulding, B.W.; Scholz, C. Dilatancy in the fracture of crystalline rocks. J. Geophys. Res. Space Phys. 1966, 71, 3939–3953. [Google Scholar] [CrossRef]
- Saad, A.H. Magnetic Properties of Ultramafic Rocks from Red Mountain, California. Geophysics 1969, 34, 974–987. [Google Scholar] [CrossRef]
- Christensen, N.I. Fabric, Seismic Anisotropy, and Tectonic History of the Twin Sisters Dunite, Washington. GSA Bull. 1971, 82, 1681. [Google Scholar] [CrossRef]
- Ragan, D.M. Emplacement of the Twin Sisters dunite, Washington. Am. J. Sci. 1963, 261, 549–565. [Google Scholar] [CrossRef]
- Misch, P. Tectonic Evolution of the Northern Cascades of Washington. In A Symposium on the Tectonic History and Mineral Deposits of the Western Cordillera in British Columbia and Neighboring Parts of the United States; Special Volume 8; Canadian Institute of Mining, Metallurgy and Petroleum: Montreal, QC, Canada, 1966; pp. 101–148. [Google Scholar]
- Hatton, C. Mantle plume origin for the Bushveld and Ventersdorp magmatic provinces. J. Afr. Earth Sci. 1995, 21, 571–577. [Google Scholar] [CrossRef]
- Cawthorn, R.G.; Walraven, F. Emplacement and Crystallization Time for the Bushveld Complex. J. Pet. 1998, 39, 1669–1687. [Google Scholar] [CrossRef]
- Misra, K.C.; Keller, F.B. Ultramafic bodies in the Southern Appalachians; a review. Am. J. Sci. 1978, 278, 389–418. [Google Scholar] [CrossRef]
- Hunter, C.E. Forsterite olivine deposits of North Carolina and Georgia: North Carolina Department of Conservation and Development. Div. Miner. Resour. Bull. 1941, 41, 117. [Google Scholar]
- Lipin, B.R. Chromite from the Blue Ridge Province of North Carolina. Am. J. Sci. 1984, 284, 507–529. [Google Scholar] [CrossRef]
- Hopson, C.A.; Mattinson, J.M.; Pessagno, E.A. Coast Range Ophiolite, Western California. In The Geotectonic Development of California; Ernst, W.G., Ed.; Prentice-Hall: Bergen, NJ, USA, 1981; pp. 419–510. [Google Scholar]
- Menzies, M.; Blanchard, D.; Brannon, J.; Korotev, R. Rare earth and trace element geochemistry of a fragment of jurassic seafloor, Point Sal, California. Geochim. Cosmochim. Acta 1977, 41, 1419–1430. [Google Scholar] [CrossRef]
- Schiffman, P.; Bettison, L.; Williams, A. Hydrothermal metamorphism of the Point Sal remnant, California Coast Range ophiolite. In Proceedings of the 5th International Syrup on Water-Rock Interactions, Reykjavík, Iceland, 8–17 August 1986. [Google Scholar]
- Bettison, L.A.; Schiffman, P. Compositional and structural variations of phyllosilicates from the Point Sal ophiolite, California. Am. Mineral. 1988, 73, 62–76. [Google Scholar]
- Karasch, A.K.; Farough, A.; Lowell, R.P. The Correlation Between Porosity, Density and Degree of Serpentinization in Ophiolites from Point Sal, California: Implications for Strength of Oceanic Lithosphere. In AGU Fall Meeting Abstracts; American Geophysical Union: Washington, DC, USA, 2017. [Google Scholar]
- Reynard, B.; Hilairet, N.; Balan, E.; Lazzeri, M. Elasticity of serpentines and extensive serpentinization in subduction zones. Geophys. Res. Lett. 2007, 34. [Google Scholar] [CrossRef]
- Christensen, N.I.; Shaw, G.H. Elasticity of Mafic Rocks from the Mid-Atlantic Ridge. Geophys. J. Int. 1970, 20, 271–284. [Google Scholar] [CrossRef]
- Turcotte, D.; Schubert, G. Geodynamics; Cambridge University Press: Cambridge, UK, 2014. [Google Scholar]
- Hyndman, R.D.; Peacock, S.M. Serpentinization of the forearc mantle. Earth Planet. Sci. Lett. 2003, 212, 417–432. [Google Scholar] [CrossRef]
- Long, M.D.; Wirth, E.A. Mantle flow in subduction systems: The mantle wedge flow field and implications for wedge processes. J. Geophys. Res. Solid Earth 2013, 118, 583–606. [Google Scholar] [CrossRef]
- Dobson, D.P.; Meredith, P.G.; Boon, S.A. Simulation of subduction zone seismicity by dehydration of serpentine. Science 2002, 298, 1407–1410. [Google Scholar] [CrossRef] [PubMed]
- Obara, K. Nonvolcanic Deep Tremor Associated with Subduction in Southwest Japan. Science 2002, 296, 1679–1681. [Google Scholar] [CrossRef] [PubMed]
- Bezacier, L.; Reynard, B.; Cardon, H.; Montagnac, G.; Bass, J.D. High-pressure elasticity of serpentine and seismic properties of the hydrated mantle wedge. J. Geophys. Res. Solid Earth 2013, 118, 527–535. [Google Scholar] [CrossRef]
- Jung, H.; Ii, H.W.G.; Dobrzhinetskaya, L.F. Intermediate-depth earthquake faulting by dehydration embrittlement with negative volume change. Nature 2004, 428, 545–549. [Google Scholar] [CrossRef]
- Jung, H.; Green, H.W. Experimental Faulting of Serpentinite during Dehydration: Implications for Earthquakes, Seismic Low-Velocity Zones, and Anomalous Hypocenter Distributions in Subduction Zones. Int. Geol. Rev. 2004, 46, 1089–1102. [Google Scholar] [CrossRef]
- Meade, C.; Jeanloz, R. Deep-focus earthquakes and recycling of water into the Earth’s mantle. Science 1991, 252, 68–72. [Google Scholar] [CrossRef]
- Mookherjee, M.; Stixrude, L. Structure and elasticity of serpentine at high-pressure. Earth Planet. Sci. Lett. 2009, 279, 11–19. [Google Scholar] [CrossRef]
- Reinen, L.A. Seismic and aseismic slip indicators in serpentinite gouge. Geology 2000, 28, 135. [Google Scholar] [CrossRef]
- Mookherjee, M.; Capitani, G.C. Trench parallel anisotropy and large delay times: Elasticity and anisotropy of antigorite at high pressures. Geophys. Res. Lett. 2011, 38. [Google Scholar] [CrossRef]
- Peacock, S.M.; Hacker, B.R.; Abers, G.A. Subduction factory Theoretical mineralogy, densities, seismic wave speeds, and H2O contents. J. Geophys. Res. Space Phys. 2003, 108. [Google Scholar] [CrossRef]
- Wiens, D.A.; Conder, J.A.; Faul, U.H. The Seismic Structure and Dynamics of the Mantle Wedge. Annu. Rev. Earth Planet. Sci. 2008, 36, 421–455. [Google Scholar] [CrossRef]
- Bostock, M.G.; Hyndman, R.D.; Rondenay, S.; Peacock, S.M. An inverted continental Moho and serpentinization of the forearc mantle. Nature 2002, 417, 536–538. [Google Scholar] [CrossRef]
- Gerya, T.V.; Yuen, D.A.; Maresch, W.V. Thermomechanical modelling of slab detachment. Earth Planet. Sci. Lett. 2004, 226, 101–116. [Google Scholar] [CrossRef]
- Tolstoy, M.; Harding, A.J.; Orcutt, J.A. Crustal Thickness on the Mid-Atlantic Ridge: Bull’s-Eye Gravity Anomalies and Focused Accretion. Science 1993, 262, 726–729. [Google Scholar] [CrossRef]
- Tucholke, B.E.; Lin, J. A geological model for the structure of ridge segments in slow spreading ocean crust. J. Geophys. Res. Space Phys. 1994, 99, 11937–11958. [Google Scholar] [CrossRef]
- Cannat, M.; Mevel, C.; Maia, M.; Deplus, C.; Durand, C.; Gente, P.; Reynolds, J. Thin crust, ultramafic exposures, and rugged faulting patterns at the Mid-Atlantic Ridge (22–24 N). Geology 1995, 23, 49–52. [Google Scholar] [CrossRef]
- Fryer, P. Recent Studies of Serpentinite Occurrences in the Oceans: Mantle-Ocean Interactions in the Plate Tectonic Cycle. Geochemistry 2002, 62, 257–302. [Google Scholar] [CrossRef]
- Jung, H. Seismic anisotropy produced by serpentine in mantle wedge. Earth Planet. Sci. Lett. 2011, 307, 535–543. [Google Scholar] [CrossRef]
- Carlson, R.L. The abundance of ultramafic rocks in Atlantic Ocean crust. Geophys. J. Int. 2001, 144, 37–48. [Google Scholar] [CrossRef]
© 2019 by the authors. Licensee MDPI, Basel, Switzerland. This article is an open access article distributed under the terms and conditions of the Creative Commons Attribution (CC BY) license (http://creativecommons.org/licenses/by/4.0/).