Cross-Correlation and Cross-Spectral Analysis of the Hydrographs in the Northern Part of the Dinaric Karst of Croatia


Faculty of Mining, Geology and Petroleum Engineering, University of Zagreb, Pierottijeva 6, 10000 Zagreb, Croatia
*
Author to whom correspondence should be addressed.
†
These authors contributed equally to this work.
Geosciences 2019, 9(2), 86; https://doi.org/10.3390/geosciences9020086
Submission received: 24 December 2018
/
Revised: 31 January 2019
/
Accepted: 31 January 2019
/
Published: 13 February 2019
(This article belongs to the Special Issue Inland and Coastal Karst Aquifers: Functioning, Monitoring and Management)
Abstract
:Correlation and cross-spectral analysis of hydrographs was performed on the karst area of the mountainous section of the Kupa River in two time periods. Since there are karst aquifers in this area that is a part of strategic groundwater reserves of potable water, such an analysis could give better insight into the behavior of these aquifers. The functions used to describe karst aquifers are the cross-correlation function, coherence function, gain function, and phase function. The outcomes of the analysis results were very similar in the two analyzed periods, suggesting that differences in input signals between these two periods do not affect the aquifer function as a system filter. The results of this research suggest that the aquifer and overburden layer characteristics have a much stronger influence than the change of input signal on the runoff regime in the considered period.
1. Introduction
The groundwater of the karst aquifers of the northern part of the Dinaric karst of Croatia belongs to the national strategic reserves of potable water. These typical karst aquifers in Gorski Kotar, Lika, and the interior of Dalmatia, contain groundwater of very high quality. The government of the Republic of Croatia declared this area as a strategic reserve of potable water by the Water Management Strategy [1]. Groundwater of this aquifer is of very high quality, and since the karst aquifers are particularly sensitive and vulnerable, deeper knowledge of the functioning of this aquifer is of the utmost importance.
In karst terrains, numerous surface and underground karst forms make unexpected water connections that change over time. As a result, especially in bare karst and due to very high infiltration rates, groundwater, and surface water often constitute a single dynamic system. Hence, to understand karst aquifers, it is often more appropriate and productive to focus attention on springs because they integrate significant hydrological conditions. The basic characteristics of karst basins, including this basin, are high speeds of groundwater flow and the emergence of karst springs of great abundance with large discharge amplitudes [2,3,4]. Spectral and correlation analyses are common and generally accepted methods of hydrological research in karst areas [5,6,7,8,9,10,11,12,13,14,15,16,17,18,19,20,21,22]. However, standard hydrological research of the Dinaric karst in Croatia has been carried out mostly on smaller areas and some regional research [23,24,25,26,27,28,29,30,31,32,33,34,35,36,37,38,39,40], while spectral and correlation analysis began to be carried out recently in the southern parts of the Dinaric karst [41,42,43,44,45].
The thesis on climate change is universally accepted in the scientific and social community so the analysis was conducted on a two time series that could give insight into that change. According to [38], research has shown that from 1981 to 2012, the extremes in the flow rates and precipitation during a year were stronger and more frequent than in the earlier climatological period, from 1951 to 1980, in this area.
In this study, for the first time, a spectral analysis is carried out in the northern area of the Dinaric karst of Croatia with the aim to characterize and more precisely define the functioning of this karst aquifer, within the newer period 1981–2012. For this purpose, two periods were taken, one closer to the beginning and the other near the end of the 1981–2012 period. Since there were interruptions in the measurements at these hydrological stations, the selected periods (1986–1994 and 2001–2009) were the only periods that were long enough and without interruptions in measurements.
Spectral and correlation analysis was performed on hydrological and meteorological data on a two time series, each nine years long from four hydrological stations and two meteorological stations. Using the spectral and correlation analysis, the aquifer response was analyzed since the karst aquifer can be considered as a filter that transforms the input signal into the output signal. Both analyses use daily precipitation as input data and daily discharge as output data.
First, we will discuss the study area, used data, and spectral and correlation analysis methods. Then we will apply these methods to our hydrological and meteorological data and interpret the obtained results in accordance with the hydrogeological condition of the investigated area.
2. Materials and Methods
2.1. Study Area
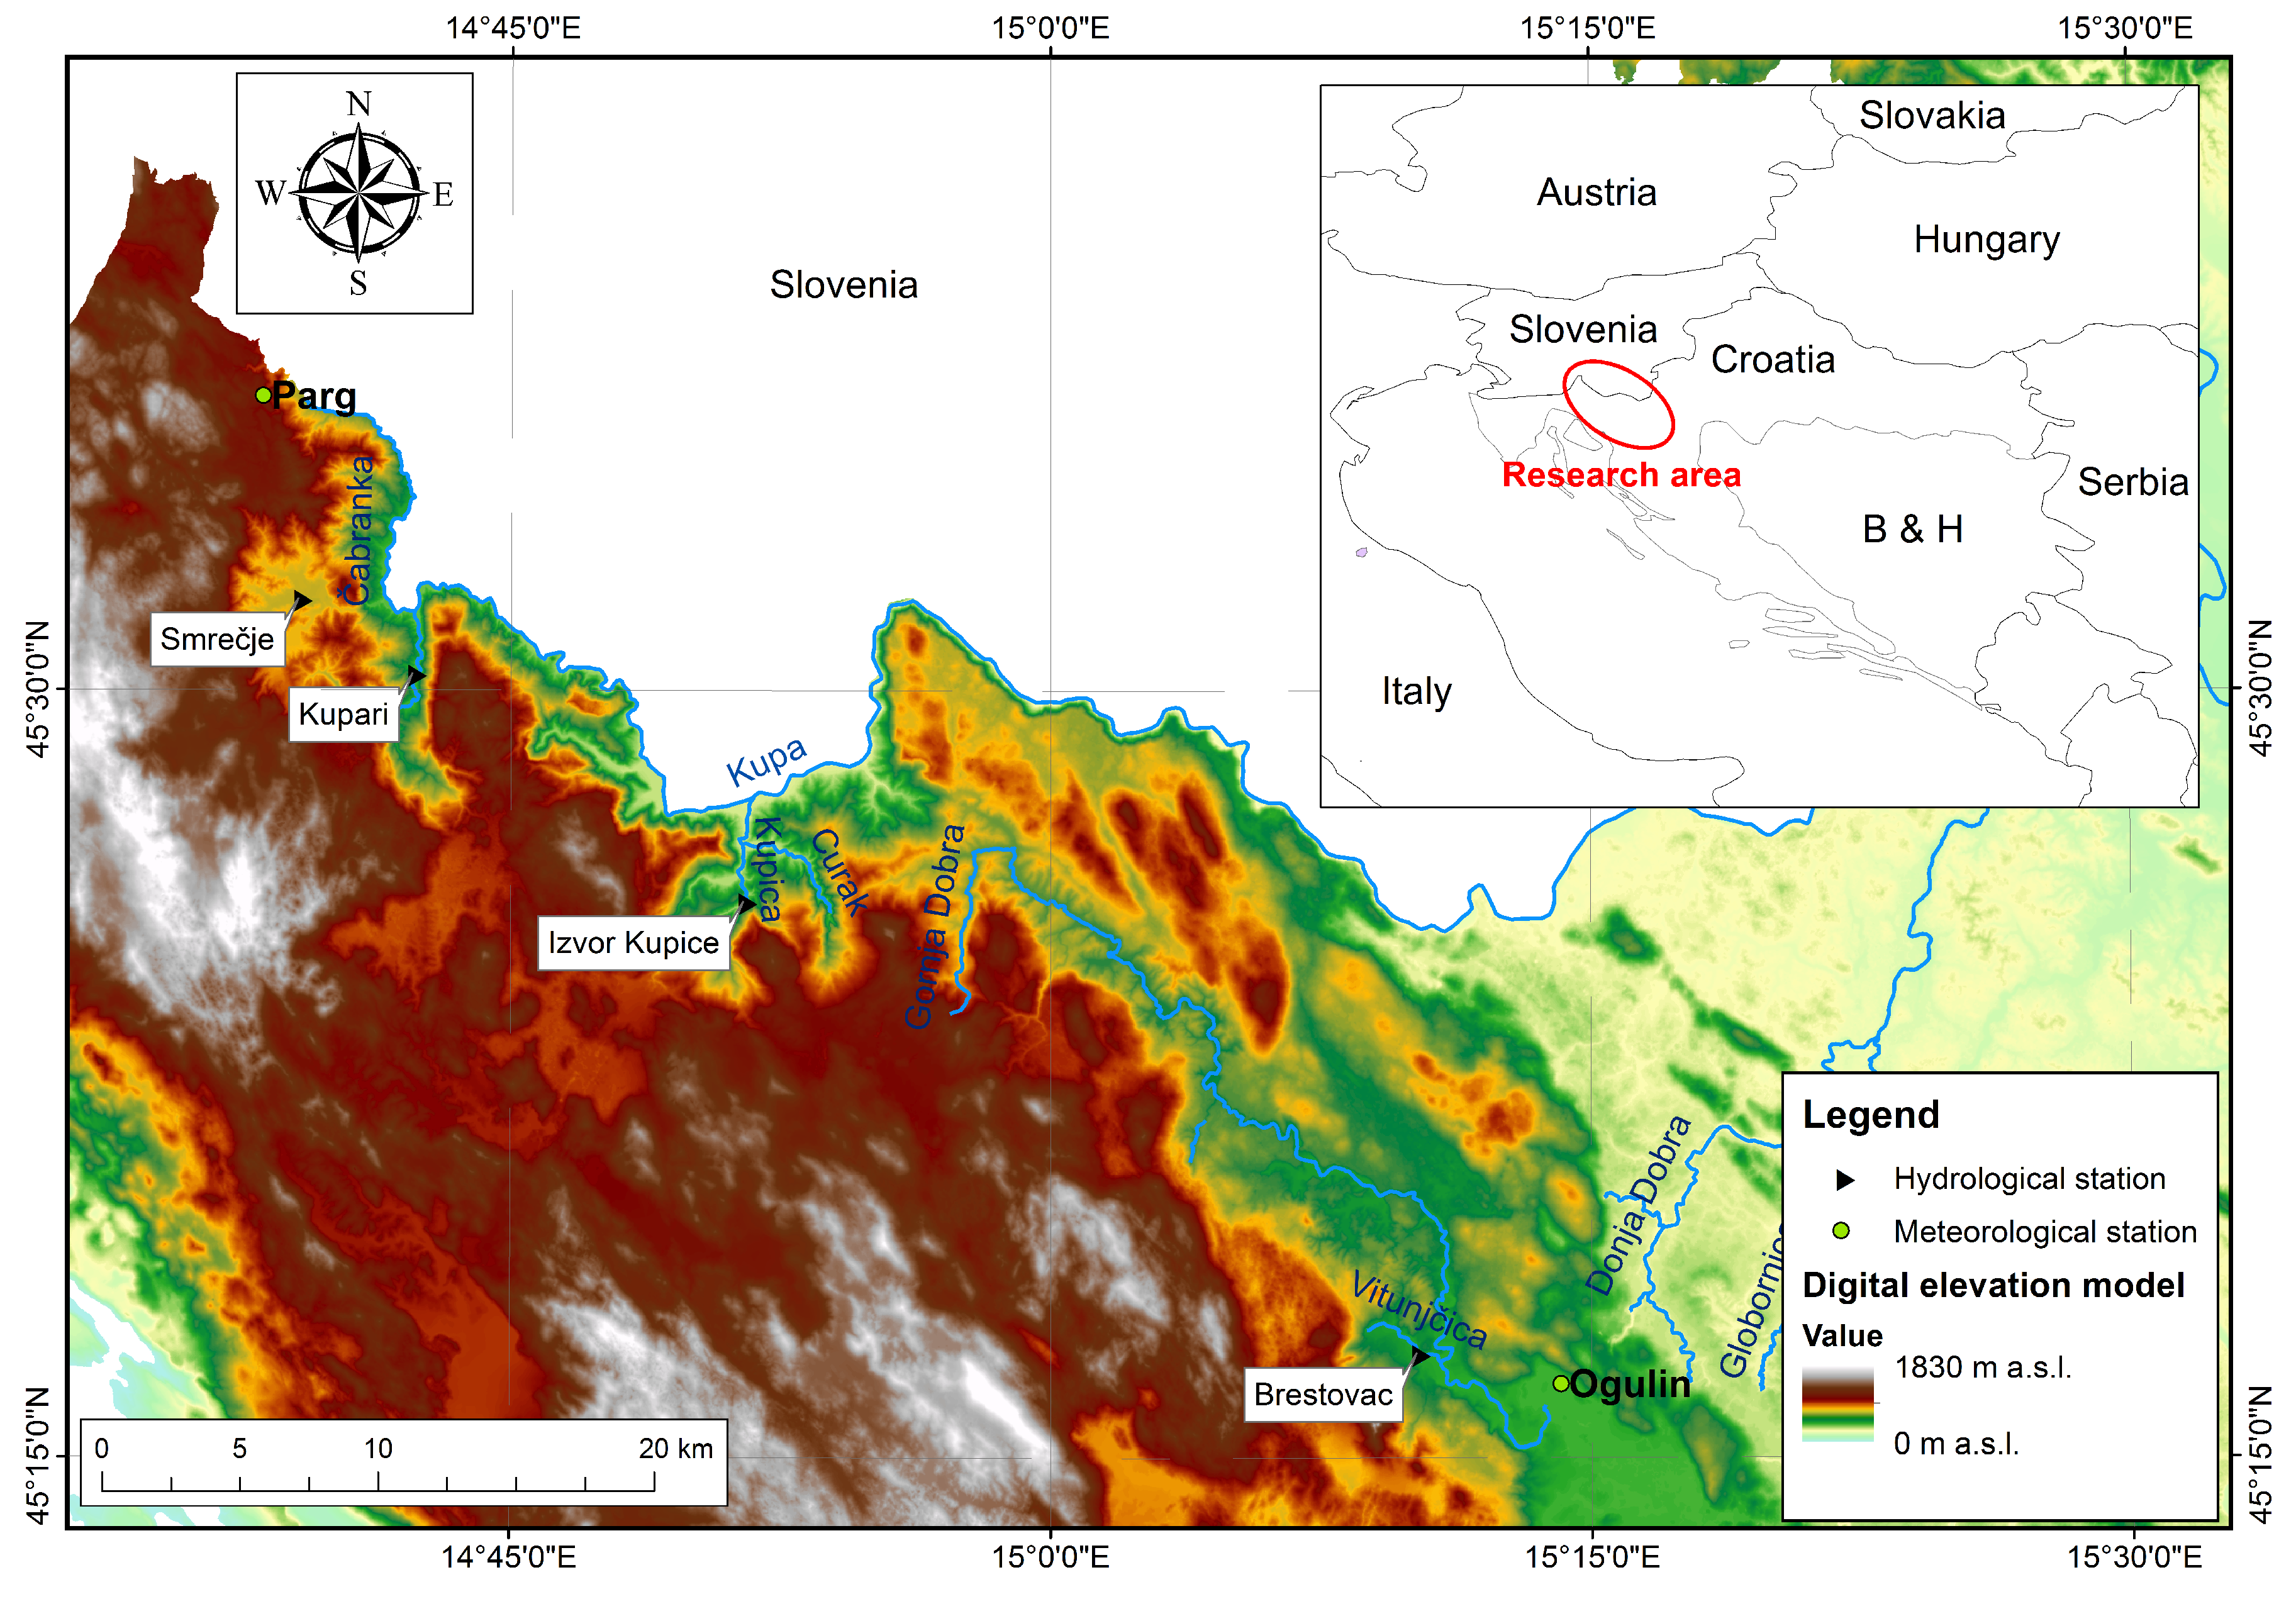
In accordance with the Water Framework Directive 2000/60/EC [46], the delineation and characterization of the groundwater bodies of the Republic of Croatia was carried out [47,48], including the study area of this paper, which is located in the mountainous area of the northern part of the Dinaric karst of Croatia (see Figure 1).
The source of the river Kupa is in this area. The Kupa River is the main river of this karst area, whose basin includes the sub-basins of the Dobra, Mrežnica, and Korana rivers. Unlike previous research on the wider area of the karstic Kupa River Basin, this analysis focuses on the source area of the Kupa River, the tributary of Gerovčica and the Dobra River, which belong to a high mountain area with a specific karst regime [38]. The analyzed karstic systems are entirely located in the Kupa River Basin, which itself is in the mountainous part of the Dinaric karst of Croatia. Three hydrological stations, Kupari, Smrečje, and Kupica Spring are located on the basin of the Kupa River, while one hydrological station, Brestovac, is located on the Dobra River Basin (see Figure 1). Only the Kupica Spring station is located at the spring of the tributary Kupica, while Kupari, Smrečje, and Brestovac are located downstream and without tributary influence.
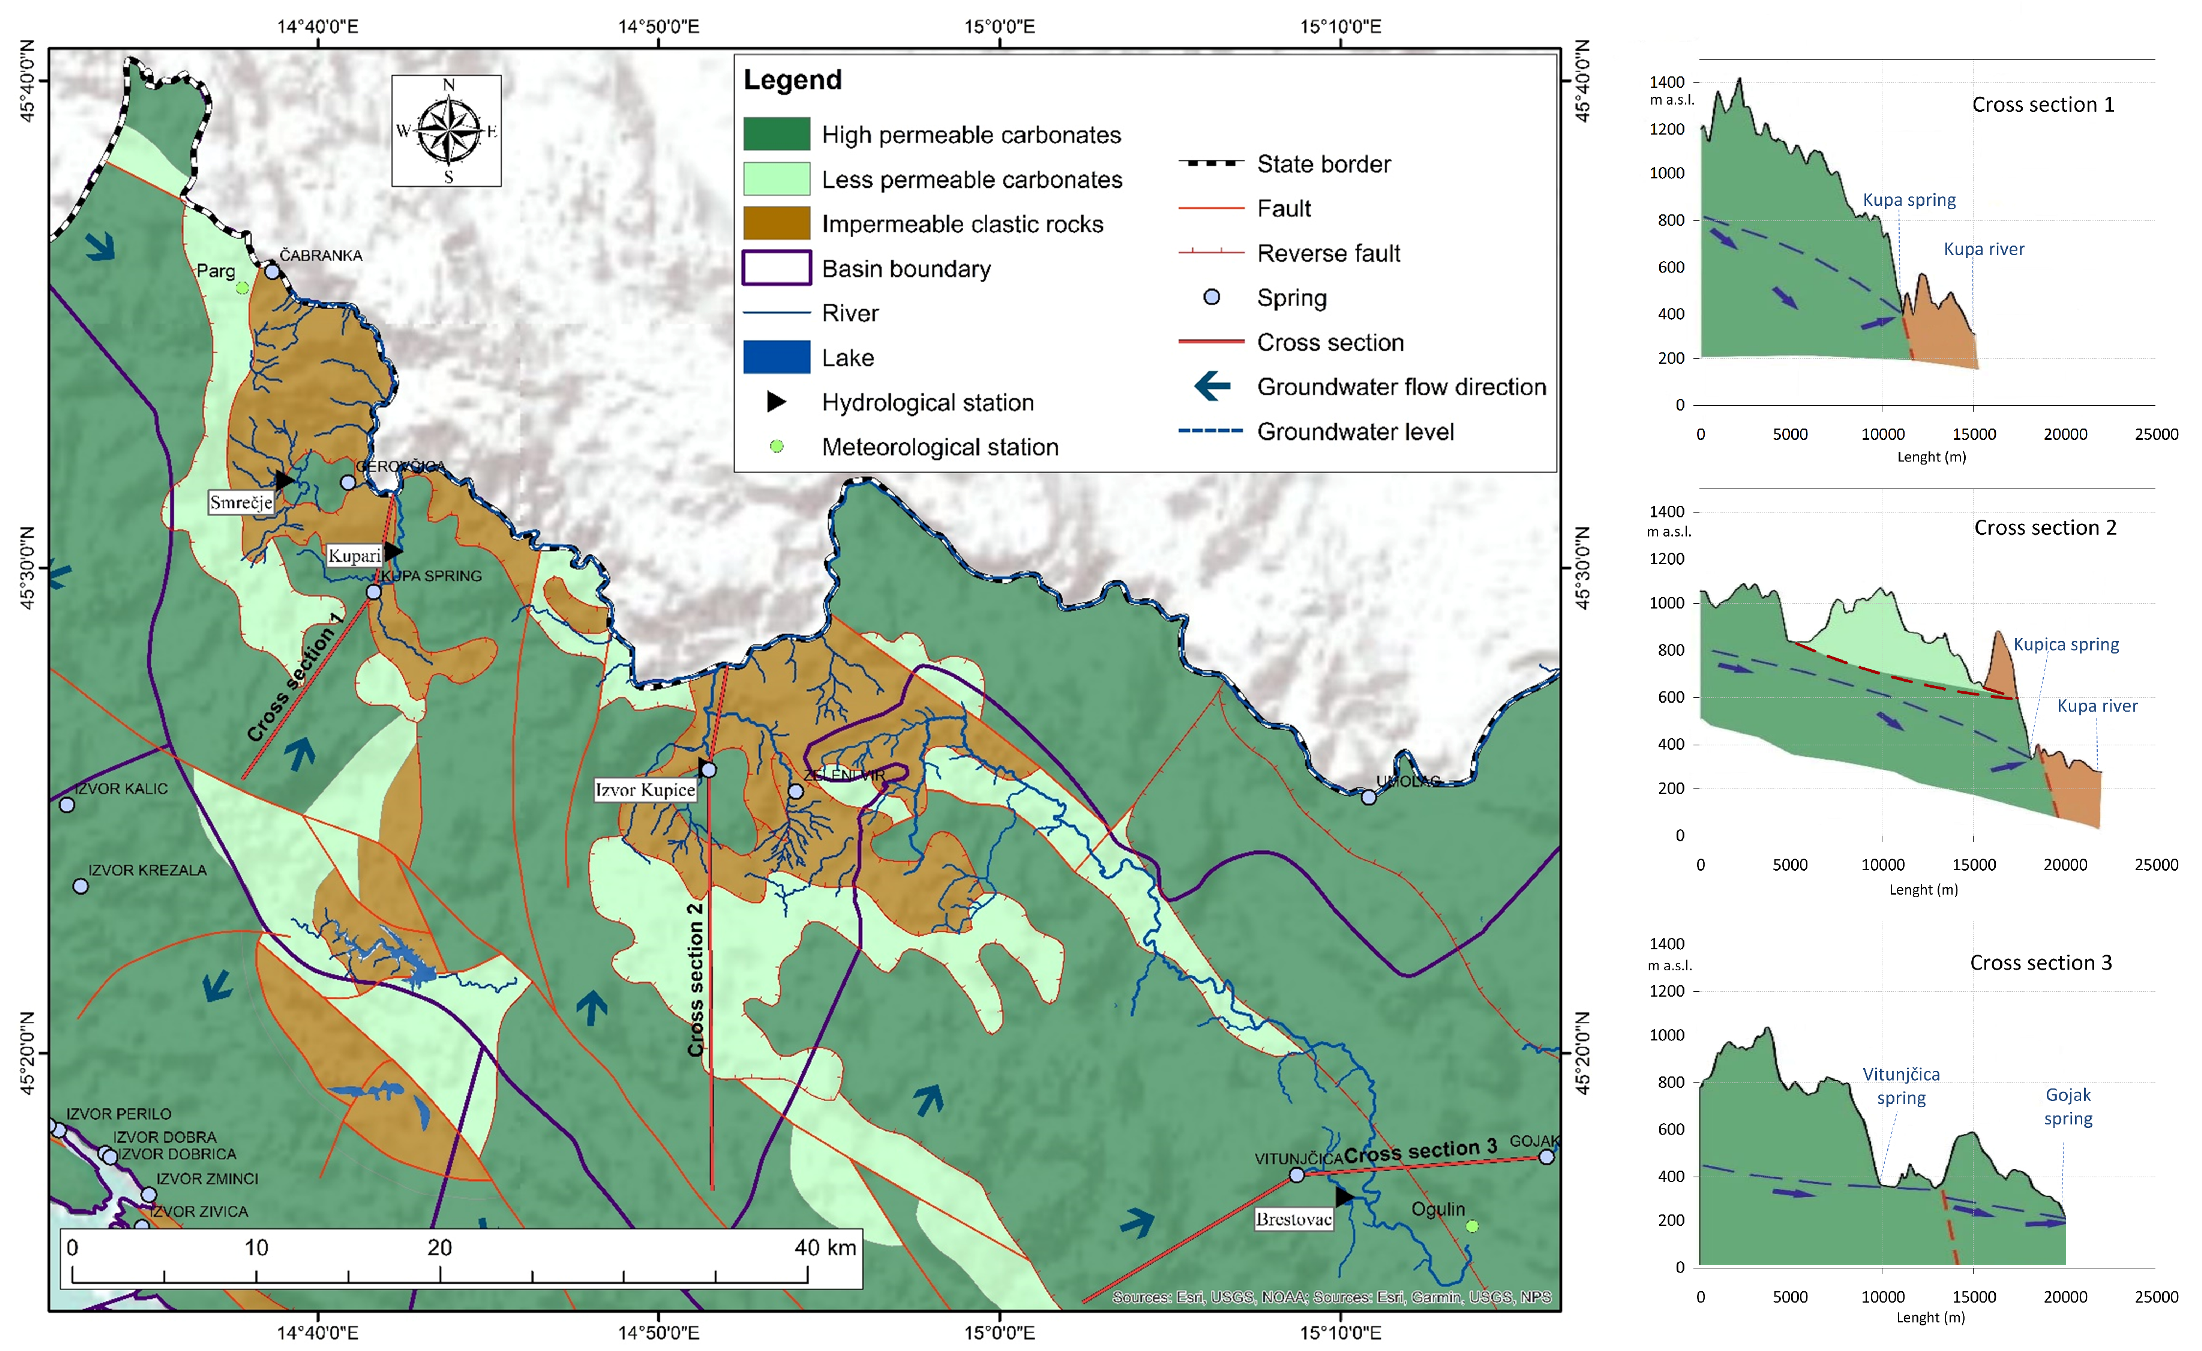
According to [49], the research area consists mostly of carbonate rocks with a considerable share of clastic sediments in different lithostratigraphic levels (see Figure 2).
Clastic layers of Carboniferous age in the core of anticlinal form of the Dinarides are the oldest layers, comprised of shales, sandstones, and conglomerates. The clastic sediments are of Permian age with barite and transition to dolomites are continuously sedimented. The terrestrial phases are of the Triassic age as is the continuity of sedimentation in the Upper Triassic, which began with clastic sediments and ended with thick series of the main dolostones. The transition from Triassic into Jurassic is characterized by the appearance of limestones and their gradual prevalence over the dolostones. The whole Jurassic is represented with different varieties of limestones and repeated increases in the dolomite components at the end of this age. Cretaceous carbonate layers have been found, only in the small downstream areas. From the Quaternary sediments, the fluvioglacial sediments as the remnants of glacier activity prevail in the mountain area, while terrace sediments along the rivers and debris prevail on the steep slopes of river canyons. From the hydrogeological point of view the position of the individual layer in the geological structure—dictates the arrangement of the drainage systems, directions of groundwater flows, positions of the karst springs and the intrinsic dynamics of the karst aquifer. Therefore, limestones of all the lithostratigraphic members of the Mesozoic age belong to the group of high permeable carbonate rocks. They can generally be distinguished morphologically, are deeply karstified, and are the main carriers of the groundwater towards the large karst springs. The second group of rocks consists of less permeable carbonate rocks in which, except for the limestones, there are considerable quantities of dolostones; this decreases the permeability of the complete rock mass. Low permeable carbonate rocks are pure dolostones. They constitute the main barriers in the groundwater flows, especially when they appear in the form of a superpositional sequence over the impermeable clastic sediment rocks. The impermeable complex consists mainly of clastic sediments of Paleozoic age, although there are some clastic sediment rocks at the beginning of the Triassic.
This area is subjected to intense precipitations, which can range up to 4000 mm a year. The influence of the Mediterranean is very clear, and the area of this analysis has an irregular annual distribution of precipitations, with long dry periods during the spring and summer and high levels of concentrated precipitations during the autumn and winter (see Figure 3). It is important to note that most precipitation during the winter is in the form of snow which, due to the low air temperature in the area, stays for a long time. This precipitation in winter has little effect on water levels in the aquifer and begins to affect it only in the spring when the snow begins to melt. Snow has a special importance for the water system because the summer water minimums are greatly dependent on snow cover.
2.2. Data and Methods
Spectral and correlation analysis was carried out using hydrological data from four hydrological stations: Kupari at Kupa, Smrečje at the tributary Gerovčica, Kupica Spring, and Brestovac at the tributary Vitunjčica, which belongs to Dobra Sub-basin. At all hydrological stations, flow measurement is performed continuously by the water level recorder (limnigraph). The representative meteorological stations for this investigated area are Parg, near Čabar town and Ogulin.
Data used for this analysis are mean daily flow rates and daily precipitation using a two time series: the first one from 1986 to 1994 and the second one from 2001 to 2009. Both time series have a length of nine years, which is sufficient for spectral and correlation analysis [19] and the records of these two series cover sufficient rainy and dry periods.
Coefficients used for correlation and spectral analysis are well known and described in [52,53], but for the purpose of hydrological analyses in karst, these methods were originally adapted by [54] and since then, these methods have been used in hydrological research, especially in karst.
In this paper, the methodology described follows [55], and just a basic review is given. Correlation analysis includes autocorrelation and cross-correlation analysis as auto-spectral and cross-spectral analysis. Auto-spectral analysis explains the distribution of variance in the signal as a function of frequency. The variance of the signal with N data points over the lag time k is possible to describe by means of the autocovariance .
Since the covariance depends on the amplitude of the signal , by normalizing the covariance by the variance of the signal , the autocorrelation function is obtained. The autocorrelation involves correlating the signal with itself as a function of time lag k.
The method for calculating power spectrum is called the Blackman-Tukey method [56], and this method uses the complex Fourier transform of the autocorrelation function ,
where M is maximum lag and the sampling frequency. The power spectral density (PSD) is an alternative way of expressing the auto-spectrum. The Blackman-Tukey PSD can be estimated by:
where is a conjugate complex of the Fourier transform of the autocorrelation function and is the sampling frequency.
Cross-spectral analysis correlates a two time series in a frequency domain. The measure of variance between two signals, and over time lag k is the cross-covariance. An unbiased estimator of the cross-covariance of two signals with N data points over the time lag k is
The cross-covariance depends on the amplitude of both signals and , so by normalizing the covariance by the standard deviations of and , the cross-correlation function is obtained.
The same, Blackman-Tukey method uses the complex Fourier transform of the cross-correlation function
where M is maximum lag and the sampling frequency. The correlation between two spectra can be computed by means of coherence:
The coherence function has values from 0 to 1, where zero value indicates no correlation and a value of one indicates maximum correlation between signals and at frequency f.
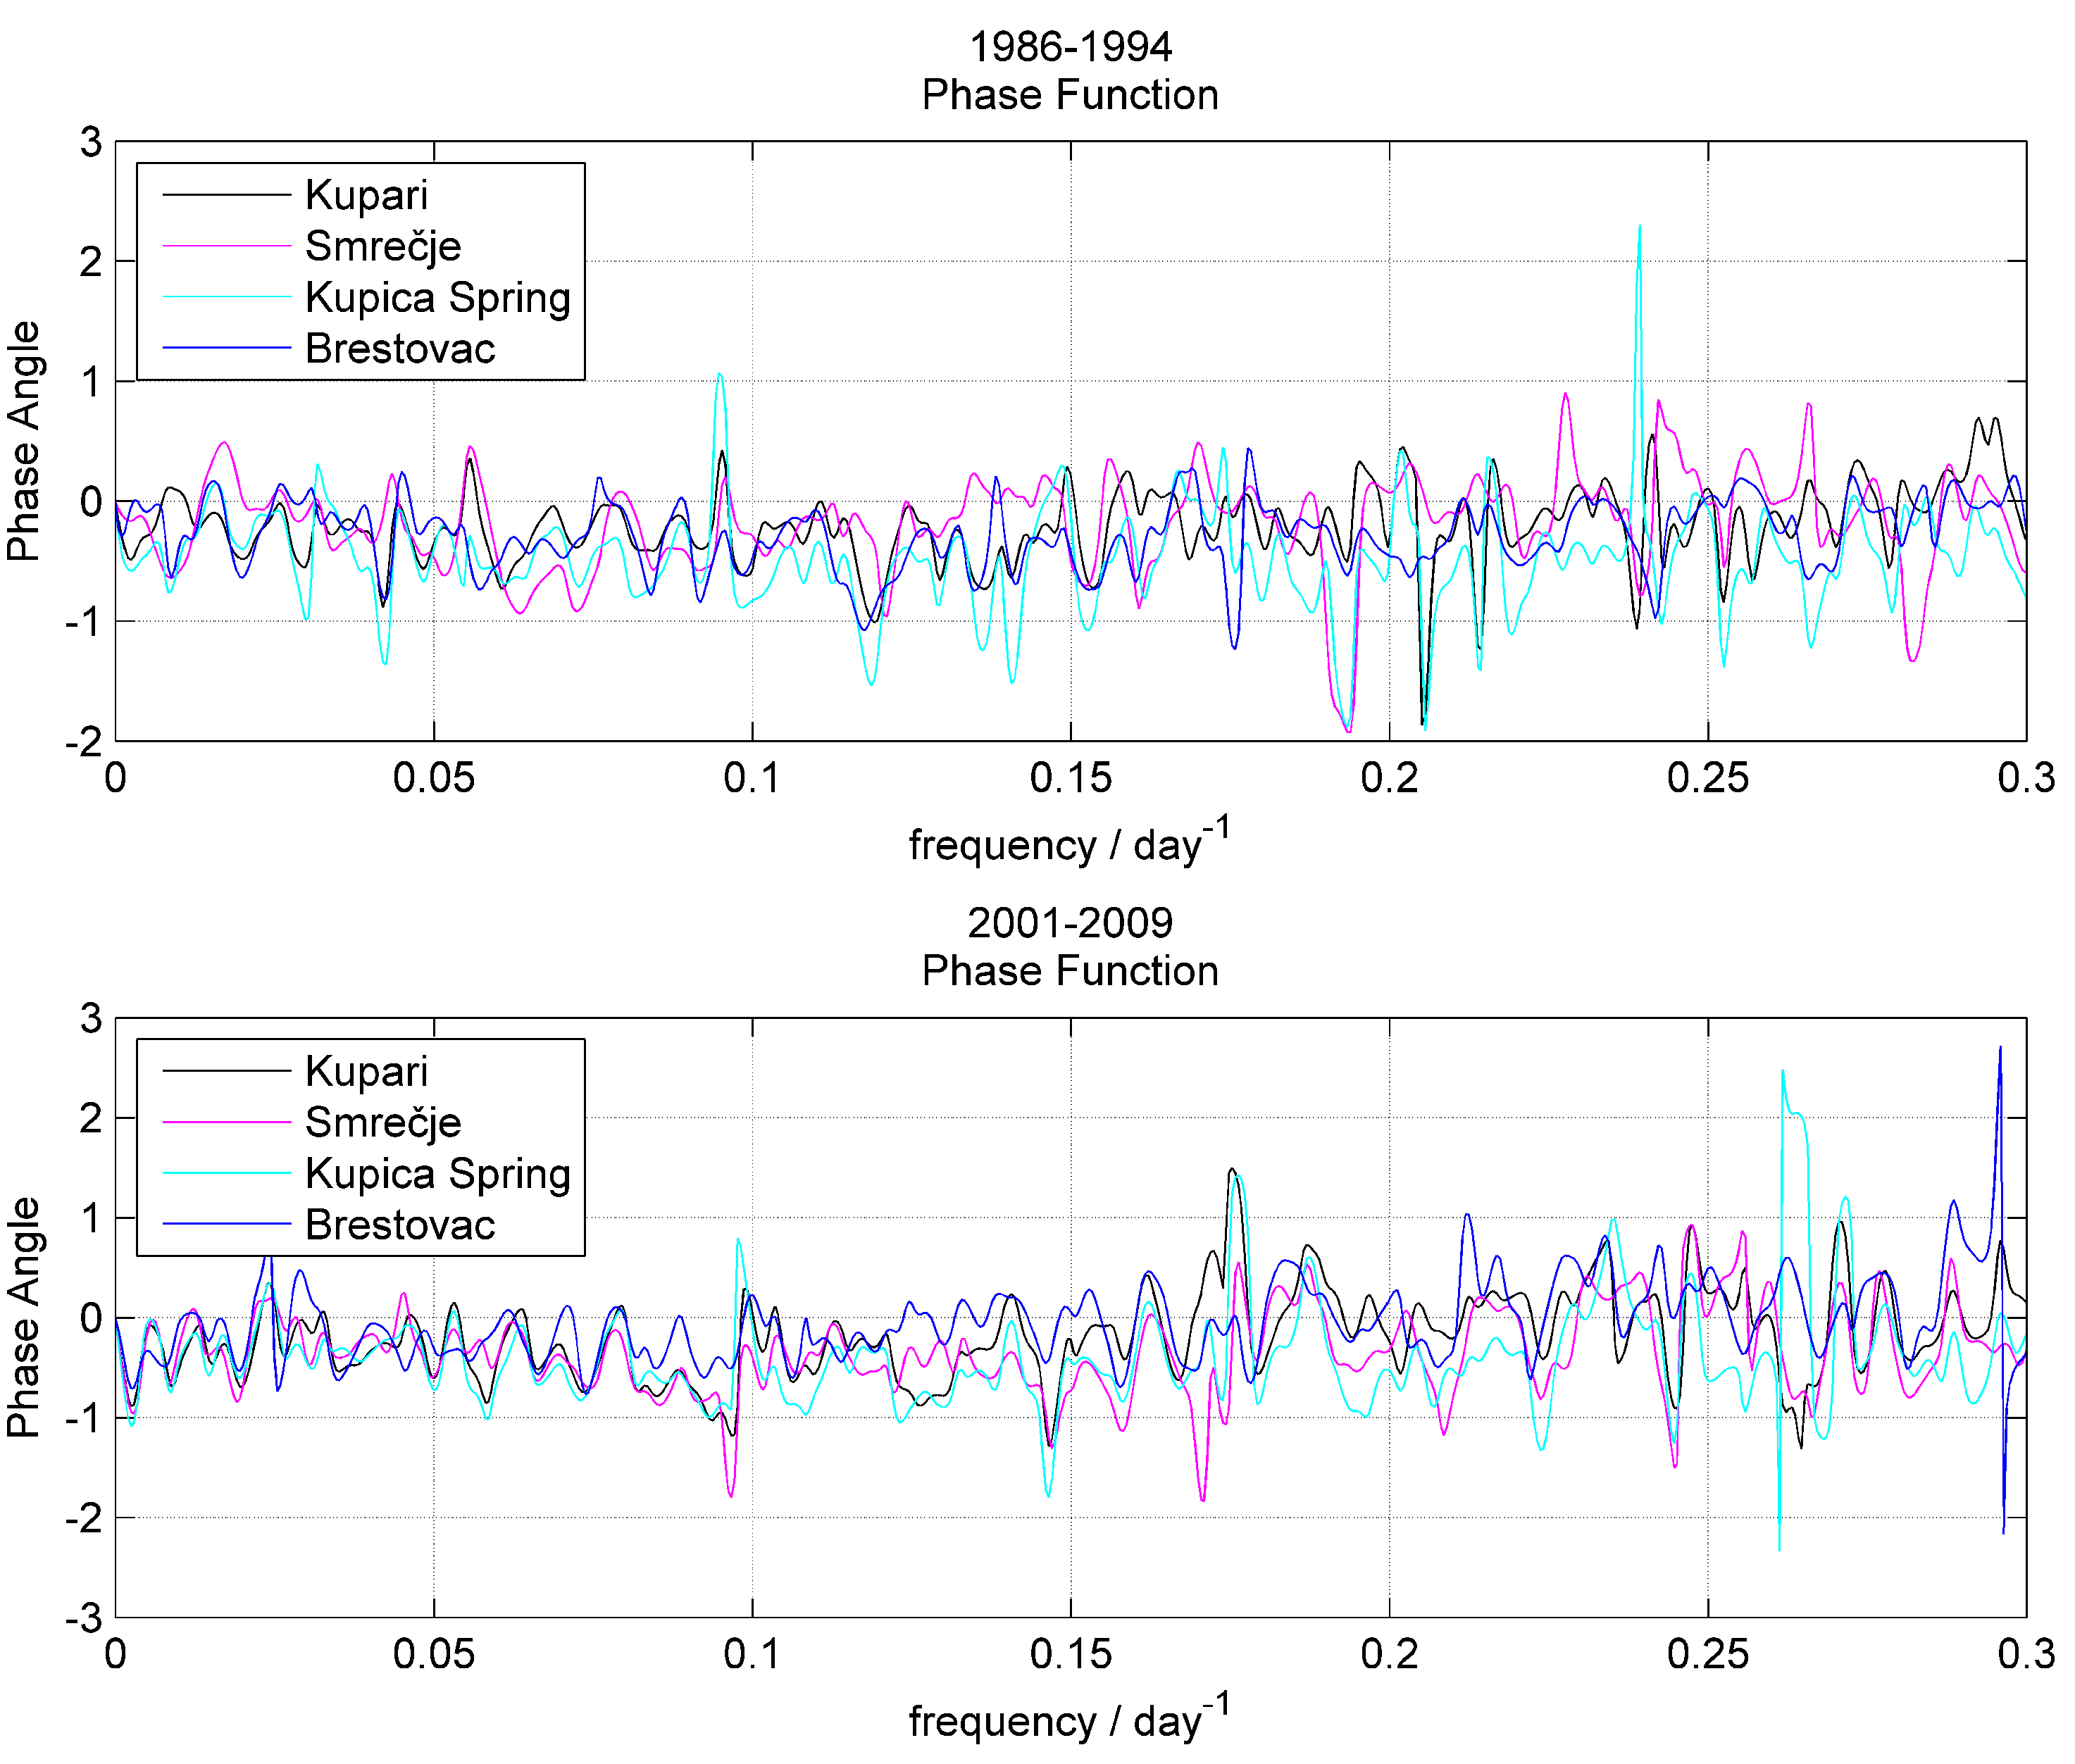
The phase function is defined as the angle in radians of each complex value of the cross-spectrum density function.
The cross-correlation function was calculated between precipitation data from meteorological stations and hydrological data from hydrological stations. For the hydrological stations Kupari, Smrečje, and Kupica Spring, meteorological data from Parg was used, and for the hydrological station Brestovac, meteorological data from Ogulin was used. For calculating cross-correlation, all 3287 daily data points were used in both time series.
In frequency domain calculations, the length of the time series was truncated, rather than padded with zeroes, since for this analysis, the length of the time series must be a power of two. This is done because in this time series in which the sampling frequency is one day, the frequency bin resolution and frequency resolution does not lose its quality by truncating the time series to 2048 data points. In the same way as in the cross-correlation analysis, the coherence function, the gain function and the phase spectrum were calculated using data from the meteorological stations Parg and Ogulin and the hydrological stations Kupari, Smrečje, Kupica Spring, and Brestovac.
When calculating the functions in the frequency spectrum, a rectangular window option is used, which divides the data into eight segments, each of the 256 values, with 50% overlapped samples of the window length. Frequencies lower than 0.01 day−1 (or period higher than 100 days) were not considered. The long-term trend is removed from all used series.
3. Results
3.1. Hydrological and Meteorological Data
Hydrological and meteorological data were analyzed through two time series. The first time series is from 1986 to 1994 and the second time series is from 2001 to 2009. The average and extreme values of the used parameters on considered stations over the two time periods are shown in Table 1 and Table 2.
3.2. Auto and Cross-Correlation, Power Spectrum, Coherence, Gain and Phase Functions
All four considered hydrological stations belong to one karst aquifer system, but it is not known to what extent these basins are interconnected due to the complex tectonic structures. Rifting, tumbling, and tangential movements in combination with new tectonic displacements very often bring younger, highly permeable carbonate rocks into the substrate of the older impermeable complexes. As a result, the groundwater flows under the older impermeable rocks which occasionally gives a somewhat confusing hydrogeological picture. A typical example of this is the strong spring zone of Kupica which is practically surrounded by the impermeable clastic sediment rocks of Paleozoic age. Consequently, groundwater flows are possible only under overthrusted older clastic layers, which was proven by tracing tests from the distant areas in the catchment [49].
The autocorrelation function in Figure 4 is symmetric about lag time zero for all hydrological stations in both of the analyzed periods. The autocorrelation function has a very sharp decline in low lag values; however, the value of zero reaches only at the lag value of around 50 for the previous period 1986–1994 and for the lag value of around 70 for the newer period 2001–2009. According to [57], lag time at which the autocorrelation function reaches a value of 0.2 defines a memory effect of signal. In the previous period 1986–1994, these lag times are seven days for Kupari, Smrečje, Kupica Spring, and six days for Brestovac. In the newer period of 2001–2009, memory lag is the same on all stations except for the Kupari station, where memory lag time is 11 days.
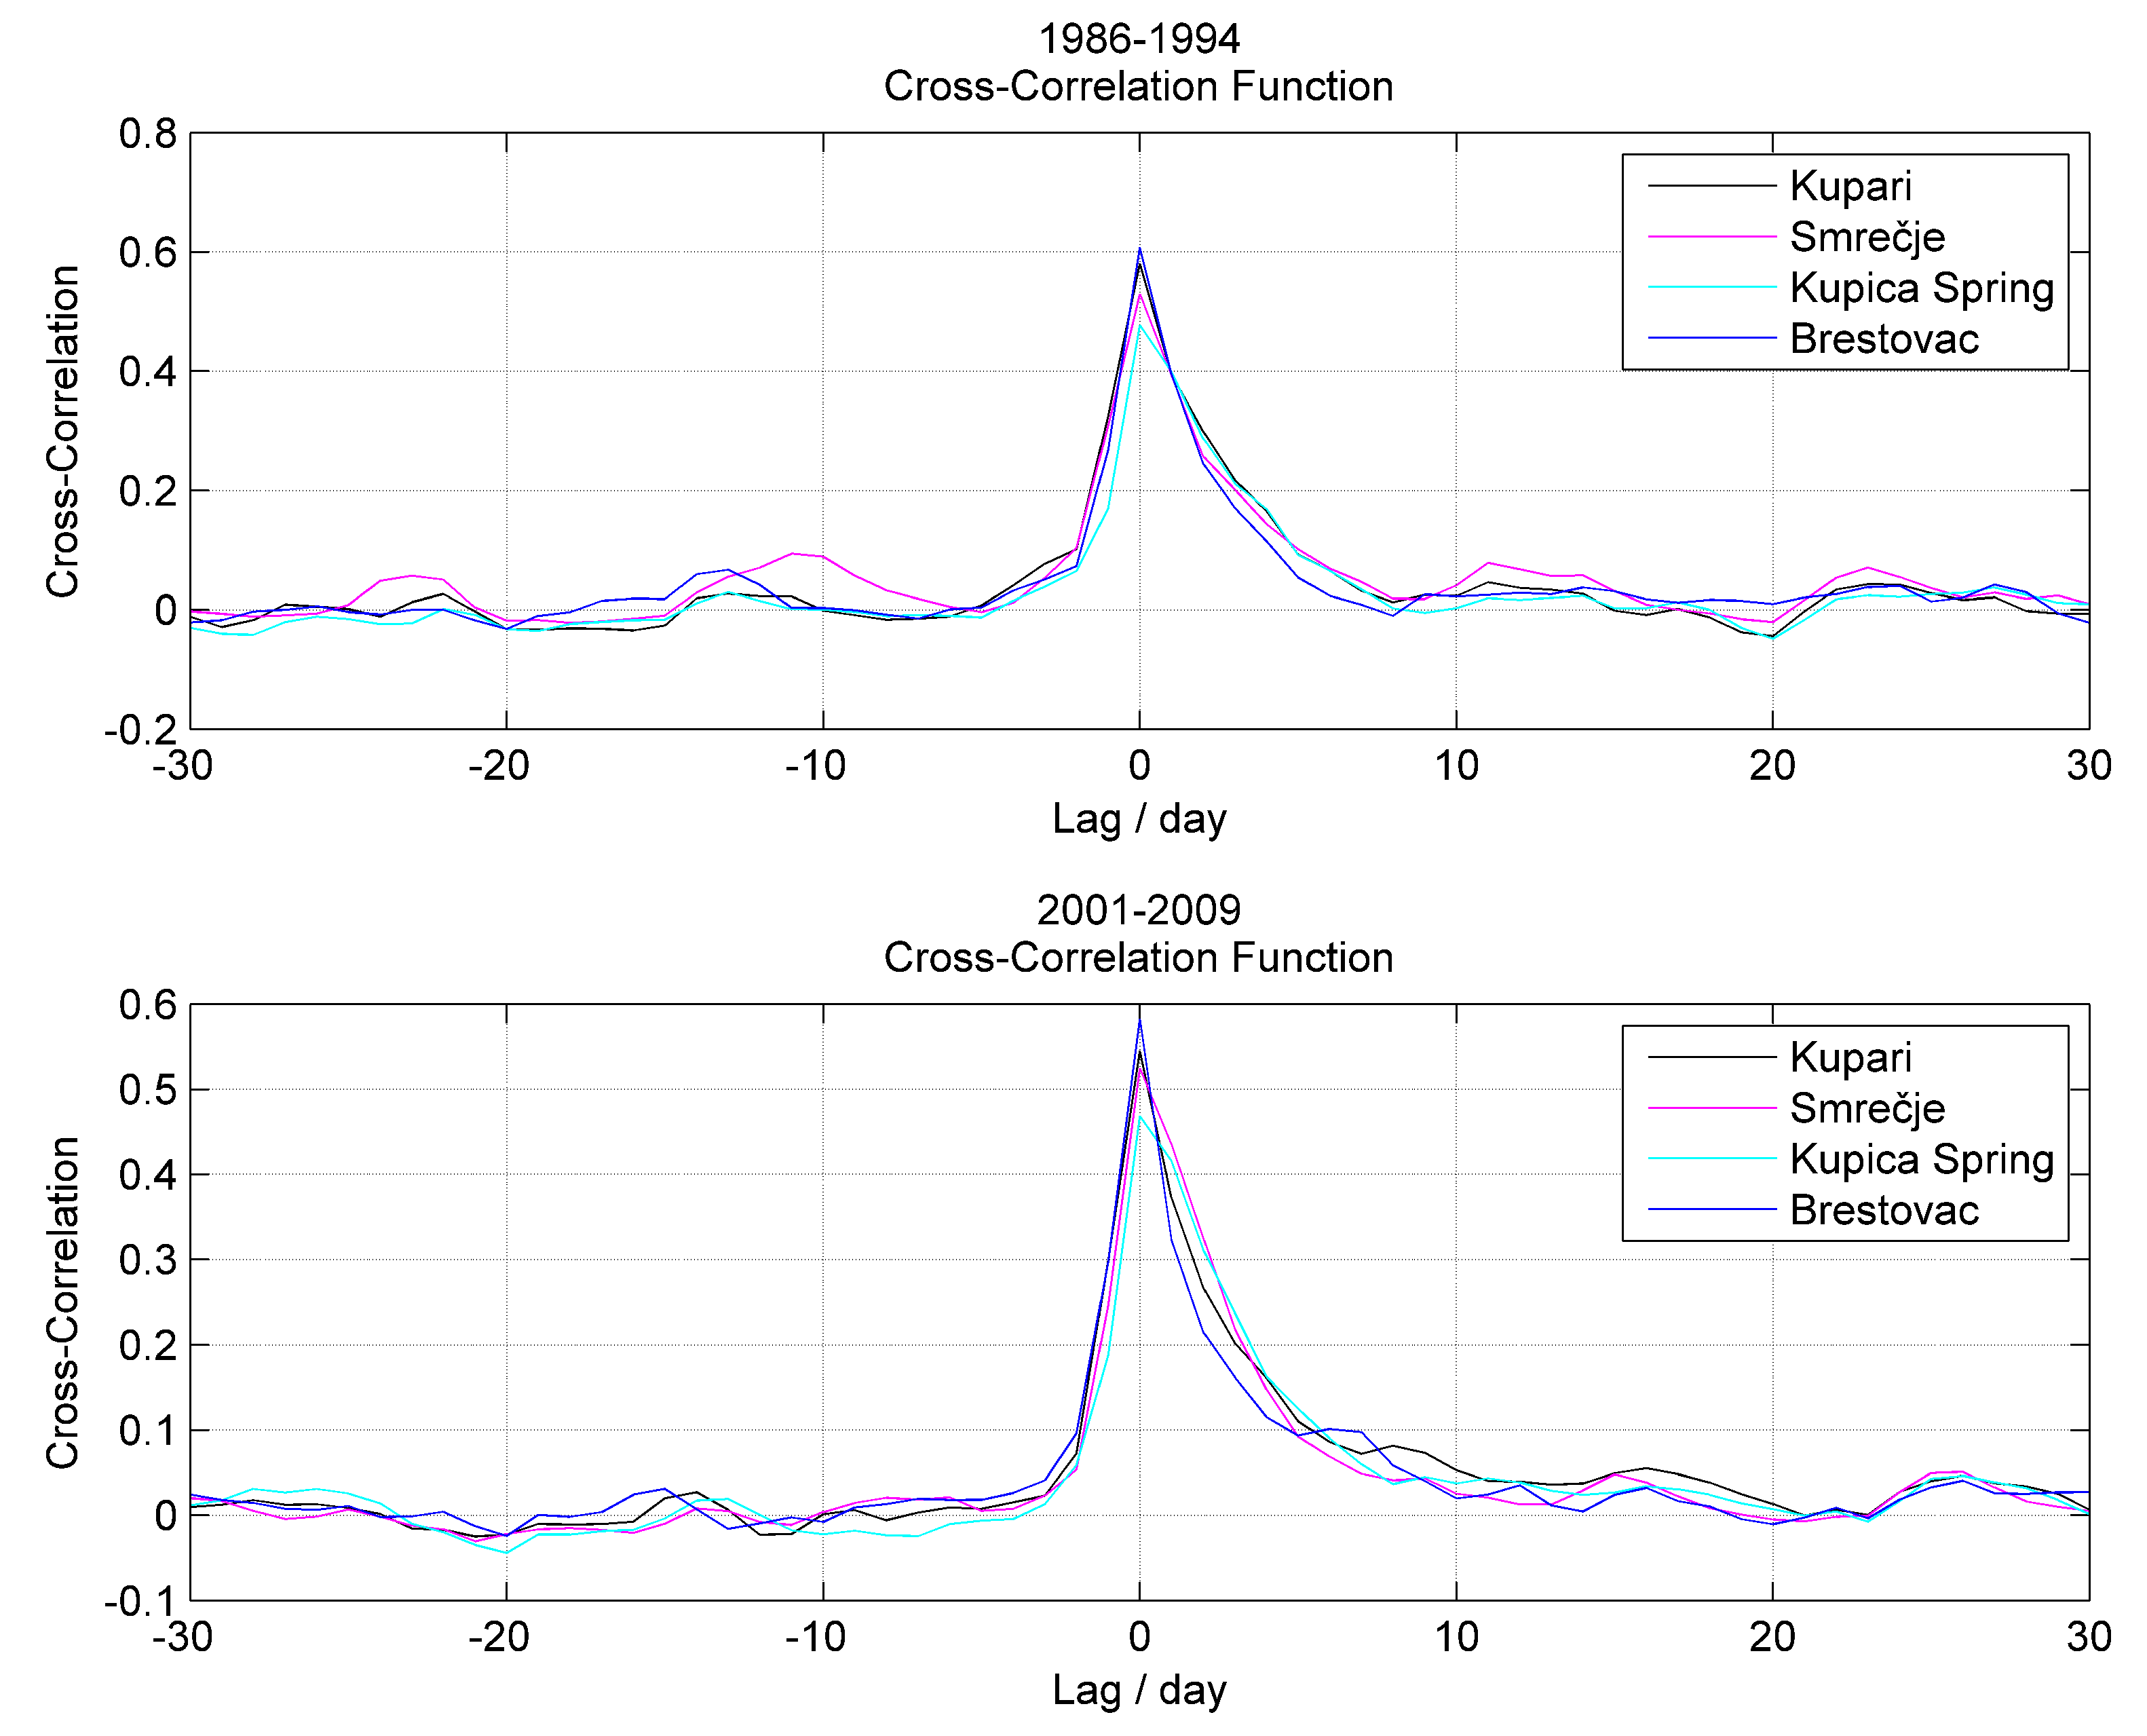
The cross-correlation function in Figure 5 shows the same impulse response to rainfall at all four hydrological stations. In the previous period, 1986–1994, the response time was 8 to 18 days, while in the recent period, 2001–2009, it was 19 to 21 days. The main peak of the cross-correlation function is at a lag time of zero days, and values are in the earlier period 0.58 for Kupari, 0.53 for Smrečje, 0.48 for Kupica Spring and 0.60 for Brestovac. In the more recent period, these values are 0.54, 0.52, 0.54 and 0.58, respectively. It is, therefore, evident that there is no significant change in the shape and values of the cross-correlation function between these two periods.
All graphical images in the frequency domain (Figure 6, Figure 7, Figure 8 and Figure 9) are shown in the range from 0 to 0.3 day−1. The power spectrum in Figure 6 distinguishes the frequencies at which the strongest signal in the time series occurs. These frequencies are converted into periods are seven months for Kupari, Smrečje and Brestovac, and 11 months for Kupica Spring in the previous period 1986–1994, and seven months for Kupari and Kupica Spring, 13 months for Smrečje, and six months for Brestovac in the newer period 2001–2009. This means that the maximum flows in both considered periods appear on average every eight months.
The coherence function in Figure 7 does not show any prominent value between the two frequency signals. The coherence function is distributed throughout the analyzed spectrum of frequencies (from 0.01 to 0.5 day−1) in such a way that shows that the baseflow component of flow is most common on analyzed hydrological stations at both analyzed periods.
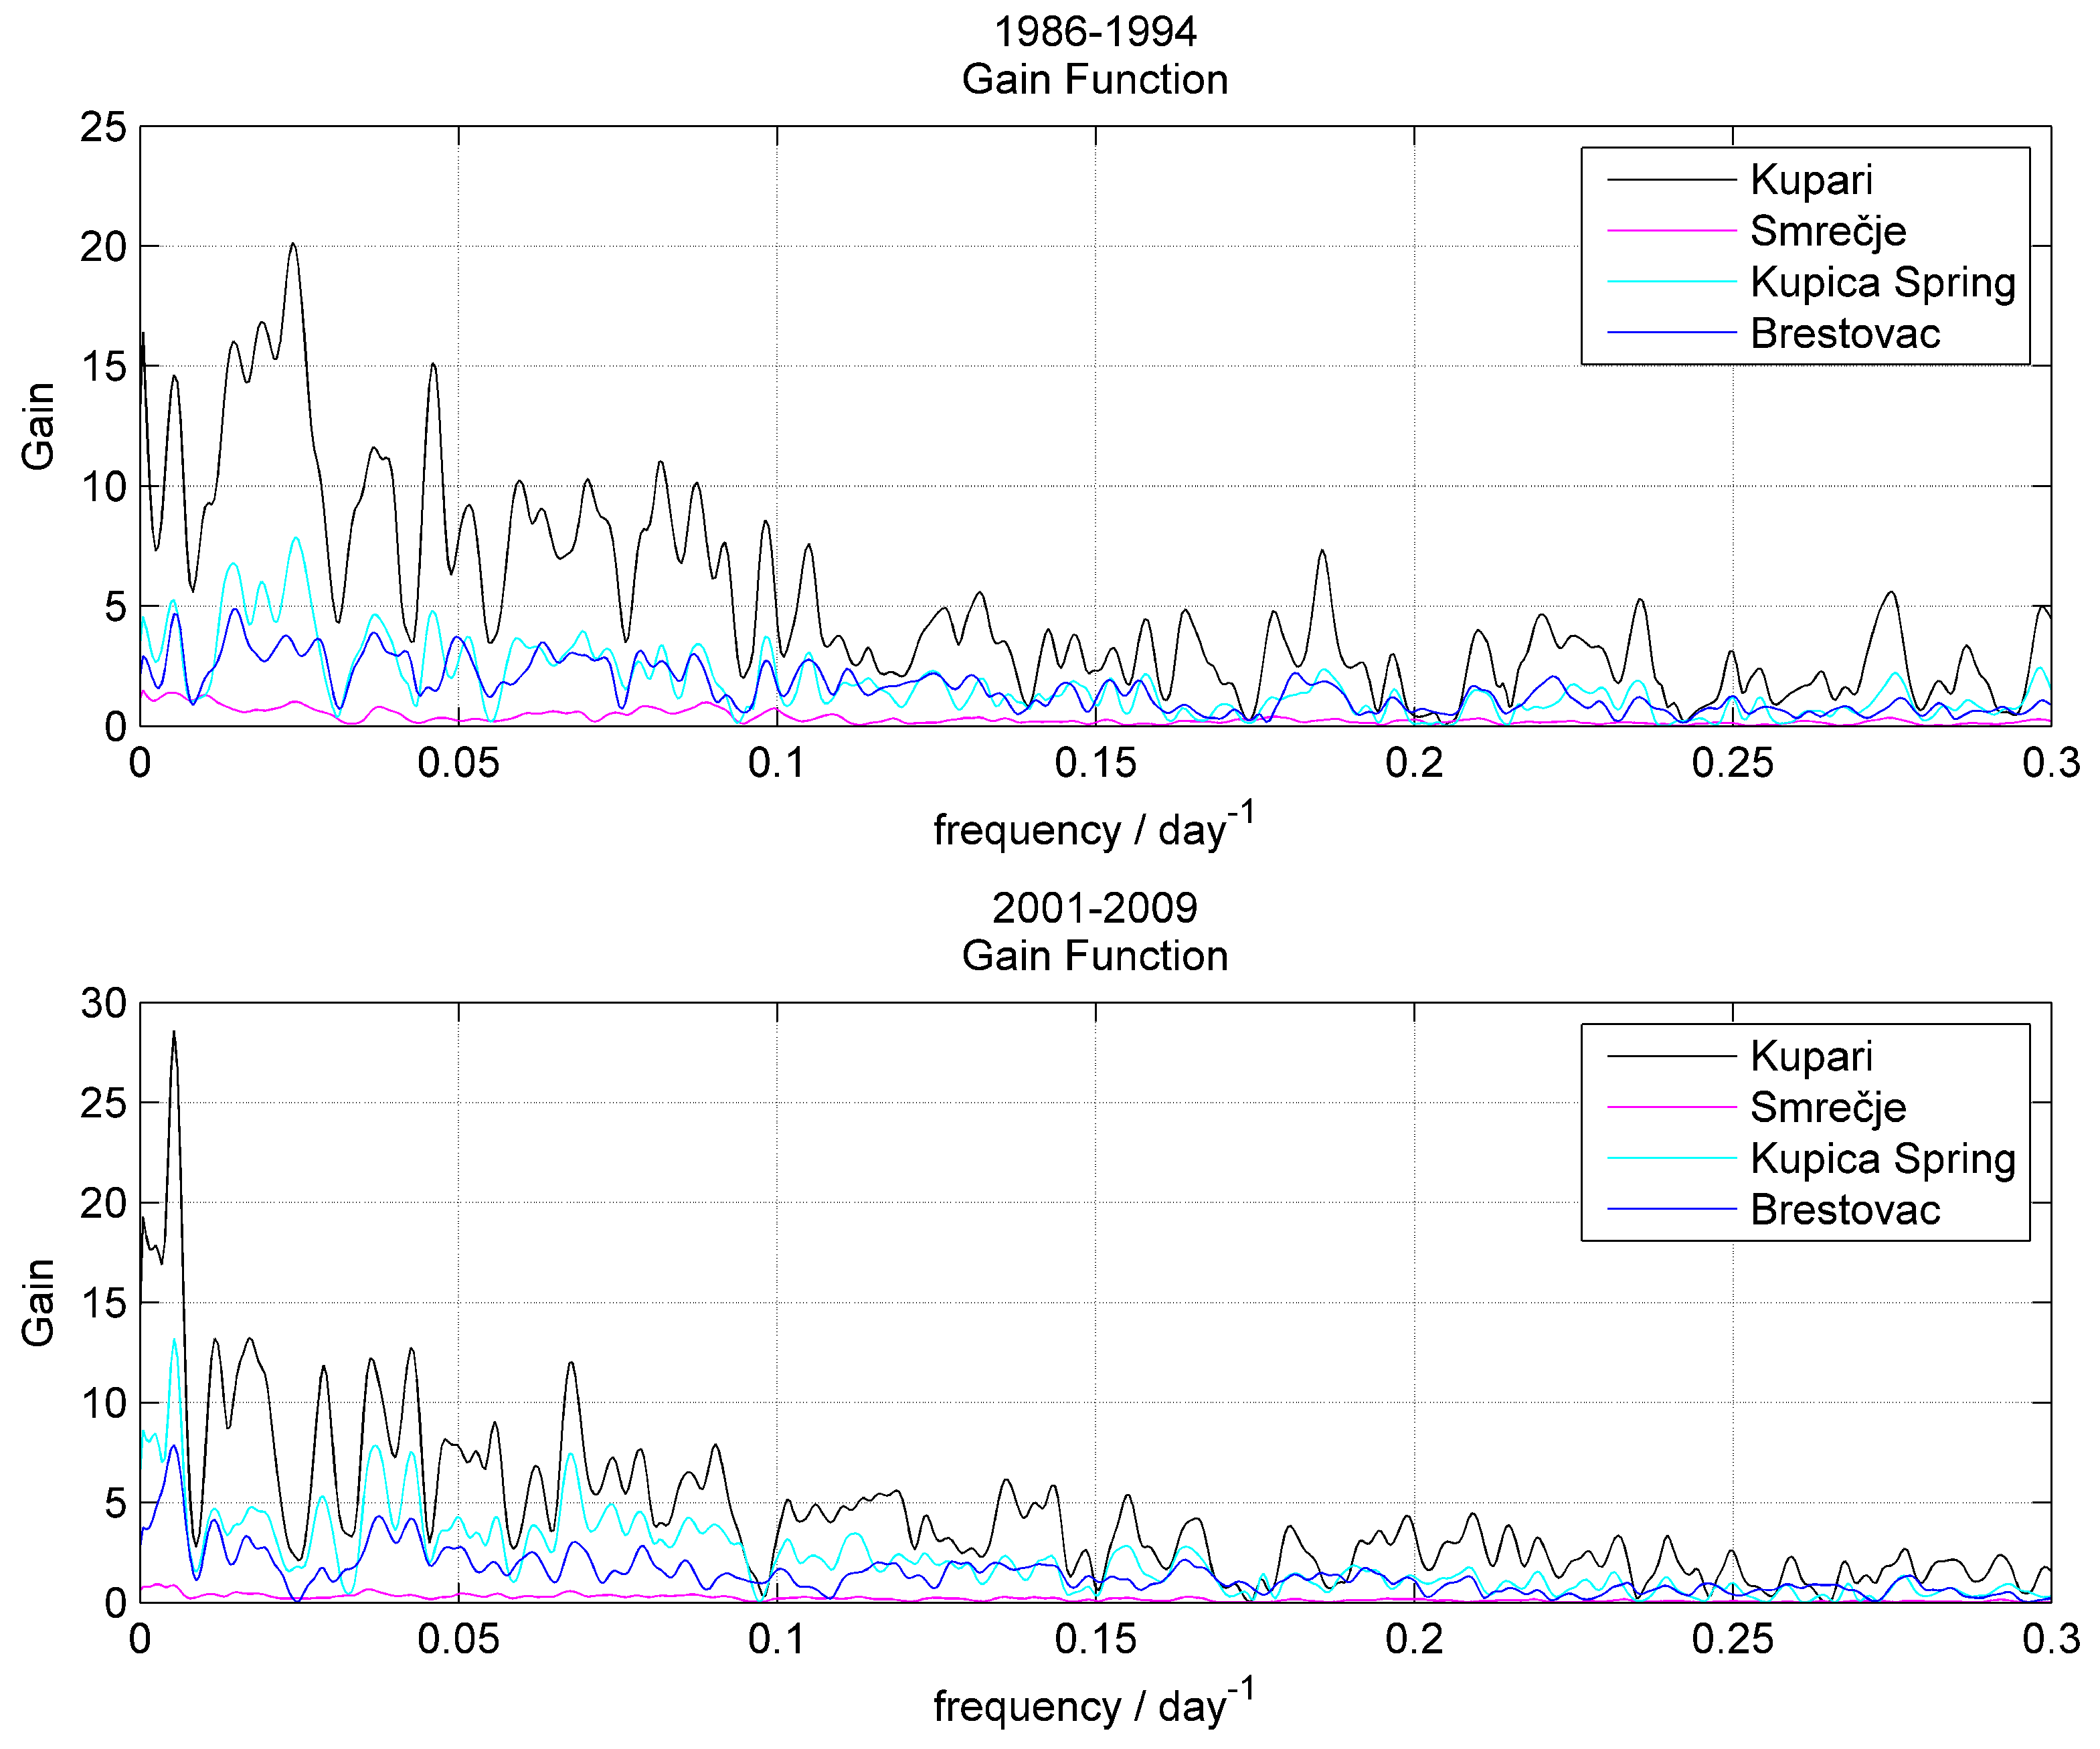
The values of the gain function above 1 indicate the amplification of the input signal, while values below indicate attenuation of the input signal. The corresponding frequency for this value indicates the duration of the baseflow of the aquifer, while the corresponding frequency for gain value of 0.4 indicates the duration of the aquifer’s quickflow. Values between 0.4 and 1 indicate an intermediate flow [19].
Figure 8 shows the gain function for the considered stations in the two analyzed periods. The signal at the Kupari station is very strong in both of the analyzed periods. It is evident that the value of the gain function is always greater than 1, indicating that the dominant type of flow is baseflow. The gain function has a similar shape for the Kupica Spring and Brestovac stations in both periods. The baseflow component lasts for 3 days, while the value of the gain function does not fall below 0.4 so the dominant type of flow is intermediate flow. At the Smrečje station, the duration of the baseflow component was observed only in the earlier period and is 41 days. The duration of the quickflow component in that period is 9 days. There is no recorded baseflow component in the newer period, and the duration of the quickflow component is 12 days. The dominant type of flow at the Smrečje station is intermediate flow and quickflow.
The phase function in Figure 9 at first glance shows good alignment in a very low frequency range, especially in the second analyzed period (2001–2009) (from 0 to 0.003 day−1). However, this alignment is in a very narrow frequency band, and it is risky to calculate the delays on such a small number of points. Above these frequencies, the signal is very attenuated, incoherent, and distorted, as indicated by the conclusions of the coherence function and gain function in that frequency range, so it is not possible to draw any conclusion about delay times either.
4. Discussion
The response rate of springs on rainfall events can be associated with the karstification level of an aquifer, the thickness of the unsaturated zone, permeability of the overburden layers as well as field coverage with soil and vegetation. Namely, since the response rate of the spring is a consequence of the aquifer characteristics (and the characteristics of the surface), which is unchanged in time, the spring reactions should be the same. On the other hand, registered changes of the input signal and values and occurrences of extreme flow rates that have increased in the newer analyzed period suggest that spring reactions should be different. This is the reason the conducted analysis indicated small differences between the two analyzed periods.
Spectral analysis allows the hydrograph analysis as a whole in relation to an input parameter, most commonly precipitation. The phase function can give information about delay in the response of the system. The coherence function explains at which frequencies there is consistency between the precipitation at the system input and the flow to the system output. The gain function can distinguish between quickflow, intermediate flow, and base flow.
The coherence function shows that there is no frequency at which coherence is strong between the two signals. This indicates that baseflow is the dominant type of flow on the considered stations. The gain function shows that the dominant type of flow at the Kupari station is baseflow, at the Kupica Spring and Brestovac stations, the dominant type of flow is baseflow and intermediate flow, while at the Smrečje station, it is intermediate flow and quick flow. The phase function did not yield any results related to delay in signal response. The autocorrelation functions indicate that all signals are perfectly autocorrelated with themselves. Memory lag time is the same in both time periods, except for the Kupari station, where memory lag time increases from six to 11 days. The power spectrum shows that the intensities of the strongest signals (extremes) have increased in the newer period.
In accordance with all the above, it can be concluded that the analyzed karst area is highly karstified which is especially evident in smaller catchment areas such as Smrečje. Small karst aquifers have a negligible ability to retain water, and are much more susceptible to change of the input signal, as opposed to large karst aquifers (such as the aquifer of the Kupa spring) which, even in the case of extremely large karstification, due to the matrix and fracture porosity as well as the large area, do not dry out in dry periods and are less susceptible to changes of the input signal.
In the case of small and the highly karstified aquifers, the response rate of the source to the precipitation event is often so high that the daily data is not sufficient for a high-quality analysis. In such cases, hourly measurements of precipitation and discharge at the spring are required. Hourly data would provide a better frequency resolution and provide better insight into the spectrum of higher frequencies, as this system is special due to rapid changes in flows. Hourly data would enable making better conclusions on aquifer behavior, thus, based on the considered functions in this paper, it is very likely that the aquifer characteristics and the dependence of the input and output parameters (precipitation and flow) could be more accurately defined. Also, it can be concluded that this area of great strategic value with seasonal precipitations and consequently small spring discharge in dry periods, has a problem of insufficiently frequent measurements that prevents better aquifer characterization and greater exploitation of these natural resources. First, this problem can be addressed by more accurate monitoring, which would be the basis for a better understanding of aquifers and consequently better management and exploitation of resources. Respectively, without high-quality input data (detailed field measurements) there is no method that can provide high-quality output data.
Finally, based on the conducted analyses, it can be concluded that there is strong change of input signals between the analyzed time periods. The hydrogeological characteristics of the considered karstic aquifer systems are a dominant controlling factor, compared to the climatological factor. That is why those karst systems can cope with registered climate change for now.
References
Author Contributions
K.P. provided conceptualization, methodology, formal analysis, data interpretation, data visualization and written the first draft of the manuscript. J.P. provided data interpretation and visualization and the first draft of the manuscript.
Funding
This research received no external funding.
Acknowledgments
Publication process is supported by the Development Fund of the Faculty of Mining, Geology and Petroleum Engineering, University of Zagreb.
Conflicts of Interest
The authors declare no conflict of interest.
References
- Croatian Parliament. Water Management Strategy; Official Gazette of Croatia: Zagreb, Croatia, 2008; Volume 91.
- Bonacci, O. Karst springs hydrographs as indicators of karst aquifers. Hydrol. Sci. J. 1993, 38, 51–62. [Google Scholar] [CrossRef] [Green Version]
- Ford, D.; Williams, P.W. Karst Hydrogeology and Geomorphology; John Wiley & Sons: Chichester, UK, 2007; p. 562. [Google Scholar]
- Fiorillo, F.; Revellino, P.; Ventafridda, G. Karst aquifer draining during dry periods. J. Cave Karst Stud. 2012, 74, 148–156. [Google Scholar] [CrossRef]
- Mathevet, T.; Lepiller, M.I.; Mangin, A. Application of time-series analyses to the hydrological functioning of an Alpine karstic system: The case of Bange-L’Eau-Morte. Hydrol. Earth Syst. Sci. 2004, 8, 1051–1064. [Google Scholar] [CrossRef]
- Bailly-Comte, V.; Jourde, H.; Roesch, A.; Pistre, S. Mediterranean flash flood transfer through karstic area. Environ. Geol. 2008, 54, 605–614. [Google Scholar] [CrossRef]
- Bailly-Comte, V.; Jourde, H.; Roesch, A.; Pistre, S.; Batiot-Guilhe, C. Time series analyses for Karst/River interactions assessment: Case of the Coulazou river (southern France). J. Hydrol. 2008, 349, 98–114. [Google Scholar] [CrossRef]
- Bailly-Comte, V.; Martin, J.B.; Screaton, E.J. Time variant cross correlation to assess residence time of water and implication for hydraulics of a sink-rise karst system. Water Resour. Res. 2011, 47. [Google Scholar] [CrossRef] [Green Version]
- Delbart, C.; Valdes, D.; Barbecot, F.; Tognelli, A.; Richon, P.; Couchoux, L. Temporal variability of karst aquifer response time established by the sliding-windows cross-correlation method. J. Hydrol. 2014, 511, 580–588. [Google Scholar] [CrossRef]
- Delbart, C.; Valdés, D.; Barbecot, F.; Tognelli, A.; Couchoux, L. Spatial organization of the impulse response in a karst aquifer. J. Hydrol. 2016, 537, 18–26. [Google Scholar] [CrossRef]
- Eris, E.; Wittenberg, H. Estimation of baseflow and water transfer in karst catchments in Mediterranean Turkey by nonlinear recession analysis. J. Hydrol. 2015, 530. [Google Scholar] [CrossRef]
- Fan, Y.; Huo, X.; Hao, Y.; Liu, Y.; Wang, T.; Liu, Y.; Yeh, T.J. An assembled extreme value statistical model of karst spring discharge. J. Hydrol. 2013, 504, 57–68. [Google Scholar] [CrossRef]
- Fu, T.; Chen, H.; Wang, K. Structure and water storage capacity of a small karst aquifer based on stream discharge in southwest China. J. Hydrol. 2016, 534, 50–62. [Google Scholar] [CrossRef]
- Jemcov, I.; Petric, M. Measured precipitation vs. effective infiltration and their influence on the assessment of karst systems based on results of the time series analysis. J. Hydrol. 2009, 379, 304–314. [Google Scholar] [CrossRef]
- Labat, D.; Ababou, R.; Mangin, A. Rainfall–runoff relations for karstic springs. Part I: Convolution and spectral analyses. J. Hydrol. 2000, 238, 123–148. [Google Scholar] [CrossRef]
- Labat, D.; Ababou, R.; Mangin, A. Rainfall–runoff relations for karstic springs. Part II: Continuous wavelet and discrete orthogonal multiresolution analyses. J. Hydrol. 2000, 238, 149–178. [Google Scholar] [CrossRef]
- Massei, N.; Dupont, J.; Mahler, B.; Laignel, B.; Fournier, M.; Valdes, D.; Ogier, S. Investigating transport properties and turbidity dynamics of a karst aquifer using correlation, spectral, and wavelet analyses. J. Hydrol. 2006, 329, 244–257. [Google Scholar] [CrossRef]
- Mayaud, C.; Wagner, T.; Benischke, R.; Birk, S. Single event time series analysis in a binary karst catchment evaluated using a groundwater model (Lurbach system, Austria). J. Hydrol. 2014, 511. [Google Scholar] [CrossRef] [PubMed]
- Padilla, A.; Pulido-Bosch, A. Study of hydrographs of karstic aquifers by means of correlation and cross-spectral analysis. J. Hydrol. 1995, 168, 73–89. [Google Scholar] [CrossRef]
- Panagopoulos, G.; Lambrakis, N. The contribution of time series analysis to the study of the hydrodynamic characteristics of the karst systems: Application on two typical karst aquifers of Greece (Trifilia, Almyros Crete). J. Hydrol. 2006, 329, 368–376. [Google Scholar] [CrossRef]
- Pulido-Bosch, A.; Padilla, A.; Dimitrov, D.; Machkova, M. The discharge variability of some karst springs in Bulgaria studied by time series analysis. Hydrol. Sci. J. 1995, 40, 517–532. [Google Scholar] [CrossRef]
- Rahnemaei, M.; Zare, M.; Nematollahi, A.; Sedghi, H. Application of spectral analysis of daily water level and spring discharge hydrographs data for comparing physical characteristics of karstic aquifers. J. Hydrol. 2005, 311, 106–116. [Google Scholar] [CrossRef]
- Terzić, J.; Marković, T.; Pekaš, Ž. Influence of sea-water intrusion and agricultural production on the Blato Aquifer, Island of Korčula, Croatia. Environ. Geol. 2008, 54, 719–729. [Google Scholar] [CrossRef]
- Terzić, J.; Peh, Z.; Marković, T. Hydrochemical properties of transition zone between fresh groundwater and seawater in karst environment of the Adriatic islands, Croatia. Environ. Earth Sci. 2010, 59, 1629–1642. [Google Scholar] [CrossRef]
- Terzić, J.; Stroj, A.; Frangen, T. Hydrogeological investigation of karst system properties by common use of diverse methods: A case study of Lička Jesenica springs in Dinaric karst of Croatia. Hydrol. Process. 2012, 26, 3302–3311. [Google Scholar] [CrossRef]
- Bonacci, O.; Andrić, I. Impact of an inter-basin water transfer and reservoir operation on a karst open streamflow hydrological regime: An example from the Dinaric karst (Croatia). Hydrol. Process. 2010, 24, 3852–3863. [Google Scholar] [CrossRef]
- Bonacci, O.; Roje-Bonacci, T. Impact of grout curtains on karst groundwater behaviour: An example from the Dinaric karst. Hydrol. Process. 2012, 26, 2765–2772. [Google Scholar] [CrossRef]
- Bonacci, O.; Roje-Bonacci, T. Drastic hydrological changes caused by hydroelectrical development in karst: A case of the karst river Zrmanja (Croatia). Environ. Earth Sci. 2015, 74, 6767–6777. [Google Scholar] [CrossRef]
- Bonacci, O.; Ljubenkov, I.; Knezić, S. The water on a small karst island: The island of Korčula (Croatia) as an example. Environ. Earth Sci. 2012, 66, 1345–1357. [Google Scholar] [CrossRef]
- Bonacci, O.; Željković, I.; Galić, A. Karst rivers’ particularity: An example from Dinaric karst (Croatia/Bosnia and Herzegovina). Environ. Earth Sci. 2013, 70, 963–974. [Google Scholar] [CrossRef]
- Bonacci, O.; Andrić, I.; Yamashiki, Y. Hydrology of Blue Lake in the Dinaric karst. Hydrol. Process. 2014, 28, 1890–1898. [Google Scholar] [CrossRef]
- Bonacci, O.; Buzjak, N.; Roje-Bonacci, T. Changes in hydrological regime caused by human intervention in karst: The case of the Rumin Springs. Hydrol. Sci. J. 2016, 61, 2387–2398. [Google Scholar] [CrossRef]
- Bonacci, O.; Andrić, I.; Roje-Bonacci, T. Hydrological analysis of Skradinski Buk tufa waterfall (Krka River, Dinaric karst, Croatia). Environ. Earth Sci. 2017, 76, 669. [Google Scholar] [CrossRef]
- Palandačić, A.; Bonacci, O.; Snoj, A. Molecular data as a possible tool for tracing groundwater flow in karst environment: Example of Delminichthys adspersus in Dinaric karst system. Ecohydrology 2012, 5, 791–797. [Google Scholar] [CrossRef]
- Bonacci, O. Karst hydrogeology/hydrology of dinaric chain and isles. Environ. Earth Sci. 2015, 74, 37–55. [Google Scholar] [CrossRef]
- Bonacci, O.; Andrić, I. Karst spring catchment: An example from Dinaric karst. Environ. Earth Sci. 2015, 74, 6211–6223. [Google Scholar] [CrossRef]
- Željković, I.; Kadić, A. Groundwater balance estimation in karst by using simple conceptual rainfall–runoff model. Environ. Earth Sci. 2015. [Google Scholar] [CrossRef]
- Pavlić, K.; Kovač, Z.; Jurlina, T. Trend analysis of mean and high flows in response to climate warming—Evidence from karstic catchments in Croatia. Geofizika 2017, 34, 157–174. [Google Scholar] [CrossRef]
- Pavlić, K.; Jakobović, D. High flows from Gornja Dobra basin. Rudarsko-Geološko-Naftni zbornik 2018, 33, 45–52. [Google Scholar] [CrossRef]
- Žugaj, R. Regional Hydrological Analysis in the Karst of Croatia; Croatian Hydrological Society: Zagreb, Croatia, 1995; p. 139. [Google Scholar]
- Jukić, D.; Denić-Jukić, V. A frequency domain approach to groundwater recharge estimation in karst. J. Hydrol. 2004, 289, 95–110. [Google Scholar] [CrossRef]
- Jukić, D.; Denić-Jukić, V. Groundwater balance estimation in karst by using a conceptual rainfall–runoff model. J. Hydrol. 2009, 373, 302–315. [Google Scholar] [CrossRef]
- Jukić, D.; Denić-Jukić, V. Partial spectral analysis of hydrological time series. J. Hydrol. 2011, 400, 223–233. [Google Scholar] [CrossRef]
- Jukić, D.; Denić-Jukić, V. Investigating relationships between rainfall and karst-spring discharge by higher-order partial correlation functions. J. Hydrol. 2015, 530, 24–36. [Google Scholar] [CrossRef]
- Kadić, A.; Denić-Jukić, V.; Jukić, D. Revealing hydrological relations of adjacent karst springs by partial correlation analysis. Hydrol. Res. 2018, 49, 616–633. [Google Scholar] [CrossRef]
- European Environment Agency. Water Framework Directive (WFD) 2000/60/EC; European Environment Agency: Copenhagen, Denmark, 2000.
- Brkić, Ž.; Biondić, R.; Kapelj, J.; Kapelj, S.; Marković, T. Karakterizacija Vodnih Cjelina na Crnomorskom Slivu u Okviru Implementacije Okvirne Direktive o Vodama EU (in Croatian); Technical Report; Croatian Geological Survey: Zagreb, Croatia, 2005. [Google Scholar]
- Biondić, R.; Pavičić, A.; Slišković, I.; Marković, T.; Terzić, J.; Dukarić, F.; Dolić, M. Određivanje Cjelina Podzemnih Voda na Jadranskom Slivu Prema Kriterijima Okvirne Direktive o Vodama EU (in Croatian); Technical Report; Croatian Geological Survey: Zagreb, Croatia, 2006. [Google Scholar]
- Biondić, B.; Biondić, R.; Kapelj, S. Karst groundwater protection in the Kupa River catchment area and sustainable development. Environ. Geol. 2006, 49, 828–839. [Google Scholar] [CrossRef]
- Biondić, R.; Rubinić, J.; Biondić, B.; Meaški, H.; Radišić, M. Definiranje Trendova i Ocjena Stanja Podzemnih Voda na Području krša u Hrvatskoj (in Croatian); Technical Report; Croatian Waters: Zagreb, Croatia, 2016. [Google Scholar]
- Croatian Geological Survey. Geological Map of the Republic of Croatia at the Scale 1:300,000; Croatian Geological Survey: Zagreb, Croatia, 1999. [Google Scholar]
- Jenkins, G.M.; Watts, D.G. Spectral Analysis and Its Applications; Holden-Day: San Francisco, CA, USA, 1968; p. 525. [Google Scholar]
- Box, G.E.P.; Jenkins, G.M.; Reinsel, G.C. Time Series Analysis: Forecasting and Control; John Wiley: Hoboken, NJ, USA, 2008; p. 746. [Google Scholar]
- Mangin, A. Contribution a l’etude hydrodynamique des aquifères karstiques. Ann. Speleol. 1975, 26, 283–339. [Google Scholar]
- Trauth, M. MATLAB® Recipes for Earth Sciences; Springer: Berlin/Heidelberg, Germany, 2015. [Google Scholar]
- Blackman, R.B.; Tukey, J.W. The measurement of power spectra from the point of view of communications engineering—Part I. Bell Syst. Tech. J. 1958, 37, 185–282. [Google Scholar] [CrossRef]
- Mangin, A. Pour une meilleure connaissance des systèmes hydrologiques à partir des analyses corrélatoire et spectrale. J. Hydrol. 1984, 67, 25–43. [Google Scholar] [CrossRef]
Figure 1.
Study area located in the mountainous area of the northern part of the Dinaric karst of Croatia.
Figure 1.
Study area located in the mountainous area of the northern part of the Dinaric karst of Croatia.

Figure 2.
Schematic permeability map of research area and characteristic cross-sections (according to [50,51]).

Figure 3.
Monthly mean precipitation and monthly mean temperature at meteorological stations Parg and Ogulin in the period 1949–2017.
Figure 3.
Monthly mean precipitation and monthly mean temperature at meteorological stations Parg and Ogulin in the period 1949–2017.

Figure 4.
The autocorrelation function obtained for studied hydrological stations for the two analyzed periods.
Figure 4.
The autocorrelation function obtained for studied hydrological stations for the two analyzed periods.

Figure 5.
The cross-correlation function obtained for studied hydrological and meteorological stations for the two analyzed periods.
Figure 5.
The cross-correlation function obtained for studied hydrological and meteorological stations for the two analyzed periods.

Figure 6.
The power spectrum obtained for the studied hydrological stations for the two analyzed periods.
Figure 6.
The power spectrum obtained for the studied hydrological stations for the two analyzed periods.

Figure 7.
The coherence function obtained for studied hydrological and meteorological stations for the two analyzed periods.
Figure 7.
The coherence function obtained for studied hydrological and meteorological stations for the two analyzed periods.

Figure 8.
The gain function obtained for the studied hydrological and meteorological stations for the two analyzed periods.
Figure 8.
The gain function obtained for the studied hydrological and meteorological stations for the two analyzed periods.

Figure 9.
The phase function obtained for the studied hydrological and meteorological stations for the two analyzed periods.
Figure 9.
The phase function obtained for the studied hydrological and meteorological stations for the two analyzed periods.


Table 1.
Catchment size, the average values of maximum flows , mean daily flows Q and minimum flows in the 1986–1994 and the 2001–2009 period.
Table 1.
Catchment size, the average values of maximum flows , mean daily flows Q and minimum flows in the 1986–1994 and the 2001–2009 period.
| Period | 1986–1994 | 2001–2009 | |||||
|---|---|---|---|---|---|---|---|
| Station | Catchment Size | QM | Q | Qm | QM | Q | Qm |
| (km) | (m/s) | ||||||
| Kupari | 205 | 126 | 12.2 | 0.524 | 139 | 12.9 | 0.311 |
| Smrečje | 13.5 | 18.9 | 0.514 | 0.003 | 9.96 | 0.428 | 0 |
| Kupica Spring | 98.0 | 40.1 | 5.06 | 0.051 | 48.0 | 5.60 | 0.200 |
| Brestovac | 89.0 | 31.3 | 2.95 | 0.121 | 34.9 | 3.39 | 0.245 |
Table 2.
Elevation of meteorological stations Parg and Ogulin, the average values of daily precipitation P, maximum daily precipitation and mean annual rainy days ( mm) in the 1986–1994 and the 2001–2009 period.
Table 2.
Elevation of meteorological stations Parg and Ogulin, the average values of daily precipitation P, maximum daily precipitation and mean annual rainy days ( mm) in the 1986–1994 and the 2001–2009 period.
| Period | 1986–1994 | 2001–2009 | |||||
|---|---|---|---|---|---|---|---|
| Station | Elevation | P | PM | Rainy Days | P | PM | Rainy Days |
| (m a.s.l.) | (mm) | (mm) | |||||
| Parg | 863 | 4.83 | 138 | 141 | 4.80 | 132 | 154 |
| Ogulin | 328 | 3.88 | 111 | 159 | 4.25 | 86 | 164 |
© 2019 by the authors. Licensee MDPI, Basel, Switzerland. This article is an open access article distributed under the terms and conditions of the Creative Commons Attribution (CC BY) license (http://creativecommons.org/licenses/by/4.0/).
Share and Cite
MDPI and ACS Style
Pavlić, K.; Parlov, J. Cross-Correlation and Cross-Spectral Analysis of the Hydrographs in the Northern Part of the Dinaric Karst of Croatia. Geosciences 2019, 9, 86. https://doi.org/10.3390/geosciences9020086
AMA Style
Pavlić K, Parlov J. Cross-Correlation and Cross-Spectral Analysis of the Hydrographs in the Northern Part of the Dinaric Karst of Croatia. Geosciences. 2019; 9(2):86. https://doi.org/10.3390/geosciences9020086
Chicago/Turabian StylePavlić, Krešimir, and Jelena Parlov. 2019. "Cross-Correlation and Cross-Spectral Analysis of the Hydrographs in the Northern Part of the Dinaric Karst of Croatia" Geosciences 9, no. 2: 86. https://doi.org/10.3390/geosciences9020086
Note that from the first issue of 2016, this journal uses article numbers instead of page numbers. See further details here.