Article

Evaporite Dissolution Rate through an on-site Experiment into Piezometric Tubes Applied to the Real Case-Study of Quinis (NE Italy)

1
Mathematics and Geosciences Department (DMG), University of Trieste, Via Weiss 2, 34128 Trieste, Italy
2
Department of Earth Sciences, University of Pisa, Via S. Maria, 53, 56126 Pisa, Italy
*
Author to whom correspondence should be addressed.
Geosciences 2019, 9(7), 298; https://doi.org/10.3390/geosciences9070298
Submission received: 23 April 2019 / Revised: 23 June 2019 / Accepted: 4 July 2019 / Published: 8 July 2019

Abstract

:
The present paper deals with a field experiments on evaporite rock samples and groundwater investigations in the Quinis test site, a hamlet of the Enemonzo municipality in NE Italy, were sinkholes occurred in the past and are still occurring causing severe damage to the existing infrastructures. The area is characterised by a Carnian evaporitic bedrock made of gypsum and anhydrite mantled by alluvial and colluvial deposits. In order to evaluate the loss of weight and volume of the subcropping evaporites as responsible for sinkholes, a field-experiment was carried out. Inside seven piezometers, at different depths, evaporitic rock samples were exposed to the naturally occurring variable climatic conditions such as degree of humidity, different air flow and hydrodynamic. The rock samples were installed at the beginning of April 2017 in the dry sections of piezometric tubes, in the vadose zone and in the phreatic zone. Data related to water level fluctuations were recorded by using data-logger devices and highlight significant changes in the water table. After 13 months of data recording (May 2018), rock samples were removed, reweighted and the volume loss measured. In addition, water from piezometer-experiment, representative of the groundwater circulation, were collected at different depths. The obtained results indicate that rock sample reduction is dependent on the hydrological regime and water chemistry and not on the number of days during which the samples remained submersed. In particular, the water geochemistry highlights the possible role in gypsum/anhydrite dissolution due to NaCl water admixing in a complex scenario. In additional, the geochemical data highlight the occurrence of some potentially toxic elements (As, Fe, Mn) at concentrations of concern in some water. This approach represents a novel contribution in the study of karst hazard in evaporites adding a tile to the knowledge of the fast evolutionary processes which cause sinkhole formation.

1. Introduction

The role of evaporites in the genesis and evolution of sinkholes is established, including the role of meteoric and/or groundwater which interacts with evaporitic rocks. Evaporites reacting with flowing water dissolve creating voids which in turn destabilize the mantling deposits giving rise to closed depressed areas [1,2,3,4,5,6,7,8,9,10,11,12,13,14,15]. The high solubility of evaporite minerals (0.4 mm/yr and 1.0 mm/yr [16] compared for example with limestone (0.009–0.14 mm/yr [17]) favours the development of unstable voids that may be extremely dangerous due to the severe damages that they can cause on man-made structures [2,3,11,18,19,20,21,22,23,24,25,26]. Among evaporites, gypsum-bearing rocks represent the most widespread deposits along with anhydrite [27,28,29]. Gypsum outcrops are exposed in almost all Italian regions, despite they represent less than 1% of the total national territory [30]. Gypsum, when not weathered, has an extremely dense structure and low porosity and permeability [31,32], but in general it is extremely karstifiable with a relatively high solubility rate in aqueous solutions and a low mechanical strength [2,9,16,17,18,33,34,35,36,37].
The genetic classifications available in the literature describe the mechanisms of sinkhole occurrence by differentiating collapses from saggings and from suffosions depending on the involved material [1,2,3,4,38]. However, only few Authors (e.g., [16,17]) dealt with the kinetics of evaporites dissolution in controlled conditions also by fixing stone-tablet of different materials in caves, obtaining information about their dissolution rate [39,40,41,42,43,44,45,46,47,48], or leaving outdoor rock samples in order to evaluate their weathering over time [40]. Indeed, the weathering into piezometric tubes and the related effects on solute chemistry have never been investigated.
In the present study, a direct experiment on evaporite weight loss was carried out focused on the test site in the Tagliamento River basin (Figure 1), in the northern part of the Friuli Venezia Giulia Region (FVGR, Italy). In particular, core rock evaporitic samples, drawn from the drilled boreholes at the Quinis village (Enemonzo Municipality), were placed into seven piezometers (PZ3, PZ7, PZ8, PZ16, PZ22, PZ23, PZ25), at different depths, for more than one year (from April 2017 to June 2018) in order to determine the weight loss as well as the volume loss. The aim of the experiment was to quantify the dissolution rate of the evaporite rock samples in order to get information on the karstified bedrock dissolution and the consequent sinkhole evolution which cause severe damage to houses and infrastructures.

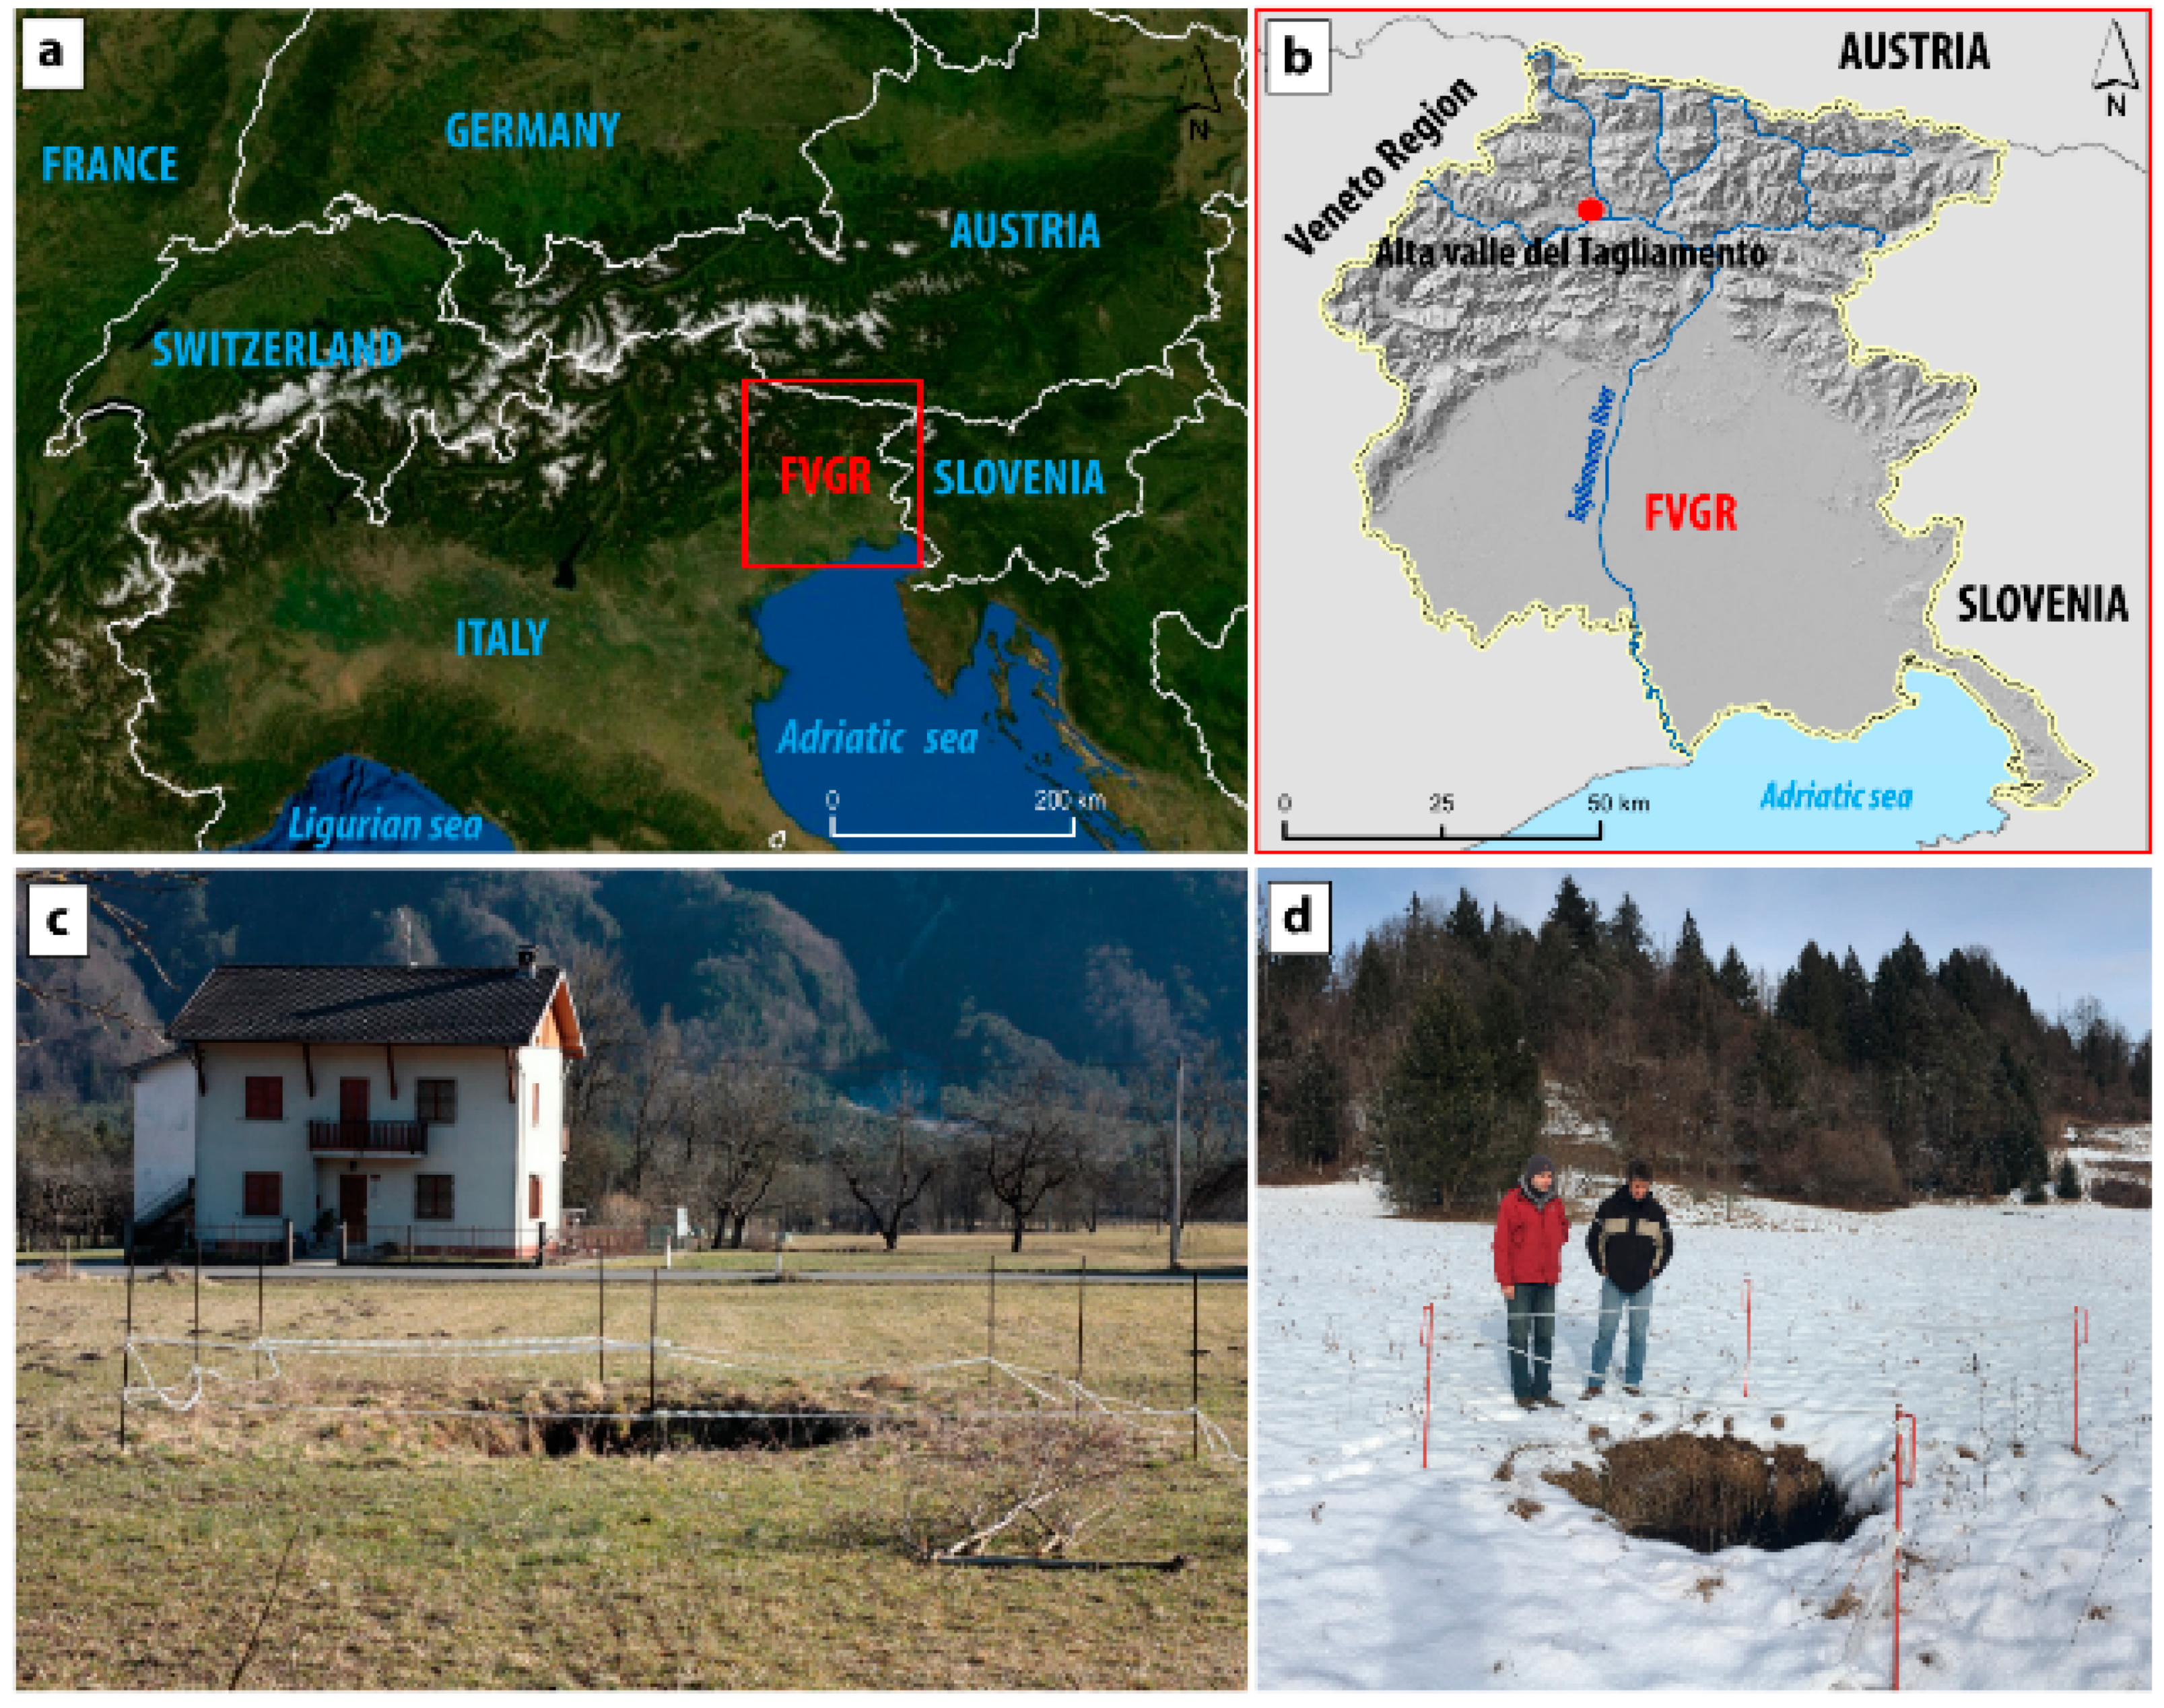
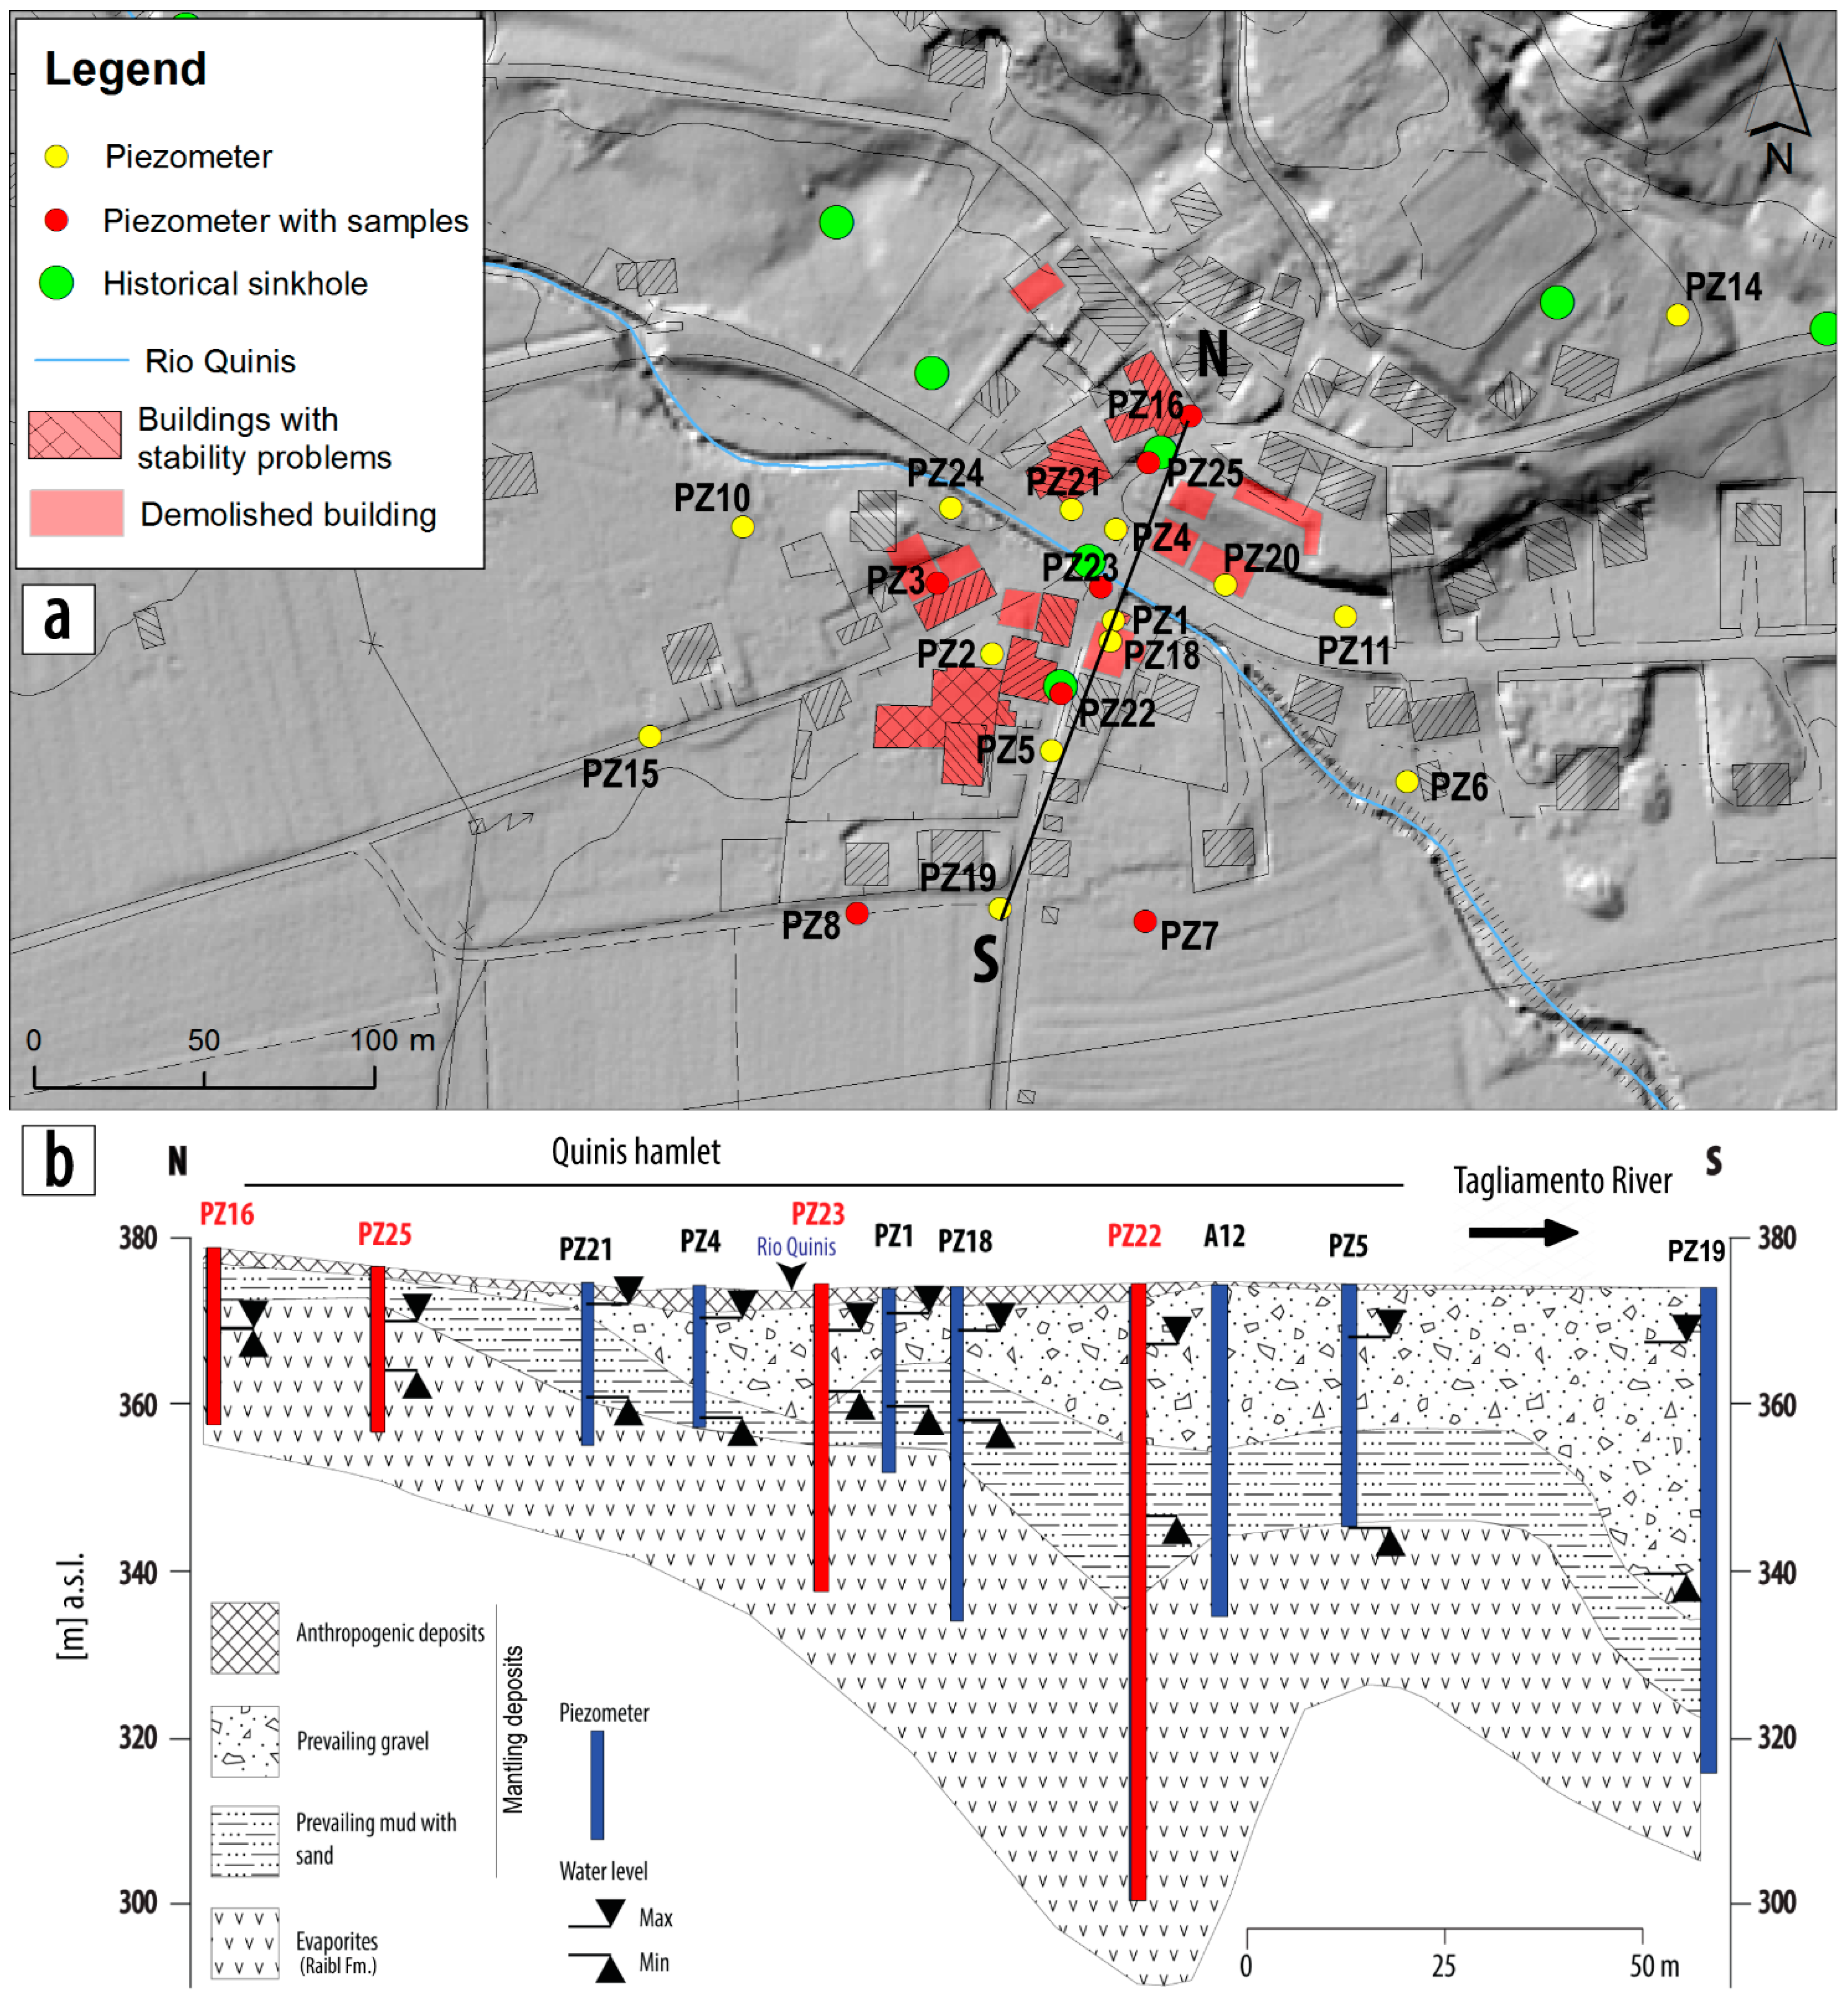
2. Study Area Characterization: Structural, Geological, Geomorphological and Hydrogeological Settings

The study area corresponds to the small village of Quinis, located along the Alta Valle del Tagliamento valley, in the northwestern sector of the Friuli Venezia Giulia Region (FVGR, NE Italy) (Figure 1). It is placed on alluvial fan deposits that prograde over the fluvial terraces of the Tagliamento River. The area, for its peculiarities, is a representative example of the complex regional geological situation where evaporites are involved, being typical of the main northeastern Italian E-W oriented valleys (Figure 2).
In the area, the genesis and evolution of sinkholes is strongly guided by geological and structural features [49]. Indeed, the Tagliamento River valley, is conditioned by a series of tectonic lineaments having a regional character with a prevailing E-W direction related to the Alpine tectonics. Evaporite layers present in the valley floors act as lubricated thrust horizons or décollement during deformation, allowing the detachment of the Permian or Permo–Triassic carbonatic units from the overlying Triassic–Jurassic to occur [50,51,52].
The Quinis village is placed on a plain area (Piana di Enemonzo), which hosts aquifers. As evidenced by boreholes and geophysical data [11], the Quaternary deposits consist of glacial till, alluvial and colluvial deposits. The deposits are extremely heterogeneous due to complex and articulated depositional patterns and have a variable thickness which varies from few meters in the northern part of the study area, up to more than 40 m moving south towards the Tagliamento riverbed. The diversity in the material has a different permeability in the different horizons: the alluvial deposits and consists of highly permeable polygenic gravels which include lenticular intercalations of less pervious clay and clayey–silt. Although the gravels are locally cemented, the geotechnical characteristics of the whole deposits are quite poor, with a high vertical and horizontal variability of the bearing capacity. The presence of clayey and clayey–silt layers generates local perched aquifers having poor connections with groundwaters mainly hosted in the karstified evaporitic bedrock, suggesting the presence of unconfined and sometimes semi-confined aquifer [11]. The presence of different aquifer systems and the large fluctuations in the water tables linked to the seasonality (between 6 and 32 m), are likely the driving force of the sinkhole formation in the area.
The climatic data recorded at the Enemonzo rain gauge station for the period 1995–2013 highlight a mean annual rainfall value not exceeding 2,500 mm. Rainfalls are abundant during autumn and springtime meanwhile during January and February they do not exceed a mean maximum value of 100 mm [53].
Since the end of the 19th century, when the first evidence of sinkholes was reported [54,55], an increase in the occurrence of this type of phenomena was recorded: only in the Enemonzo’s Municipality (about 24 km2), more than 200 sinkholes were documented since the end of the 1800s. The most part of them have no more morphological evidence, and some of them represent recurrent phenomena, which, sometimes, are in turn refilled by local farmers (an example is given by the sinkhole in Figure 1c). The diameter of the sinkhole’s population ranges between 1 m and 45 m, with an average value of 8 m. The depth ranges from 0.5 m up to 15 m (average value of 2.4 m [49]).
Sinkholes are essentially of two types, and according to Gutiérrez et al. [4], they can be classified as cover collapse and cover suffosion sinkholes. The latter prevalently occur where the bedrock is present at shallower depths (2–30 m b.g.l.), while the cover collapses occurred more frequently where the bedrock can be identified at more than 30 m below ground level (b.g.l.) and where there can be an increasing influence of the waters from the nearby Tagliamento River.
From a lithological viewpoint, in the FVGR, two main evaporitic events were recognized, one occurred during Permian, the other during Late Carnian [49]. The related outcrops are not always identifiable, being mostly mantled by alluvial and colluvial deposits. In the study area, the unit containing evaporites is represented by the Raibl Formation (Upper Carnian), mainly covered by fluvial and deltaic conglomerates, glacial tills Pleistocene in age and fluvial Holocene gravel and sand, clastic debris and/or alluvial fans.
According to the lithological characteristics and thickness, Raibl Fm. is divided into three members (Figure 2 and Figure 3).
The Membro a peliti rosse (Red shales Member) is characterized by red shales and silt stones (Figure 2 and Figure 3a) typical of a fluvial environment close to the coast. During the Carnian, a transgression phase transformed the lowlands into lagoons. This is the environment in which the Membro a gessi e dolomie grigie (Gypsum and grey dolostones Member) formed. It includes grey and white saccharoidal gypsum with marl impurities at the top, yellowish dolomitic marls, to a lesser extent, blackish or greenish clays and dark limestone in thin layers (Figure 2, Figure 3b,c). The tectonical history crushed and thickened it up to a thickness of 600 m [50]. At the bottom of the member, marly-dolostones and clayey terms prevail. In the outcropping gypsum in the surroundings of the study area karst phenomena were observed with also the presence of caves (Figure 2 and Figure 3d), some of them with flowing waters.
The Membro a dolomie e marne (Marls and dolostones Member), characterized by grey dolostones often vacuolar and cataclastic, marls and multicolor clays close the depositional sequence.
In the Quinis area, the evaporitic bedrock do not outcrops, but it is mantled by Quaternary deposits which are schematized in Figure 4 where the legend point them out as prevailing gravel and prevailing mud with sand.
The stratigraphic columns analysed for the field experiment highlight the presence of a coarse gravelly deposit mantling a muddy layer lied just above the evaporitic bedrock, probably being the weathered part of it. Both layers are not continuous laterally with important vertical and horizontal heterogeneities.

3. Materials and Methods: Description of the Field Experiment

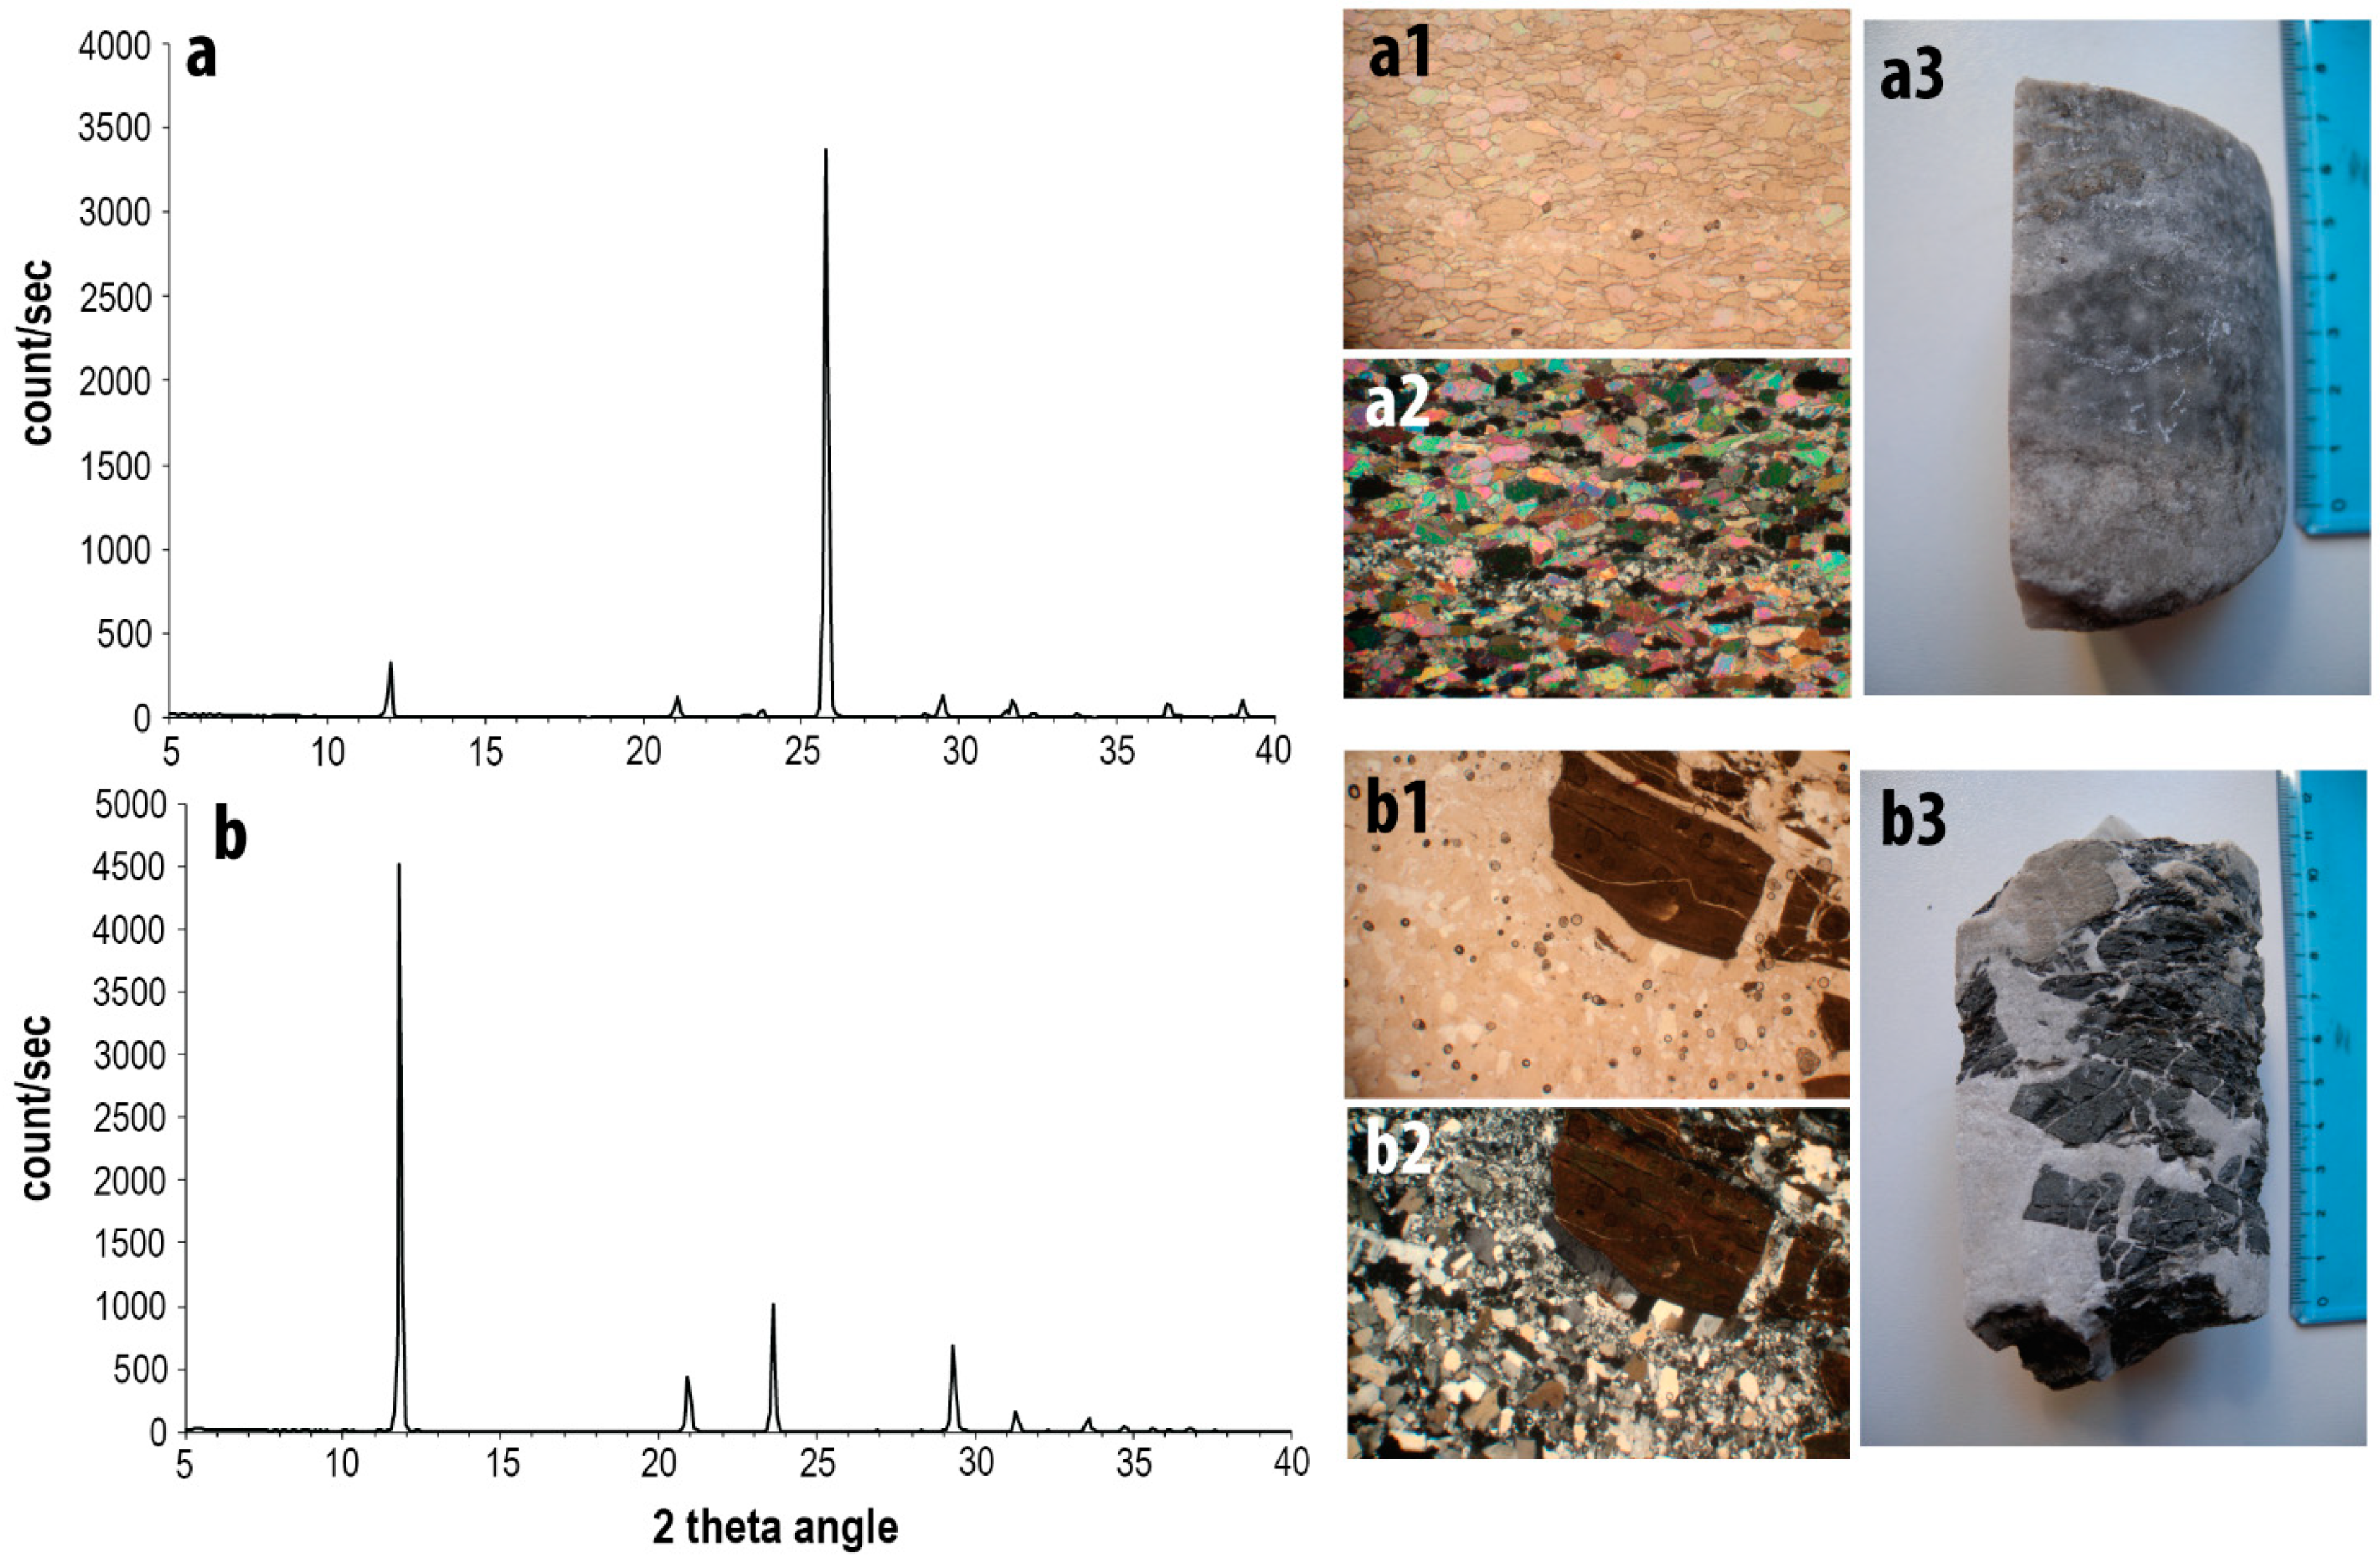
3.1. Evaporite-Rock Samples

Different methodological approaches have been used in the study area in order to investigate the solution process and its rate. In seven selected piezometers, 42 evaporite rock samples were placed as follow (Figure 4 and Figure 5): in each piezometer, 1 sample was placed at about 2 m below the ground level, in the vadose zone never reached by the groundwater; 1 or 2 samples (according to the depth of the piezometer) were placed in the vadose zone; 1 or 2 samples (according to the depth of the piezometer) were installed in the phreatic zone.
The choice of the samples positioning has been realized in order to investigate the different conditions in which the rock masses can state: some samples in the phreatic zone, some in the epiphreatic zone with meaningful water exchanges (samples in correspondence of screens). Samples in the epiphreatic zone with less exchanges (no screens). Samples in the vadose zone interested by air movement caused by the water table fluctuations.
Evaporite rock samples represent segments of drilled cores collected in the study area when boreholes were drilled. A portion from each drilled core was placed into the piezometer corresponding to the original borehole, with the deeper one possibly at the same depth of sampling. The shallower ones have been placed in correspondence to the Quaternary deposit. Before installation, the samples were oven-dried at 50 °C for 24 h. After being dried, samples were weighted, their surface geometrically measured as well as their density. Each rock sample was stored in a single small plastic net and firmly anchored within the piezometer at the chosen depth. The field experiment was carried out from 3 April 2017 up to 15 May 2018. After the experimental period, rock samples were taken, oven dried for 24 h at 50 °C and weighted.

3.2. Mineralogical Analyses

The different rock samples installed in the piezometers were analysed and attributed to two types present in the area. Small powdered samples, representative of the two chosen types, collected from the cores of boreholes PZ3 and PZ22 have been analysed by XRD at the DMG-UNITS (Department of Mathematics and Geosciences of the Trieste University) using a STOE D 500 X-ray diffractometer at room temperature. PZ3 was collected at depth ranging between 3.55 and 3.64 m below ground level (b.g.l.), while sample PZ22 was collected at depths ranging between 42.17 and 42.23 m b.g.l.
CuKα radiation was used through a flat graphite crystal monochromator. The current used was 20 mA and the voltage was set at 40 kV. The 2θ scanning angle ranged from 2 to 60°, with 0.01° steps and a counting time of 2 s/step.

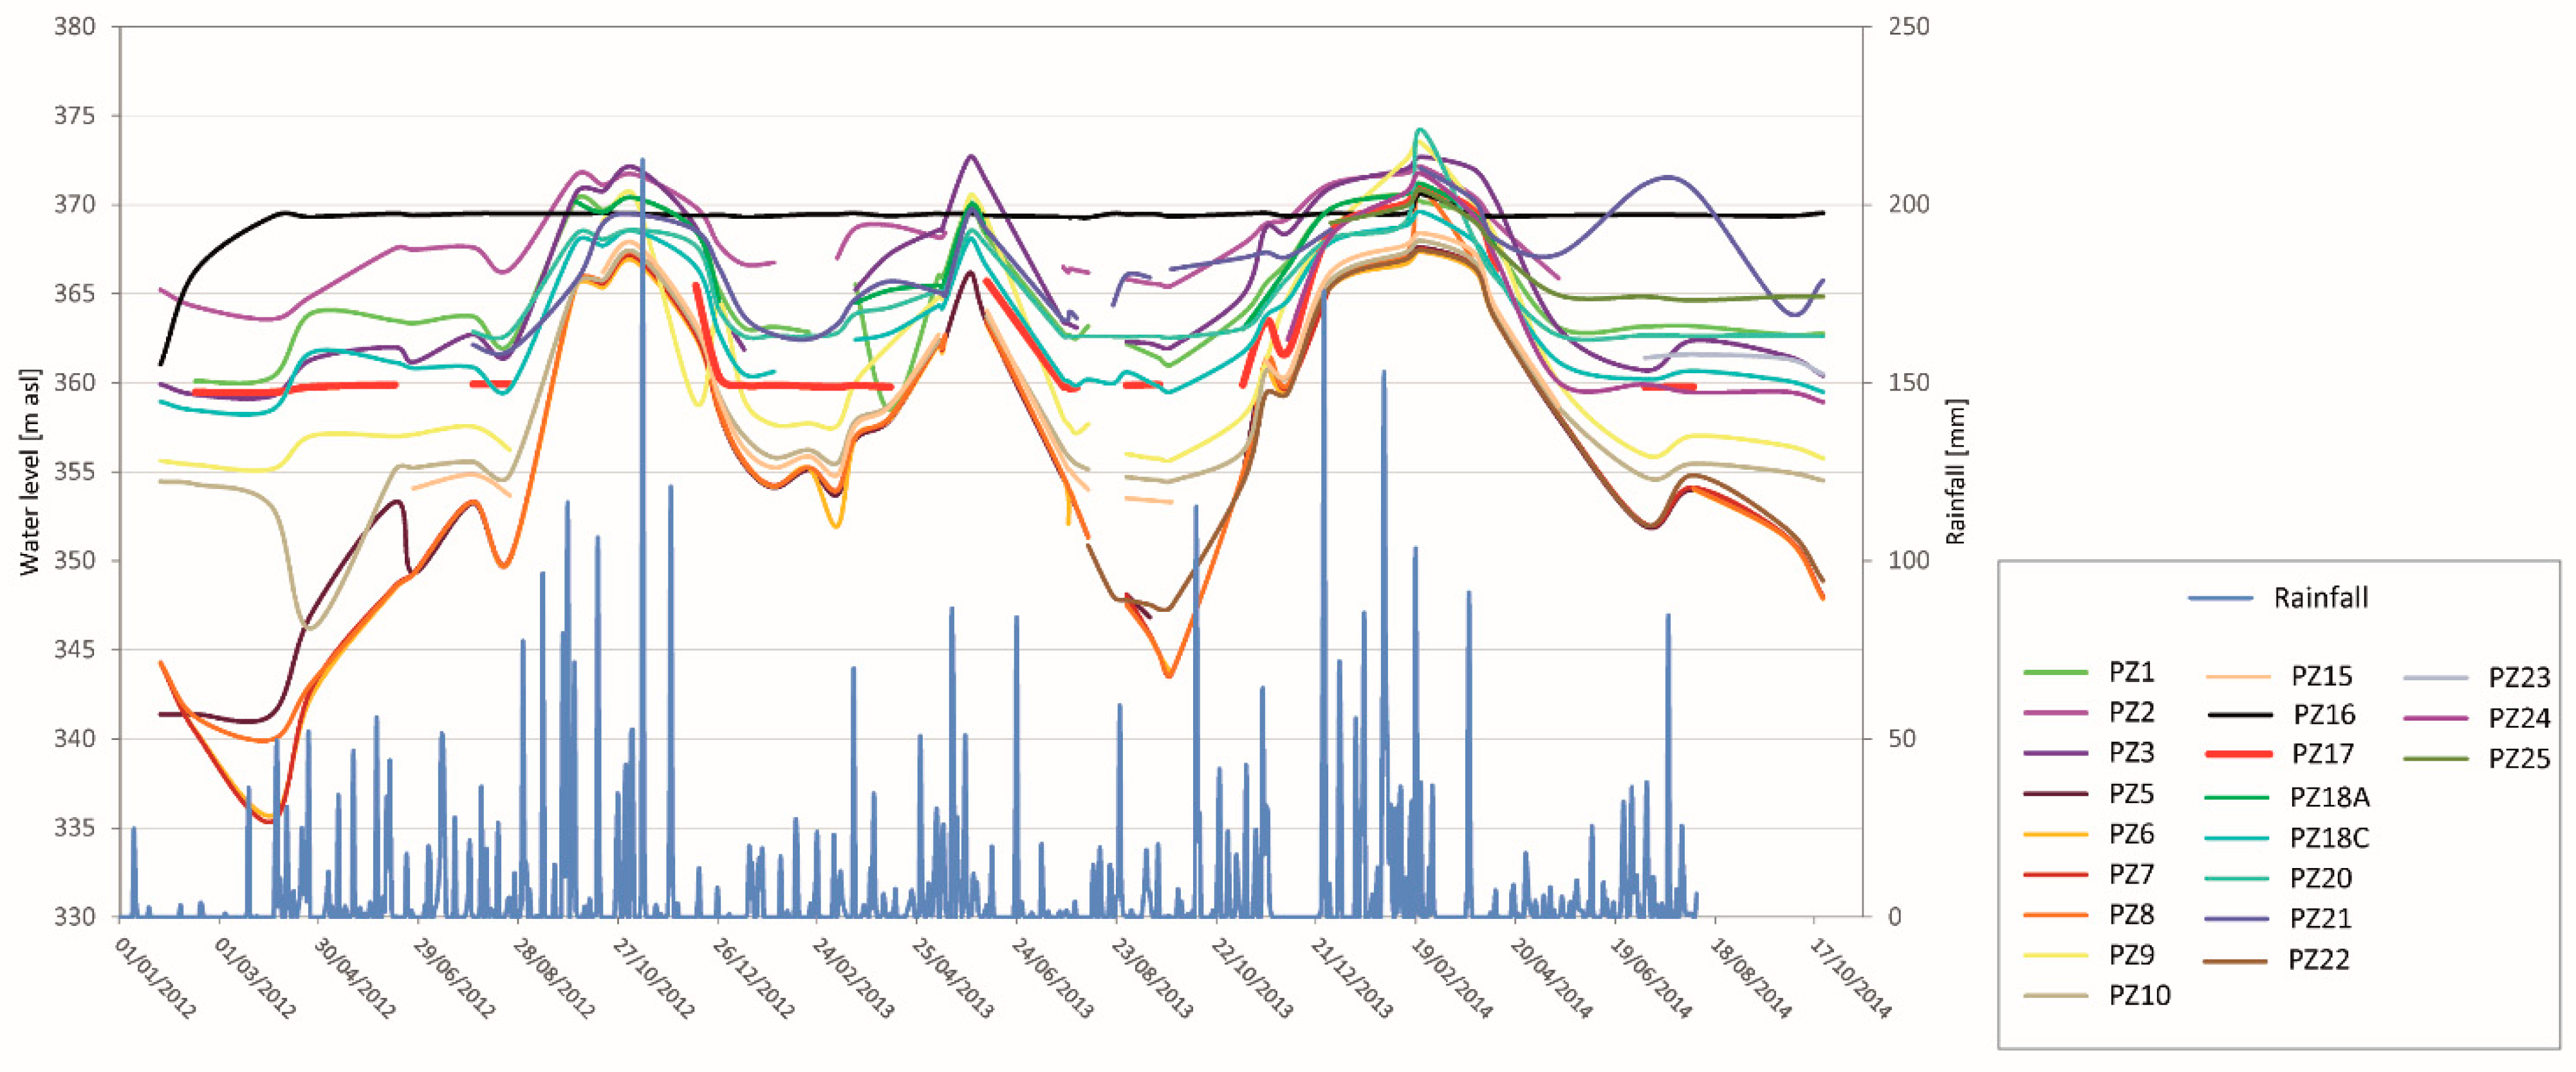
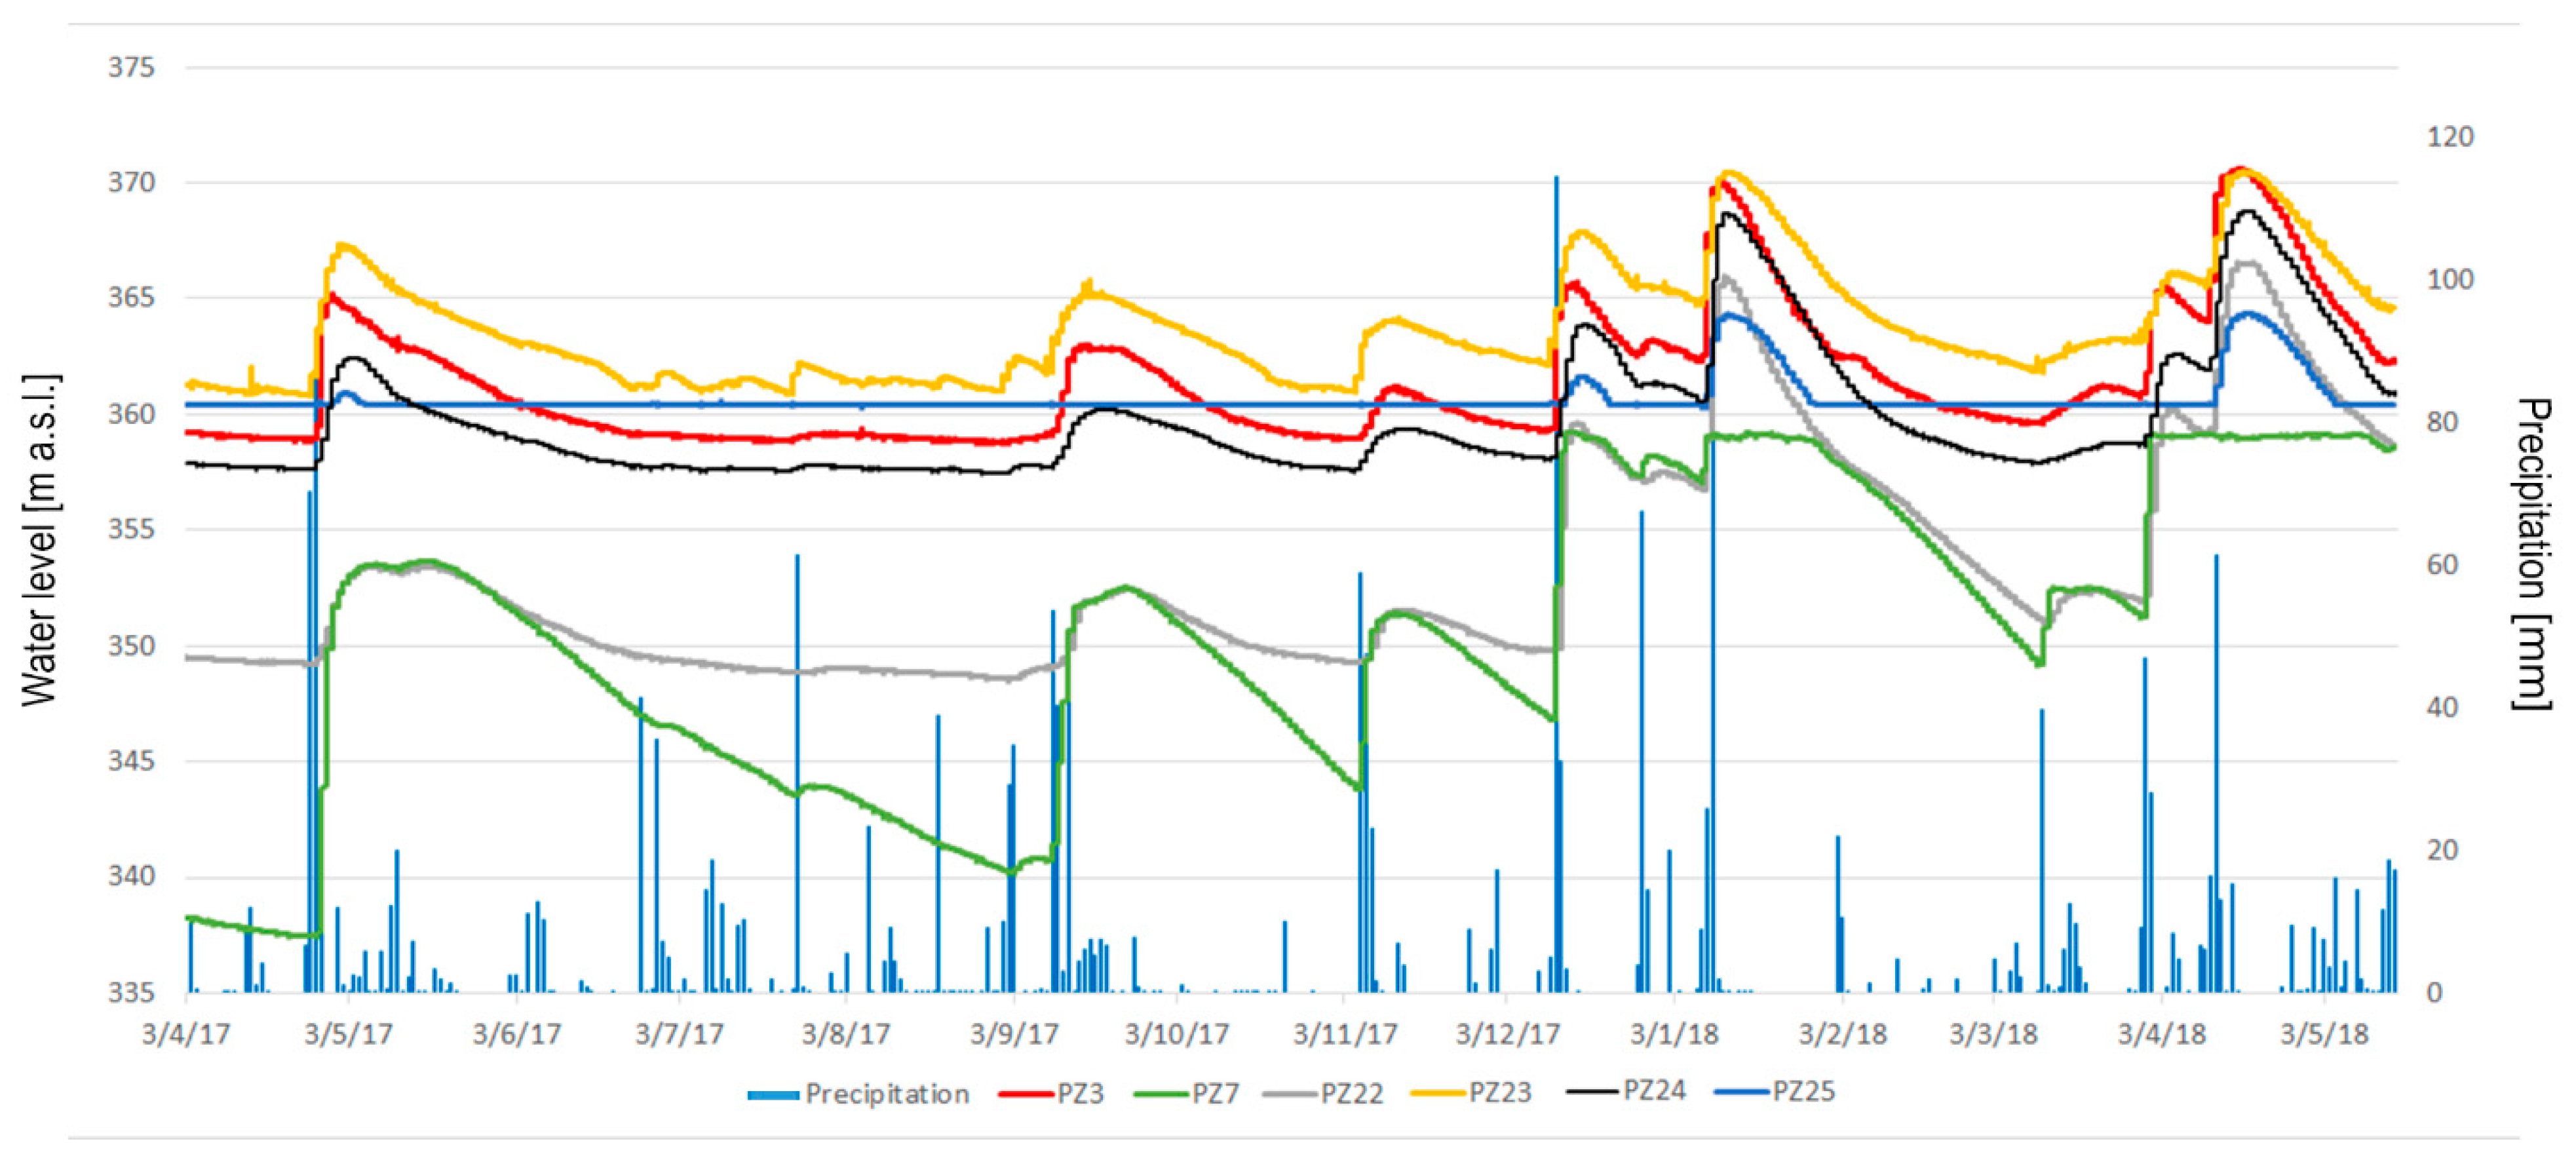
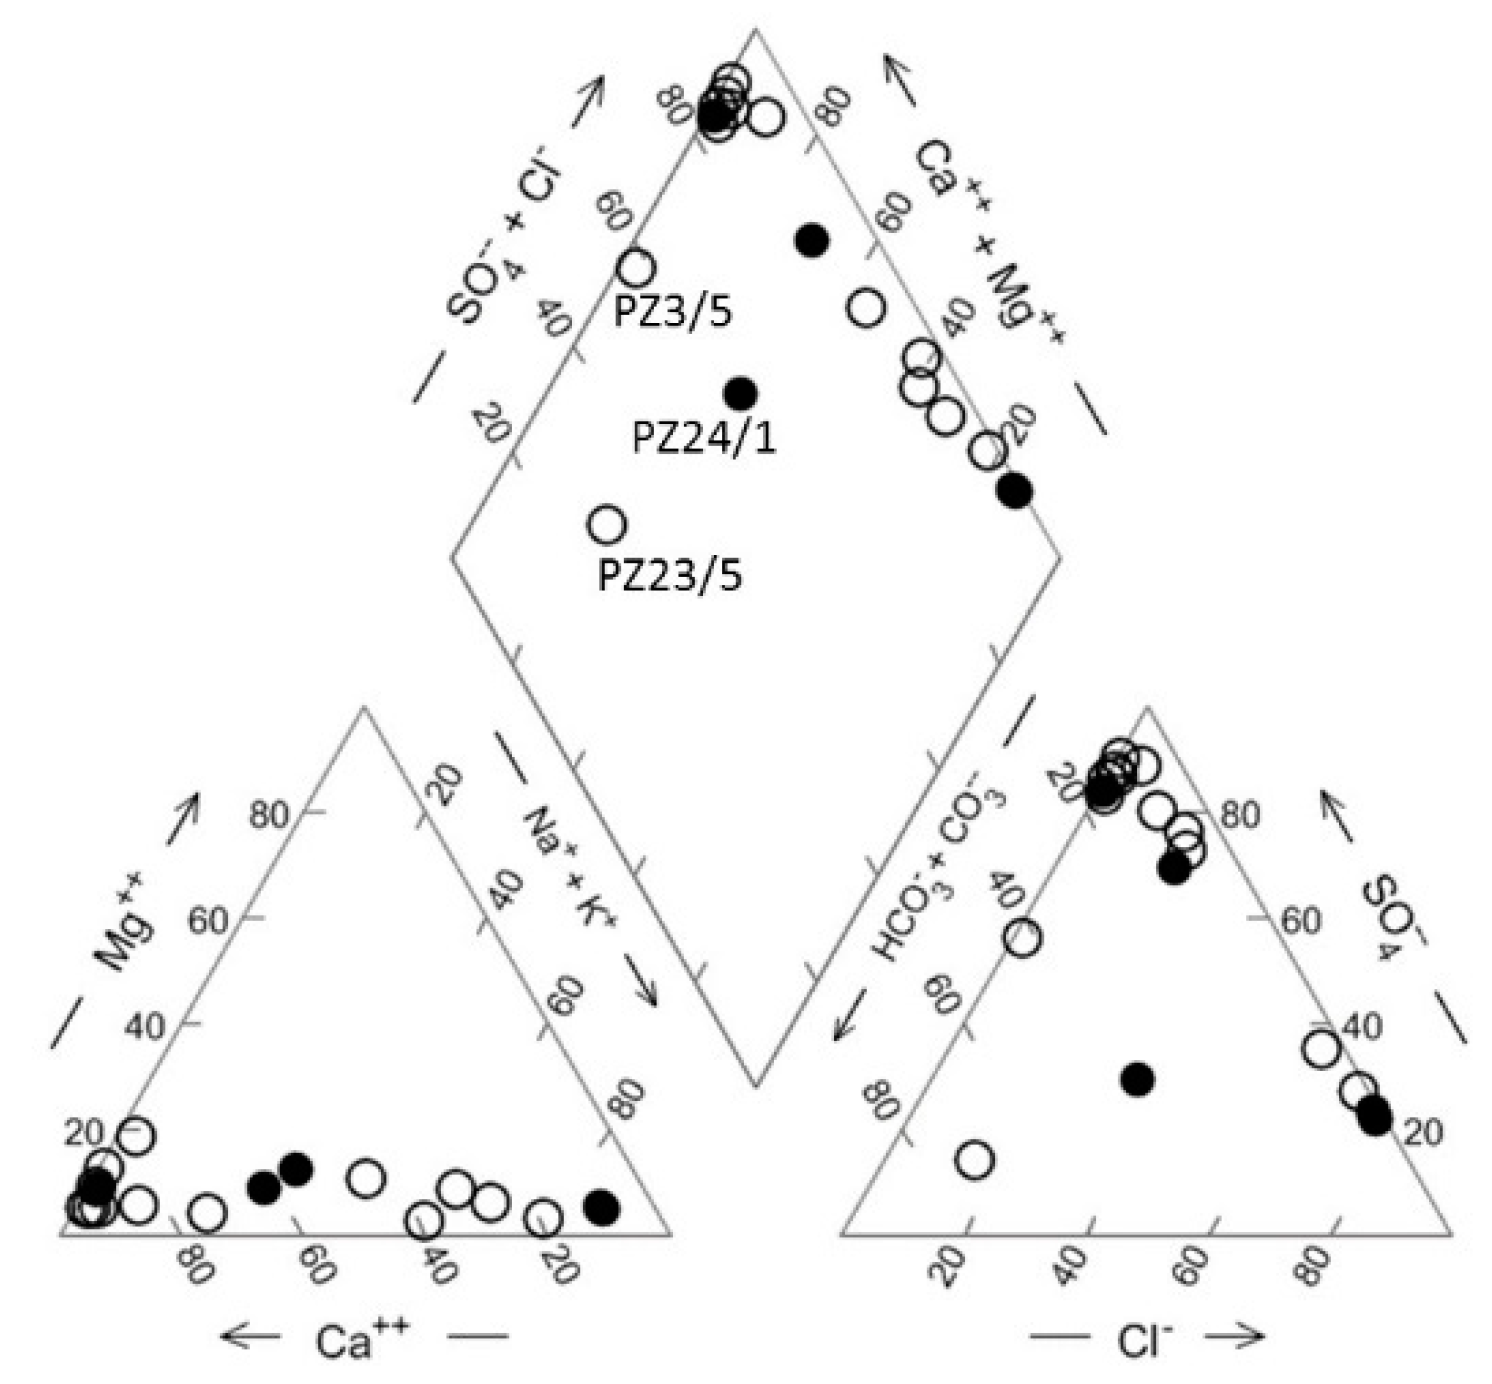
3.3. Hydrogeological Investigations: Data-Logger Measurements and Geochemical Analyses

The importance of groundwater fluctuations required the installation of data logger devices able to record in continuous water level (WL), temperature (T) and electrical conductivity (EC) variations. Six dedicated data loggers were installed in selected piezometers in which rock samples were placed. Data loggers were installed in the period between 3 April 2017 and 15 May 2018.
Four data-loggers WLT-Diver Eijekelkamp (pressure range 10 m, accuracy +/− 0.5 cm, resolution 0.2 cm; temperature range −20 °C to +80 °C, accuracy +/− 0.1 °C, resolution 0.01 °C) were installed in PZ3, PZ7, PZ22, and PZ23, respectively; two CTD-Diver Eijekelkamp (pressure range 10 m, accuracy +/− 0.5 cm, resolution 0.2 cm; temperature range −20 °C to +80 °C, accuracy +/− 0.1 °C, resolution 0.01 °C, EC range 0 to 120 mS/cm, accuracy +/− 1%, resolution +/− 0.1%) were installed in PZ24 and PZ25 piezometers (Figure 4). The compensation of the atmospheric pressure variability was ensured by a Baro-Diver from Eijekelkamp (pressure range 150 cm, accuracy +/− 0.5 cm, resolution 0.1 cm) installed in the PZ23, in the core of the study area. All instruments are synchronized and had a recording range interval of 30 minutes.
Rock samples were installed in PZ8 and PZ16, but no diver was present in those piezometers. Data from previous studies [11,53] (Figure 6) suggested that water level and fluctuations occurring in PZ8 are superimposable to the ones of PZ7 and for this reason only PZ7 was chosen for the diver installation. Having PZ16 a very stable behaviour of the water level (Figure 6), no diver was installed there.
A groundwaters sampling survey was carried out on 22 August 2018. Water samples were collected at different depths in correspondence of the rock samples position. Samples were collected using a bailer reaching the required sampling depth, starting from the shallower and moving to the depths. In addition, waters were collected from the two monitored piezometers PZ10 and PZ24, in order to better characterize the groundwaters of the area.
At the sampling sites, water samples were filtered using a 0.45 μm nylon filter and stored in clean high-density polyethylene bottles pre-rinsed with the sample water. Temperature (T, °C), pH, electrical conductivity (EC, mS/cm at 25 °C and corresponding Total Dissolved Solid, TDS) and Eh (V, after ORP correction using a Zobell solution) were measured in the field. Alkalinity (totally attributed to HCO3) was measured by titration using 0.1 N HCl. Major ions were measured in filtered samples, preserved using ultrapure HNO3 for cations, by ion chromatography using a Thermo Fisher ICS 900 instrument. The ion balance between major anions and cations was within 8%. Trace elements were measured on filtered samples stabilized by ultrapure HNO3, using a Perkin Elmer NexIon 300X ICP-MS instrument and 103Rh and 209Bi as internal standards. Deviations, in ten-repeated analysis, from the certified values of NIST SRM 1640a were lower than 10%, except for Li, Fe and Cu (10–14%). Precision was better than 5% RSD, except for Li, Mn, Fe, Cu and Ba (5–10% RSD). Certified standard solutions, high purity reagents and ultrapure Milli-Q water (Millipore, 18.2 MΩ/cm) were used for analyses and sample preparation. Detection limits were calculated as the mean value of the blank solution concentration (ten replicates) plus three times the standard deviation.
Speciation calculations giving the aqueous species and mineral saturation states were performed using the Geochemist’s Workbench® software.

4. Results and Discussion

As stated, at the end of the experiment, evaporite samples from drillholes were recovered and analysed. All of them were reweighted and the results are presented on Table 1.
According to [47], in order to compare the obtained results with what available on literature, the following formula has been applied:
R = [(W1−W2)/Aρ]104
where R is the dissolution rate given in μm/yr; (W1−W2) is the loss of weight within 1 year in g; A is the area of the soluble surface in cm2; ρ is the density in g/cm3. The unit μm/yr is most common for experiments like this for the here proposed experiment it has been used as unit mm/yr, easier to be compared with the results available in literature.
The loss of weight for some of the samples in the vadose zone is very important with peaks reaching values up to 8.1 mm/yr for sample PZ8/4. Values are very important, not only in absolute terms, but especially if compared with what is available in literature. The high solubility of evaporite minerals (0.4 mm/yr and 1.0 mm/yr) [16], already high if compared to limestones, within our field experiment, is in the range of 0.0–8.1 mm/yr with an average value of 2.1 mm/yr, double the known maximum value. Impressive results obtained on evaporite rock samples characteristic of the study area, imply quick developments of the stability in the area. Fractures and conduits present in an already mature karst can evolve, enlarging and increasing their size and rapidly affecting the mantling deposits forming new sinkholes or simply reactivating old known phenomena with stability consequences on the infrastructures.
The mineralogical analyses realised on the two type of rock evaporite samples installed in the piezometers for the dissolution experiment show the presence of anhydrite (PZ22) and gypsum (PZ3), as shown in Figure 7. In addition, clay minerals occurring as black inclusions were also detected in the sample placed in PZ3.
In thin section, anhydrite crystals show a mosaic texture with elongated subparallel crystals. No carbonates or organic matter is preserved within the grains. Gypsum crystals recall the alabastrine gypsum texture, usually formed by replacement of anhydrite, consisting of small to large interlocking crystals.
In the anhydrite sample (PZ22), both thin section and XRD analyses show the presence of no clays. The PZ23 sample is quite heterogeneous; in fact, the XRD analyses shows no presence of clays while they are present in thin section. In thin section it is possible to see some claystone chips.
If the mineralogical analyses allowed to describe the nature of the samples, the hydrogeological investigations permitted to understand the behaviour of the rock samples with respect to the water table fluctuations. Most samples placed above the water table show a small decrease in their weight, between 0.0% and 1.17%. However, samples PZ3/1 and PZ23/1 deviate from the remaining samples showing a weight loss of 11.24% and 50.24%, respectively.
Samples placed in the vadose zone lost most of their weight and volume, in some cases up to 100%, as it occurred for PZ8/4 and PZ3/3.
Those samples which remained always in the phreatic zone, lost from a minimum of 0.0% (PZ16/4) up to 97.81% in PZ3/5. In general, evaporite fragments in PZ3 shows the highest weight loss.
It is, hence, clear that the differences in weight loss do not depend exclusively on the place in which samples were installed with respect to the water table (dry, vadose or phreatic zone), but they depend on the behaviour of the flowing waters in the piezometer in which they were placed, on the mineralogical characteristics of the samples and possibly on the saturation state with respect to Ca-sulphate mineral phases.
Indeed, the data obtained by the data-logger devices (Figure 8) show a fast response of the water table fluctuation to the amount of rainwater during precipitation events. However, it is worth to note that in some piezometers, the measured fluctuations are significantly higher than in others as found in PZ7 and PZ22 where the difference between the minimum and maximum levels reached 16 meters. In PZ25, instead, the data-logger installed recorded lower fluctuations which are in the range of 4 meters.
The fluctuations of the water table recorded in correspondence of PZ7 are markedly higher than in the rest of the study area and this might explain the higher dissolution on some of the collected rock samples from both the vadose and phreatic zones.
It is observed that the weight loss in the evaporite rock samples is not proportional to the number of days during which they remained immersed in water (Table 1), as demonstrated by a number of samples which remained submersed for the whole period of the experiment (PZ3/4, PZ3/5, PZ7/4, PZ7/5, PZ8/5, PZ8/6, PZ16/3, PZ16/4, PZ16/5, PZ22/5, PZ22/6, PZ22/7, PZ22/8, PZ23/5, PZ23/6, PZ23/7, PZ25/4 and PZ25/5,) showing a weight loss in the range 0.0% up to 97.8%. Furthermore, it is worth to note that, generally, smaller water table fluctuations in the vadose zone yield smaller weight losses (PZ16 and PZ25), while higher fluctuations (PZ7 and PZ8) give higher loss of weight. This suggests that the dissolution rate likely depends on water table variations, in particular during raining events (Figure 8).
A separate comment has to be done for PZ3 and PZ23. In PZ3, a waterfall is present (at 6.50 m b.g.l.) within the piezometer due to a local perched aquifer at shallow depth with respect to the evaporite-rock sample, which likely contributes to a faster leaching and dissolution of the rock sample placed within the vadose zone.
In PZ23, the question about the process responsible for the dissolution of the shallower rock sample, never submersed, remains open. The measured weight change cannot be attributed to air drying, even assuming a variable air relative humidity when water moves vertically in the piezometer. It might reflect the role of H2S gas released by water (as testified by the offensive rotten eggs smell and by the relatively high 20 ppmv hydrogen sulphide gas concentration measured in PZ23 in September 2013; see further on) plus oxygen, that may form a water film of adsorbed sulfuric acid quickly increasing the solubility of Ca-sulphate phases [56,57,58].
Analysing the dissolution rate, for the rock samples remained always in the air, they fall within the range 0.00–3.54 mm/yr; the samples remained in the vadose zone had instead a dissolution rate in the range 0.02–8.12 mm/yr, for the samples placed in the phreatic zone the dissolution rate ranges 0.00–6.79 mm/yr.
Considering only the samples placed in the epiphreatic zone, the higher dissolution rates can be observed for those samples placed in correspondence of the screens, where the water exchange is higher. For the samples placed in the air, at approximately 2 m b.g.l., the dissolution is very low except for the sample in PZ3 and in PZ23. The dissolution rate of the PZ3/1 is similar to the ones of PZ7/2 and PZ8/2 indicating possible condensation corrosion phenomena. Additional studies should be necessary to validate this hypothesis.
The measured physicochemical parameters in waters and the major ion chemistry are reported in Table 2. Trace element data are given in Table 3. Be, Ag, Sn, Cd, Th, and Tl were also measured and were below the detection limit in all the piezometers. The water temperature is in the relatively narrow range between 11.0 and 13.1 °C, hence without significant effects on the gypsum/anhydrite solubility [59,60]; no systematic temperature variations are observed between the different piezometers and at different depth in the same piezometer. Waters are characterized by pH ranging between 7.7 and 8.2; it has to be noted that the same range characterizes waters from piezometers with and without rock samples inside, as expected since evaporite dissolution occurs without CO2 involvement. The measured pH likely reflects equilibria inherited from a carbonate aquifer: in particular, the values are consistent with calcite–water reactions at different PCO2 in open-system conditions; indeed, the calculated log PCO2 on the basis of carbonate equilibria ranges from 10−3.1 to 10−2.0 atm. Waters are characterized by Eh values in the range between −0.15 V and +0.26 V. Even if Eh cannot be measured unambiguously in most natural waters [61], the obtained values indicate variably oxidizing and reducing environments exerting an important control on the concentration of SO42− and H2S/HS species in water. The electrical conductivity of waters collected on August 2018 varies in the wide range between 0.22 mS/cm to 52.3 mS/cm (TDS, in the range 166 mg/L to 36,660 mg/L), the highest salinity being measured in PZ24/2 and PZ24/3, in a piezometer not containing evaporitic-rock samples. Waters generally show a strong salinity stratification within each piezometer, with the low salinity giving lower density water overlying. These density gradients may drive groundwater to flow through the system (e.g., [62]). TDS and the SO42− content linearly correlate (Figure 9), supporting the hypothesis that Ca-sulphate phases dissolution is the dominant leaching processes in most waters. However, PZ24/2, PZ24/3, PZ16/4 and PZ22/8, the deepest waters from each piezometer, show a relative enrichment in TDS (Figure 9), suggesting ion release from additional dissolving mineral phases.
The dissolution of calcium sulphate phases is described by a dissociation reaction such as:
C a S O 4 · n H 2 O C a 2 + + S O 4 2 + n H 2 O
where n = 0, 0.2 and 2, the former and the latter corresponding to anhydrite and gypsum, respectively. Speciation calculations indicate that waters range from strongly undersaturated to near equilibrium with gypsum (gypsum saturation index in between −2.73 and −0.12, Table 2) indicating that there is no gypsum crystallization. It is observed that the most undersaturated waters (samples PZ3/5, PZ23/5, PZ24/1; gypsum saturation index: −1.18, −2.73, −1.27, respectively) show the lower TDS (Table 3), and that undersaturation occurs irrespective of the amount of weight loss of the evaporite rock specimen introduced within the piezometer (samples PZ3/5 and PZ23/5; % weight loss: 97.8 and 59.2 respectively; Table 1). This suggests that in part of the stratified sedimentary aquifer, the recharge of water not interacting with evaporite prevails.
Most of the studied waters actually show the 1:1 Ca:SO4 molar ratio predicted by the stoichiometry of the Ca-sulphate dissolution reaction (Figure 10). Nevertheless, PZ22/8, PZ25/3-/4-/6 and PZ24/2-/3 deviate towards a relative sulphate enrichment, indicating the contribution from additional sulphate-bearing phases. A possible source for sulphate might be represented by pyrite (or one of its analogues) weathering. Pyrite ores stratigraphically close to evaporitic beds has been reported in different settings e.g., [63]. In the Carnian Alps, sulphide mineralizations, possibly related to hydrothermal vent zones associated to volcanic activity, have been discovered hosted in the Triassic calcareous formations. In the study area, the outcrop of Middle Triassic volcanic rocks occurs, and pyrite might be associated to ore-bearing deposits in restricted domains of the evaporite basin. Indeed, mineralizations characterized by arsenian pyrite were found North of the Enemonzo municipality [64]. In the studied area, pyrite might have been precipitated through time in restricted domains of the evaporite basin characterized by anaerobic conditions, associated with calcium-sulphate. During the admixing of oxygenated freshwater, such weathering of iron sulfides hosted in evaporite may oxidize releasing sulphate ions to water, thus accounting for the sulphate excess observed in some of the samples, and ferrous iron. Reducing conditions may prevent ferric iron from precipitating, even at circum-neutral pH. The relatively high iron concentration measured in samples with exceedingly high sulphate content (Table 3) might support this hypothesis. It has however to be noted that ferrous ions are become unstable in aerated waters, thus ferric oxide/hydroxides precipitates may form depending on pH and on the different redox conditions, making a quantification of the process difficult. Indeed, the studied waters are invariably supersaturated with iron oxyhydroxides (goethite saturation index in the range between +2.0 and + 6.1). It is hence possible that the measured iron content represents colloids and not totally dissolved species, and the correlation with sulphate might reflect the ongoing process of pyrite weathering.
The Mn content also shows large variations with depth in some piezometer. This has implications on the stability relation among redox species since the stability field of Mn2+ increases when in contact with Fe-oxides, while the relative stability of Fe2+ in solution decreases when Mn-oxides are present [65]. Speciation calculations indicate that waters range from saturated to supersaturated with rhodochrosite. These observations suggest the occurrence of both dissolved and particulate Fe and Mn in a complex geochemical system.
The proportions (in equivalents) of the major cations [Ca, Mg, (Na+K)] and anions (alkalinity, totally expressed as HCO3, chloride, sulphate) are displayed in the Piper diagram (Figure 11 [66].
Most waters belong to the Ca-SO4 hydrofacies (Table 2); however, a wide compositional range is observed including Ca-HCO3, Na-SO4 and Na-Cl water types. In particular, waters collected from PZ16 and PZ24 range in composition respectively from the Ca-SO4 and Ca-HCO3 type to the Na-Cl type as increasing depth; the Na/Cl=1 molar ratio in the latter water-type indicates the dissolution of halite. Indeed, these water samples are undersaturated with halite (halite saturation index in the range between −2.5 and −4.2). Halite is much more soluble than calcium sulphate by freshwater, and because of its high solubility halite usually does not make it into outcrops or shallow subcrops. This might explain the lack of exposed halite lithological formations.
It is known that dissolved foreign ions affect the stability of other minerals [67,68], since complexation lowers the activities of free ions in water thus increasing solubility of solid phases. These processes may contribute to gypsum-induced sinkholes, since karst cavities may develop in the subsurface by dissolution of gypsum when halite-rich intervals, flushed by water, dissolve and release sodium chloride. This increases the solubility of gypsum/anhydrite, that reaches a maximum and then slightly decreases, even if it remains significantly higher than in pure water [69]. Waters with high Ca2+/Mg2+ ratio due to gypsum dissolution may also react with dolomite to form calcium carbonate (dedolomitization), thus consuming ions released by dissolving dolomite and facilitating the development of voids. Indeed, the studied waters are variably supersaturated with calcite (with the exception of the Ca-HCO3 water-type PZ23/5; Table 2).
Furthermore, within the anion ternary diagram of the Piper plot (Figure 11) most waters define a linear trend between the sulphate corner and the chloride corner, and in the diamond of the diagram waters plot parallel to the cation axis. These patterns reflect mixture of two end-members, suggesting mixing of sulphate-rich waters with waters in adjacent aquifers, contributing to dissolution/precipitation processes.
It is observed that the chloride content correlates with lithium (Figure 12), the latter reaching relatively high concentration (5.3 mg/L). Lithium is a typical element that concentrate in evaporative brines; the data of this study suggests that lithium migrated and concentrated into halite salt aquifer [70]. The lithium source might be related to the Middle Triassic volcanism and associated hydrothermal system; however, additional studies would be necessary in order to investigate the origin of the lithium-rich component in these waters, a geochemical feature never reported before.
The studied waters are characterized by variable and high strontium content. Strontium is enriched in gypsum and anhydrite, where occupies calcium sites in lattice, and the freshwaters leaching of such gypsum/anhydrite can create Sr and Ca-rich waters. The Ca-sulphate dissolution provides SO42− ions to waters that mixes with Sr allowing celestite (SrSO4) precipitation to occur [71]. Speciation calculations indicate thatf the studied waters range from near-equilibrium to undersaturated with celestite (Table 2). This process typically reflects the interaction between saline waters and meteoric waters [72], e.g., during the dissolution of subaerially exposed gypsum [73], yielding celestite-evaporite association. Since celestite is less soluble than gypsum/anhydrite, these associations are more durable with respect to the original evaporite. The possible effects of such local-scale heterogeneous dissolution processes on landform and collapses also require additional studies.
The Ba content ranges from below detection limit to 123 µg/L; the highest Ba concentration was measured in the Ca-HCO3 water which is slightly undersaturated with barytocalcite [BaCa(CO3)2] (saturation index = −0.61), as typically found where evaporites grade into predominantly carbonate facies. Barium is roughly inversely correlated with sulphate (not shown) [74], being kept below detection limits at the higher amount of sulphate in waters.
Ranges from below detection limits to concentrations of concern (up tp 32.4 µg/L in PZ24/3), exceed the maximum concentration level of 10 µg/L imposed by EU and Italian regulations for groundwater. Speciation calculations indicate that As is mostly present as arsenate HAsO42−. As might have been released to water during weathering of the postulated pyrite sources in eastern Alps [64]; however, adsorption/desorption by Fe-oxyhydroxide influences the fate of As in water and the pattern of contamination with respect to the groundwater flow.
In general, the geochemical data highlight a complex array of processes with implications on the Ca-sulphate dissolution and the release of potentially toxic elements.

5. Conclusions

This study deals with the processes involved in the landforms and sinkholes causing severe damages of urban infrastructures at Quinis, a hamlet of the Enemonzo municipality in Carnian Alps, NE Italy, an area characterized by evaporitic terrain. A field experiment was conducted for the first time in order to quantify the dissolution rate of evaporitic rocks (which are part of the drilled boreholes in the area) in the phreatic and vadose zone and in air, using a network of piezometers and evaporitic rock samples. The data indicate the important role of the hydrologic regime, yielding a high rate of dissolution relative to water crossflow in particular during raining event. Dissolution of evaporitic rocks is observed in both submerged conditions and when passing from the phreatic to the vadose zone and vice-versa, due to water table fluctuations. Geochemical data on waters indicate that several processes take place, dominated by the dissolution of CaSO4. The dissolution of halite locally increases the Na Cl content in groundwater, strongly increasing the solubility of calcium sulphate and creating additional conditions for local scale cavities to develop in the shallow subsurface. Indeed, the occurrence of voids could rapidly occur locally, revealing through cover collapses sinkholes, especially in the areas where Quaternary deposits are thicker; it is therefore, very difficult to expect the location and timing of evaporite removal and sinkhole occurrence. These premises can also be aggravated considering the wide and fast groundwater fluctuations. During the one-year field experiment, 42 rock samples were analysed: 17 samples remained always immersed in water and 18 samples were instead placed in the fluctuation zone. One year of immersion has been enough to almost completely dissolve four of the 18 rock samples with an average dissolution rate of 2.8 mm/yr, a value almost three times than expected if compared to the available literature data. Considering all the samples, the average dissolution rate was estimated to be 2.1 mm/yr, twice as expected. The overall result, obtained for the first time in a field experiment, represents a novel finding in the knowledge of the fast evolutionary processes which cause fracture and conduit enlargement in an area where the karst can be considered mature with a consequent increase probability of sinkholes formation. The dissolution rates identified are in accordance with the general evolution of the phenomena in the area. After World War II, buildings were later rebuilt in the same places. In the seventies, parts of the buildings have been demolished due to the damages and partially rebuilt. Nowadays, some houses present open fractures or are bending (as the bell tower) indicating that the phenomena are still active. Data from the present study indicate that the phenomena evolve quickly making the houses not safe anymore. Some of them have already been declared uninhabitable.

Author Contributions

Conceptualization, C.C.; Methodology, C.C., L.Z., L.G. and R.P.; Laboratory analyses, L.G., R.P. and D.L.; Data Analyses, L.G., R.P., C.C.; Writing-Original Draft Preparation, C.C. and R.P.; Writing-Review & Editing, C.C., L.G. and R.P.; Supervision, R.P. and L.Z.

Funding

This research received no external funding.

Acknowledgments

The Authors would like to thank Franco Cucchi and Paolo Forti for their support and suggestions; Mauro Bussi for his help in the rock samples weighing operations; Lorenzo Furlan for the thin sections; the three anonymous reviewers for their valuable comments which helped in the manuscript improvement. A special thanks goes to the Geological Survey of the FVGR for funding the previous research on sinkholes which leaded the Authors to face up once more and more in depth with the topic proposed in the present paper.

Conflicts of Interest

The authors declare no conflict of interest.

References

  1. Beck, B.F. Soil piping and sinkhole failures. In Encyclopedia of Caves; White, W.B., Ed.; Elsevier: New York, NY, USA, 2004; pp. 523–528. [Google Scholar]
  2. Waltham, T.; Bell, F.; Culshaw, M. Sinkholes and Subsidence, Karst and Cavernous Rocks in Engineering and Construction; Springer: Berlin/Heidelberg, Germany; New York, NY, USA, 2005. [Google Scholar]
  3. Gutiérrez, F.; Cooper, A.H.; Johnson, K.S. Identification, prediction and mitigation of sinkhole hazards in evaporite karst areas. Environ. Geol. 2008, 53, 1007–1022. [Google Scholar] [CrossRef]
  4. Gutiérrez, F.; Parise, M.; De Waele, J.; Jourde, H. A review on natural and human-induced geohazards and impacts in karst. Earth Sci. Rev. 2014, 138, 61–88. [Google Scholar] [CrossRef]
  5. Cooper, A.H.; Waltham, A.C. Subsidence caused by gypsum dissolution at Ripon, North Yorkshire. Q. J. Eng. Geol. 1999, 32, 305–310. [Google Scholar] [CrossRef] [Green Version]
  6. Parise, M. Karst geo-hazards: Causal factors and management issues. Acta Carsol. 2015, 44, 401–414. [Google Scholar] [CrossRef]
  7. Forti, P.; Sauro, U. The gypsum karst of Italy. Int. J. Speleol. 1996, 25, 239–250. [Google Scholar] [CrossRef]
  8. Sauro, U. Dolines and sinkholes: Aspects of evolution and problems of classification. Acta Carsol. 2003, 32, 41–52. [Google Scholar]
  9. Ford, D.C.; Williams, P.W. Karst Hydrogeology and Geomorphology; John Wiley and Sons: Chichester, UK, 2007; 562p. [Google Scholar]
  10. Delle Rose, M.; Federico, A.; Parise, M. Sinkhole genesis and evolution in Apulia, and their interrelations with the anthropogenic environment. Nat. Hazards Earth Syst. Sci. 2004, 4, 747–755. [Google Scholar] [CrossRef] [Green Version]
  11. Zini, L.; Calligaris, C.; Forte, E.; Petronio, L.; Zavagno, E.; Boccali, C.; Cucchi, F. A multidisciplinary approach in sinkhole analysis: The Quinis village case study (NE-Italy). Eng. Geol. 2015, 197, 132–144. [Google Scholar] [CrossRef]
  12. Vigna, B.; D’Angeli, I.M.; De Waele, J. Hydrogeological flow in gypsum areas: Some examples from northern Italy and main circulation models. Int. J. Speleol. 2017, 46, 205–217. [Google Scholar] [CrossRef]
  13. Lamont-Black, J.; Baker, A.; Younger, P.L.; Cooper, A.H. Utilising seasonal variations in hydrogeochemistry and excitation–emission fluorescence to develop a conceptual groundwater flowmodel with implications for subsidence hazards: An example from Co. Durham, UK. Environ. Geol. 2005, 48, 320–335. [Google Scholar] [CrossRef]
  14. Cooper, A.H.; Calow, R. Gypsum Geohazards: Their Impact on Development-Project; Technical Report, WC/97/17; British Geological Survey: Nottingham, UK, 1997. [Google Scholar]
  15. Wanfang, Z. The formation of sinkholes in karst mining areas in China and some methods of prevention. Environ. Geol. 1997, 31, 50–58. [Google Scholar] [CrossRef]
  16. Cucchi, F.; Forti, P.; Finocchiaro, F. Gypsum degradation in Italy with respect to climatic textural and erosional conditions. Geogr. Fis. Din. Quat. 1998, 3, 41–49. [Google Scholar]
  17. Furlani, S.; Cucchi, F.; Forti, F.; Rossi, A. Comparison between coastal and inland karst limestone lowering rates in the northeastern Adriatic Region (Italy and Croatia). Geomorphology 2009, 104, 73–81. [Google Scholar] [CrossRef]
  18. Klimchouk, A.; Cucchi, F.; Calaforra, J.M.; Aksem, S.; Finocchiaro, F.; Forti, P. Dissolution of gypsum from field observations. Int. J. Speleol. 1996, 25, 37–48. [Google Scholar] [CrossRef] [Green Version]
  19. Cooper, A.H.; Calow, R.C. Avoiding Gypsum Geohazards: Guidance for Planning and Construction; Technical Report, WC/98/5; British Geological Survey: Nottingham, UK, 1998. [Google Scholar]
  20. Cooper, A.H. Gypsum dissolution geohazards at Ripon, North Yorkshire, UK. In Engineering Geology for Tomorrow’s Cities; The Geological Society of London: London, UK, 2006; pp. 1–14. [Google Scholar]
  21. Benson, R.C.; Kaufmann, R.D. Characterization of a highway sinkhole within the gypsum karst of Michigan. In Geotechnical and Environmental Applications of Karst Geology and Hydrology; Beck, B.F., Herring, J.G., Eds.; Balkema: Lisse, The Netherlands, 2001; pp. 103–112. [Google Scholar]
  22. Gutiérrez, F.; Cooper, A.H. Evaporite dissolution subsidence in the historical city of Calatayud, Spain: Damage appraisal and prevention. Nat. Hazards 2002, 25, 259–288. [Google Scholar] [CrossRef]
  23. Guerrero, J.; Gutiérrez, F.; Lucha, P. Paleosubsidence and active subsidence due to evaporite dissolution in Zaragoza city area (Huerva River valley, NE Spain). Processes, spatial distribution and protection measures for linear infrastructures. Eng. Geol. 2004, 72, 309–329. [Google Scholar] [CrossRef]
  24. Galve, J.P.; Gutiérrez, F.; Lucha, P.; Bonachea, J.; Remondo, J.; Cendrero, J.; Gutiérrez, M.; Gimeno, M.J.; Pardo, G.; Sánchez, J.A. Sinkholes in the salt-bearing evaporitic karst of the Ebro River valley upstream of Zaragoza city (NE Spain). Geomorphological mapping and analysis as a basis for risk management. Geomorphology 2009, 108, 145–158. [Google Scholar] [CrossRef]
  25. Iovine, G.; Parise, M.; Trocino, A. Breakdownmechanisms in gypsum caves of southern Italy, and the related effects at the surface. Z. Geomorphol. 2001, 54 (Suppl. 2), 153–178. [Google Scholar] [CrossRef]
  26. Calligaris, C.; Devoto, S.; Galve, J.P.; Zini, L.; Pérez-Peña, J.V. Integration of multi-criteria and nearest neighbour analysis with kernel density functions for improving sinkhole susceptibility models: The case study of Enemonzo (NE Italy). Int. J. Speleol. 2017, 42, 191–204. [Google Scholar] [CrossRef]
  27. Stawski, T.M.; van Driessche, A.E.; Ossorio, M. Formation of calcium sulfate through the aggregation of sub-3 nanometre primary species. Nat. Commun. 2016, 7, 11177. [Google Scholar] [CrossRef]
  28. Warren, J.K. Evaporites: Sediments, Resources and Hydrocarbons; Springer: Berlin/Heidelberg, Germany, 2006. [Google Scholar]
  29. Zhu, X.M. Sedimentary Petrology; Petroleum Industry Press: Beijing, China, 2008. [Google Scholar]
  30. De Waele, J.; Piccini, L.; Columbu, A.; Madonia, G.; Vattano, M.; Calligaris, C.; D’Angeli, I.M.; Parise, M.; Chiesi, M.; Sivelli, M.; et al. Evaporite karst in Italy: A review. Int. J. Speleol. 2017, 46, 137–168. [Google Scholar] [CrossRef]
  31. Beydoun, Z.R. Arabian plate oil and gas: Why so rich and so prolific? Episodes 1998, 21, 74–81. [Google Scholar]
  32. Chen, Z.; Osadetz, K.G.; Li, M. Spatial characteristics of Middle Devonian oils and non-associated gases in the Rainbow area, northwest Alberta. Mar. Pet. Geol. 2005, 22, 391–401. [Google Scholar] [CrossRef]
  33. Klimchouk, A. The dissolution and conversion of gypsum and anhydrite. Int. J. Speleol. 1996, 25, 21–36. [Google Scholar] [CrossRef]
  34. Cucchi, F.; Forti, P. Dissoluzione sottocutanea nei gessi: Analisi e considerazioni. Atti Congresso Naz. Speleol. 1993, 1, 89–100. [Google Scholar]
  35. Cucchi, F.; Forti, P.; Ulcigrai, F. Znizevanje krskega povrsja zaradi korozije (Valori di abbassamento per dissoluzione di superfici carsiche). Acta Carsol. 1994, 23, 55–61. [Google Scholar]
  36. Dreybrodt, W.; Eisenlohr, L. Limestones dissolution rates in karst environments. In Speleogenesis: Evolutions in Karst Aquifers; Klimchouk, A.B., Ford, D.C., Palmer, A.N., Dreybrodt, W., Eds.; National Speleological Society: Huntsville, AL, USA, 2000; pp. 136–148. [Google Scholar]
  37. Jeschke, A.; Vosbeck, K.; Dreybrodt, W. Surface controlled dissolution rates of gypsum in aqueous solutions exhibit nonlinear dissolution kinetics. Geochim. Cosmochim. Acta 2001, 65, 27–34. [Google Scholar] [CrossRef]
  38. Gutiérrez, F. Sinkhole Hazards; Oxfrod Research Encyclopedia of Natural Hazard Science; Oxford University Press: Oxford, UK, 2016; pp. 1–92. [Google Scholar]
  39. Galdenzi, S. Corrosion of limestone tablets in sulfidic ground-water: Measurements and speleogenetic implications. Int. J. Speleol. 2012, 41, 149–159. [Google Scholar] [CrossRef]
  40. Cucchi, F.; Forti, F.; Marinetti, E. Surface degradation of carbonate rocks in the karst of Trieste (Classical Karst, Italy). In Karren Landforms; Fornós, J.-J., Ginés, A., Eds.; Universitat de les Illes Balears: Palma de Mallorca, Spain, 1996; pp. 41–51. [Google Scholar]
  41. Stephenson, W.J.; Finlayson, B.L. Measuring erosion with the micro-erosion meter—Contributions to understanding landform evolution. Earth Sci. Rev. 2009, 95, 53–62. [Google Scholar] [CrossRef]
  42. Sanna, L.; De Waele, J.; Calaforra, J.M.; Forti, P. Long-term erosion rate measurements in gypsum caves of Sorbas (SE Spain) by the Micro-Erosion Meter method. Geomorphology 2015, 228, 213–225. [Google Scholar] [CrossRef]
  43. Trudgill, S. Measurements of erosional weight loss of rock tablets. Br. Geomorphol. Res. Group Tech. Bull. 1975, 17, 13–19. [Google Scholar]
  44. Crowther, J. A comparison of the rock tablet andwater hardnessmethods for determining chemical erosion rates on karst surfaces. Annu. Geomorphol. 1983, 27, 55–64. [Google Scholar]
  45. Gams, I. International comparative measurements of surface solution by means of standard limestone tablets. Zb. Ivana Rakovca 1986, 26, 361–386. [Google Scholar]
  46. Tarhule-Lips, R.F.A.; Ford, D.C. Condensation corrosion in caves on Cayman Brac and Isla de Mona. J. Caves Karst Stud. 1998, 60, 84–95. [Google Scholar]
  47. Plan, L. Factors controlling carbonate dissolution rates quantified in a field test in the Austrian alps. Geomorphology 2005, 68, 201–212. [Google Scholar] [CrossRef]
  48. Gabrovšek, F. On concepts andmethods for the estimation of dissolutional denudation rates in karst areas. Geomorphology 2009, 106, 9–14. [Google Scholar] [CrossRef]
  49. Calligaris, C.; Devoto, S.; Zini, L. Evaporite sinkholes of the Friuli Venezia Giulia region (NE Italy). J. Maps 2017, 13, 406–414. [Google Scholar] [CrossRef]
  50. Venturini, C. Evoluzione Geologica Delle Alpi Carniche, un Viaggio Attraverso il Tempo; Edizioni del Museo Friulano di Storia Naturale: Comune di Udine, Italy, 2006; Volume 48, p. 208. [Google Scholar]
  51. Venturini, C.; Delzotto, S.; Pondrelli, M.; Fontana, C.; Pondrelli, M.; Longo Salvador, G.; Carulli, G.B.; Pisa, G.F. 031 Ampezzo (Carta Geologica d’Italia Alla Scala 1:50.000); Servizio Geologico Nazionale: Ispra, Italy, 2010. [Google Scholar]
  52. Carulli, G.B. Carta Geologica del Friuli Venezia Giulia, Scala 1:150000; Direzione Centrale Ambiente e Lavori Pubblici, Servizio Geologico: Firenze, Italy, 2006. [Google Scholar]
  53. Zini, L.; Calligaris, C.; Devoto, S.; Zavagno, E.; Forte, E.; Petronio, L.; Boccali, C.; Cucchi, F. Fenomeni di sprofondamento nella piana di Enemonzo (UD). Mem. Descr. Carta Geol. D’Italia 2015, XCIX, 101–110. [Google Scholar]
  54. Marinelli, O. Fenomeni di tipo carsico nei terrazzi alluvionali della Valle del Tagliamento. Mem. Della Soc. Geogr. Ital. 1898, 8, 415–419. [Google Scholar]
  55. Gortani, M. Le doline alluvionali. Nat. Mont. 1965, 3, 120–128. [Google Scholar]
  56. Cameron, F.K.; Breazeale, J.F. Solubility of calcium sulfate in aqueous solutions of sulphuric acid. J. Phys. Chem. 1903, 7, 571–577. [Google Scholar] [CrossRef]
  57. Marshall, W.L.; Jones, E.V. Second dissociation constant of sulfuric acid from 25 to 350 °C evaluated from solubilities of calcium sulfate in sulfuric acid solutions. J. Phys. Chem. 1966, 70, 4028–4040. [Google Scholar] [CrossRef]
  58. Ling, Y.; Demopoulos, G.P. Solubility of calcium sulfate hydrates in (0 to 3.5) mol·kg−1 sulfuric acid solutions at 100 °C. J. Chem. Eng. Data 2004, 49, 1263–1268. [Google Scholar] [CrossRef]
  59. Braitsch, O. The temperature of evaporite formation. In Problems in Paleoclimatology; Nairn, A.E.M., Ed.; Wiley: New York, NY, USA, 1964; pp. 479–490. [Google Scholar]
  60. Dutrizac, J.E. Calcium sulfate solubilities in simulated zinc processing solutions. Hydrometallurgy 2002, 65, 109–135. [Google Scholar] [CrossRef]
  61. Lindberg, R.D.; Runnels, D.D. Ground water redox reactions: An analysis of equilibrium state applied to Eh measurements and geochemical modeling. Science 1984, 225, 925–927. [Google Scholar] [CrossRef] [PubMed]
  62. Huggenberger, P.; Zidane, A.; Zechner, E.; Gechter, D. The role of tectonic structures and density-driven groundwater flow for salt karst formation. In Engeneering Geology for Society and Territory; Lollino, G., Manconi, A., Guzzetti, F., Culshaw, M., Bobrowsky, P., Luino, F., Eds.; Springer International Publishing: Basel, Switzerland, 2015. [Google Scholar]
  63. Jenks, W.F. Origins of some massive pyritic ore deposits of Western Europe. Econ. Geol. 1994, 70, 488–498. [Google Scholar] [CrossRef]
  64. Petrini, R.; Slejko, F.; Lutman, A.; Pison, S.; Franceschini, G.; Zini, L.; Italiano, F.; Galic, A. Natural arsenic contamination in waters from the Pesariis village, NE Italy. Environ. Earth Sci. 2011, 62, 481–491. [Google Scholar] [CrossRef]
  65. Appelo, C.A.J.; Postma, D. Geochemistry, Groundwater and Pollution; A.A. Balkema Publishers: Avereest, The Netherlands, 2005. [Google Scholar]
  66. Piper, A.M. A graphic procedure in the geochemical interpretation of water-analyses. Am. Geophys. Union 1944, 25, 914–928. [Google Scholar] [CrossRef]
  67. Bock, E. On the solubility of anhydrous calcium sulphate and gypsum in concentrated solutions of sodium chloride at 25 °C, 30 °C, 40 °C and 50 °C. Can. J. Chem. 1961, 39, 1746–1751. [Google Scholar] [CrossRef]
  68. Gobran, G.R.; Miyamoto, S. Dissolution rate of gypsum in aqueous salt solutions. Soil Sci. 1985, 40, 89–93. [Google Scholar] [CrossRef]
  69. Blount, C.W.; Dickson, F.W. The solubility of anhydrite (CaSO4) in NaCl-H2O from 100 to 450 °C and 1 to 1000 bars. Geochim. Cosmochim. Acta 1969, 33, 227–245. [Google Scholar] [CrossRef]
  70. Munk, L.A.; Hynek, S.A.; Bradley, D.C.; Boutt, D.; Labay, K.; Jochens, H. Lithium brines: A global perspective. Rev. Econ. Geol. 2016, 18, 339–365. [Google Scholar]
  71. Carlson, E.H. Celestite replacements of evaporates in Salina Group. Sediment. Geol. 1987, 54, 93–112. [Google Scholar] [CrossRef]
  72. West, I.M. Vanished evaporates; significance of strontium minerals. J. Sediment. Petrol. 1973, 43, 278–279. [Google Scholar]
  73. Taberner, C.; Marshall, J.D.; Hendry, J.P.; Pierre, C.; Thirlwall, M.F. Celestite formation, Bactyerial sulphate reduction and carbonate cementation in Eocene reefs and basinal sediments (Igualada, NE Spain). Sedimentology 2002, 49, 171–190. [Google Scholar] [CrossRef]
  74. Hanor, J.S. A model for the origin of large carbonate and evaporite hosted Celestine (SrSO4) deposits. J. Sediment. Res. 2004, 74, 168–175. [Google Scholar] [CrossRef]
Figure 1. (a) Study area location in the European environment; (b) location of the study area (red dot) in the FVGR correspond to the Quins hamlet, in blue the Tagliamento River; (c) a cover collapse sinkhole occurred in 2013 in the western side of Enemonzo municipality; (d) a cover collapse sinkhole occurred in 2017 on the north-eastern side of Enemonzo municipality.
Geosciences 09 00298 g001
Figure 2. Geological and geomorphological map of the study area and the related simplified cross-section (modified after [11].
Geosciences 09 00298 g002
Figure 3. (a) silt stones and red shales from Membro a peliti rosse; (b) core-drilling samples collected while drilling PZ20 piezometer into the Membro a gessi e dolomie grigie; (c) particular of a warped gypsum with marls fragments; (d) cave entrance (in red the dimension) present along one of the small stream with no name, tributary of the Rio Quinis stream, a surface drainage of the (Tagliamento River). Photo credit: E. Zavagno.
Geosciences 09 00298 g003
Figure 4. (a) Location map of the piezometers present in the area of Quinis and the ones where rock samples at different depths were installed (in red). In the centre of the area, the trace of the simplified cross-section presented in Figure 4b; (b) simplified lithostratigraphical cross-section (modified after [11]) of the bedrock and the mantling deposits (prevailing mud with sand, prevailing gravel and anthropogenic deposits). The section is NE-SW oriented. In red, six of the seven piezometers involved in the field experiment.
Geosciences 09 00298 g004
Figure 5. Simplified stratigraphic column and installation depths of evaporite rock samples in the piezometers at Quinis hamlet. Black bars on the left side of each piezometer represent the screens. All the piezometers are open hole type. The labelled percentages (in pink color) refer to the weight loss of the installed rock samples (see details in the text).
Geosciences 09 00298 g005
Figure 6. Water level fluctuations recorded in the piezometers of the Quinis-Enemonzo area in the period between 2012 and 2014 (modified after [11,53]).
Geosciences 09 00298 g006
Figure 7. X-ray powder diffractograms of the analysed samples. (a) evaporite fragment in PZ22, showing the presence of anhydrite; (a1,a2) thin section of fragment from PZ22, parallel nicols above and cross nicol below showing the dense structure of the anhydrite; (a3) the evaporite sample used for thin section consisting of rhythmic alternations of thin gypsum and anhydrite layers (withe) interspersed with marls and clayey layers (black); (b) evaporite sample in PZ3, showing the presence of gypsum; (b1,b2) thin section of fragment from PZ3, parallel nicols above and cross nicol below, in the gypsum mosaic structure it is also possible to recognize some marl clasts; (a3,b3) the evaporite sample used for thin sections, clayey and marls fragments are immerse in a gypsum matrix.
Geosciences 09 00298 g007
Figure 8. Data-logger water level measurements in the period April 2017–May 2018 with respect to the precipitations occurred in the study area in the piezometers PZ3, PZ7, PZ22, PZ23, PZ24 and PZ25.
Geosciences 09 00298 g008
Figure 9. TDS (mg/L) vs. SO42− (mg/L) correlation diagram. Symbols are: open circle: piezometers with evaporite-rock fragments inside; filled circle: piezometer without evaporite-rock fragments inside. The linear best-fit for waters, excluding the labelled (Na-Cl) samples, is also shown (R2 = 0.97, dashed line).
Geosciences 09 00298 g009
Figure 10. Ca2+ (mol/L) vs. SO42− (mol/L) correlation diagram. The SO42−/Ca2+ = 1 stoichiometry is shown (dashed line). Waters that deviates towards a relative sulphate enrichment are labelled. Symbols as in Figure 9.
Geosciences 09 00298 g010
Figure 11. Piper diagram showing the different water-type, ranging between the Ca-SO4, Na-SO4, Ca-HCO3 and Na-Cl hydrofacies. Samples deviating from the chloride-sulphate trend (see text) are labelled.
Geosciences 09 00298 g011
Figure 12. Cl (mg/L) vs. Li (µg/L) correlation diagram. Symbols as in Figure 9.
Geosciences 09 00298 g012
Table 1. Sample depth represents the depth at which the samples were installed: with no colour, the rock samples which always remained in the dry zone. In pale blue the samples which remained in the vadose zone, in dark blue the samples which remained always immerse in the phreatic zone within the whole experimental time. For each sample the weight pre-experiment (A), post-experiment (B), the weight loss and the percentage of weight loss were calculated, as well as their density (measured by using the volume difference). After the surface measurement (geometrical computation realised pre-installation), according to [47], the dissolution rate was computed.
IDSample Depth [b.g.l.]Weight A [g]Weight B [g]Weight Loss [g]% Weight LossDensity [g/cm3]Surface [cm2]Days of Immersion% Time of ImmersionR = Dissolution Rate [mm/yr]
PZ3/12.0209.00185.5023.5011.22.32136.2000.74
PZ3/210.0158.6050.20108.4068.32.6497.243104.22
PZ3/314.3234.300.00234.30100.02.39146.6122306.68
PZ3/419.7254.2038.50215.7084.92.54149.24101005.68
PZ3/519.7251.205.50245.7097.82.28162.24101006.63
PZ7/12.0736.50727.908.601.22.73284.83000.11
PZ7/29.8609.60523.6086.0014.12.39271.193481.33
PZ7/319.8621.50293.90327.6052.72.39294.5585214.64
PZ7/437.31521.80426.501095.3072.02.32693.754101006.79
PZ7/537.31486.90432.601054.3070.92.29688.684101006.68
PZ8/12.0670.00669.100.90.12.68263.76000.01
PZ8/210.0743.90680.3063.60.02.66343.451740.69
PZ8/320.0617.0030.40586.695.12.47309.3560157.67
PZ8/430.0654.300.00654.3100.02.42332.08250618.12
PZ8/535.51621.20952.30668.941.32.32820.974101003.52
PZ8/635.51219.70772.80446.936.62.28633.374101003.08
PZ16/12.0294.20294.100.100.02.45147.83000.00
PZ16/29.4394.10392.401.700.42.46183.50205500.03
PZ16/314.8388.00387.100.900.22.28192.434101000.02
PZ16/417.9740.90740.900.000.02.39317.274101000.00
PZ16/517.9927.90926.601.300.12.32397.524101000.01
PZ22/12 (A)225.40225.0000.02.50127.44000.01
2 (B)138.30138.3000.02.3894.59000.00
PZ22/29.8348.40319.9028.58.22.21224.521740.57
PZ22/314.8 (A) 239.90212.4027.5011.52.40149.1760150.77
14.8 (B)145.70111.8033.9023.32.4397.1860151.43
PZ22/419.7432.50308.90123.628.62.28266.11118292.04
PZ22/529.2325.90253.4072.522.23.10155.664101001.50
PZ22/629.2378.40288.0090.423.92.91188.154101001.65
PZ22/749.2374.80350.9023.96.42.88188.154101000.44
PZ22/859.1355.00353.301.70.52.84181.644101000.03
PZ23/12.0358.70178.50180.250.22.24227.13003.54
PZ23/25.0377.30246.20131.134.72.43220.631432.43
PZ23/35.0381.50276.80104.727.42.38227.131431.93
PZ23/410.0546.10384.60161.529.62.76276.51112272.12
PZ23/515.0588.00240.0034859.22.73298.594101004.25
PZ23/624.6489.70360.40129.326.42.80246.614101001.86
PZ23/734.5603.50531.8071.711.92.74305.084101000.85
PZ25/13.1247.10246.900.200.12.29137.14000.00
PZ25/210.2356.60354.602.000.62.38174.58000.05
PZ25/313.1337.10336.400.700.22.41165.671840.02
PZ25/417.1852.30851.800.500.12.40357.394101000.00
PZ25/517.1886.10885.500.600.12.36357.224101000.00
Table 2. Water-type, physico-chemical parameters (EC = electrical conductivity, Eh= redox potential, TDS = total dissolved solid) and major ions concentration.
SampleWater-Type *TECTDSpHEhSIgy **SIcal **SIcel **Na+K+Mg2+Ca2+ClNO3−SO42−HCO3Ion Balance
(C°)(mS/cm)(mg/L) (V) (mg/L)(mg/L)(mg/L)(mg/L)(mg/L)(mg/L)(mg/L)(mg/L)
PZ3/5Ca-SO411.00.956297.820.22−1.180.67−1.164.44.1211455.65.72362262.3
PZ7/5Ca-SO412.22.3820617.55−0.07−0.250.81−0.417.75.8515829.79.212082366.6
PZ8/6Ca-SO412.12.3622617.630.26−0.170.78−0.3894.5396198.9 14401852.0
PZ10/1Ca-SO412.11.8314677.850.18−0.430.94−0.548.43.6264328.46.98291867.9
PZ10/2Ca-SO411.73.3525047.88−0.08−0.311.07−0.402741143519258 12112386.7
PZ16/3Ca-SO413.12.6925867.790.18−0.120.87−0.36888.72564466 1650154−0.7
PZ16/4Na-Cl13.09.3761737.71−0.06−0.220.94−0.43140710.1348082150 16682322.7
PZ22/6Ca-SO411.92.2018787.93−0.11−0.261.08−0.72115.218567122.311231816.4
PZ22/7Ca-SO411.72.3320817.96−0.12−0.221.16−0.65265.71958023 12602112.3
PZ22/8Na-Cl11.518.41119358.01−0.08−0.261.00−0.18357754757664997 25592170.9
PZ23/5Ca-HCO311.80.221668.010.17−2.730.02−3.498.44.413112 1598−2.8
PZ23/7Ca-SO411.81.7314467.810.18−0.40.89−0.75125.214413125.58281913.8
PZ24/1Ca-HCO312.41.429518.120.16−1.271.16−1.171156.7241751629.81862998.0
PZ24/2Na-Cl12.033.70214858−0.09−0.390.91−0.357273992266619847 37403011.4
PZ24/3Na-Cl12.452.30366608.05−0.15−0.161.12−0.2912919188388108016237 68403903.6
PZ25/3Na-SO412.65.2043067.94−0.05−0.131.17−0.126353483563273 2490320−1.0
PZ25/4Na-SO412.87.7759888.18−0.09−0.161.25−0.2714554467494575 31912973.9
PZ25/6Na-SO413.16.7952138.24−0.07−0.191.39−0.2611174182499562 27023232.4
* Obtained on the basis of the Piper diagram (see Figure 11); ** Saturation index of gypsum (gy), calcite (cal), celestite (cel).
Table 3. Trace element analysis (µg/L). Values <DL (detection limit) are indicated.
SampleLiMnCoNiSrMo Sb Ba Tl Pb U V Cr Fe As
PZ3/511.70.910.367.832702.290.2643<0.22.310.43<0.1<0.386<0.2
PZ7/515.87191.9432.28771<10.3159<0.6<20.971.68<198315.3
PZ8/61719.71.7832.582631.960.7215.8<0.66.41.120.9<1644<0.6
PZ10/113.63.40.8824.574303.80.3257<0.32.680.73<0.22.96218<0.3
PZ10/2148811.626.89066<1<0.626.9<0.6<20.33<0.4<1331<0.6
PZ16/3404.81.5735813017.11.4925<0.62.472.61<0.4<13270.67
PZ16/42719774441015610.1<147<1<45.41.7<28222.9
PZ22/615.525.31.3734.34210<12.1472<0.6<20.41<0.4<1359<0.6
PZ22/72126.31.2931.64693<11.1760<0.6<20.5<0.4<1594<0.6
PZ22/856410071.784215397<4<241<2<8<0.23.6<41870<2
PZ23/53.7760.5521190.955.919.5<0.057.190.071.160.551090.49
PZ23/710.9351.4525.743694.62.7828.1<0.36.30.620.17<0.6248<0.3
PZ24/155341.063947553.61.23123<0.34.20.530.7325.64070.57
PZ24/226865421.56<4012390<9<5<70<5<20<0.47.5<10734<5
PZ24/353224615.842012651<18<10<140<10<40<0.814.1<20149132.4
PZ25/3453381.2430.99855<2<1<15<17.32.84<0.8<2462<1
PZ25/484628.31.0424.18356<2<1<15<1<40.99<0.8<2327<1
PZ25/6714721.9329.890008.1<1<15<1<412.42.3<24693.22

