Article

Geological and Structural Control on Localized Ground Effects within the Heunghae Basin during the Pohang Earthquake (MW 5.4, 15th November 2017), South Korea

1
Active Fault and Earthquake Hazard Mitigation Research Center, Pukyong National University, Busan 48513, Korea
2
Geological Structure and Geohazard Research Laboratory, Department of Earth and Environmental Sciences, Pukyong National University, Busan 48513, Korea
*
Author to whom correspondence should be addressed.
Geosciences 2019, 9(4), 173; https://doi.org/10.3390/geosciences9040173
Submission received: 29 January 2019 / Revised: 4 April 2019 / Accepted: 8 April 2019 / Published: 16 April 2019

Abstract

:
On 15th November 2017, the Pohang earthquake (Mw 5.4) had strong ground shaking that caused severe liquefaction and lateral spreading across the Heunghae Basin, around Pohang city, South Korea. Such liquefaction is a rare phenomenon during small or moderate earthquakes (MW < 5.5). There are only a few examples around the globe, but more so in the Korean Peninsula. In this paper, we present the results of a systematic survey of the secondary ground effects—i.e., soil liquefaction and ground cracks—developed during the earthquake. Most of the liquefaction sites are clustered near the epicenter and close to the Heunghae fault. Based on the geology, tectonic setting, distribution, and clustering of the sand boils along the southern part of the Heunghae Basin, we propose a geological model, suggesting that the Heunghae fault may have acted as a barrier to the propagation of seismic waves. Other factors like the mountain basin effect and/or amplification of seismic waves by a blind thrust fault could play an important role. Liquefaction phenomenon associated with the 2017 Pohang earthquake emphasizes that there is an urgent need of liquefaction potential mapping for the Pohang city and other areas with a similar geological setting. In areas underlain by extensive unconsolidated basin fill sediments—where the records of past earthquakes are exiguous or indistinct and there is poor implementation of building codes—future earthquakes of similar or larger magnitude as the Pohang earthquake are likely to occur again. Therefore, this represents a hazard that may cause significant societal and economic threats in the future.

1. Introduction

Most of the damages that occurred during an earthquake across the sedimentary basins around the world are mainly due to strong shaking and amplification of soft sediments, which are commonly associated with earthquakes of magnitudes (M) more than 6 [1,2,3,4,5,6,7,8,9]. The more recent 2015 Nepal earthquake or the 2018 Palu earthquake in Indonesia are good examples of such phenomenon. Post-earthquake field survey and its documentation can help us understand the cause and mechanism involved, as well as future hazard predictions [6]. In the past and in recent history, several studies [10,11,12,13,14,15,16,17,18,19,20,21,22,23] have been conducted to understand the mechanism and factors controlling the liquefaction of related hazards. Almost all of these studies are associated with large magnitude earthquakes. However, the liquefaction and associated damages due to moderate to small magnitude earthquakes like the 2009 Olancha earthquake in the United States (Mw 5.2), 2011 Yunnan earthquake in China (Mw 5.4), 2011 Mineral Virginia earthquake in Canada (Mw 5.8), 2012 Emilia earthquake in Italy (Mw 6.1), 2011 Sikkim earthquake in India (Mw 6.9), 2016 Manipur earthquake in India (Mw 6.7), and the recent 2017 Pohang earthquake in South Korea (Mw 5.5) indicate that moderate earthquakes need a similar kind of attention as large magnitude earthquakes in terms of seismic hazard.
Actually, reporting on the phenomena and processes involved for the liquefactions associated with earthquakes of M ≤ 5.5 is only four to five cases so far [24,25,26,27]. Thus, the ability and exposure towards understanding of the causes of liquefaction during Mw ≤ 5.5 earthquake from a geological perspective still remains poor, especially in the Korean Peninsula, where this is the first ever recorded liquefaction phenomena in the history of instrumental seismicity in South Korea.
The Korean Peninsula has been considered to be seismically stable in comparison to neighboring countries such as Japan and Taiwan [28]. Thus, the earthquake was a shock even to the Korean geologists as well as to the public. During the Mw 5.4 Pohang earthquake on 15th November 2017, a widespread liquefaction was observed in and around the Pohang area, especially around the Heunghae Basin composed of recent alluvial sediments. The liquefaction caused ground failures such as sand boils and cracks; it also damaged the engineering structures like school buildings and residential apartments. The documentation of liquefaction features may be useful from both geological and geotechnical point of view in terms of seismic hazards [6].
Internationally adopted empirical procedures for the prediction of liquefaction potential are completely based on field observations from large magnitude earthquakes, except in one case of less than Mw ≤ 6 [2,4,29,30]. This approach may overestimate or underestimate the hazards posed by a potential liquefaction. Therefore, proper liquefaction analyses associated with moderate earthquakes like the Pohang or Olancha earthquakes may help to properly estimate the potential liquefaction hazard in areas with similar geological settings. Most of the liquefaction potential analyses that have been conducted in Korea [31,32,33] are mainly based on these empirical relationships and considering earthquake scenario of MW 6.5. Thus, it is necessary to check the reliability of the procedures used so far and to propose a better liquefaction boundary curve for medium size earthquakes in Korea.
In this paper, we are presenting field evidences of secondary ground effects [34] i.e., mainly liquefaction and its localized distribution within the Heunghae basin. Based on the analyzed data, we propose a possible mechanism from the geological perspective and a conceptual model with geological structures to explain the localized sand boil occurrences. In addition, we have discussed the role of geological factors such as the fault barrier zone and mountain basin effect, which is helpful for future liquefaction hazard mapping in the study area and similar geological settings around the world.

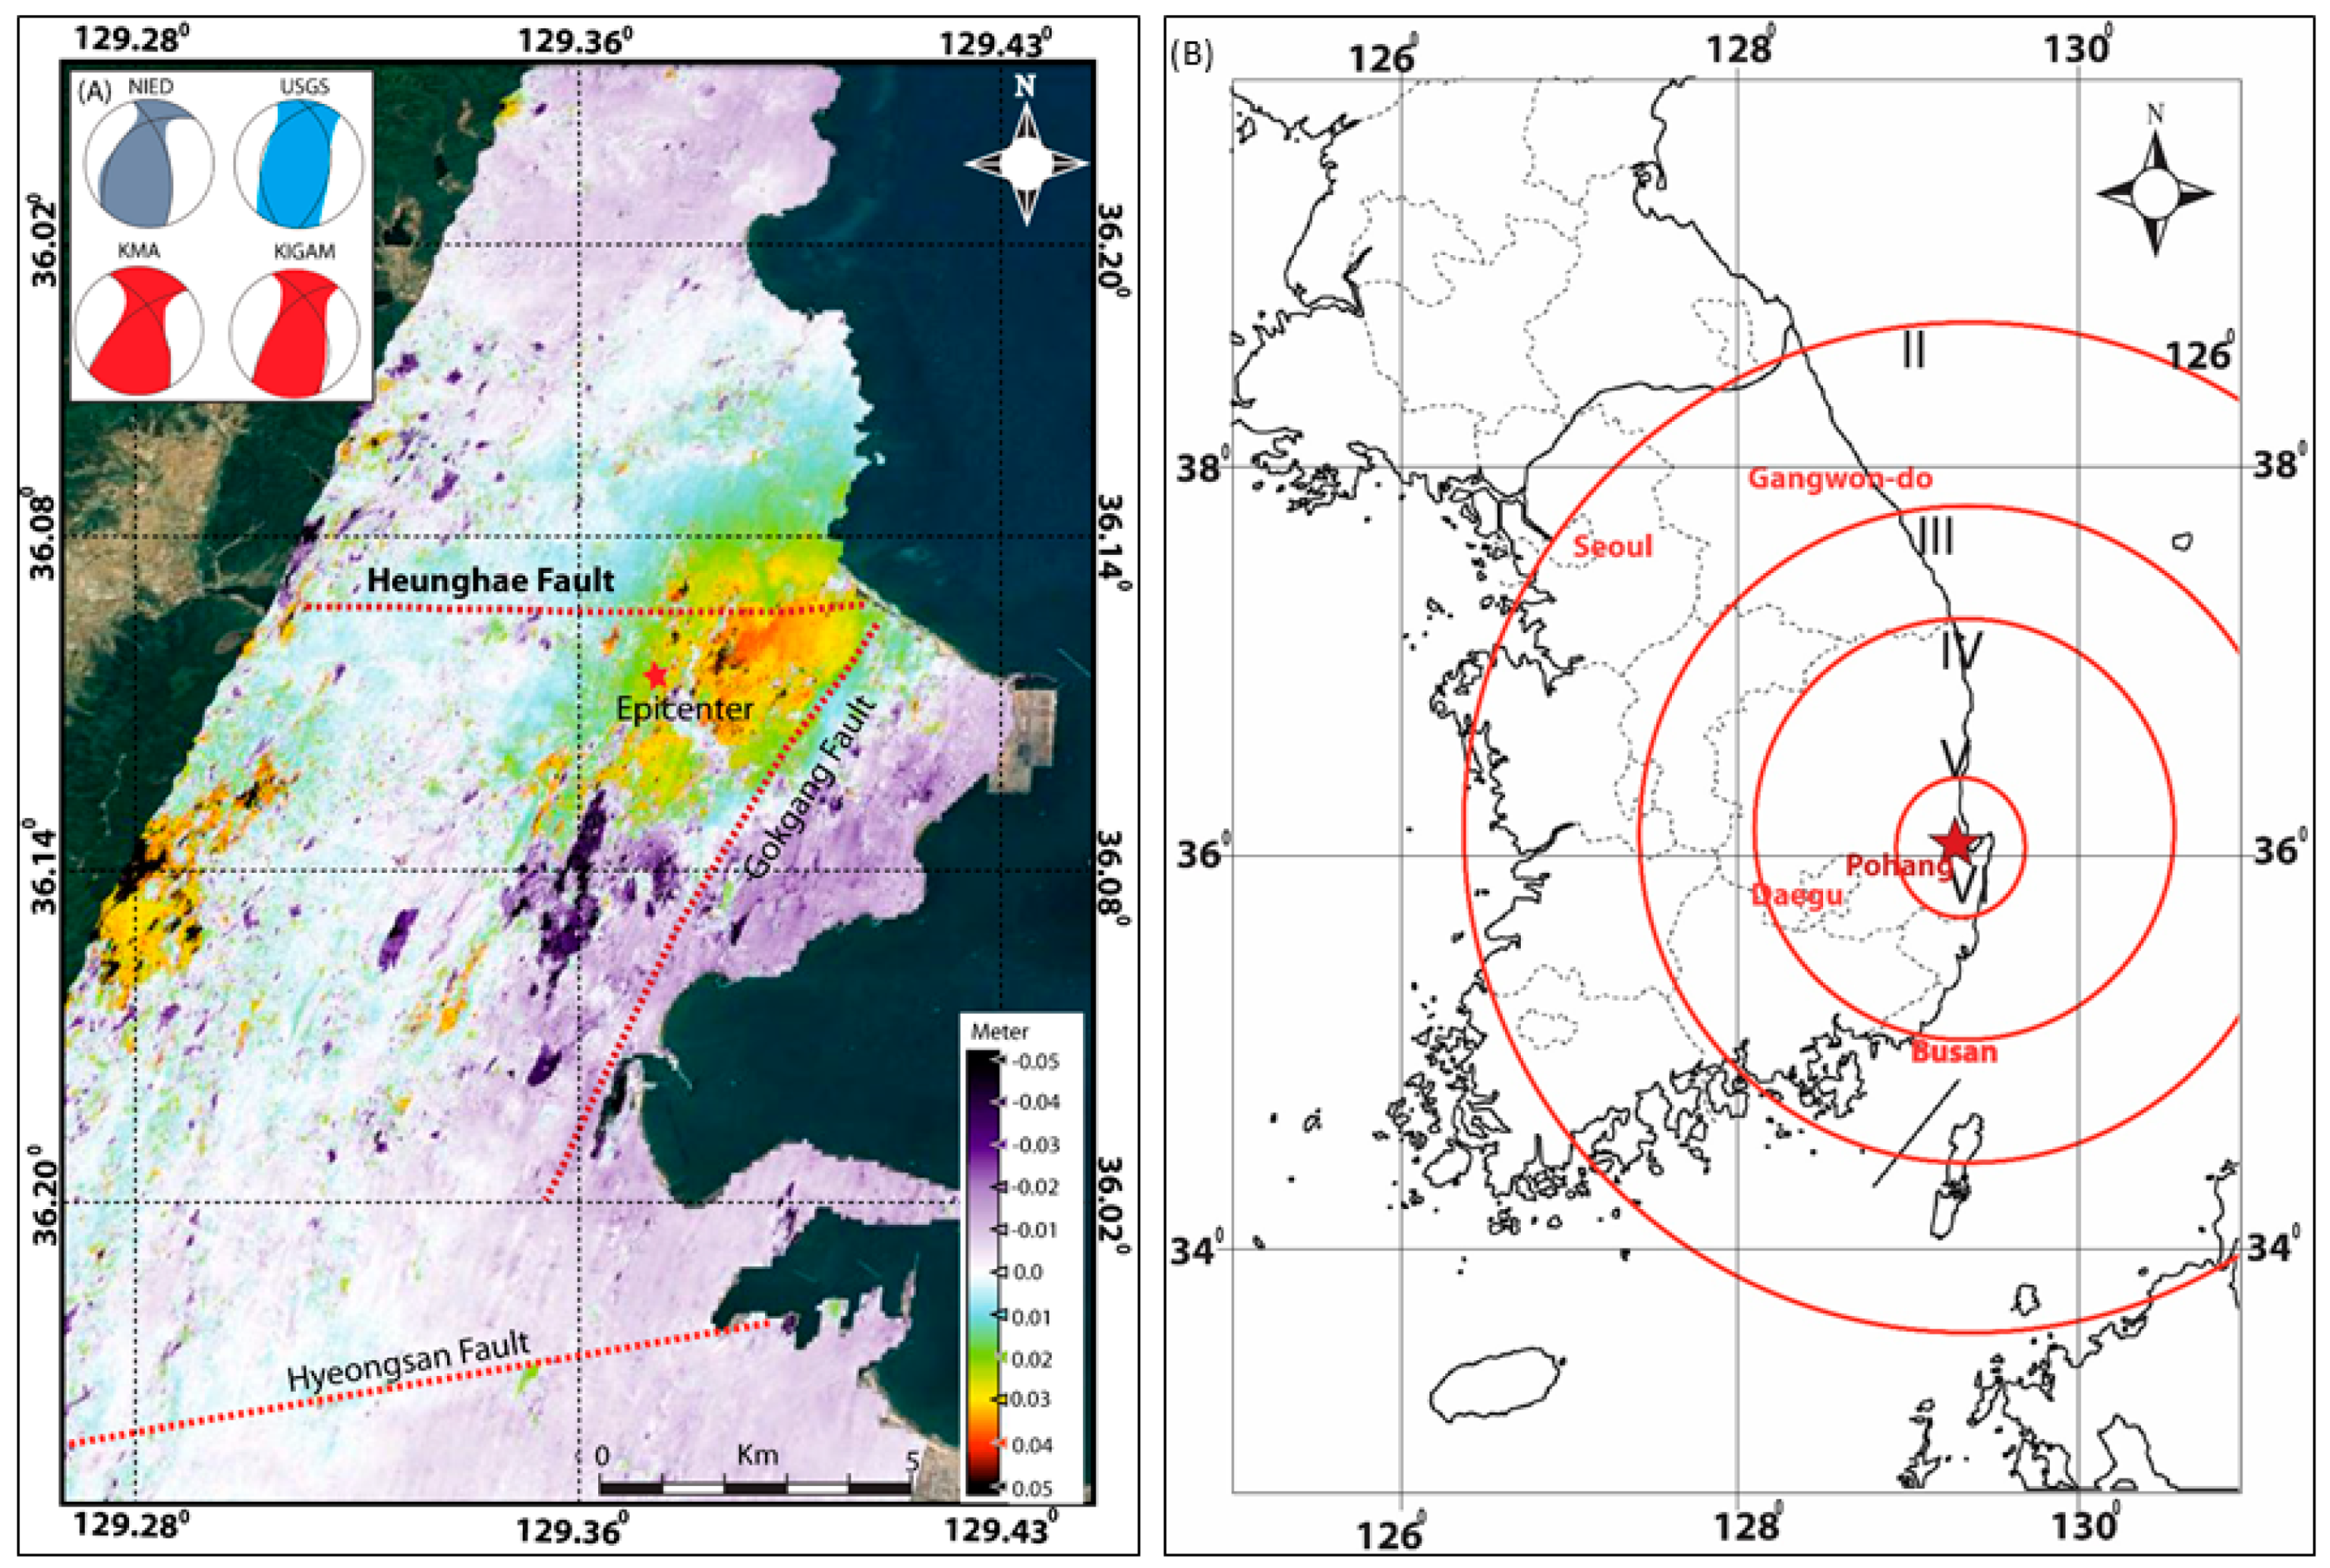
2. General Characteristics of the Pohang Earthquake on 15th November 2017

On 15th November 2017, a moderate earthquake (MW 5.4) occurred in Pohang (36.065° N, 129.269° E) at 2:29 p.m. (Local time). The focal depth was about 4–6 km and associated with a NE-SW striking reverse dominant oblique-slip fault (Figure 1). The main shock was followed by more than 65 aftershocks of magnitude ranging from MW 2 to MW 4.6. The Peak Ground Acceleration (PGA) measured by the nearby seismic station was about 0.58 g, which is very large and almost equivalent to Modified Mercalli intensity (MMI) of VIII to IX (Korean Meteorological Administration (KMA) report [35]). Due to Pohang City’s poor subsoil condition, the seismic wave was amplified while passing through the alluvial soil, making the damage somewhat heavier than the previous Gyeongju earthquakes (ML 5.8; 12th September 2016). There is also no permanent seismic station within the Heunghae basin. Other seismic stations show the following PGA values: Pohang 0.29 g, 10 km from the epicenter; Deokjeong-ri 0.035 g, 29.3 km from the epicenter; and Cheongsong 0.042 g, 49 km away from the epicenter. Because there are no permanent stations close to the epicenter, we have analyzed the temporary stations installed by KMA around the epicenter area after the Main shock to analyze the Horizontal and Vertical Spectrum ratio (HVSR) and the subsoil characteristics. The lower shear wave velocity (120 m/S to 275 m/S, [35]) and higher frequency indicates higher amplification within the Heunghae basin (See Figure S1, Table S1; modified from [35]).
Due to its epicenter within the basin, shallow depth (5 km) and the presence of thick alluvial soil, the earthquake caused severe amplification of the seismic wave and caused extensive damages around the epicenter area. According to the Ministry of the Interior and Safety of South Korea, the Pohang earthquake is the most damaging earthquake in the Korean Peninsula since 1978, which caused injuries to more than 90 people and estimated property damage was about USD 52 million [35]. The earthquake caused damages to 2165 private houses, 227 school buildings, many roads, and 11 bridges.
Although no primary surface rupture was reported during the Pohang earthquake [36], numerous liquefactions and related phenomena were witnessed by local people such as differential settlement of buildings and lateral spreading [36]. Because the liquefaction phenomenon occurred during this earthquake is the first reporting since 1978, it can provide useful information of liquefaction associated with paleo-earthquakes and future earthquakes in the areas of similar geological settings around the Korean Peninsula. It is also a good opportunity for the geological community and geotechnical engineers to consider liquefaction in the seismic hazard assessment for such basins in the near future. Since liquefaction is a rare phenomenon in the Korean Peninsula, understanding the factors (like geological structures) controlling the distribution of liquefaction zone should be taken into consideration for liquefaction zonation mapping.

3. Geological, Geomorphological, and Tectonic Setting of the Area

The Korean peninsula lies on the margin of the Eurasian Plate. During the opening of the East Sea (Japan Sea) (30–15 million years ago), several back-arc basins including Pohang Basin were developed in southeast Korea and adjacent offshore areas [28,37,38]. These basins are bounded by several NNE~NNW-striking strike-slip faults and NNE-NE-striking normal faults. Some of these faults have been reactivated as strike-slip or thrust faults due to the ongoing compression of the Korean mainland [28,37,38].
The Pohang basin is composed of middle Miocene non-marine to deep marine sedimentary deposits of (~20 million years ago) up to ~200–400 m deep. The middle Miocene sedimentary deposits is covered at surface by the recent alluvial deposits (˂10 m). The basement of the Pohang basin is mainly composed of Cretaceous to Eocene sedimentary and volcanic rocks ~1000 m thick (Figure 2) [39,40,41]. The previous studies [42,43,44,45] suggested that Pohang basin is bounded by several normal faults and transfer faults (Figure 2) [38,39]. These normal faults divided the Pahang basin into several small sub basins. The epicentral area which is known as Heunghae basin is a small sub-basin within the Pohang Basin [42,43,44,45] and mainly composed of fluvial deposits.
Recent paleoseismic studies suggested Pohang basin is having seismic threats from the Yangsan fault which one of the prominent dextral strike slip fault around the study area [36] (Figure 2). A recent study reported Paleo-liquefaction features in epicenter area of the Pohang earthquake [40], which indicates that the area has undergone repeated liquefactions. Therefore, it is necessary to explore the role of regional structures in liquefaction phenomenon and distribution characteristics.

4. Coseismic Damages Within the Meizoseismal Area

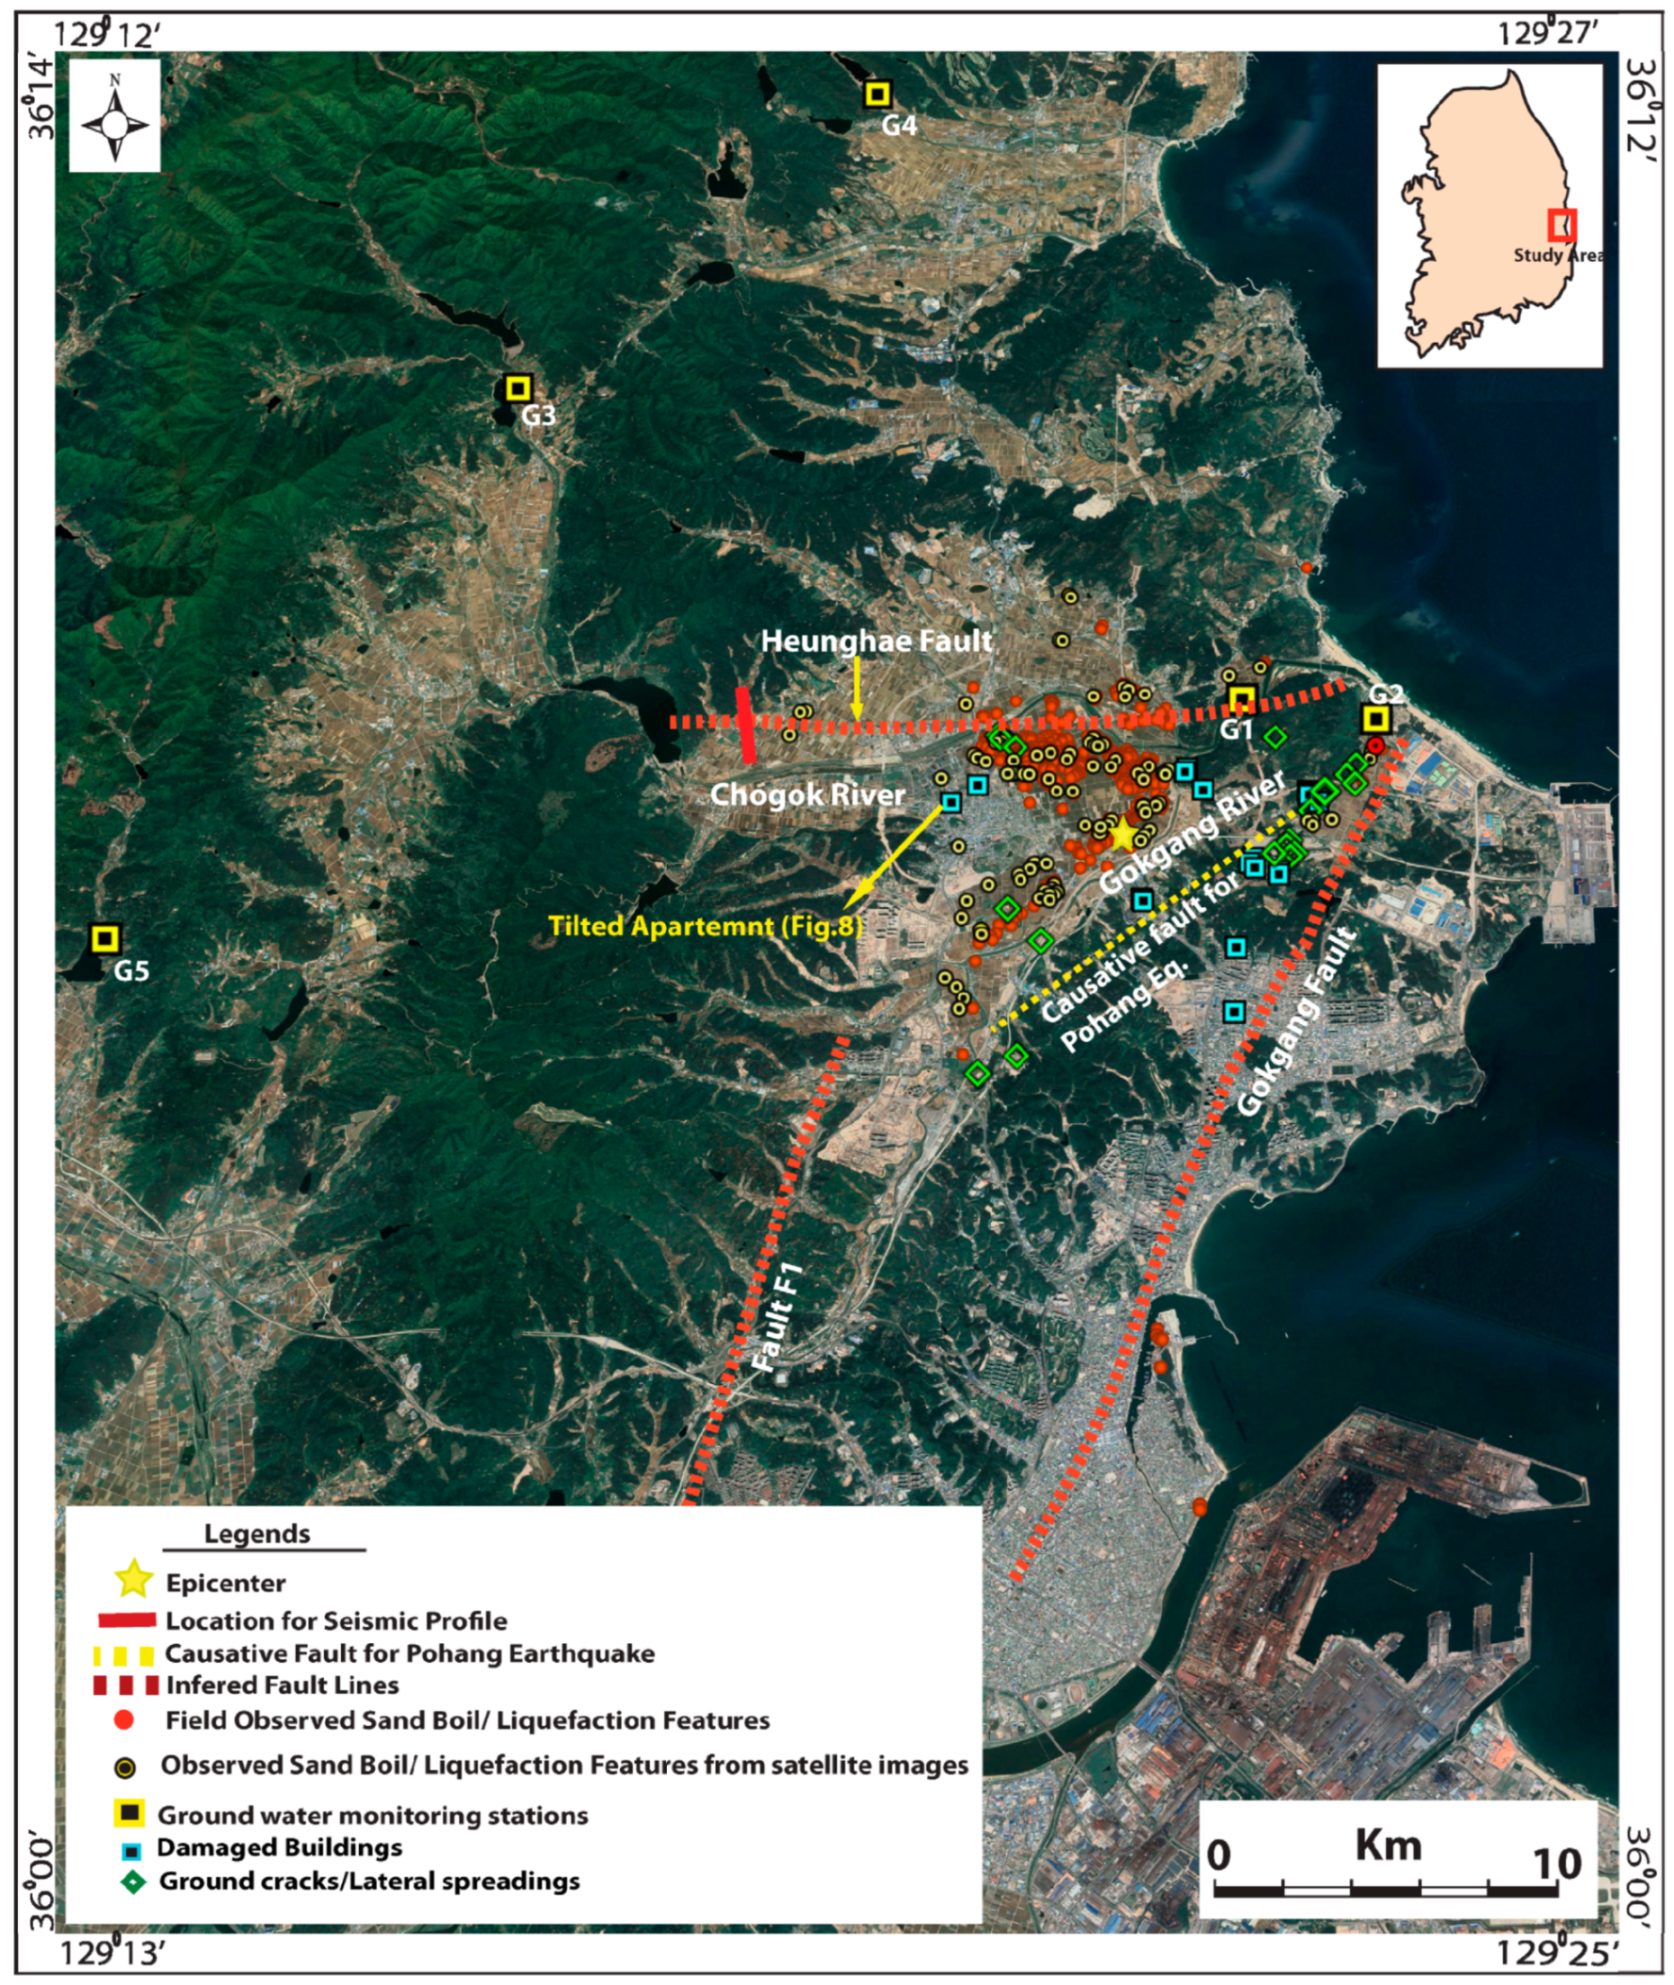
4.1. Mapping of Liquefaction and Related Features

Major striking features associated with the Pohang earthquake were the occurrence of severe liquefaction, structural damages including residential and academic buildings, as well as lateral spreading/ground cracks. Because this is the first earthquake related liquefaction in the modern seismic history of Korea, the field survey and mechanism involved will help to guide us for the future liquefaction hazard analysis and assessment [36]. For the detailed documentation of ground deformation features (sand boils, cracks, damaged buildings, etc.), we have used Pleiades high resolution satellite images with a spatial resolution of 0.5 m, which was taken one day after the earthquake and provided by the International Charter [36]. The data collected from the Pleiades satellite were complemented by a five-week field survey and Unmanned Air Vehicle (UAV) images taken by Phantom 4 UAV images. The high-resolution UAV images taken from the Heunghae basin were merged using Pix4D software, and high-resolution Digital Surface Model (DSM) of ~2.5 cm resolution has been constructed using ArcGIS 10.0.
During the field work, we performed a detailed field survey that catalogued sand boils, lateral spreading, and damaged buildings. In addition, an interesting phenomenon i.e., waterlogging from the rice fields around the epicenter area was observed immediately after the earthquake. To observe the ground water level fluctuation associated with the earthquake, we have collected the hourly basis ground water data for a span of 11 days (before and after the earthquake) from the ground water monitoring wells installed by the Korea Rural Community Corporation, which monitors the quantity and quality of ground water and provides the information to the general public. In the following section, we have provided an overview of the coseismic ground deformations observed during the Pohang earthquake.

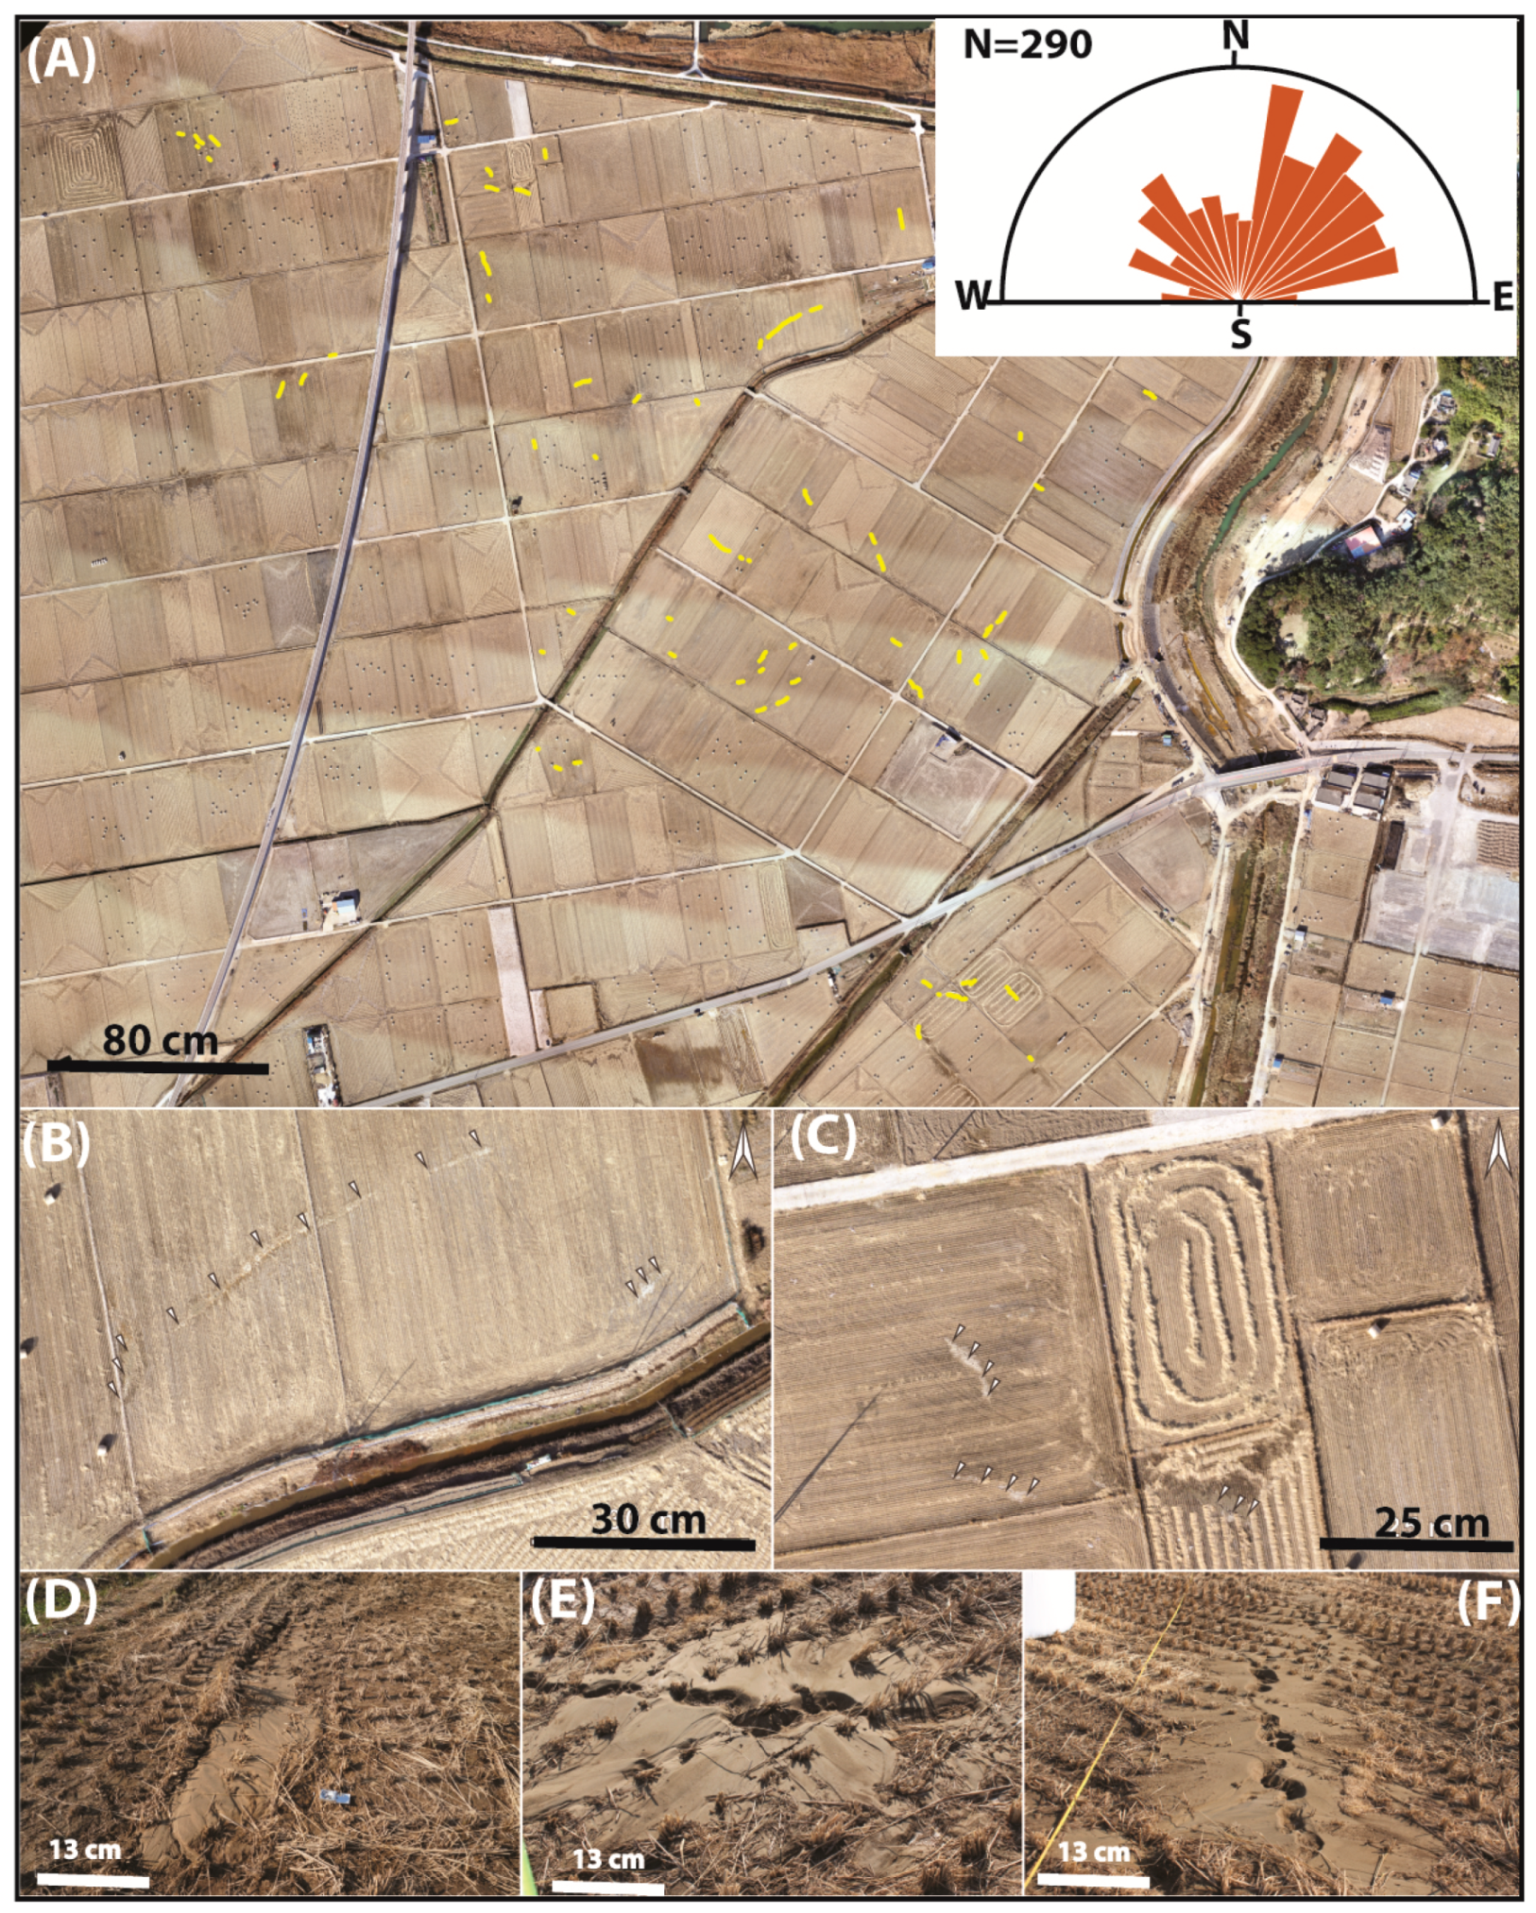
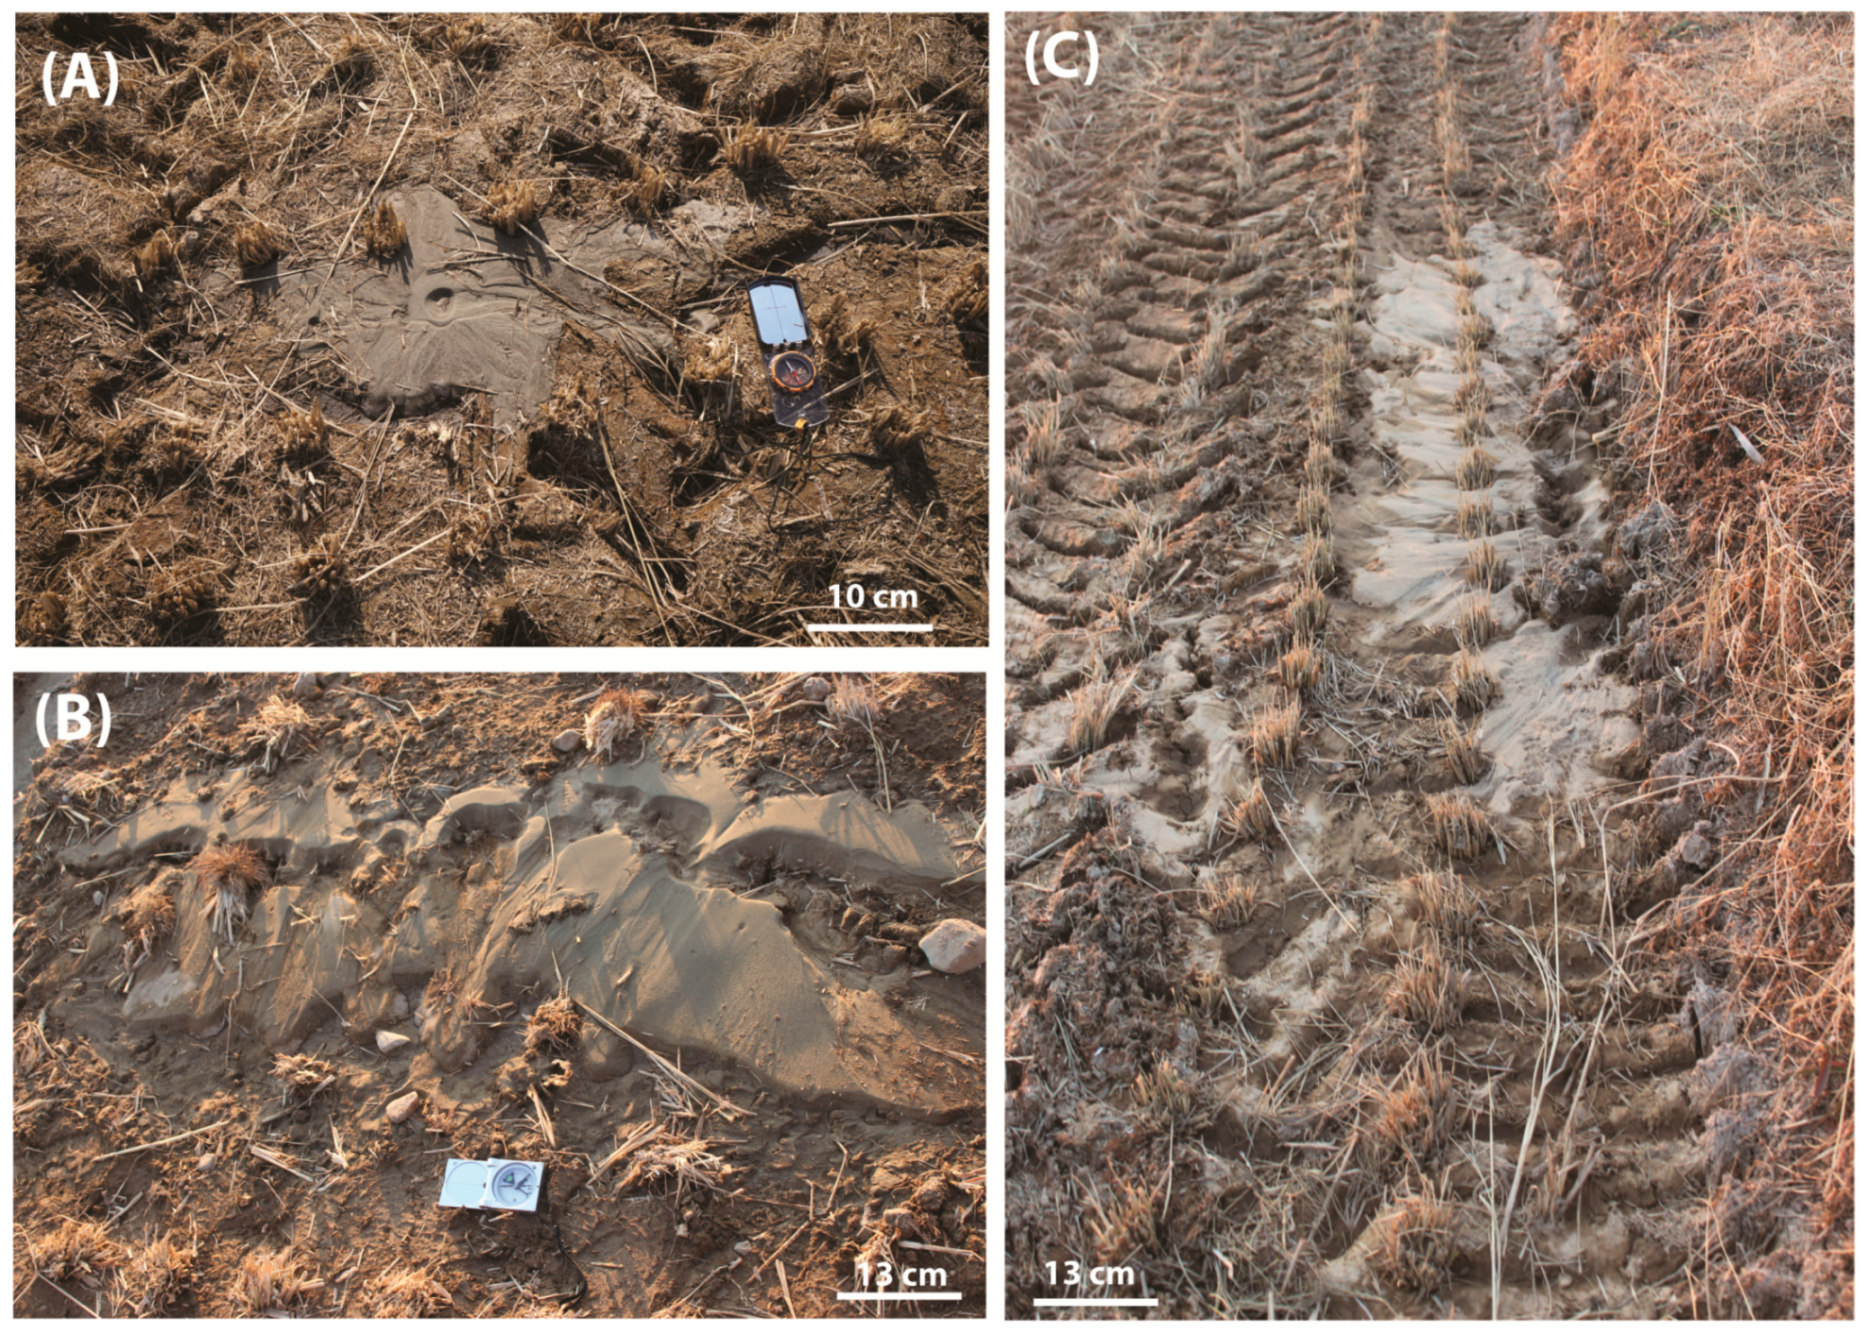
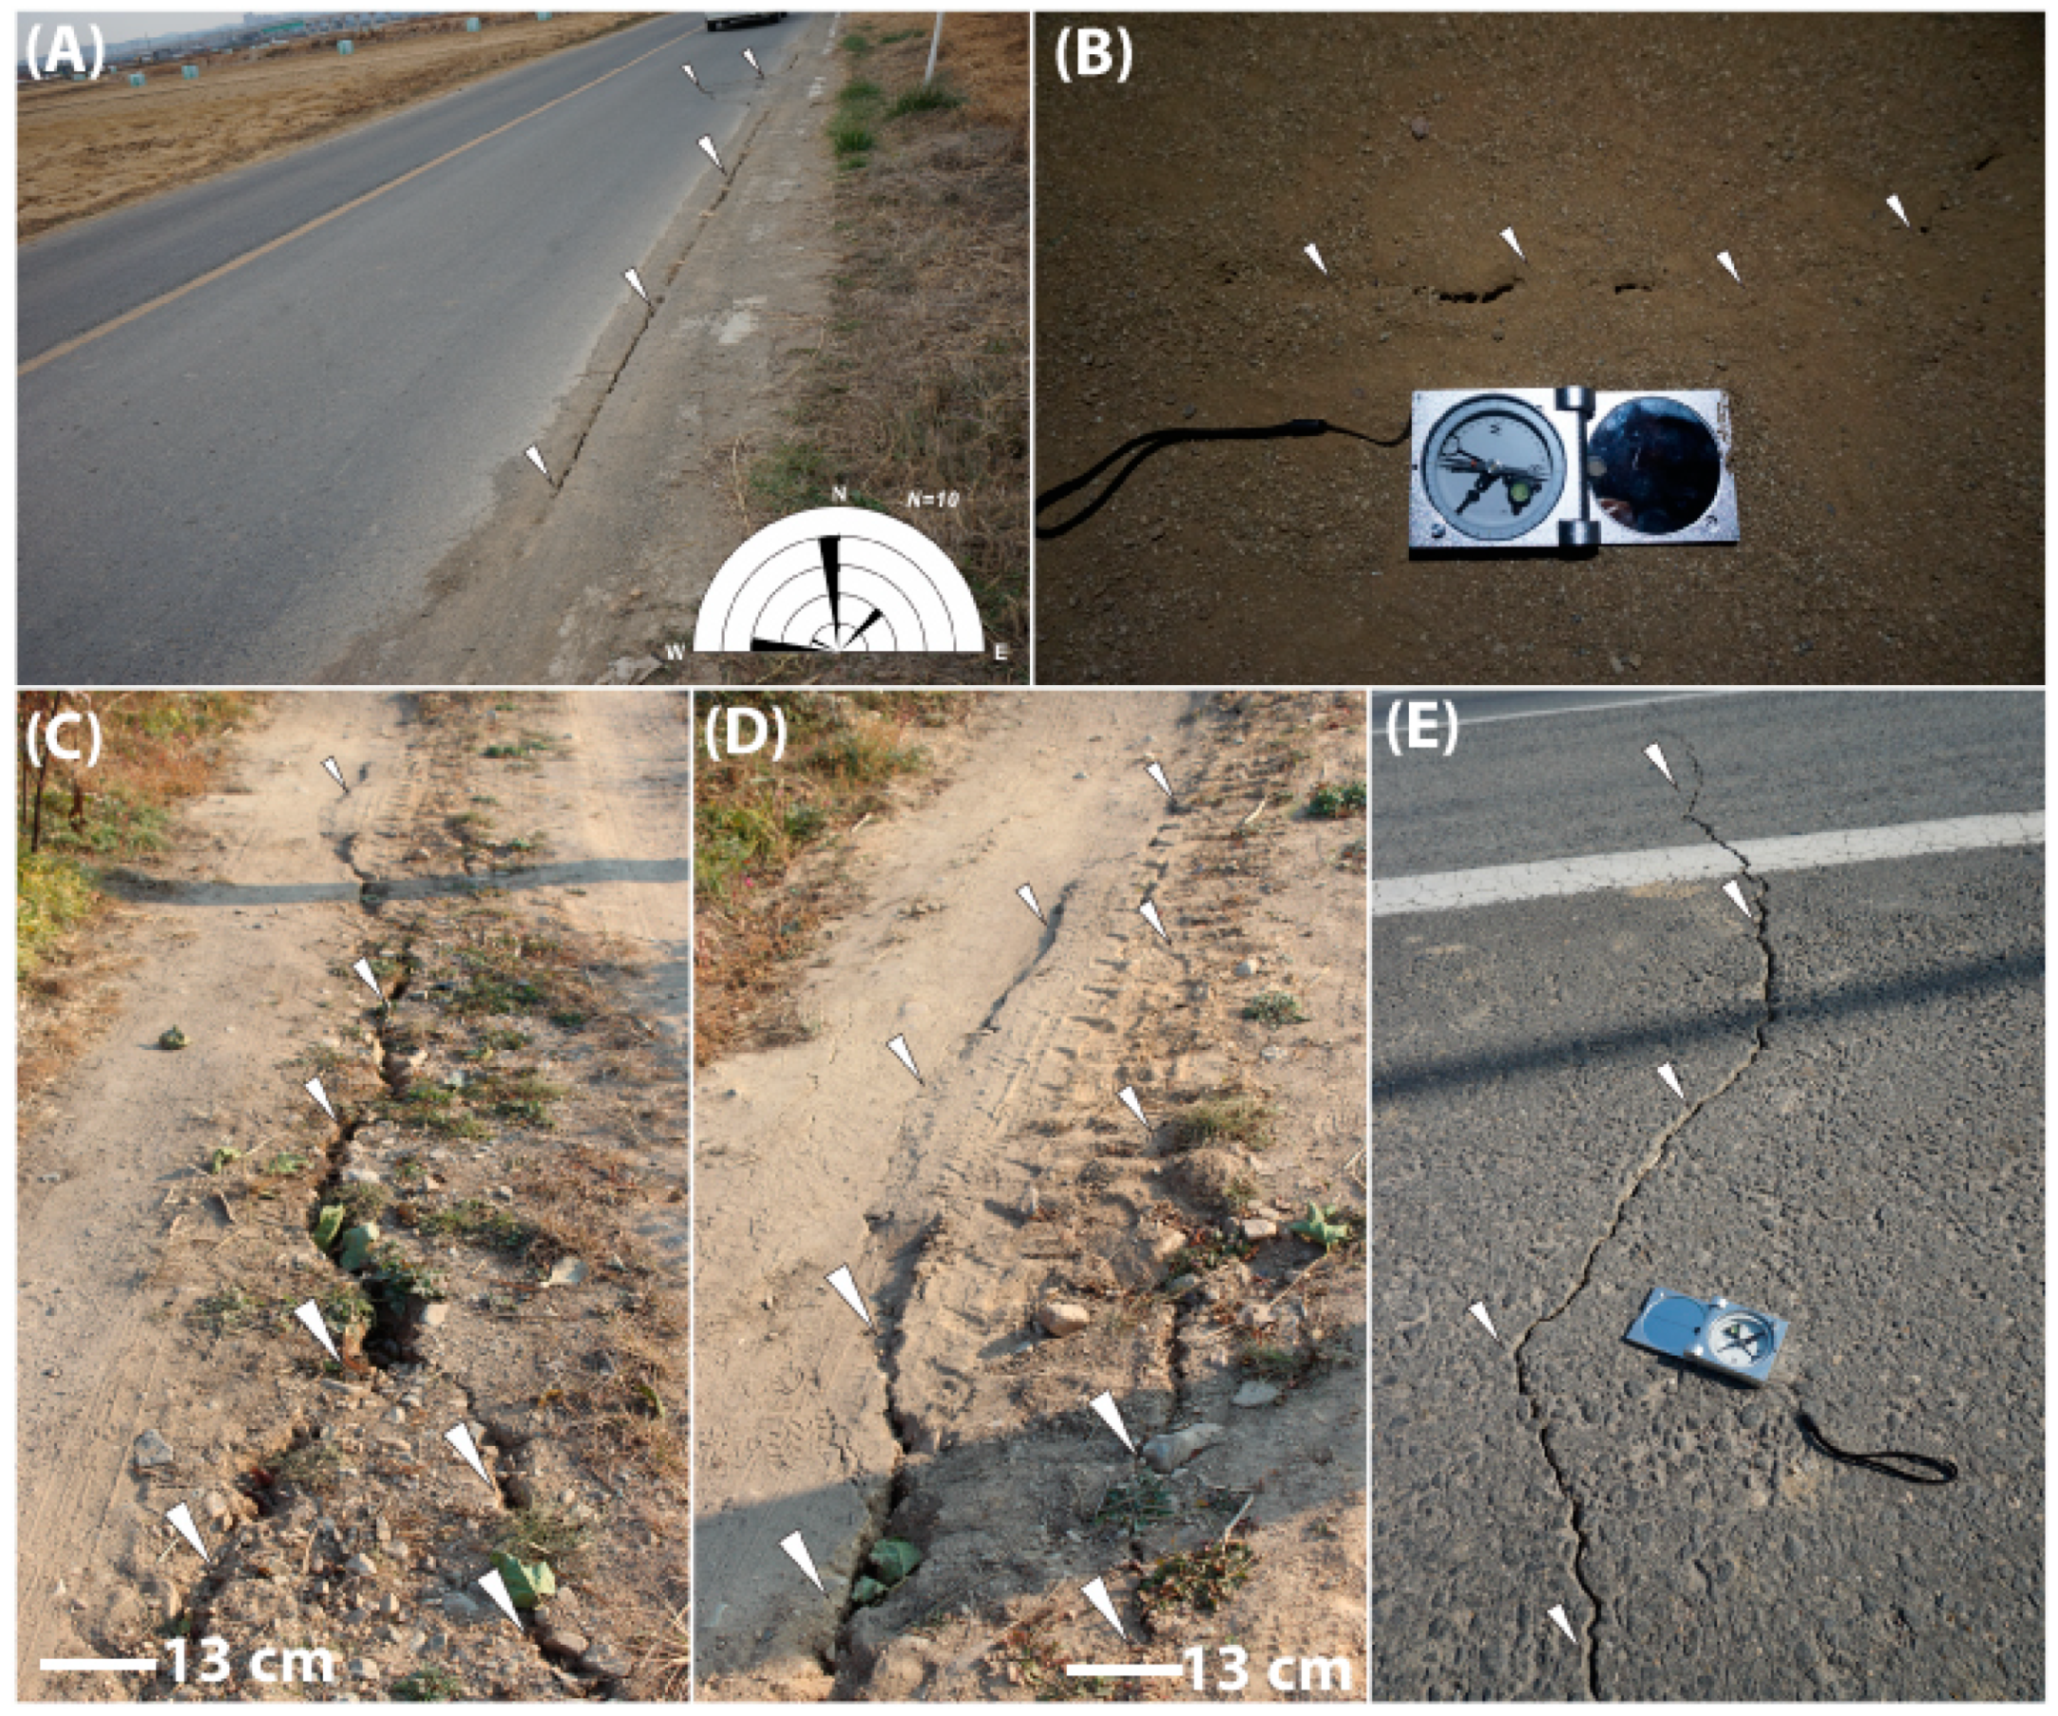
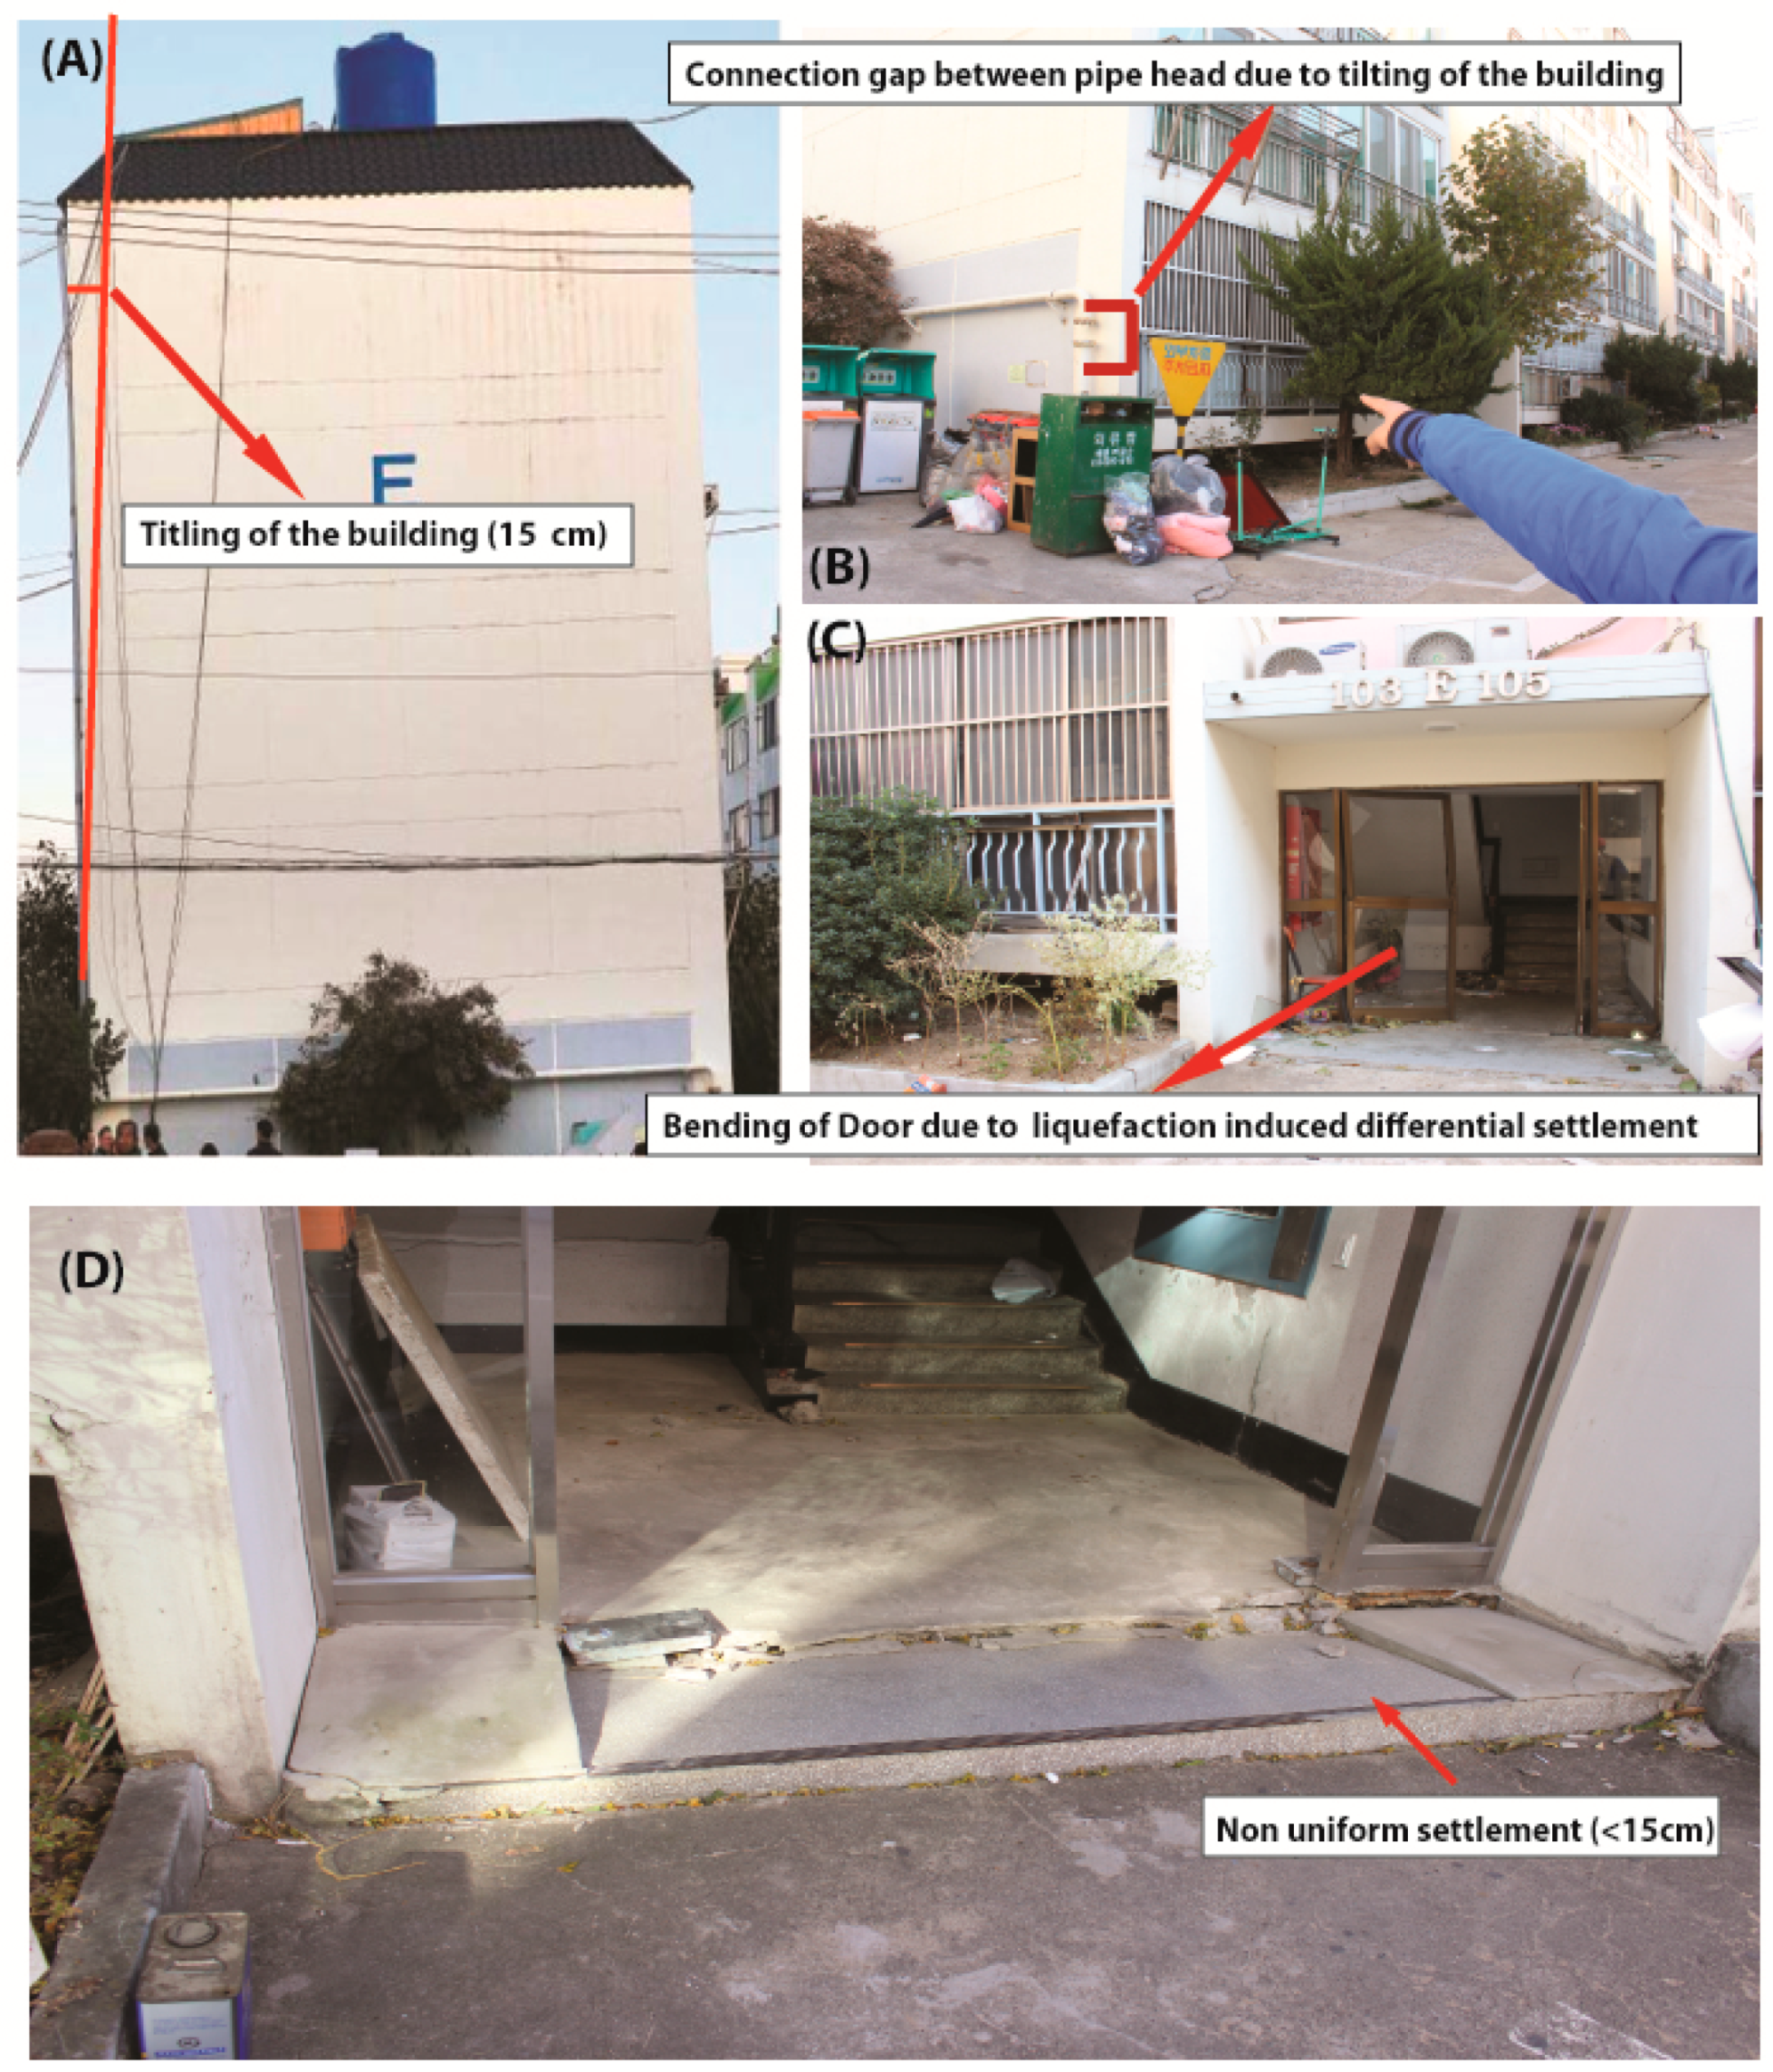
4.2. Liquefaction Features, Building Damages, and Ground Cracks

Our field survey area covers a zone of 8 km length in E-W direction and 3 km wide in N-S direction around the epicenter. We have incorporated an integrated survey for the present study, which includes the use of high-resolution satellite images, UAV images, and detailed field survey.
The Pleiades image (0.5 m resolution) and UAV images were used for the mapping of sand boils/ground cracks that are larger than the spatial/ground resolution of the images. It was confirmed by the field survey and additional small features during the five-week detailed field survey. Within the epicenter area, most of the sand boils and lateral spreads were observed in the agricultural land or along the cracks between the concrete canal walls and agricultural lands having a gentle slope (≤5%) (Figure 3). Most of the sand boils are confined between the Gokgang River and Chogok River where the area is generally composed of Quaternary deposits. Eyewitnesses reported water and sand spouting from those cracks, isolated sand boils within the agricultural lands, and some of the riverbeds.
Field observations and DSM images allow us to identify several kind of liquefaction features such as liquefaction in gravelly soil, isolated circular to semicircular sand boils, aligned sand boils, en-echelon patterned sand boils, and linear sand boils along artifacts (Figure 4). We have collected data sets for more than 600 liquefaction related features and phenomena, out of which more than 70% data sets were assigned to liquefaction, 23% were assigned to cracks/liquefaction, and 7% were assigned to building damages due to liquefaction or shaking.
The individual sand boil diameter ranges from few centimeters to more than 2 m. The orientation of the linear chains of the sand boils measured in the field are plotted on the rose-diagram, which shows three main directions of ejection (Figure 4). From the rose diagram of liquefaction features, two preferential trends can be inferred, i.e., NNE-SSW and NE-SW (our datasets combined with [40], Table S2; [40]). Based on the surface expression of the sand boils, the liquefaction features can be classified into two categories: (a) solitary or clustered very flat in nature (diameter from a few cms to 1–2 m) or (b) water and sand/gravel mixtures ejected using preexisting cracks as their pathways to the surface induced by seismic shaking (Figure 5). Similar types of sand boils have been reported during 2005 Kashmir earthquake in India (Mw 7.6), 2008 Wenchuan earthquake in China (Mw 7.9), 2011 Yingjiang earthquake in China (Mw 5.4), and 2011 Tohoku in Japan (Mw 9.0) earthquake [16,46,47,48], respectively.
The farthest liquefaction feature observed during the Pohang earthquake is 15 km away from the epicenter, which is relatively far away, but is probably related to the shallow focal depth. Considering this point, it is more or less consistent with the empirical relationship developed on the basis of recorded liquefactions from global earthquakes, including both large and some moderate earthquakes.
The presence of more than 600 liquefaction features within a radius of 3 km from the epicenter during a moderate magnitude earthquake (MW 5.4) indicates that the Heunghae basin and the Pohang area are susceptible to liquefaction. More detailed liquefaction hazard mapping is required for this area [25,27,47,49,50,51].
During the field work after the earthquake, we collected ejected sand samples from the sand boils and from the drilled borehole conducted by Pusan National University, in order to analyze and classify grain sizes. We have taken the representative sand samples from one of the biggest sand boils and from the bore hole, which was drilled within the sand boil observed at the center of the Heunghae basin. Both the sand samples were collected within the 500–700 m radius of the epicenter area.
The grain size analysis of the ejected soil samples and sand samples collected from the borehole has been carried out as standard ASTM D6913. The analyzed grain sizes were plotted on the curve proposed by Tsuchida [52] for the possibility of liquefaction (Figure 6). The grain size analysis suggests that sand samples from the ejected sand boils and borehole have an identical nature with more than 90% of grain size between 4.75–0.075 mm and fall within the zone of most liquefiable soil in the potentially liquefiable soil range. Thus, liquefaction hazard zonation study is required for the soils of the Heunghae Basin.
Differential settlement and lateral spreading were most widely observed phenomena during this Pohang earthquake like other earthquakes around the world. The lateral spreading was observed around the levees, shore lines and reclaimed lands for construction purposes, road embankments with soft soil and some portions of agricultural lands (Figure 7). The dimension of the cracks varied from a few meters to 10 s of meters in length. Most of the cracks developed in the N-S direction.
The Pohang earthquake caused damages to more than 2000 individual houses and school buildings. Some of the houses close to the epicenter were tilted about 15 cm towards the north and the balcony of the ground floor got subsided more than 30 cm. Referable to the tilting of the building, some of the doors in the ground floor got buckled (Figure 8). Additionally, a church building near the epicenter area got tilted about 10 cm due to ground subsidence, accompanied by liquefaction.
One of the field photographs of the titled apartment building shows that the two ends of the gas pipeline connected to the apartment got separated about more than 15 cm due to the titling (Figure 8B). The liquefaction and lateral spreading damages to residential buildings and schools during this earthquake indicate that the Korean building code needs to be revised and should include the factor of safety against liquefaction (FSL) as an important parameters of seismic resistant building design.

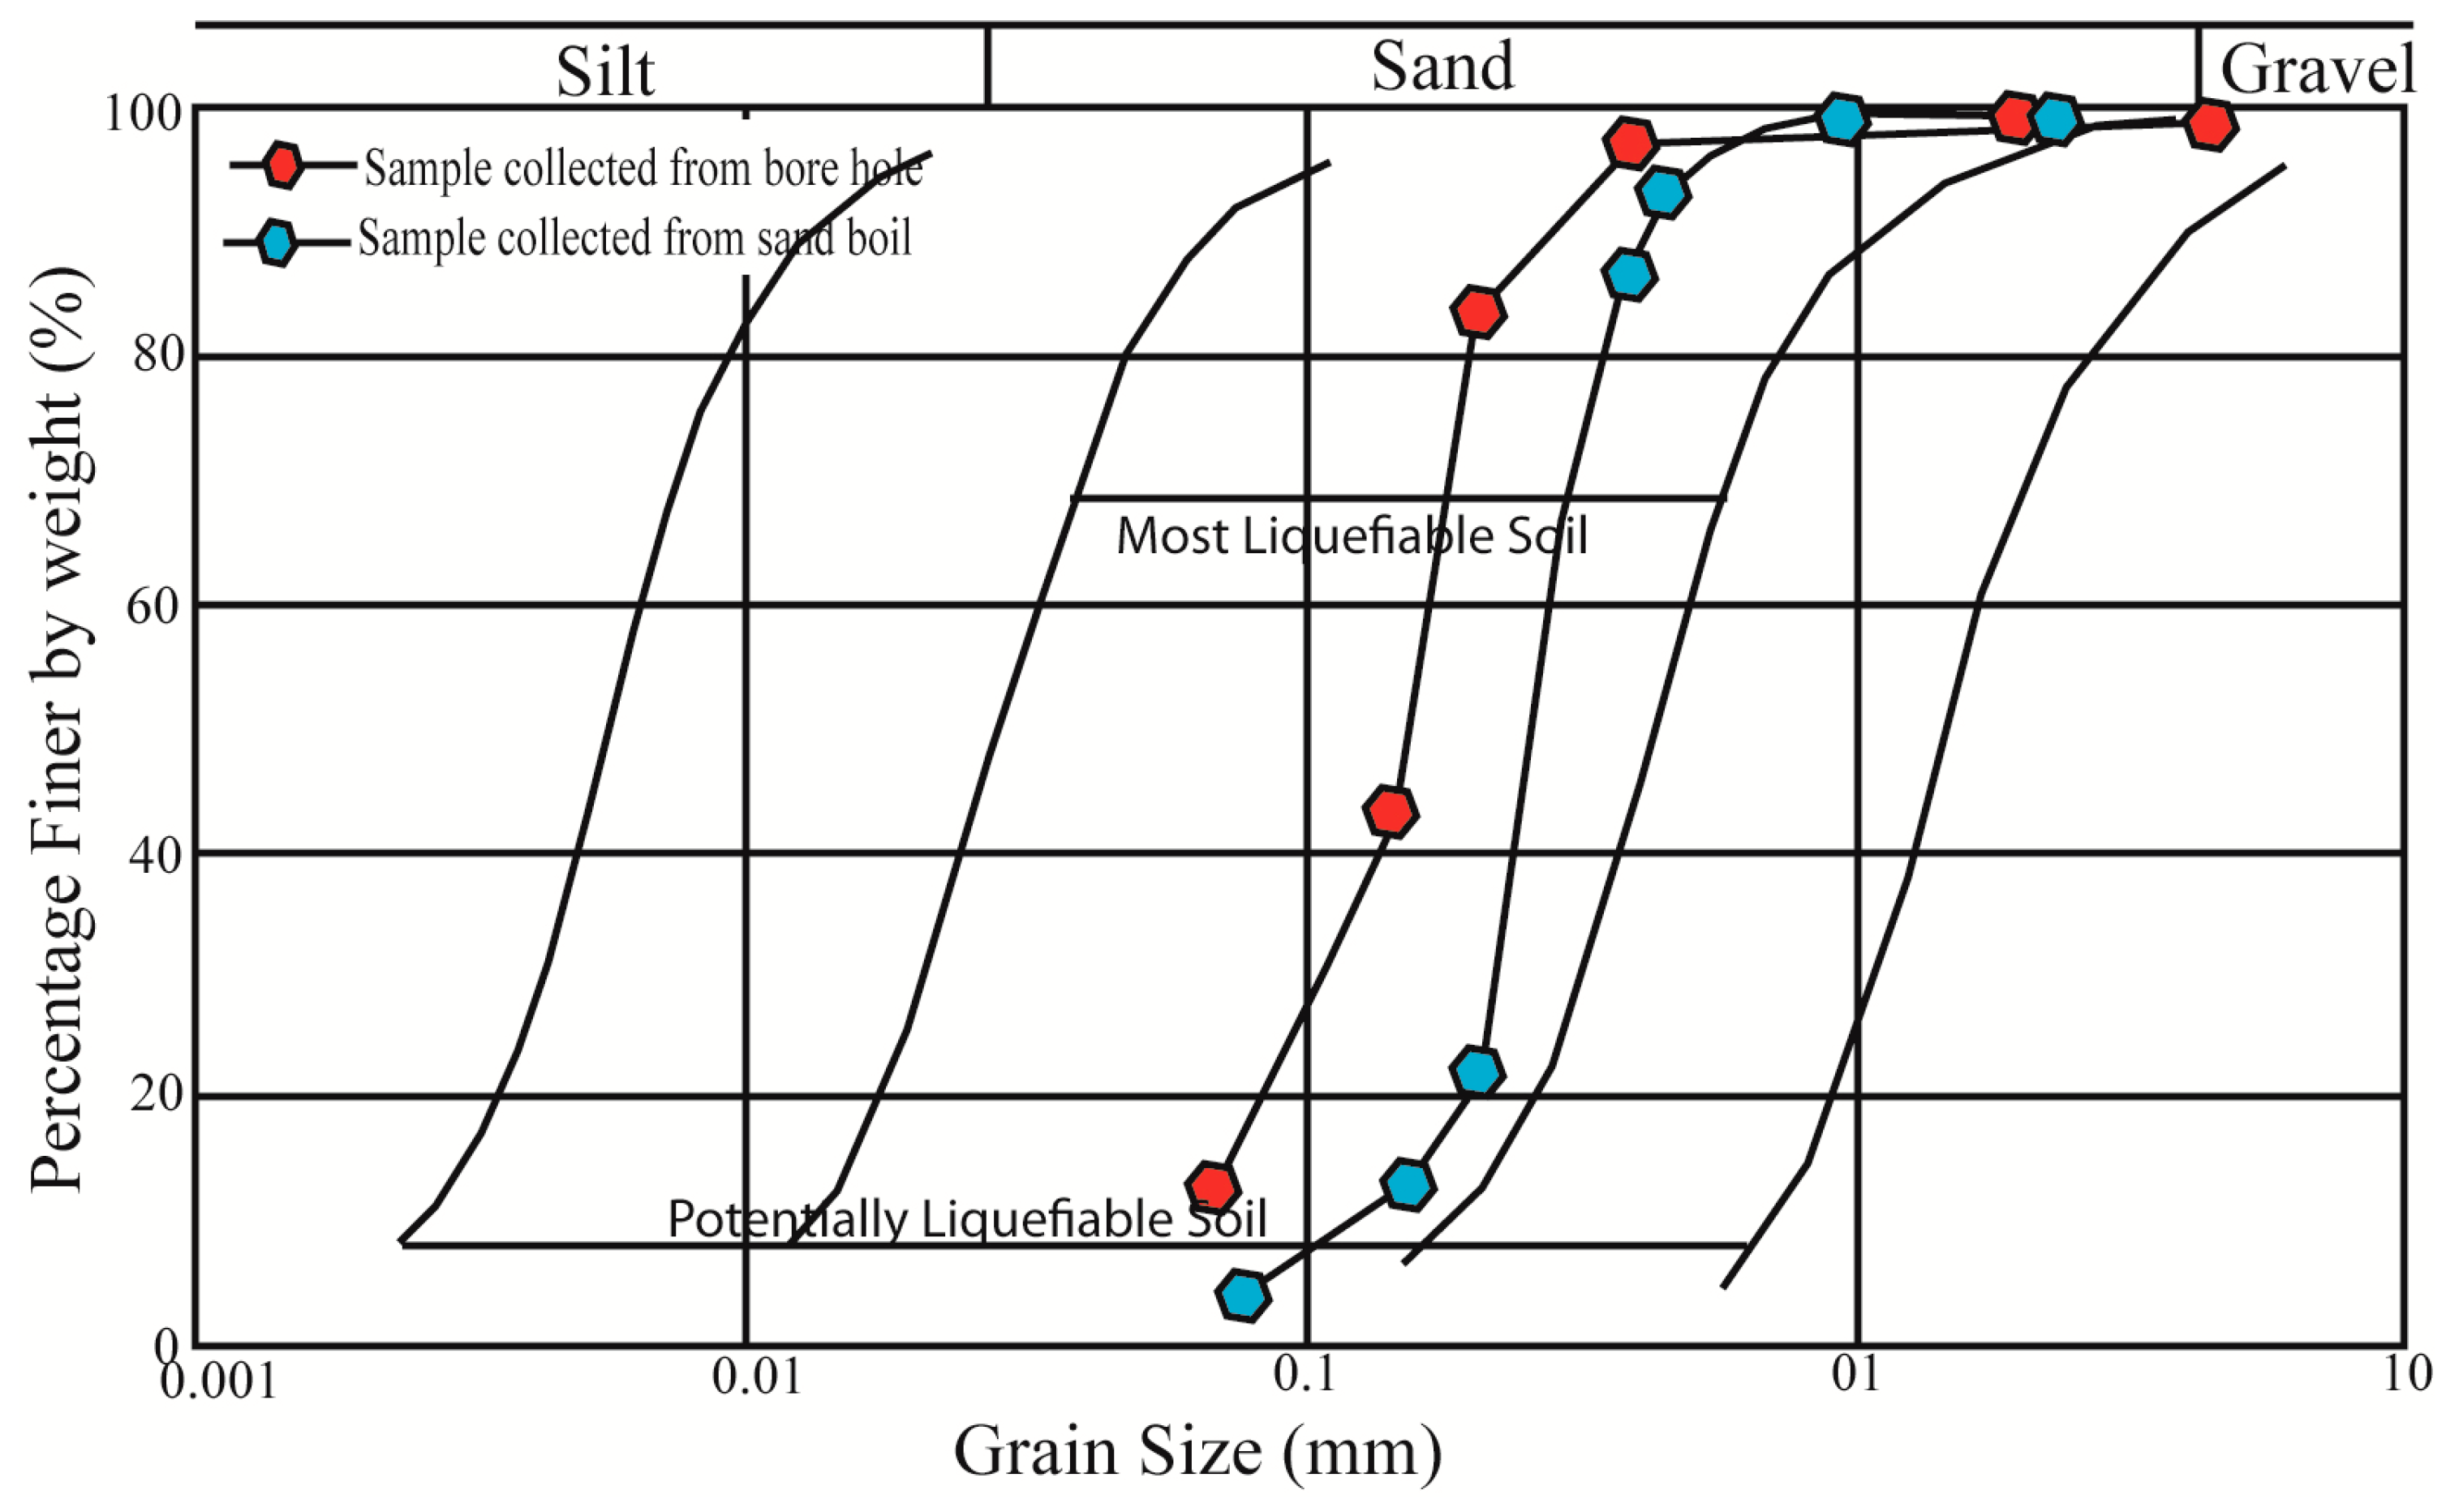
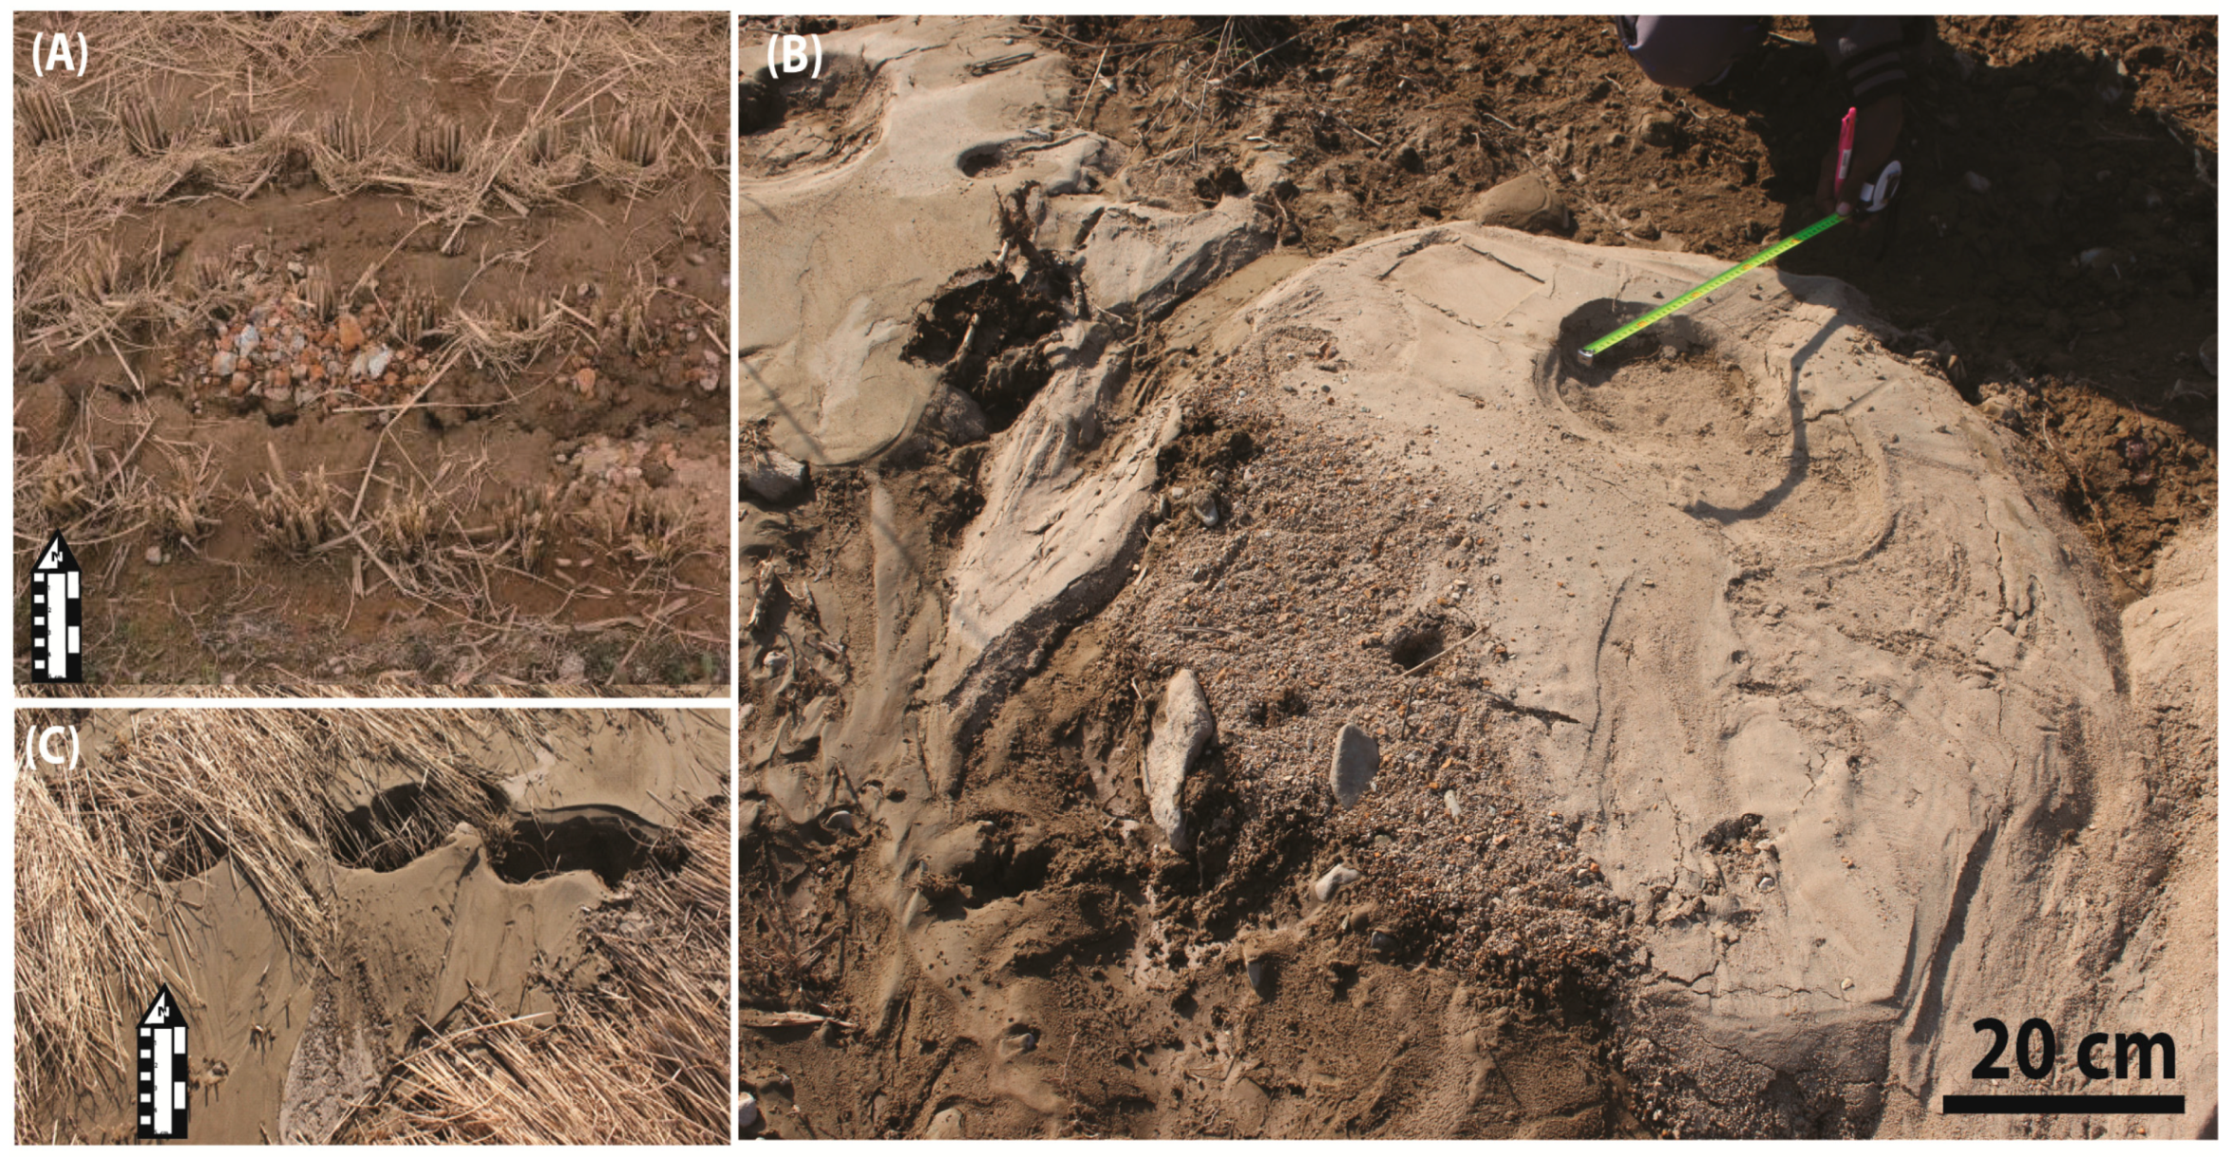
4.3. Liquefaction of Gravelly Soil

During the recent Mw 5.4 Pohang earthquake, we have observed evidences from the field of gravelly soil liquefaction in the river bed and in the agricultural land (Figure 9). The diameter of ejected gravel varies from 1 cm to ˂ 4 cm. Liquefaction of sand or silt during an earthquake is common, but liquefaction of gravelly sand is very rare, specifically during an earthquake of magnitude Mw ˂ 5.5, such as the Pohang earthquake. This phenomenon has been reported by a few earthquakes in recent history, such as the 1976 Friuli earthquake in Italy (Mw 6.5), 1983 Borah Peak earthquake in the USA (Mw 6.9), 1994 Hokkaido earthquake in Japan (Mw 7.7), 1995 Kobe earthquake in Japan (Mw 6.9), 1999 Chi–Chi earthquake in Taiwan (Mw 7.7), 2008 Wenchuan earthquake in China (Mw 7.9), and 2011 Tohoku earthquake in Japan (Mw 9.0) [7,53,54,55,56,57,58,59].

4.4. Water Logging and Ground Water Fluctuations

The liquefaction features associated with the Pohang earthquake were mostly confined between the Gokgang River and Chogok River (Figure 3). It may indicate that the shallow ground water level and soft sediments around the rivers are the main controlling factors to this liquefaction. The physical appearances of the ejected soils from the sand boils and borehole (Figure 6) suggest that the soils in the study area are prone to liquefaction.
The amount and consistency of water spring and logging in the agricultural fields, which lasted several days after the earthquake [60], indicate the significant rise of the water table during the earthquake. It is a rare phenomenon during medium scale earthquakes, although a similar water ejection phenomenon was reported during the Wenchuan earthquake in China, which was a large magnitude earthquake of MW 7.9. It is likely that the Pohang earthquake must be an unusual case to raise the water table seriously and cause extensive water logging and liquefaction associated with a medium scale earthquake. It indicates that the ground water within this area is geologically highly confined.
To confirm the reason for the water table variation, we have collected and plotted hourly based ground water data for 11 days from three respective monitoring wells around the epicenter area of the Pohang earthquake. The variation of the water level from the ground water monitoring stations (Figure 10) is evident on the date of the earthquake. From the figure, it is evident that the station closest to the epicenter and situated within the Heunghae basin (G1) shows a sudden rise in water level (~0.5 m) during the time of earthquake followed by a decrease in water level and taken several days to be normalized to the regular level. Other monitoring wells (G3, G5, located at higher elevation than the G1) shows a sudden drop in water level (~0.3 m) at the time of the earthquake and takes two days to revert back to the original level. Though there is an interesting ground water response to the earthquake, it is necessary to do more detailed analysis which is beyond the scope of the present work.
On the basis of preliminary observation from the water level fluctuations of the monitoring wells and local residents’ reports, the observed hydrologic phenomenon might be relevance to the earthquake.
It is well known that water wells respond to the seismic activity near field as well as far field [13,60,61,62], which depends upon different geological conditions and the location of the monitoring wells within the epicenter area. Several studies suggest [13,60,61,62,63,64,65] that the rise or fall in water level in the monitoring wells is related to the elastic volumetric compression or expansion of the well aquifer system caused by seismic waves, but steep rise or fall in the water level may also be related to coseismic changes in the well aquifer media.
Though we have limited ground water data, we think the difference in behavior of the monitoring wells was controlled by two factors: (1) change in the static stress field and (2) local geological changes triggered by earthquakes. The ground shaking may cause the rearrangement of unconsolidated sediments favoring compaction, which has led the rise in the water table (case of G1), as well as the opening or closing of the deeper aquifer system due to seismic shaking that might have caused the water level drop or rise (case of the G3 and G5) [63,64,65]. A similar phenomenon was also observed around the epicenter area of the 1980 Irpinia earthquake in Italy (Mw 6.9), 1989 Loma Prieta earthquake in the USA (Mw 7.1), 1998 Pymatuning earthquake in Pennsylvania, USA (Mw 5.2), and 2009 L’Aquilla in Italy (MW 6.3) earthquake [63,64,65].

5. Discussion on Geological Aspects of the Mechanism Involved in Liquefaction

The distribution of sand boils, lateral spreading, and cracks allow us to relate the damaging features to the geological structures in this area. For instance, most of the liquefaction sites were clustered between the Gokgang River and Chogok River, and towards the south of the Heunghae fault. The higher concentrations of liquefaction in the southern part of the Heunghae basin suggest that the ground motion duration or amplification was higher in that area. Liquefaction is one of the main responses to seismic waves. Furthermore, the clustering of the liquefaction features in this area may indicate that the seismic waves were also controlled by geological structures. Based on previous studies and our fieldwork, the Heunghae fault and an inferred blind fault (Figure 1, Figure 3, and Figure 11) generating this earthquake are the major structures in this basin, which might strongly contribute to releasing the generated seismic waves.
To examine the role of geological structures, especially related to the Heunghae fault [38,62] in the liquefaction feature distribution, detailed literature review and field studies have been carried out. Previous studies [38,66] reported that the Pohang basin is bounded by several E-W trending faults, which offset the tertiary formations and merged to the Yangsan fault. These faults are named as Hyongsan fault and Heunghae fault, which divide the Pohang basin into several sub-basins. During the post-earthquake survey, we were able to find several evidences of NE-SW striking small to medium scale normal faults in the northern part of the Heunghae basin with a fault gouge of 1-5 cm thick (see Figure 3 for the location and Figure 11 for the evidences of faults in seismic profile). These faults probably are subsidiary faults of the E-W trending Heunghae fault, because the structural parameters of these faults are well matched with the previously mapped Heunghae fault. The main Heunghae fault might have been covered by the basin fill deposits and was not clearly traced.
To confirm the existence of the main Heunghae fault within the basin, a shallow subsurface seismic refraction survey has been carried out using OYO McSeis SX 1125 instrument (Tsukuba, Japan) with 24 channel (28 Hz) seismographs. A Sledge Hammer was used for generating seismic waves at the surface and after recording the data it was processed using SeisImager software. The 1 km long seismic survey was taken perpendicular to the Heunghae fault towards the western margin of the Heunghae basin (see Figure 3 for location of seismic survey). The same 1 km long profile has been divided into six divisions (SP-1 to SP-6). The geophone spacing was taken at 5 m for SP-1 and SP-6, and 7.5 m for SP-2 to SP-5. The data processing of the seismic survey is mainly based on seismic refraction tomography techniques, as well as inverse travel time modelling of the refracted seismic waves. Using the estimated velocity (1.6–3.6 km/S), we have detected unconsolidated basin fill deposits lies from surface to 10 m deep, and consolidated basin deposits or weathered rock has been detected from 10 m to 80 m deep (Figure 11).
On the basis of seismic profile and velocity difference, we have detected two south dipping normal faults which could be the traces of the Heunghae fault, which is well matched with the field data collected. The seismic profile and field evidences of normal faulting along the Heunghae fault is shown in Figure 11. We argue that this fault played a role in the passage of seismic waves and amplifications within the Heunghae basin and the distribution of liquefaction features. Moreover, the mountain basin effect may do play an important role in extensive liquefaction within the basin and the distribution of sand boils (Figure 3 and Figure 11) [11]. On the basis of these observations, we will discuss the possible mechanism involved in the liquefaction and its distribution within this study area in the following section.

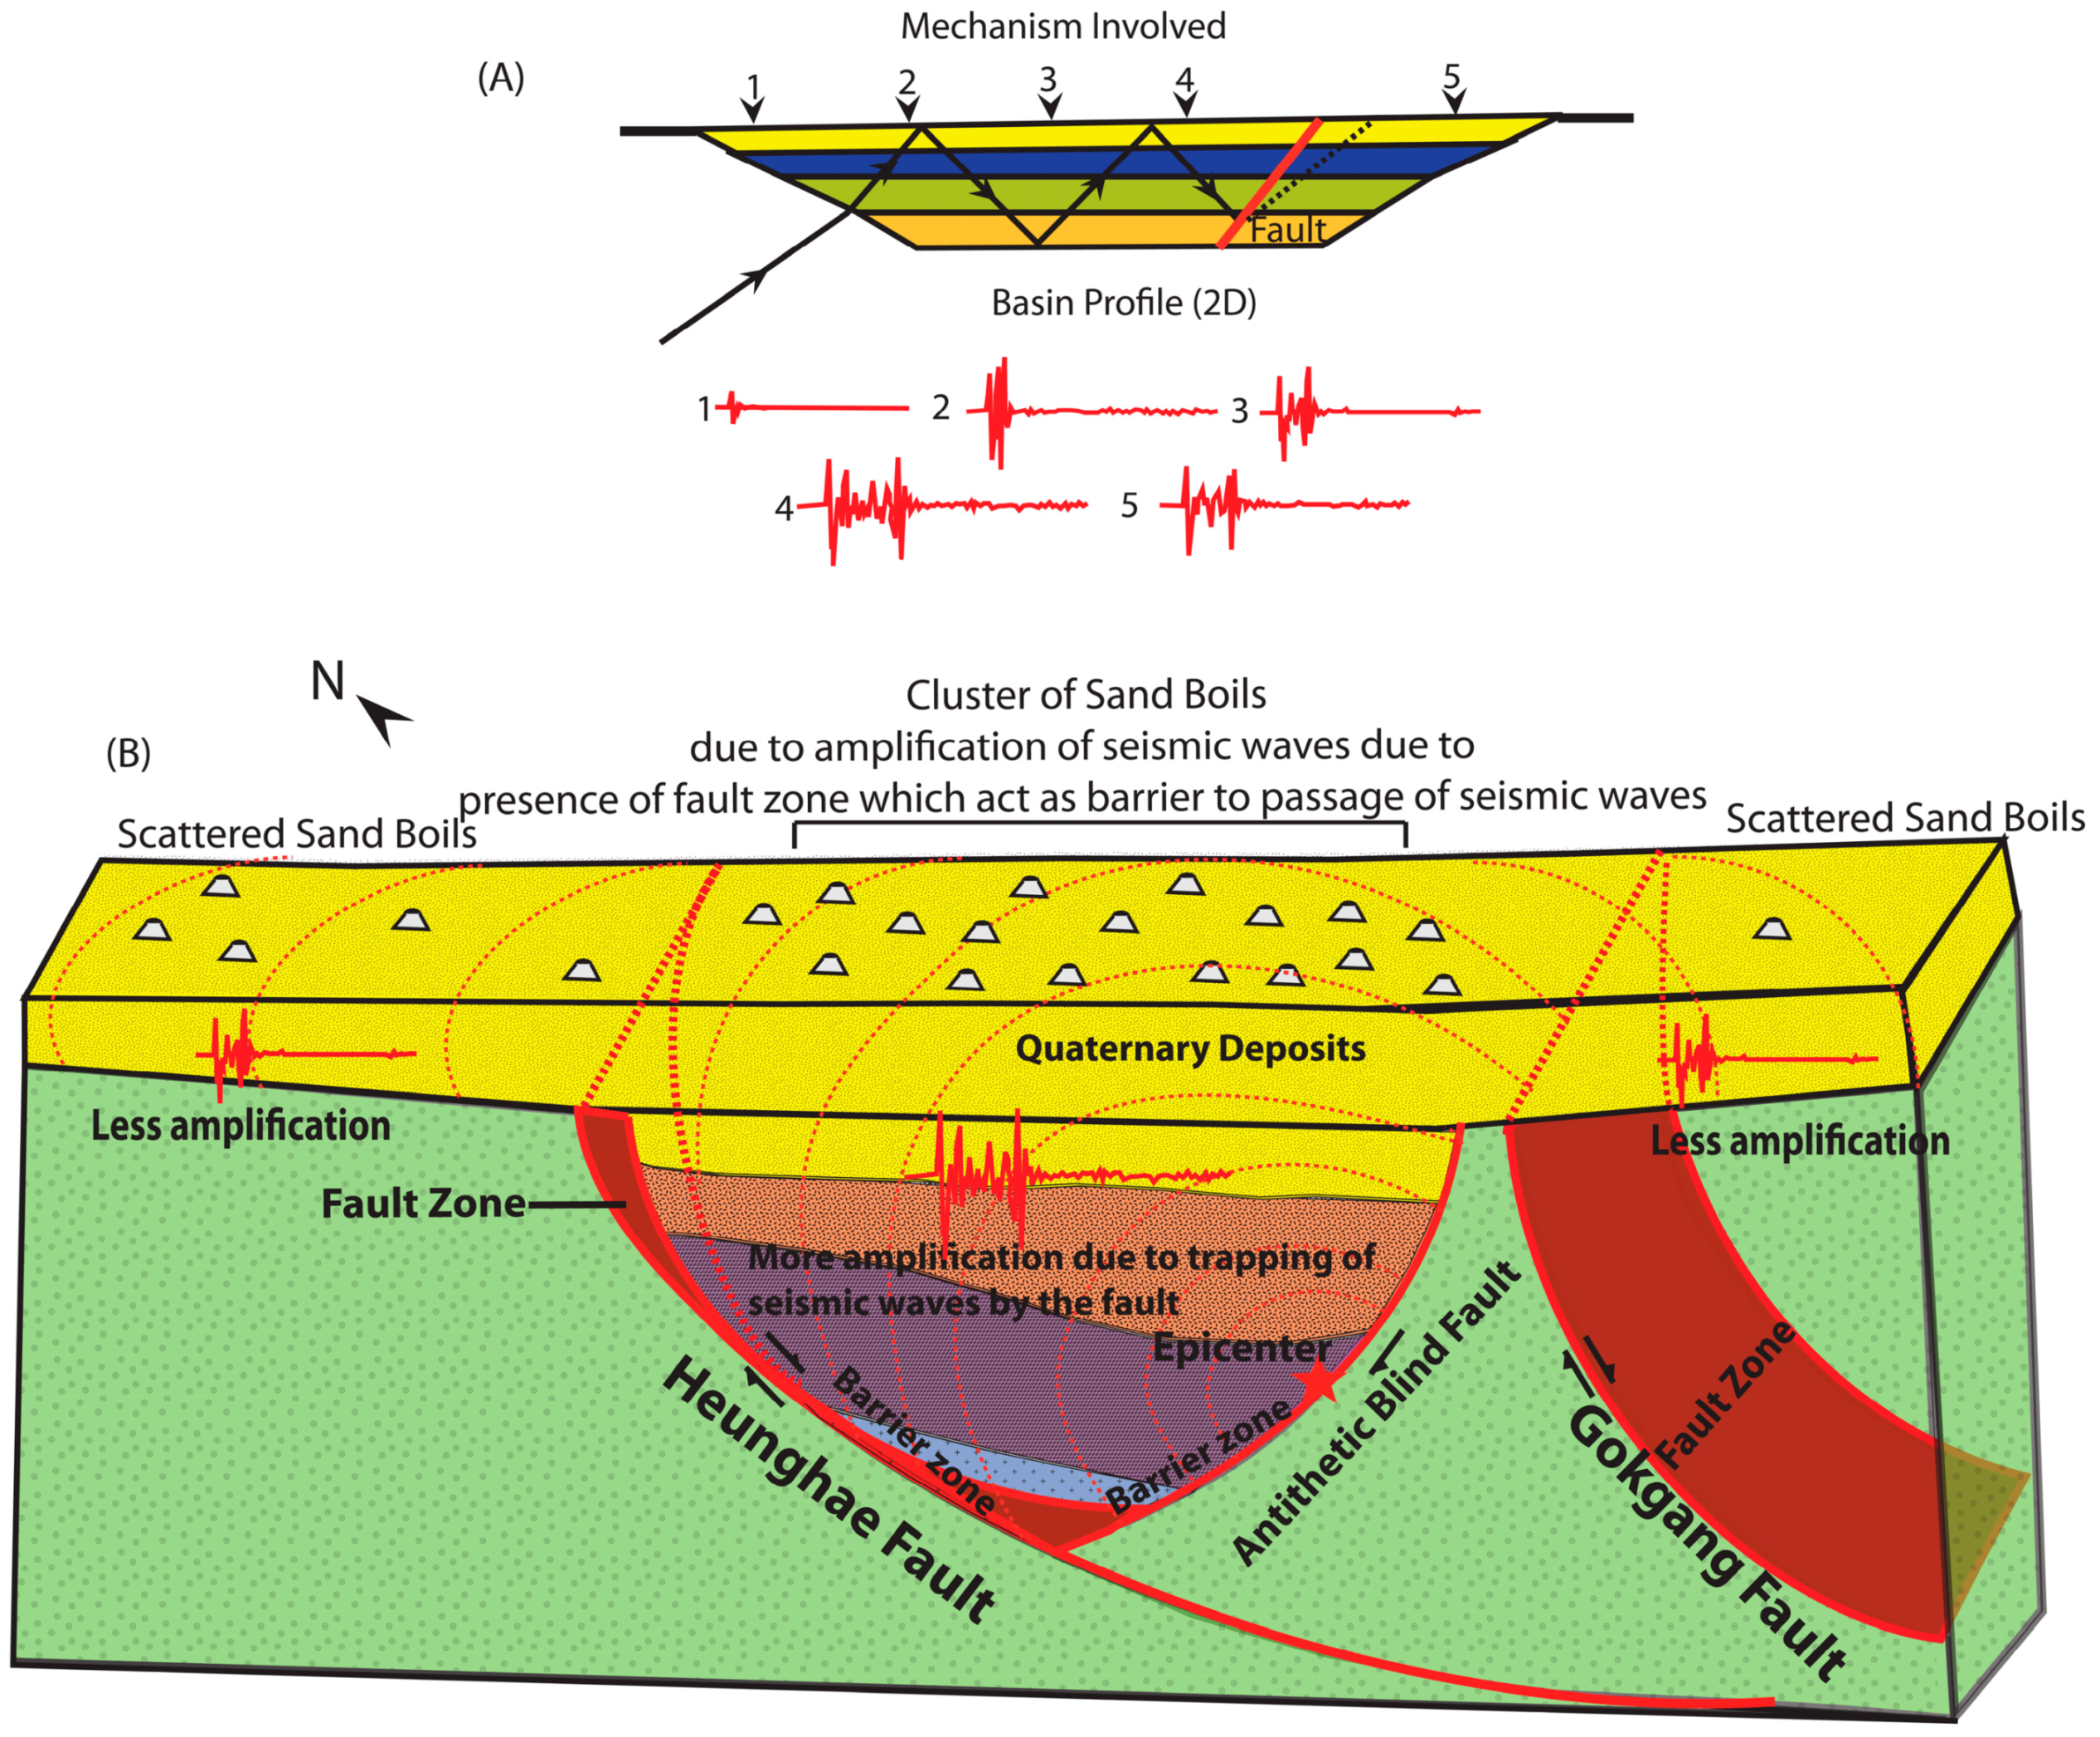
Possible Mechanisms Involved in Liquefaction Clustering in the South Part of the Heunghae Basin

The cause and distribution characteristics of liquefaction and related damages are associated with the combined effects of several factors such as earthquake magnitude, duration of shaking, distance from the epicenter, type of soil content, relative density, drainage condition, degree of consolidation, thickness of liquefiable sand/silt layer, and depth of groundwater table [5,67]. Sometimes anthropogenic structures such as clay lining in rice fields and reclaimed land also influence to the severity of the hazard [5,40].
By analyzing the source of the earthquake and the geological setting of the Heunghae basin area underwent liquefaction, we argue that the major structural factors for the liquefaction clustering during the Pohang earthquake might be the combination of mountain basin effect and trapping of seismic waves within fault zones. During the 2012 Emilia earthquake (Mw 5.9) in Italy, clustering of liquefaction features was observed with in the Po-Plain. This indicates that even if the affected area appears to be homogeneous from a geological point of view there are other local geological factors that controls the liquefaction susceptibility of the area within a basin or an alluvial plain [68,69,70]. Furthermore, previous studies [70,71] observed the mechanism involved in severe liquefaction within basins and suggested that the wedge shaped basement-to-sediment basin interface, which acted as acoustic lens, caused localized seismic wave amplification and extensive damage within the basin [7,71,72,73,74,75]. Though the basin effect is poorly understood and included in the routine seismic hazard assessment, it has been well evidenced that several large and small magnitude earthquakes (1985 Mexico City earthquake, Mexico, Mw 8.0; 1994 North Ridge earthquake, USA, Mw 6.7; 1999 Izmit earthquake, Turkey Mw 7.6; 2008 Wenchuan earthquake, China, Mw 7.9; 2009 Olancha earthquake, USA, Mw 5.2; 2011 Tohoku earthquake, Japan (Mw-9.0); 2012 Emilia earthquake, Italy, Mw 5.9; and 2017 Tripura earthquake, India, Mw 5.7) [7,75,76,77,78,79].
Other factor which controls the severity and distribution of liquefaction and seismic ground deformation is the trapping of seismic waves by the major fault zones within the basin. It was suggested that large faults within the sedimentary basin with fault gouges, fractured rocks and fluids can trap the seismic waves within the block bounded by fault zones [5], which amplifies the upper bound in soft sediments of the basin. This amplification could be stronger within the basin surrounded by fault zones covered by unconsolidated Holocene alluvial deposits (Figure 11 and Figure 12) [7,68,80,81,82,83,84]. A similar observation was reported during the 2008 Wenchuan earthquake, where most of the liquefaction features were confined to the recent alluvial deposits close to the range front blind fault, and damaged buildings were clustered near or top of the Qingchuan blind fault in Sichuan province in China [7]. During the 1994 Northridge earthquake in the USA, (Mw 6.7) [11], the basin structure was an important factor for the enhancement of liquefaction hazard. In the 2001 Bhuj earthquake in India (Mw 7.7), most of the liquefaction features were distributed close to the fault [83]. This clustering of sand boils indicates a fault barrier mechanism for passage of seismic waves within a basin.
The borehole log drilled across the Heunghae basin for the pilot project of the potential CO2 storage site [84] suggests that the Pohang basin has a typical wedge-shaped structure bounded and dissected by several faults and covered by soft sediments. The previous study [79] for a CO2 storage project suggests that the Heunghae basin is bounded by the east dipping Gokgang fault to the east and the south dipping Heunghae fault to the north. The seismic refraction profile and field evidences about the presence of the two NE-SW/E-W striking and S-SE dipping subsidiary normal faults within the Heunghae basin help us to suggest the presence of the E-W striking Heunghae fault.
The potential seismogenic fault for the Pohang earthquake is the west dipping thrust fault, which might be an antithetic fault of the Gokgang fault (Figure 12). On the basis of the geometry and location of the Heunghae fault and the seismogenic fault, the seismic waves generated during the earthquake were trapped and caused more amplification in the southern part of the basin than the northern part. The geophysical and field results suggesting the presence of the E-W trending Heunghae fault and the field evidence of clustered sand boils along the NE-SW causative fault for the Pohang earthquake proved the trapping of the seismic waves by fault zones (Figure 3) [40]. The distribution of sand boils within the Heunghae basin (Figure 3) shows clustered sand boils indicating two preferred orientations. One set of sand boils shows E-W trend, whereas another set shows NE-SW trend, which are similar to the trend of the Heunghae fault and the antithetic fault caused the Pohang earthquake, respectively.
Based on the field observations, geological structures presented in the study area—i.e., spatial distribution plot of sand boils around the epicenter—it can be inferred that the distribution of liquefaction features is mostly controlled by the geological structures within the Heunghae Basin (Figure 3 and Figure 12). Thus, the presence of the Heunghae fault and the antithetic blind fault led the differential amplification due to trapping of seismic waves within the same basin and the differential distribution of liquefaction features. Using this, we have proposed a conceptual model (Figure 12) to explain the local clustering of sand boils within the Heunghae basin, which is well matched with the previous observations in Sichuan province, China [7] and San Fernando Valley, USA [11].
Many of the liquefactions that have caused damages within sedimentary basins have been reported in recent earthquakes such as the Sichuan basin during the 2008 Wenchuan earthquake in China (Mw 7.9), the Kanto basin near Tokyo during the 2011 Tohoku earthquake in Japan (Mw 9.0), Po-Plain in Italy during the 2012 Emilia earthquake (Mw 5.8), and the Kathmandu valley during the 2015 Nepal earthquake (Mw 7.8). The observed damages during these earthquakes poses a real seismic threat to the areas with similar geological settings around the globe. However, the involved mechanisms of geological aspect have received little to no attention, especially during small to moderate earthquakes. Although several numerical studies suggested the trapping and amplification of seismic waves within the basins, geological evidences were very rare and difficult to prove it during a small or a moderate earthquake.
Currently, the liquefaction during small to moderate earthquakes without any surface ruptures is another issue (e.g., such as in the 2009 Olancha earthquake in the USA and the 2017 Pohang earthquake in South Korea), because it can cause serious damages compared to its magnitude. This is especially true of the effect of geological structures within the basin, which is an important concern in earthquake hazard assessment. The present study and proposed inferences will help in understanding the geological phenomenon involved in more localized seismic damages, especially where serious liquefaction and related damages compared with its magnitude are reported in a similar geological and depositional setting. However, it needs more geophysical or seismic data for a conclusive interpretation.

6. Conclusions

The 15th November 2017 Pohang earthquake was the most devastating earthquake with extensive liquefaction in the modern seismic history of the Korean Peninsula. The MMI Intensity of the Pohang earthquake was VIII to IX and caused injury to more than 90 people and estimated property damage of 52 million (USD) with many structural damages. The liquefaction and lateral spreading during the Pohang earthquake provide a very good opportunity to understand the factors involved in liquefaction during a small to moderate earthquakes, which is a very rare phenomenon in Korea and around the world. Based on the results of a systematic field survey, we identified several areas showing unusually extensive liquefaction around the Heunghae basin.
Several kinds of liquefaction features—i.e., liquefaction in gravelly soil, isolated circular to semicircular sand boil, aligned sand boils, en-echelon patterned sand boils, and linear sand boils along artifacts—were identified during the field survey. Most of the sand boils were concentrated along the major faults and especially in the southern part of the Heunghae fault between the Gokgang River and Chogok River. The grain size analysis suggests that most of the ejected materials can be categorized as most favorable liquefiable soil to potentially liquefiable soil. The liquefaction associated with a small to moderate earthquake like the Pohang earthquake could be related to a favorable site condition and strong ground motion. The borehole data drilled in one of the sand boils suggests that the presence of shallow water table and sandy layer was a prime factor for the liquefaction.
The PGA recorded from the Pohang earthquake (i.e., 0.58 g) was very high as a large magnitude earthquake, which may affect to cause a strong ground motion and related to the shallow focus of the earthquake. Furthermore, we interpreted that the amplification of seismic waves within the basin bounded by the major fault zones and mountain basin effects have contributed to the intense shaking and the vast occurrence of liquefaction within the basin. Based on this interpretation, we proposed a conceptual model showing the Heunghae fault zone acting as a barrier for the passage of seismic waves, which produced clusters of sand boils along the southern part of the Heunghae fault. This study suggests that immediate and careful coseismic geological investigation can be effective for proper earthquake parameter estimation and for seismic hazard evaluation on vulnerability of the particular area. Moreover, this kind of study can significantly contribute to engineering implications for a realistic seismic hazard assessment particularly in liquefaction zonation. These aspects need to be considered in liquefaction hazard mapping for similar geological settings on a local as well as regional scale.

Supplementary Materials

The following are available online at https://www.mdpi.com/2076-3263/9/4/173/s1, Figure S1: Google Earth Image showing temporary stations installed by KMA around the epicentral area immediately after the earthquake to measure HVSR ratio and understand the subsoil conditions. The yellow square without number indicates temporary stations without any data (modified from [35]); Table S1: Recorded PGA at different seismic stations around epicentral area of Mw 5.4 Pohang earthquake (KMA Report (modified from [35]); Table S2: Detailed liquefaction features mapped during Mw 5.4 Pohang post-earthquake field survey (Our data from the present study combined with [40]).

Author Contributions

In the present research, S.P.N. conducted the field survey and analyzed the field data, developed the idea, and prepared the manuscript. T.K. and J.S.-H. helped in the field work and geophysical survey. Y.-S.K. encouraged the team and supervised the findings of this work with continuous technical inputs during the preparation of the manuscript.

Funding

This research was supported by a grant (2017-MOIS31-006) of the Fundamental Technology Development Program for Extreme Disaster Response funded by Ministry of Interior and Safety (MOIS, Korea).

Acknowledgments

Authors are thankful to Young Sik Gihm (KIGAM) for providing the additional datasets for the sand boil locations. Also, we are thankful to Master and Bachelor degree students of GSGR Lab for providing support during post-earthquake field survey.

Conflicts of Interest

The authors declare no conflict of interest.

References

  1. Ambraseys, N.; Sarma, S. Liquefaction of soils induced by earthquakes. Bull. Seismol. Soc. Am. 1969, 59, 651–664. [Google Scholar]
  2. Seed, H.B.; Idriss, I.M. Simplified procedure for evaluating soil liquefaction potential. J. Soil Mech. Found. 1971, 97, 1249–1273. [Google Scholar]
  3. Ishihara, K. Liquefaction and flow failure during earthquakes. Geotechnique 1993, 43, 351–451. [Google Scholar] [CrossRef]
  4. Youd, T.L.; Idriss, I.M. Liquefaction resistance of soils: Summary report from the 1996 NCEER and 1998 NCEER/NSF workshops on evaluation of liquefaction resistance of soils. J. Geotech. Geoenviron. Eng. 2001, 127, 297–313. [Google Scholar] [CrossRef]
  5. Wang, C.Y. Liquefaction beyond the near field. Seismol. Res. Lett. 2007, 78, 512–517. [Google Scholar] [CrossRef]
  6. Holzer, T.L.; Jayko, A.S.; Hauksson, E.; Fletcher, J.P.; Noce, T.E.; Bennett, M.J.; Dietel, C.M.; Hudnut, K.W. Liquefaction caused by the 2009 Olancha, California (USA), M5. 2 nearthquakes. Eng. Geol. 2010, 116, 184–188. [Google Scholar] [CrossRef]
  7. Liu-Zeng, J.; Wang, P.; Zhang, Z.; Li, Z.; Cao, Z.; Zhang, J.; Yuan, X.; Wang, W.; Xing, X. Liquefaction in western Sichuan Basin during the 2008 Mw 7.9 Wenchuan earthquake, China. Tectonophysics 2017, 694, 214–238. [Google Scholar] [CrossRef]
  8. Naik, S.P.; Patra, N.R. Generation of Liquefaction Potential Map for Kanpur City and Allahabad City of Northern India: An Attempt for Liquefaction Hazard Assessment. Geotech. Geol. Eng. 2018, 36, 293–305. [Google Scholar] [CrossRef]
  9. Naik, S.P.; Patra, N.R.; Malik, J.N. Spatial distribution of Shear wave velocity for late Quaternary Alluvial soil of Kanpur city, Northern India. Geotech. Geol. Eng. 2014, 32, 131–149. [Google Scholar] [CrossRef]
  10. Seed, H.B. Landslides during earthquakes due to liquefaction. J. Soil Mech. Found. 1968, 94, 1055–1122. [Google Scholar]
  11. Holzer, T.L.; Bennett, M.J.; Ponti, D.J.; Tinsley, J.C., III. Liquefaction and soil failure during 1994 Northridge earthquake. J. Geotech. Geoenviron. Eng. 1999, 125, 438–452. [Google Scholar] [CrossRef]
  12. Rajendran, K.; Rajendran, C.P.; Thakkar, M.; Tuttle, M.P. The 2001 Kutch (Bhuj) earthquake: Coseismic surface features and their significance. Curr. Sci. 2001, 80, 1397–1405. [Google Scholar]
  13. Wang, C.Y.; Wang, C.H.; Manga, M. Coseismic release of water from mountains: Evidence from the 1999 (Mw = 7.5) Chi-Chi, Taiwan, earthquake. Geology 2004, 32, 769–772. [Google Scholar] [CrossRef]
  14. Gómez, J.C.; Tavera, H.J.; Orihuela, N. Soil liquefaction during the Arequipa Mw 8.4, June 23, 2001 earthquake, Southern Coastal Peru. Eng. Geol. 2005, 78, 237–255. [Google Scholar]
  15. Yin, R.Y.; Liu, Y.M.; Li, Y.L.; Zhang, S.M. The relation between earthquake liquefaction and landforms in Tangshan region. Res. Soil Water Conserv. 2005, 12, 110–112. [Google Scholar]
  16. Bhattacharya, S.; Hyodo, M.; Gouda, K.; Tazoh, T.; Taylor, C.A. Liquefaction of soil in the Tokyo Bay area from the 2011 Tohoku (Japan) earthquake. Soil Dyn. Earth Eng. 2011, 31, 1618–1628. [Google Scholar] [CrossRef]
  17. Atzori, S.; Tolomei, C.; Antonioli, A.; Merryman Boncori, J.P.; Bannister, S.; Trasatti, E.; Pasquali, P.; Salvi, S. The 2010–2011 Canterbury, New Zealand, seismic sequence: Multiple source analysis from InSAR data and modeling. J. Geophyl. Res. Solid Earth 2012, 117, 1–16. [Google Scholar] [CrossRef]
  18. Ishitsuka, K.; Tsuji, T.; Matsuoka, T. Detection and mapping of soil liquefaction in the 2011 Tohoku earthquake using SAR interferometry. Earth Planets Space 2012, 64, 1267–1276. [Google Scholar] [CrossRef] [Green Version]
  19. Papathanassiou, G.; Caputo, R.; Rapti-Caputo, D. Liquefaction phenomena along the paleo-Reno River caused by the May 20, 2012, Emilia (northern Italy) earthquake. Ann. Geophys. 2012, 55, 735–742. [Google Scholar]
  20. Quigley, M.C.; Bastin, S.; Bradley, B.A. Recurrent liquefaction in Christchurch, New Zealand, during the Canterbury earthquake sequence. Geology 2013, 41, 419–422. [Google Scholar] [CrossRef]
  21. De la Maza, G.; Williams, N.; Sáez, E.; Rollins, K.; Ledezma, C. Liquefaction-Induced Lateral Spread in Lo Rojas, Coronel, Chile: Field Study and Numerical Modeling. Earth Spectra 2017, 33, 219–240. [Google Scholar] [CrossRef]
  22. Sharma, K.; Deng, L.; Khadka, D. Reconnaissance of liquefaction case studies in 2015 Gorkha (Nepal) earthquake and assessment of liquefaction susceptibility. Int. J. Geotech. Eng. 2017, 1–13. [Google Scholar] [CrossRef]
  23. Gautam, D.; de Magistris, F.S.; Fabbrocino, G. Soil liquefaction in Kathmandu valley due to 25 April 2015 Gorkha, Nepal earthquake. Soil Dyn. Earth Eng. 2017, 97, 37–47. [Google Scholar] [CrossRef]
  24. Kuribayashi, E.; Tatsuoka, F. Brief review of liquefaction during earthquakes in Japan. Soils Found. 1975, 15, 81–92. [Google Scholar] [CrossRef]
  25. Ambraseys, N.N. Engineering seismology: Part II. Earth Eng. Struct. Dyn. 1988, 17, 51–105. [Google Scholar] [CrossRef]
  26. Sims, J.D.; Garvin, C.D. Recurrent liquefaction induced by the 1989 Loma Prieta earthquake and 1990 and 1991 aftershocks: Implications for paleoseismicity studies. Bull. Seismol. Soc. Am. 1995, 85, 51–65. [Google Scholar]
  27. Galli, P. New empirical relationships between magnitude and distance for liquefaction. Tectonophysics 2000, 324, 169–187. [Google Scholar] [CrossRef]
  28. Choi, J.H.; Kim, Y.S.; Choi, S.J. Identification of a suspected Quaternary fault in eastern Korea: Proposal for a paleoseismic research procedure for the mapping of active faults in Korea. J. Asia Earth Sci. 2015, 113, 897–908. [Google Scholar] [CrossRef]
  29. Cetin, K.O.; Seed, R.B.; Kayen, R.E.; Moss, R.E.; Bilge, H.T.; Ilgac, M.; Chowdhury, K. Summary of SPT Based Field Case History Data of CETIN (2016) Database (No. METU/GTENG 08/16-01); Middle East Technical University: Ankara, Turkey, 2016. [Google Scholar]
  30. Moss, R.E.S.; Seed, R.B.; Kayen, R.E.; Stewart, J.P.; Der Kiureghian, A.; Cetin, K.O. CPT-based probabilistic and deterministic assessment of in situ seismic soil liquefaction potential. J. Geotech. Geoenviron. Eng. 2006, 132, 1032–1051. [Google Scholar] [CrossRef]
  31. Kim, S.I.; Park, I.J.; Choi, J.S. A Study on the Assessment of Liquefaction Potential in Korea. J. Korean Soc. Civ. Eng. 2000, 20, 129. [Google Scholar]
  32. Park, D.; Kwak, D.Y.; Cho, C.K.; Chun, B.S. Evaluation of liquefaction potential of port structures with earthquake magnitude adjustment. J. Coast. Res. 2009, 2, 1035–1039. [Google Scholar]
  33. Seo, M.W.; Olson, S.M.; Sun, C.G.; Oh, M.H. Evaluation of liquefaction potential index along western coast of South Korea using SPT and CPT. Mar. Geores. Geotech. 2012, 30, 234–260. [Google Scholar] [CrossRef]
  34. Michetti, A.M.; Esposito, E.; Guerrieri, L.; Porfido, S.; Serva, L.; Tatevossian, R.; Vittori, E.; Audemard, F.; Azuma, T.; Clague, J.; et al. Intensita’ scale ESI 2007. In Memorie Descrittive della. Carta Geologica d’Italia, Servizio Geologico d’Italia; Guerrieri, L., Vittori, E., Eds.; Dipartimento Difesa del Suolo, APAT: Rome, Italy, 2007; pp. 1–54. [Google Scholar]
  35. Korean Meteorological Administration. KMA Report on Pohang Earthquake (Korean); Korean Meteorological Administration: Seoul, Korea, 2018; pp. 1–41.
  36. Choi, J.H.; Ko, K.; Gihm, Y.S.; Cho, C.S.; Lee, H.; Song, S.G.; Bang, E.S.; Lee, H.J.; Bae, H.K.; Kim, S.W.; et al. Surface Deformations and Rupture Processes Associated with the 2017 Mw 5.4 Pohang, Korea, Earthquake. Bul. Seism. Soc. Am. 2019, 109, 756–769. [Google Scholar] [CrossRef]
  37. Sohn, Y.K.; Son, M. Synrift stratigraphic geometry in a transfer zone coarse-grained delta complex, Miocene Pohang Basin, SE Korea. Sedimentology 2004, 51, 1387–1408. [Google Scholar] [CrossRef]
  38. Son, M.; Kim, J.S.; Chong, H.Y.; Lee, Y.H.; Kim, I.S. Characteristics of the Cenozoic crustal deformation in SE Korea and their tectonic implications. Korean J. Petrol. Geol. 2007, 13, 1–16. [Google Scholar]
  39. Kim, K.H.; Ree, J.H.; Kim, Y.; Kim, S.; Kang, S.Y.; Seo, W. Assessing whether the 2017 MW 5.4 Pohang earthquake in South Korea was an induced event. Science 2018, 26, 1007–1009. [Google Scholar] [CrossRef]
  40. Gihm, Y.S.; Kim, S.W.; Ko, K.; Choi, J.H.; Bae, H.; Hong, P.S.; Lee, Y.; Lee, H.; Jin, K.; Choi, S.J.; et al. Paleoseismological implications of liquefaction-induced structures caused by the 2017 Pohang Earthquake. Geosci. J. 2018, 22, 1–10. [Google Scholar] [CrossRef]
  41. Grigoli, F.; Cesca, S.; Rinaldi, A.P.; Manconi, A.; López-Comino, J.A.; Clinton, J.F.; Westaway, R.; Cauzzi, C.; Dahm, T.; Wiemer, S. The November 2017 MW 5.5 Pohang earthquake: A possible case of induced seismicity in South Korea. Science 2018, 360, 1003–1006. [Google Scholar] [CrossRef] [PubMed]
  42. Han, S.J.; Kim, H.J.; Huh, S.; Park, C.H.; Kim, S.R.; Lee, Y.K.; Yoo, H.S.; Choi, D.L.; Park, B.K. Basin structure of the northeastern Ulleung basin (Ulleung and Dok island areas), East Sea of Korea. J. Geol. Soc. Korea 1997, 33, 127–138. [Google Scholar]
  43. Kim, I.S. Origin and Tectonic Evolution of the East Sea (Sea of Japan) and the Yangsan Fault System: A new synthetic Interpretation. J. Geol. Soc. Korea 1992, 28, 84–109. [Google Scholar]
  44. Hwang, I.G.; Chough, S.K.; Hong, S.W.; Choe, M.Y. Controls and evolution of fan delta systems in the Miocene Pohang Basin, SE Korea. Sediment. Geol. 1995, 98, 147–179. [Google Scholar] [CrossRef]
  45. Chough, S.K.; Kwon, S.T.; Ree, J.H.; Choi, D.K. Tectonic and sedimentary evolution of the Korean peninsula: A review and new view. Earth Sci. Rev. 2000, 52, 175–235. [Google Scholar] [CrossRef]
  46. Sahoo, R.N.; Reddy, D.V.; Sukhija, B.S. Evidence of liquefaction near Baramulla (Jammu and Kashmir, India) due to the 2005 Kashmir earthquake. Curr. Sci. 2007, 92, 293–295. [Google Scholar]
  47. Huang, Y.; Jiang, X. Field-observed phenomena of seismic liquefaction and subsidence during the 2008 Wenchuan earthquake in China. Nat. Hazards 2010, 54, 839–850. [Google Scholar] [CrossRef]
  48. Yao, X.; Zhang, J.G.; Zhang, Y.S.; Yang, B.; Yu, K. Study of sand liquefaction hazard features induced by Yingjiang Ms 5.8 earthquake on March 10, 2011. J. Eng. Geol. 2011, 19, 152–161. [Google Scholar]
  49. Castilla, R.A.; Audemard, F.A. Sand blows as a potential tool for magnitude estimation of pre-instrumental earthquakes. J. Seismol. 2007, 11, 473–487. [Google Scholar] [CrossRef]
  50. Kramer, S.L. Geotechnical Earthquake Engineering. International Series in Civil Engineering and Engineering Mechanics; Prentice-Hall: Englewood Cliffs, NJ, USA, 1996. [Google Scholar]
  51. Kumar, A.; Borah, N.; Naik, S.P.; Olympa, B. Detailed review on methodologies available to find preinstrumental missing earthquakes of the present catalogue with the relevance to seismicity assessment of the Northeast India. Ind. Geotech. J. 2018, 1–15. [Google Scholar] [CrossRef]
  52. Tsuchida, H.; Hayashi, S. Estimation of Liquefaction Potential of Sandy Soils; Publication of Mcgraw Hill Book Company: New York, NY, USA, 1972. [Google Scholar]
  53. Andrus, R.D. In-Situ Characterization of Gravelly Soils That Liquefied in the 1983 Borah Peak Earthquake. Ph.D. Thesis, University of Texas, Austin, TX, USA, 1994. [Google Scholar]
  54. Sirovich, L. Repetitive liquefaction at a gravelly site and liquefaction in overconsolidated sands. Soils Found. 1996, 36, 23–34. [Google Scholar] [CrossRef]
  55. Hatanaka, M.; Uchida, A.; Ohara, J. Liquefaction characteristics of a gravelly fill liquefied during the 1995 Hyogo-Ken Nanbu earthquake. Soils Found. 1997, 37, 107–115. [Google Scholar] [CrossRef]
  56. Kokusho, T.; Matsumoto, M. Nonlinearity in site amplification and soil properties during the 1995 Hyogoken-Nambu earthquake. Soils Found. 1998, 38, 1–9. [Google Scholar] [CrossRef]
  57. Lin, P.S.; Chang, C.W.; Chang, W.J. Characterization of liquefaction resistance in gravelly soil: Large hammer penetration test and shear wave velocity approach. Soil Dyn. Earthq. Eng. 2004, 24, 675–687. [Google Scholar] [CrossRef]
  58. Cao, Z.; Hou, L.; Xu, H.; Yuan, X. Distribution and characteristics of gravelly soil liquefaction in the Wenchuan M s 8.0 earthquake. Earthq. Eng. Eng. Vibr. 2010, 9, 167–175. [Google Scholar] [CrossRef]
  59. Chen, L.; Yuan, X.; Cao, Z.; Hou, L.; Sun, R.; Dong, L.; Wang, W.; Meng, F.; Chen, H. Liquefaction macro phenomena in the great Wenchuan earthquake. Earthq. Eng. Eng. Eng Vibra. 2009, 8, 219–229. [Google Scholar] [CrossRef]
  60. Liu, C.Y.; Chia, Y.; Chuang, P.Y.; Chiu, Y.C.; Tseng, T.L. Impacts of hydrogeological characteristics on groundwater-level changes induced by earthquakes. Hydrogeol. J. 2018, 26, 451–465. [Google Scholar] [CrossRef]
  61. Nespoli, M.; Micol, T.; Enrico, S.; Maria, E.B.; Maurizio, B.; Marco, M.; Antonio, P.R.; Letizia, A.; Adriano, G. Modeling earthquake effects on groundwater levels: Evidences from the 2012 Emilia earthquake (Italy). Geofluids 2016, 16, 452–463. [Google Scholar] [CrossRef]
  62. Yun, S.M.; Hamm, S.Y.; Cheong, J.Y.; Lee, C.M.; Seo, W.S.; Woo, N.C. Analyzing groundwater level anomalies in a fault zone in Korea caused by local and offshore earthquakes. Geosci. J. 2019, 23, 137–148. [Google Scholar] [CrossRef]
  63. Porfido, S.; Esposito, E.; Vittori, E.; Tranfaglia, G.; Guarrieri, L.; Pece, R. Seismically induced ground effects of the 1805, 1930 and 1980 earthquakes in the Southern Apennines, Italy. Ital. J. Geosci. 2007, 126, 333–346. [Google Scholar]
  64. Amoruso, A.; Crescentini, L.; Petitta, M.; Rusi, S.; Tallini, M. Impact of the 6 April 2009 L’Aquila earthquake on groundwater flow in the Gran Sasso carbonate aquifer, Central Italy. Hydrol. Process. 2011, 25, 1754–1764. [Google Scholar] [CrossRef]
  65. Fleeger, G.M.; Goode, D.J.; Buckwalter, T.F.; Risser, D.W. Hydrologic Effects of the Pymatuning Earthquake of September 25, 1998, in Northwestern Pennsylvania; US Department of the Interior, US Geological Survey: Reston, VA, USA, 1999; No. 99-4170.
  66. Yun, H.; Min, K.D.; Moon, H.S.; Lee, H.K.; Yi, S.S. Biostratigraphic, Chemostratigraphic, Paleomagne Tostratigraphic, and Tephrochronological Study for the Correlation of Tertiary Formations in Southern Part of Korea. Paleontology 1991, 7, 1–12. [Google Scholar]
  67. Yan, R.; Woith, H.; Wang, R.J. Groundwater level changes induced by the 2011 Tohoku earthquake in China mainland. Geophys. J. Int. 2014, 199, 533–548. [Google Scholar] [CrossRef] [Green Version]
  68. Alessio, G.; Alfonsi, L.; Brunori, C.A.; Burrato, P.; Casula, G.; Cinti, F.R.; Civico, R.; Colini, L.; Cucci, L.; De Martini, P.M.; et al. Liquefaction phenomena associated with the Emilia earthquake sequence of May-June 2012 (Northern Italy). Nat. Hazards Earth Syst. Sci. 2013, 13, 935–947. [Google Scholar] [CrossRef]
  69. Alessio, G.; Alfonsi, L.; Brunori, C.A.; Burrato, P.; Casula, G.; Cinti, R.F.; Civico, R.; Colini, L.; Cucci, L.; De Martini, P.M.; et al. A photographic dataset of the coseismic geological effects induced on the environment by the 2012 Emilia (Northern Italy) earthquake sequence. J. Jpn. Geotech. Soc. Soils Found. 1997, 37, 107–115. [Google Scholar]
  70. Davis, P.M.; Rubinstein, J.L.; Liu, K.H.; Gao, S.S.; Knopoff, L. Northridge earthquake damage caused by geological focusing of seismic waves. Science 2000, 289, 1746–1750. [Google Scholar] [CrossRef]
  71. Lee, S.J.; Komatitsch, D.; Huang, B.S.; Tromp, J. Effects of topography on seismic-wave propagation: An example from northern Taiwan. Bull. Seismol. Soc. Am. 2009, 99, 314–325. [Google Scholar] [CrossRef]
  72. Graves, R.W.; Pitarka, A.; Somerville, P.G. Ground-motion amplification in the Santa Monica area: Effects of shallow basin-edge structure. Bull. Seismol. Soc. Am. 1998, 88, 1224–1242. [Google Scholar]
  73. Stewart, J.P.; Bray, J.D.; McMahon, D.J.; Smith, P.M.; Kropp, A.L. Seismic performance of hillside fills. J. Geotech. Geoenviron. Eng. 2001, 127, 905–919. [Google Scholar] [CrossRef]
  74. Olsen, K.B.; Day, S.M.; Minster, J.B.; Cui, Y.; Chourasia, A.; Faerman, M.; Moore, R.; Maechling, P.; Jordan, T. Strong shaking in Los Angeles expected from the southern San Andreas earthquake. Geophy. Res. Lett. 2006, 33, L073054. [Google Scholar] [CrossRef]
  75. Pitarka, A.; Irikura, K.; Iwata, T.; Sekiguchi, H. Three-dimensional simulation of the near-fault ground motion for the 1995 Hyogo-ken Nanbu (Kobe), Japan, earthquake. Bull. Seismol. Soc. Am. 1998, 88, 428–440. [Google Scholar]
  76. Ergin, M.; Özalaybey, S.; Aktar, M.; Yalcin, M.N. Site amplification at Avcılar, Istanbul. Tectonophysics 2004, 391, 335–346. [Google Scholar] [CrossRef]
  77. Debbarma, J.; Martin, S.S.; Suresh, G.; Ahsan, A.; Gahalaut, V.K. Preliminary observations from the 3 January 2017, MW 5.6 Manu, Tripura (India) earthquake. J. Asian Earth Sci. 2017, 148, 173–180. [Google Scholar] [CrossRef]
  78. Pratt, T.L.; Brocher, T.M.; Weaver, C.S.; Creager, K.C.; Snelson, C.M.; Crosson, R.S.; Miller, K.C.; Tréhu, A.M. Amplification of seismic waves by the Seattle basin, Washington State. Bull. Seismol. Soc. Am. 2003, 93, 533–545. [Google Scholar] [CrossRef]
  79. Lee, T.J.; Song, Y.; Uchida, T. Three dimensional magnetotelluric surveys for geothermal development in Pohang, Korea. Explor. Geophy. 2007, 38, 89–97. [Google Scholar] [CrossRef]
  80. Donati, S.; Marra, F.; Rovelli, A. Damage and ground shaking in the town of Nocera Umbra during Umbria-Marche, central Italy, earthquakes: The special effect of a fault zone. Bull. Seismol. Soc. Am. 2001, 91, 511–519. [Google Scholar] [CrossRef]
  81. Li, Y.G.; Vidale, J.E.; Cochran, E.S. Low-velocity damaged structure of the San Andreas Fault at Parkfield from fault zone trapped waves. Geophy. Res. Lett. 2004, 31, L12S06. [Google Scholar] [CrossRef]
  82. Lombardi, D.; Bhattacharya, S. Liquefaction of soil in the Emilia-Romagna region after the 2012 Northern Italy earthquake sequence. Nat. Hazards 2014, 73, 1749–1770. [Google Scholar] [CrossRef]
  83. Thakkar, M.G.; Goyal, B. On the relation between magnitude and liquefaction dimension at the epicentral zone of 2001 Bhuj earthquake. Curr. Sci. 2004, 87, 811–817. [Google Scholar]
  84. Lee, T.J.; Yoonho, S.; Deok-Won, P.; Jaesoo, J.; Woon, S.Y. Three dimensional geological model of Pohang EGS pilot site, Korea. In Proceedings of the World Geothermal Congress, Melbourne, Australia, 19–25 April 2015; Volume 19. [Google Scholar]
Figure 1. (A) InSAR image showing the deformation (~3–4 cm uplift) in the epicenter area, previously reported faults and the regional stress condition with focal mechanism (National Research Institute for Earth Science and Disaster Resilience (NIED), United States Geological Survey (USGS), Korean Meteorological Administration (KMA), and Korea Institute of Geoscience and Mineral Resources (KIGAM). (B) General Modified Mercalli intensity (MMI) distribution of Pohang earthquake, according to USGS. KMA suggested intensity of VIII to IX in the epicenter area.
Geosciences 09 00173 g001
Figure 2. Geological and tectonic map of the study area showing major geological structures and lithological units (Modified from [37]).
Geosciences 09 00173 g002
Figure 3. Google Earth image showing the major faults around the study area with the collected liquefaction features during the MW 5.4 Pohang earthquake. Most of the liquefaction features were clustered in the southern part of the Heunghae Basin and to the south of the Heunghae Fault (Sand boil data sets used in this diagram were collected ourselves and also taken from [40]). The red line indicates the location of geophysical profile taken across the Heunghae Fault.
Geosciences 09 00173 g003
Figure 4. Unmanned Air Vehicle (UAV) images and field photographs showing typical liquefaction features observed during the Pohang earthquake. (AC) UAV images showing the distribution of sand boils and rose diagram showing two preferential trends: NNE ~SSW and NE-SW. (DF) Field photographs showing typical isolated and series of sand boils observed in the agricultural field.
Geosciences 09 00173 g004
Figure 5. Typical field photos showing different types of liquefaction feature observed during the Pohang earthquake. (A) Isolated sand boil in the rice field. (B) Chain/Clustered sand boils in the rice field. (C) Sand/gravel mixtures ejected using preexisting cracks.
Geosciences 09 00173 g005
Figure 6. Grain size distribution graph for the samples collected from the ejected sand boils and drilled borehole. The grain size distributions were compared with the range of grain size distribution for liquefiable soil (Modified from [52]).
Geosciences 09 00173 g006
Figure 7. Field photographs showing (A) The cracks on a paved road due to differential settlement; (BD). Ground cracks and lateral spreading along the canal embankments during the Pohang earthquake. Most of the cracks showed the N-S trend; (E) En-echelon cracks along a paved road.
Geosciences 09 00173 g007
Figure 8. Photographs showing (A) a titled residential building due to differential settlement (the building was titled about 15 cm); (B) separation of water pipeline due to titling of the building; (C,D) differential settlement observed in the basement of the residence buildings in the epicentral area (he basement of the building settled almost 15–30 cm).
Geosciences 09 00173 g008
Figure 9. Field photos showing evidences of the gravelly soil liquefaction. (A) Photographs showing ejected gravels due to liquefaction through ground cracks; (B) sand boil showing evidence of gravelly soil liquefaction along a dry river bed; (C) sand boil showing ejected pebbles with fine sand in rice farm during the earthquake.
Geosciences 09 00173 g009
Figure 10. Changes of ground water levels associated with the Pohang earthquake. The ground water monitoring stations show the variation of the water levels before and after the 15th November 2017 Pohang earthquake (A) G1, (B) G3, and (C) G5. For the station locations: see Figure 3 (Data taken from https://www.groundwater.or.kr).
Geosciences 09 00173 g010
Figure 11. (A,B) Seismic refraction profile showing existences of the south dipping normal fault within Heunghae basin, which could be the traces of Heunghae Fault (red arrow shows the traces of faults). (C,D) Field photographs showing evidence of normal faulting. The faults offset the tertiary deposits within the Heunghae basin.
Geosciences 09 00173 g011
Figure 12. Conceptual models for the clustering of liquefaction during the Pohang earthquake. (A) Model for the mechanism involved in the localized amplification of seismic waves within a basin due to mountain basin effect. (B) Model for the mechanism explaining the role of the Heunghae fault in clusters of sand boils in the southern part of the fault. From the field survey and UAV image (Figure 3), it was clear that most of the sand boils were clustered densely in the southern part of the fault (model is not up to the scale).
Geosciences 09 00173 g012

