Article

Composite Anchors for Slope Stabilisation: Monitoring of their In-Situ Behaviour with Optical Fibre

by
Simonetta Cola
1,*,
Luca Schenato
2,
Lorenzo Brezzi
1,
Francine Chantal Tchamaleu Pangop
1,
Luca Palmieri
3 and
Alberto Bisson
4
1
Department of Civil, Environmental and Architectural Engineering (ICEA), University of Padova, 35129 Padua, Italy
2
Research institute for geo-hydrological protection (IRPI), National Research Council, 35127 Padova, Italy
3
Department of Information Engineering (DEI), University of Padova, 35131 Padova, Italy
4
Autoperforanti Sirive®, 36073 Cornedo Vicentino (VI), Italy
*
Author to whom correspondence should be addressed.
Geosciences 2019, 9(5), 240; https://doi.org/10.3390/geosciences9050240
Submission received: 1 March 2019 / Revised: 28 March 2019 / Accepted: 4 April 2019 / Published: 25 May 2019
(This article belongs to the Special Issue Mountain Landslides: Monitoring, Modeling, and Mitigation)

Abstract

:
Composite anchors are special passive sub-horizontal reinforcements recently developed for remediation of unstable slopes. They are composed of a hollow steel bar, installed by a self-drilling technique in the soil, coupled with tendons cemented in the inner hole to increase the global anchor tensile strength. The anchors are primarily intended to stabilise medium to deep landslides, both in soils or weathered rock masses. Among the valuable advantages of composite anchors are their low cost, ease of installation, and flexibility in execution, as testified by a rapid increase in their use in recent years. The bond strength at the soil-anchor interface is the main parameter for both the design of these reinforcements and the evaluation of their long-term effects for landslide stabilisation. After a brief description of the composite anchor technology, this paper presents a novel methodology for monitoring the strain and stress accumulated in the anchors over time when installed in an unstable slope. The new monitoring system is composed of a distributed fibre optic sensing system, exploiting the optical frequency domain reflectometry (OFDR) technique, to measure the strain exerted on the optical fibre cable embedded with the tendons inside the bar. The system permits an evaluation of the axial force distribution in the anchor and the soil-anchor interface actions with a spatial resolution of up to some millimetres. Therefore, it allows determination of the stabilising capability associated with the specific hydrogeological conditions of the site. Furthermore, upon an extensive validation, the system may become part of a standard practice to be applied in this type of intervention, aimed at evaluating the effectiveness of the anchor installation and its evolution over time.

1. Introduction

Many areas of the world are highly susceptible to landslides [1,2] and this type of natural hazard causes extensive damage and human losses (about 4000 fatalities/year over the world in the period of 2004 to 2010). Fortunately, despite the fact that fatalities related to landslides are relatively low, Italy is greatly affected by landslides. Research seeking low-cost solutions for risk mitigation and slope stabilisation is of primary importance in all susceptible regions and in Italy, in particular. In 2012, the University of Padova, in partnership with the regional public agencies and some Italian companies, began researching the development and performance-cost evaluation of an innovative technique for landslide stabilisation, named ‘composite anchors’ [3,4,5,6].
Composite anchors are improved passive reinforcements installed in the site with the self-drilling technique. The reinforcement is constituted by a hollow carbon steel bar with external ribs to improve nail-grout adhesion. The bar is coupled with one or more harmonic steel strands, which are inserted in the inner cavity of the bar after its installation. The strands are then cemented with a special grout, so that the two elements (bar and strands) may work jointly (Figure 1). In this way, the system permits broadening of the application fields of the passive anchors and improvement of their mechanical behaviour. Moreover, before their cementation, the inner strands can be pre-tensioned or not, thus obtaining composite anchors working either passively or actively. However, until now, the passive modality has mainly been adopted in applications on landslides.
The anchor is capped with an external plate, generally constituted by a precast concrete frusto-conical element with a central cavity for bar insertion and a nut that fixes the plate to the bar. As soon as the landslide undergoes movements, the soil behind the plate loads it, while the shear stress along the anchors activates the bar, triggering a reinforcement effect. The plate’s role is to distribute the traction acting at the bar head onto the soil; since the head traction is generally not extremely high, small plates may be used. Moreover, since the reinforcements are mostly passive (i.e., not pre-tensioned), the soil can cover the external plates, reducing the aesthetic impact on the landscape. It is important that precautions against corrosion of metallic elements are adopted in order to ensure durability of the anchors over time [7,8].
With respect to traditional anchor bars, the composite anchor has many geotechnical and technological advantages. They provide the following:
  • The same mechanical properties at a lower cost.
  • Higher ultimate tensile strength and lower elongation in the serviceability state.
  • Greater durability (reduced cracking, better protection from corrosion).
  • Easier transportation and quick installation.
  • Length adaptability to different geological and geotechnical in-situ conditions.
  • Higher flexural inertia and better continuity given by the strands to the full reinforcement when compared to a simple coupling sleeve.
Composite anchors can be applied to various geotechnical works and offer the most considerable advantages in landslide stabilisation, where large stabilising forces are needed. In this case, their use follows the approach of the so-called ‘floating anchor’ [5,6]. This type of anchor consists in installing passive sub-horizontal reinforcements in order to increase the forces that contrast the sliding. As in soil nailing [9,10,11], the passive reinforcements are grouted in the soil along the entire profile, guaranteeing a sufficient foundation in the stable deep zone. In floating anchors, the external concrete slabs have an appropriate shape and size, but they are not rigidly connected to each other. If movements in the slope occur, axial forces are generated in the passive reinforcements because of the shear stresses increasing at the soil-grout interface once the mass is slowly moving. These axial forces oppose part of the destabilising forces, thus reducing the landslide evolution process until, eventually, it completely stops. Since the axial head force at the external slab is small, the system does not require a continuous facing, and if the slope deforms, the slabs may be buried inside the slope and disappear under the ground surface (Figure 2).
Since the interactions between the soil-bar and strand-bar are the most important aspects on which depend both the design of these reinforcements and the assessment of their efficiency on the stabilization of an existing (or potential) landslide, this research group is engaged in evaluating these interactions by means of laboratory tests and on-site measurements. After a first attempt, in which Bisson et al. [5] used strain gauges with not completely satisfactory results, we applied distributed fibre optic sensors (DFOSs) [12,13] to better measure the strain of composite anchors.
These sensors, based on fibre optic technology, allow the measurement of strain and temperature with very high spatial resolution and high sensitivity. The operating principle of DFOSs is based on the injection of a light wave in an optical fibre and on the analysis of the back-reflected light signal generated by the scattering effects in the silica composing the fibre. The DFOSs currently available exploit one or more of the three different scattering phenomena that take place in the fibre, namely the Brillouin, Rayleigh, and Raman scattering [12]. The Brillouin-based DFOSs are the most used for the measurement of strain over a long range and many geotechnical applications of these sensors in engineering have been developed in the recent past (e.g., [14]). The applications employing Rayleigh-based DFOSs are less common than others, mostly due to a more limited range of measurement (some tens of meters) and the higher cost of the interrogation unit. Nonetheless, since the Rayleigh-based DFOSs measure strain and temperature with unprecedented spatial resolution, they are often used in small scale physical models and setups, or in smaller areas where dense spatial sampling with minimal invasiveness is required [13,15,16]. In fact, one of the optical sensing techniques exploiting Rayleigh scattering is optical frequency domain reflectometry (OFDR), which assures a spatial resolution of some millimetres [17]. Brillouin-based sensors, on the other hand, usually are limited to some tens of centimetres at best [12].
Many researchers have studied the interaction mechanism between soil nails and different soils (e.g., [18,19,20,21,22,23,24]). Only a few have focused on the use of optical fibre sensors to monitor strain and stress along soil nails or anchors. The majority of these attempts were carried out in a laboratory, where the fibre can be handled more easily, and proposed the fibre Bragg grating (FBG) sensing technique [25,26,27,28]. Only few of them used DFOSs in site [29,30,31]. This technique provides single-point measurements (one measurement point for each fibre Bragg grating written on the fibre). It is analogous to the short base-length resistive strain gauges, yet with much fewer cabling issues, as FBGs are daisy-chained along the same fibre. In addition, the achievable spatial resolution using the FBG technique is, in principle, similar to that of the electrical techniques, while the number of sensing points per single fibre is determined by the expected maximum strain. Realistically, for this kind of application, this number is limited to 10 to 20 FBGs, i.e., sensing points, per fibre.
To overcome this limitation, optical fibre distributed sensing has been successfully used to measure soil-nail deformations. Amatya et al. [32] used a Brillouin optical time domain reflectometry (BOTDR) technique to monitor the strain exerted on some steel soil anchors, shorter than 10 m, installed in a steep slope cut by a highway. The soil nails (hollow Dywidag ribbed bars) were prepared in the laboratory and a twelve-core ribbon optical fibre cable was externally glued on the nails at fixed intervals along their length. Some of the nails survived neither the handling nor the transportation, and the authors highlighted the need for a more robust monitoring system.
Two years later, Iten et al. [33] measured the strain exerted on a short (10 m-long) steel ground anchor using the BOTDR technique, after having first tested its feasibility by laboratory pull-out tests. Hong et al. [34] instrumented a 35 m-long GFRP bar soil nail in the field with an optical fibre in a loop configuration for the distributed measurement of strain and temperature. They exploited a Brillouin optical time domain analysis (BOTDA) technique with positive results, but limited spatial resolution (0.4 m), concluding that other fully distributed sensing technologies should be used to verify the present sensor performance. More recently, Monsberger et al. [35] used the OFDR technique to measure the strain and curvature of 5 m-long steel grouted anchors with a very high spatial resolution. The steel bars, 26 mm in diameter, were equipped with optical fibres cemented in two longitudinal grooves in opposed positions. This manufacturing approach, although very precise and reproducible, requires the bar to be instrumented for its entire length and it is not feasible for the realisation and installation of long bars.
Composite anchors offer the possibility to install the FOS inside the cavity together with the strands. The subsequent cementation of the cavity assures the connection between the bar and the fibre that become, in this way, a good system for acquiring the strain along the bar. In order to investigate this possibility and the behaviour of composite anchors on a landslide, extensive research was undertaken. In the first phase, the authors carried out preliminary laboratory work aimed at verifying the reliability of the coupling among the bar, strand, and optical fibre. A subsequent phase, i.e., installation of FOS on an active landslide with the aim of monitoring the prompt activation of the soil–bar interaction with the landslide evolution, is currently in progress, and only some preliminary data sets are available at the moment. Therefore, this paper focuses on the presentation and discussion of the results of the first phase and only some preliminary results related to the DFOS’ installation on-site are discussed in the final part of the paper.

2. Coupling the Fibre to the Composite Bars

With respect to other research performed with DFOSs on soil nailing bars, composite anchors offer the possibility to instrument nails directly on the field, with high chances of fibre survivability during installation and operation. The installation is performed in two steps: First, the composite anchor is installed on site using the self-drilling technique; then, one or more harmonic steel tendons, fibre-optic equipped, are inserted in the inner cavity of the bar. The fibre is coupled to the tendons using steel hose clips at the bottom and can be pre-tensioned with the strands, if needed. Properly designed plastic cable ties keep the fibre sufficiently aligned along the length of the strands, to prevent the fibre from wrapping around the strands. The special grout used to cement the strands is effective also for the fibres’ coupling, avoiding the use of additional treatment. With respect to other recent installation procedures [35], long bars can be easily produced and instrumented. Finally, the spatial resolution that can be obtained employing OFDR is at least one order of magnitude better than that of Brillouin-based techniques [32,34].

3. Laboratory Tests

The laboratory experiment consists in traction tests performed on 10 bars, 5 of them equipped with a 0.6” harmonic steel tendon, cemented in the centre of the bar cavity, and 5 without a strand. The tests are labelled with the capital letter “S” for simple bars and “C” for composite bars, followed by a number ranging from 1 to 5. The bar is a Sirive® R51 (Cornedo Vicentino (VI), Italy), 3 m long, with nominal and average internal diameters equal to 51 and 30 mm, respectively, a nominal cross-section of 1200 mm2, and a maximum tensile strength of 800 kN. The tendon has a nominal diameter of 15.2 mm and a cross-section of 140 mm2; its maximum tensile strength is 240 kN.
All the bars are equipped with an optical cable, embedded in the bar by filling the inner cavity with cement. The optical cable is the BRUsens© strain V9 (Brugg, Switzerland), with a measurement range of up to 1% strain, which is achieved with a tensile load of 470 N. The cable is made up of an inner optical fibre hermetically sealed in a metal tube, which protects the fibre. In order to enhance the grip with the hosting material, i.e., the cement, the cable has a plastic corrugated sheath with 0.7 mm deep and 5 mm spaced indentations. To assure a reproducible installation, during the set up, the strand is held in a central position by plastic hooks, specifically designed and 3D-printed for this purpose (Figure 3a). The same hooks keep the fibre straight and close to the strand.
After the cement curing time—that is, after 28 days (Figure 3b)—the bars are subjected to traction using an oleo-dynamic hollow jack, manually operated. The bar is fixed on the jack by 4 nuts per side, as shown in Figure 4. The tensile test is carried out by applying a step by step load only to the central portion BC, 60 to 65 cm long, while the DFOS records the strain profile along the entire bar. A strain measurement is performed immediately after the application of each load increment and then again after 20 s, before increasing the load again. The interval of 20 s is adopted in order to have a double measure, without accumulating relevant viscous strain. The optical fibre readings taken immediately and after 20 s do not present appreciable differences at small and medium loads: only at the highest loads do some differences appear, probably due to the development of viscous-plastic strain. No temperature correction is applied to the DFOS strain measures since each test is performed in less than one hour in a room at an almost constant temperature.
In order to provide a comparison with strain determined by the traditional sensor, the bar elongation is also estimated from the relative horizontal displacement of the plates, B and C, recorded by two analogical micrometres.

Results

Figure 5 and Figure 6 present the strain measured by the DFOS along the simple and composite bars, respectively. Only the data referring to the portions of bar subjected to traction are represented; the portions in correspondence to the locking nuts are indicated in each plot by two shaded areas.
Even with some differences between the simple and composite bars, the curves obtained for all tests are similar, proving high repeatability of the experiment, both for the simple and the reinforced bars.
In all the tests, there is a central portion of the bar in which the strain is almost constant and two lateral portions, close to the plates and the locking nuts, in which the strain reaches exceptionally high values. The difference between the mean strain in the central portion and the maximum values near the plates is slight for the lighter tensile loads, but becomes extremely large as the load increases. In the simple bars, the central portion presenting an almost constant strain is about 40 cm long; the length of the transition portions, i.e., the portions in which the maximum strain recorded in correspondence to the nuts decreases until reaching the minimum value observed in the middle of the bars, measures about 10 cm per side. In composite bars, the central portion at constant strain shortens as the transition portions lengthen, especially at higher loads, where, in some cases, the central portion diminishes to under 10 cm. The causes of this heterogeneous strain profile may be twofold: The occurrence of a bar squeezing in correspondence to the nuts and the existence of an anchoring length in which a part of the load applied to the bars by the locking nuts is transferred to the strand inside the cavity.
To the authors’ knowledge, no experimental evidence of the first phenomenon is available in the literature. However, it is reasonable that, with the application of tensile force, the bar starts to slide with respect to the nuts, but the interlocking of the ribbons of the bar with the ribbons of the nuts strongly reduces the bar’s mobility. This mechanism gives rise to a local reduction of diameter, i.e., a squeezing of the bar, which in turn produces an increment in the radial constraint on the fibre, and a possible consequent local increase of the axial strain. This phenomenon can explain the difference of strain measured in the middle of the bar and close to the plate, observed both in simple and composite bars. It is reasonable to believe that the effect is stronger when the nuts are strongly locked on the bar against the plate; since the nuts are manually locked, the squeezing effect due to this interlocking is not constant in all the nuts. This fact may justify the unusual shape of the curves in the locking portion. In fact, the strain does not vary linearly, but seems to increase in steps, with unequal values in the four existing nuts.
The second phenomenon is similar to what occurs in concrete reinforcements. The anchoring length for concrete reinforcements is the initial portion of a reinforcement in which the load varies from zero to a no-zero value, the latter being related to the transfer of stresses acting on the concrete to the reinforcement, thanks to the tangential stresses developing at the interface of the concrete-reinforcement. This phenomenon explains why the length of the transition portion is more significant in the composite bars. Note that the measurements with DFOSs become very irregular when the recorded maximum strain exceeds, at some point, the limit of 11,000 to 12,000·µε = 1.1% to 1.2%. The spikes that are observed in the strain curves at larger loads are not real, likely due to the correlation algorithm used to track the Rayleigh shift in the OFDR interrogator, which can fail when a very large spatial strain gradient occurs. Interestingly, similar spikes have been observed in other applications [36], yet were ascribed to physically-induced anomalies rather than to a limitation of the measurement technique. Unfortunately, due to the squeezing effect, the strain gradient reaches high values early on during the test, although the strain in the middle of the bar is still within the measurable range. This fact limits the range of load in which the fibre gives reliable measures along the entire anchors. Nevertheless, the tests continue up to the maximum load applicable by the oleo-dynamic piston, corresponding to a global strain measured by traditional sensors of about 4% to 5%. Even at this strain, the complete failure of the bars does not emerge externally.
Figure 7 reports the trend of the traction force, F, and the relative secant stiffness, EA, calculated as F/ε and determined during the tests on the simple bars. The curves in Figure 7a refer to the mean strain recorded by the distributed fibre sensors on the 20 cm-long central portion of the bars; the same strain values are used to determine the relative stiffness. Figure 7b compares the curves obtained considering the mean strain measured by the distributed fibre sensors in the central 20 cm-long portion and the entire portion, BC, of the bars: In this case, only the data of tests on the bars, S2 and S4, are reported for clarity of the plot, but the curves of other tests are similar. Again, the high repeatability of the tests is evident, as well as the reliability of DFOSs as sensors for measuring strain in these tests.
Moreover, considering both the trend of the traction force and the correspondent secant stiffness, EA, it is clear that the bar squeezing close to the nuts only slightly affects the stiffness value at small loads. Remarkably, the stiffness calculated using the mean value of strain in the central 20 cm or on the portion, BC, is still within the EA variability presented in the various tests.
It is interesting to note that, in the range of the investigated strain, the secant stiffness, EA, is not constant, and the bars show a non-linear behaviour with a stiffness decreasing by 50% at strains higher than 0.4%. The maximum experimental stiffness is around 230,000 to 280,000 kN, which corresponds to the equivalent stiffness of the bar determined considering the stiffness of various components according to the equation:
E A e q = E c A c + E b A b E b A b
where Ec and Eb are the Young modulus of the cement mortar and steel constituting the cavity filling and the bar, and Ac and Ab are the corresponding cross-sections. Assuming that the cement is not working in traction, Eb = 204,000 MPa for steel S460, and Ab = 1200 mm2, the equivalent stiffness proves to be EAeq = 241,200 kPa. This equivalent stiffness is indicated in the plots for reference.
Despite the fact that the strain curves of Figure 5 and Figure 6 correspond to slightly different applied loads, a comparison of the curves permits the observation that the composite bars are more rigid than the simple bars at larger loads. In fact, the strains accumulated in the portion, BC, for traction forces less than 600 kN are quite similar, but above this threshold, the strain in the single bars increases much more than in the composite bars.
Figure 8 reports the trend of traction and the relative calculated secant stiffness, EA, compared to the strain measured on composite bars. Again, it is possible to observe that the tests and the relative measurements with the DFOS show high repeatability and that the squeezing affects the strain values mainly at large elongation, while its effects are quite negligible for strain less than 0.5% to 0.6%.
Also, for the composite bars, the maximum stiffness, EA, determined from the DFOS measurements is extremely close to the equivalent theoretical stiffness calculated with the equation:
E A e q = E c A c + E b A b + E s A s E b A b + E s A s
where Es and As are the Young modulus and the cross section of the strand, equal to 201,000 MPa and 140 mm2 respectively. In accordance with Equation (2), the equivalent maximum stiffness, EAeq, proves to be equal to 269,340 kN (represented for reference in Figure 8).
In Figure 9, the traction and stiffness vs strain of composite bars are compared to those of simple bars. In particular, Figure 9a presents the traction and equivalent stiffness vs strain in the central portion, 20 cm long, while Figure 9b presents the trend of the same parameters, but calculated and plotted vs strain determined from the external displacement transducers. One can note that the strain measured by the DFOS at each load step is four times less than that measured by the traditional analogical micrometre. Consequently, the maximum secant stiffness determinable with the external comparators is around 60 MN, against a value of 240 to 270 MN obtained through the DFOS measures and Equations (1) and (2). Further investigation into this discrepancy is on-going.
As final remarks of the experimental activity presented here, it is possible to conclude that:
  • The coupling of the soil-nailing bars with strands, inserted in the inner cavity, increments the tensile resistance of the bars and their elastic range, thanks to a partial redistribution of the tensile force to the internal strand. This synergy is not achieved in the initial portion of the composite bars because a part of the force applied to the bars from external constraints needs to be redistributed to the strand along the anchorage length. From these tests, the anchorage length seems to increase with the applied load, up to about 25 cm long for traction close to the yielding load of the bar.
  • The optical fibres adopted in this measurement system are suitable for monitoring the strain of composite bars in the elastic region, as long as the local strain remains less than 1.2%. The ribbed cover of the fibre guarantees effective interaction between the fibre cable and the cement, thus ensuring a reliable measurement of very small strain up to 1 µε, precision that cannot be obtained with traditional sensors.

4. On-Site Installation

4.1. Landslide Features

The on-site installation of the composite anchors equipped with DFOSs was carried out in June 2018 at the Giucano landslide. The landslide is located in the Lumigiana valley (Fosdinovo, Tuscany, Italy). It occurred in May 2013 after a period of very intense precipitation and reactivated in spring 2014 after another period of intense and prolonged rains. After these two significant events, the movements ceased almost entirely because the following years were relatively dry.
Figure 10 shows a map of the involved area, according to the survey performed by Sirgiovanni [37]. The landslide, a roto-translational movement with a sliding surface down to a maximum depth of about 12 to 13 m, has an extension of about 200 m × 150 m. There is also some evidence of slight movements outside the area involved in the 2013 and 2014 events.
The on-site investigation consisted of a geomorphological survey, in-situ boreholes, inclinometer installation and monitoring, and seismic surveys according to the P-wave refraction method along some lines [37]. In the area, the formation of Canetolo constitutes the rock base. The formation of Canetolo is a sedimentary formation presenting layers of dark-grey claystone closely interbedded with layers of marl and limestones, which have a thickness ranging from some centimetres to few decimetres. The bedrock is found between 12 and 13 m of depth and is characterised by a P-wave propagation rate, VP = 2000–3000 m/s, in the upper, more fractured and weathered part, and 3000 m/s in the deepest portion. The movements involve the colluvium, which can be subdivided into two layers. The upper layer, from 3 to 5 m thick, is composed of cobbles and boulders of limestone in a loose silty-clayey matrix and presents a VP value less than 500 m/s. It overlaps a more compacted colluvium characterised by a VP value of 500 to 2000 m/s (Figure 11). The transition from one layer to another is not clearly defined since the upper colluvium is a result of the weathering process.
Little information about the groundwater seepage and the level of the water table is available; only one piezometer was installed in 2013, but subsequent movements irreparably damaged it. In this brief monitoring period, the water table was found to be 12 to 13 m deep. Even so, very intense rain causes a temporary water spring to form in a relatively flat area in the centre of the landslide (Figure 10).
Since the landslide interrupted two portions of the road, Strada Provinciale 56, that leads to the hamlet of Giucano from the valley below, in 2016, the upper stretch of road was repaired by creating a retaining wall composed of the following:
  • A line of drilled piles, having a diameter of 1 m, an interspace of about 5 m, and a length of 22 m.
  • A line of Tub-fix type micropiles, inclined 45° and having a nominal diameter of 250 mm, an interspace of about 5 m, and a length of 24 m with an anchorage length of 12 m in the rock base.
  • A reinforced concrete horizontal beam, 50 cm thick and 7.20 m wide, founded on piles on the downhill side and on micropiles on the uphill side.
This intervention was aimed at the stabilisation of the upper road only. It had no significant effect on the stability of the entire area, which is still moving as seen from the measurements recently performed at inclinometers, specifically for the present research. Moreover, the lower branch of S.P.56 is still not passable. Figure 12 compares the displacement profile acquired at the inclinometer, SB, from March 13 to June 6 2014 with the last measurements taken from June 27 to November 28 2018. Even if the time intervals have the same duration, the cumulated displacements in the second period are less than 2 mm, significantly lower than the deformation measured in 2014 (14.5 mm). The difference is ascribable to the minor overall precipitation in the period of 2015 to 2018, with respect to the period of 2009 to 2014. Despite this, the profile of 28 November 2018 clearly shows a discontinuity at the same depth observed in 2014, proof that the landslide is still active, even if characterized now by a very slow movement rate.
Due to economical restrictions, the administration cannot make other interventions in the near future. For this reason, this landslide was chosen for the present research with the precise aim of studying the effect of slow movements on composite anchors.

4.2. Testing Site

Three Sirive® R76 Special bars, 40 m-long, with a nominal diameter of 76 mm, a mean internal diameter of 56 mm, and a cross-section of 2070 mm2, were installed with an inclination of 17.5° below the horizontal plane (Figure 13a). The bars are equipped with five (bar n.1) or six (bars n.2 and 3) 0.6” strands and an optical cable BRUsens© strain V9, embedded in the bar with cement filling the inner cavity. Bar n.2 is also equipped with a BRUsens© temperature cable 85° for temperature detection.
After the hardening of the filling cement, traction was applied on the bar with an oleo-dynamic piston (Figure 13b) in order to force the concrete slabs against the slope surface. Then, the bars were fixed to the concrete slabs with two nuts. Generally, the application of pre-tension is not required by the design of a remedial work, because composite anchors belong to the group of passive reinforcements. Nevertheless, the company who develops the composite anchors typically adopts this practice in order to create a reliable contact between the plate and the slope, therefore reducing the landslide displacement needed to activate the reinforcements.
The optical cables exiting from each bar are hosted inside a metal box, specifically designed to protect the fibres from atmospheric agents and vandalism (Figure 13a).
Immediately before the application of traction, a reference measurement of the Rayleigh shift along the optical cables was performed. Another measurement was carried out immediately after the application of the traction in June 2018, to determine the strain and temperature exerted along the optical fibres. Finally, an additional measurement was carried out at the beginning of October 2018.

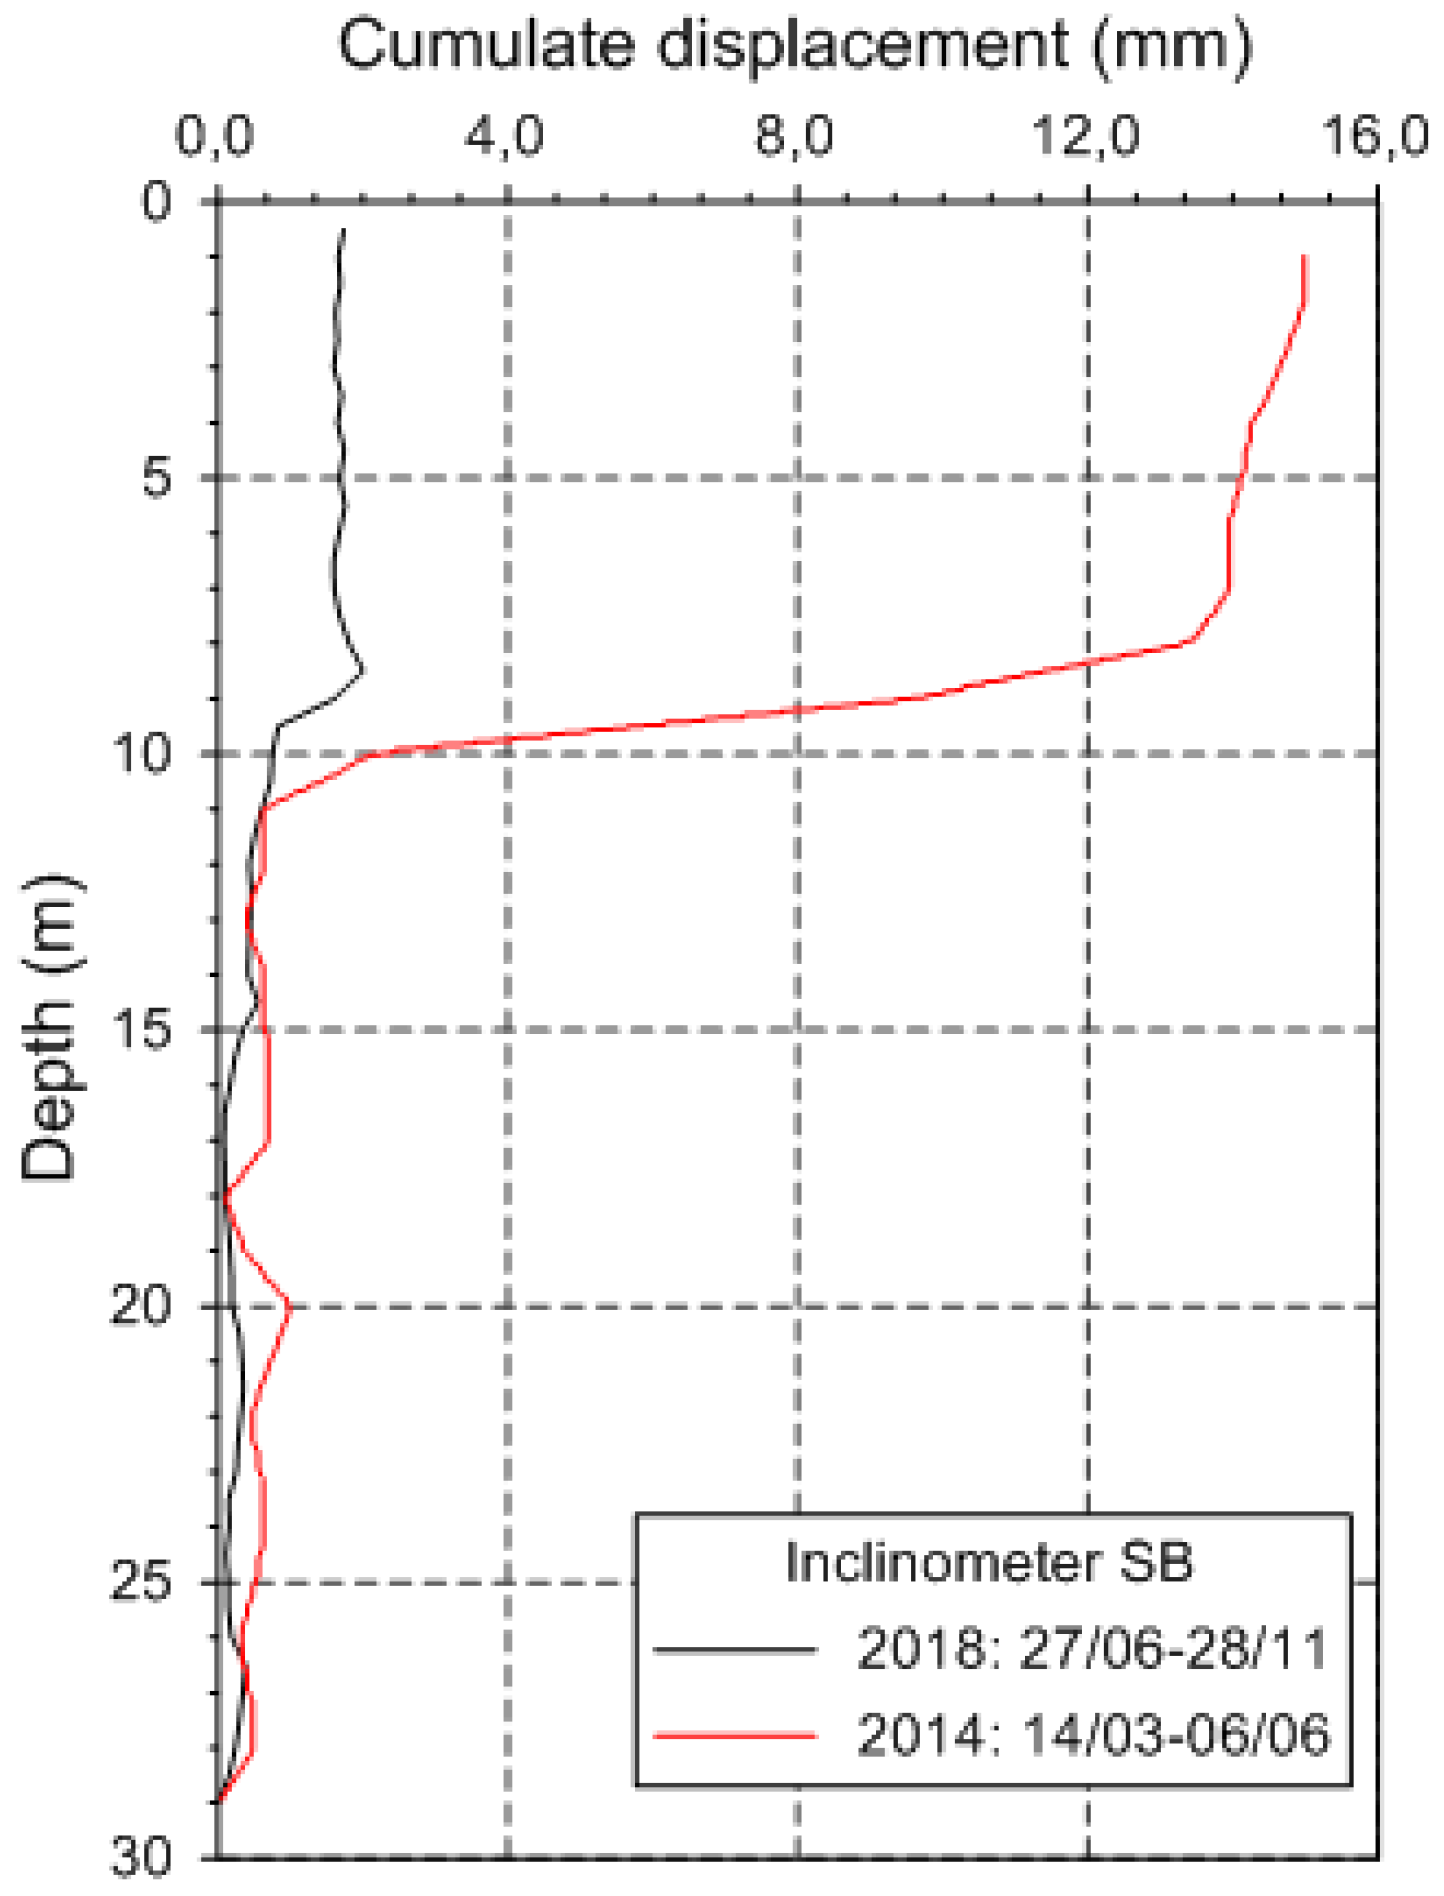
4.3. Results from the Testing Site

Figure 14 compares the strain measured by the optical fibres along the composite anchors in June 2018, immediately after the application of pre-tension, and on October 2018. In the plots, the portion of bars external from the ground is indicated by shaded areas. Even if only two readings are now available, and many others will have to be performed to study the behaviour of the bars when the landslide movements occur, it is possible to make some preliminary observations.
Let us first consider the strain profiles (ε-s curves, with s the distance from the slope surface) obtained after the pre-tension application. It is evident that the bars have a similar distribution of strain. Excluding some extremely large strain recorded in the external portion, possibly due to the interlocking with nuts or to a flexure deformation because of the piston weight, the maximum strain is always measured just behind the plate. Moving inside the ground, along the bars, the strain reduces gradually, falling to almost zero at about 16 to 17 m from the slope.
Another common feature of all the strain profiles consists of the presence of some high strains concentrated in some anchor portions at an almost regular 3 m interspace (in the plots, some arrows coupled with letters A and B indicate the more evident strain peaks). These high strain values are localized in correspondence to the couplings and are due to the inevitable interaction between the coupling device and the bars.
In order to determine the axial force, it is assumed that the axial strain measured by the optical fibres inside the slope can be referred only to axial forces. This hypothesis is reliable if the momentum is negligible and the cable is close to the barycentre of the bar cross-section, like in this application. Considering the various components of the anchor, its equivalent stiffness may be calculated according to Equation (2); correspondingly, EAeq = 557,800 kN and 584,900 kN, for composite bars with five and six tendons, respectively. The curves of Figure 14 can be converted to axial force, F, which has the distribution of the ε profile. The highest values close to the plate are about 670 kN (ε ≈ 1200 µε) for bar n.1 and 1290 kN for bars n.2 and n.3 (ε ≈ 2200 µε). These force values agree with those determined by means of the manometer of the oleo-dynamic piston only for bars n.2 and n.3. In the case of bar n.1, the load measured with the fibre is half of that applied by the manometer, likely because the piston was not correctly positioned.
For all the anchors, these loads remain in the elastic range of the anchors, being much lower than their tensile strength. In fact, the maximum tractions applicable to the composite bars, resulting from the sum of the tensile resistance of the bar (1159 kN), and the strands (260 kN/strand), are 2459 kN for the configuration with five strands and 2719 kN for the configuration with six strands.
The decreasing of strain along the bar, and of axial force, consequently, is due to the activation of distributed shear stress along the soil-bar interface that permits balancing of the traction imposed to the bars and contrasts the bar pull-out. In this case, as the applied loads are not very high with respect to the maximum resistance of these anchors, only the superficial portion of the bars is under stress, while the deepest portion (at s > 16–17 m) is completely unloaded and shows zero-strain.
It is important to note that the spatial gradient of the force-position curves is related to the shear stress mobilised at the soil-grout interface all around the bars according to the equation:
τ m o b = π D c d F d s π D c Δ F Δ s
in which Dc is the effective diameter of the anchor, considering here the ensemble of the bar with cement and the soil cemented by injection all around the bar. The quantity, Dc, is unknown, because, as reported by Cola and San Vitale [38], the self-drilling installation and the subsequent injection of the mortar, necessary for cementing the anchor to the ground, produces an enlargement of the hole and, generally, Dc is larger than the diameter of the bar or the drilling bit. Frequently, Dc is assumed as being equal to αDb, with Db the diameter of the drilling bit, and α = 1.2 as suggested by Bustamante and Doix [39] on the basis of tests carried out on injected micropiles. In our case, Db is 175 mm, and the effective diameter of the anchor may be assumed as being equal to Dc = 1.2 × 175 = 210 mm.
The shear stress, in turn, depends on the maximum shear strength and stiffness of the soil hosting the bar, but also on the strain or the relative displacement accumulated at the interface [34,40]. If the cumulated displacement is large enough, the mobilised shear stress can reach the maximum shear stress for the soil-grout contact, also known as the pull-out unitary resistance, qu. If the cumulated displacement continues to increase, the mobilised shear stress can remain constant or decrease, depending on the nature of the contact. If the contact has an ideal plastic response, τmo remains constant; otherwise, if the contact is brittle, it decreases. In any case, a constant slope of the axial strain curve (and consequently of the force profile) proves the condition, τmob = qu.
The maximum qu is, in turn, related to the effective vertical stress along the bars by a mean frictional coefficient, f′ult [8,41], defined as:
q u = σ v f u l t
with f′ult related to the frictional properties of the contact and to the injection pressure adopted for filling the cavity.
In the case under examination, the spatial gradient of the ε-s curves is not constant, a condition that suggests a heterogeneous response of the soil crossed by the anchors, probably due to a heterogeneous composition or soil compaction. In particular, for bar n.1, the deformed portion can be subdivided into four sections according to different behaviour:
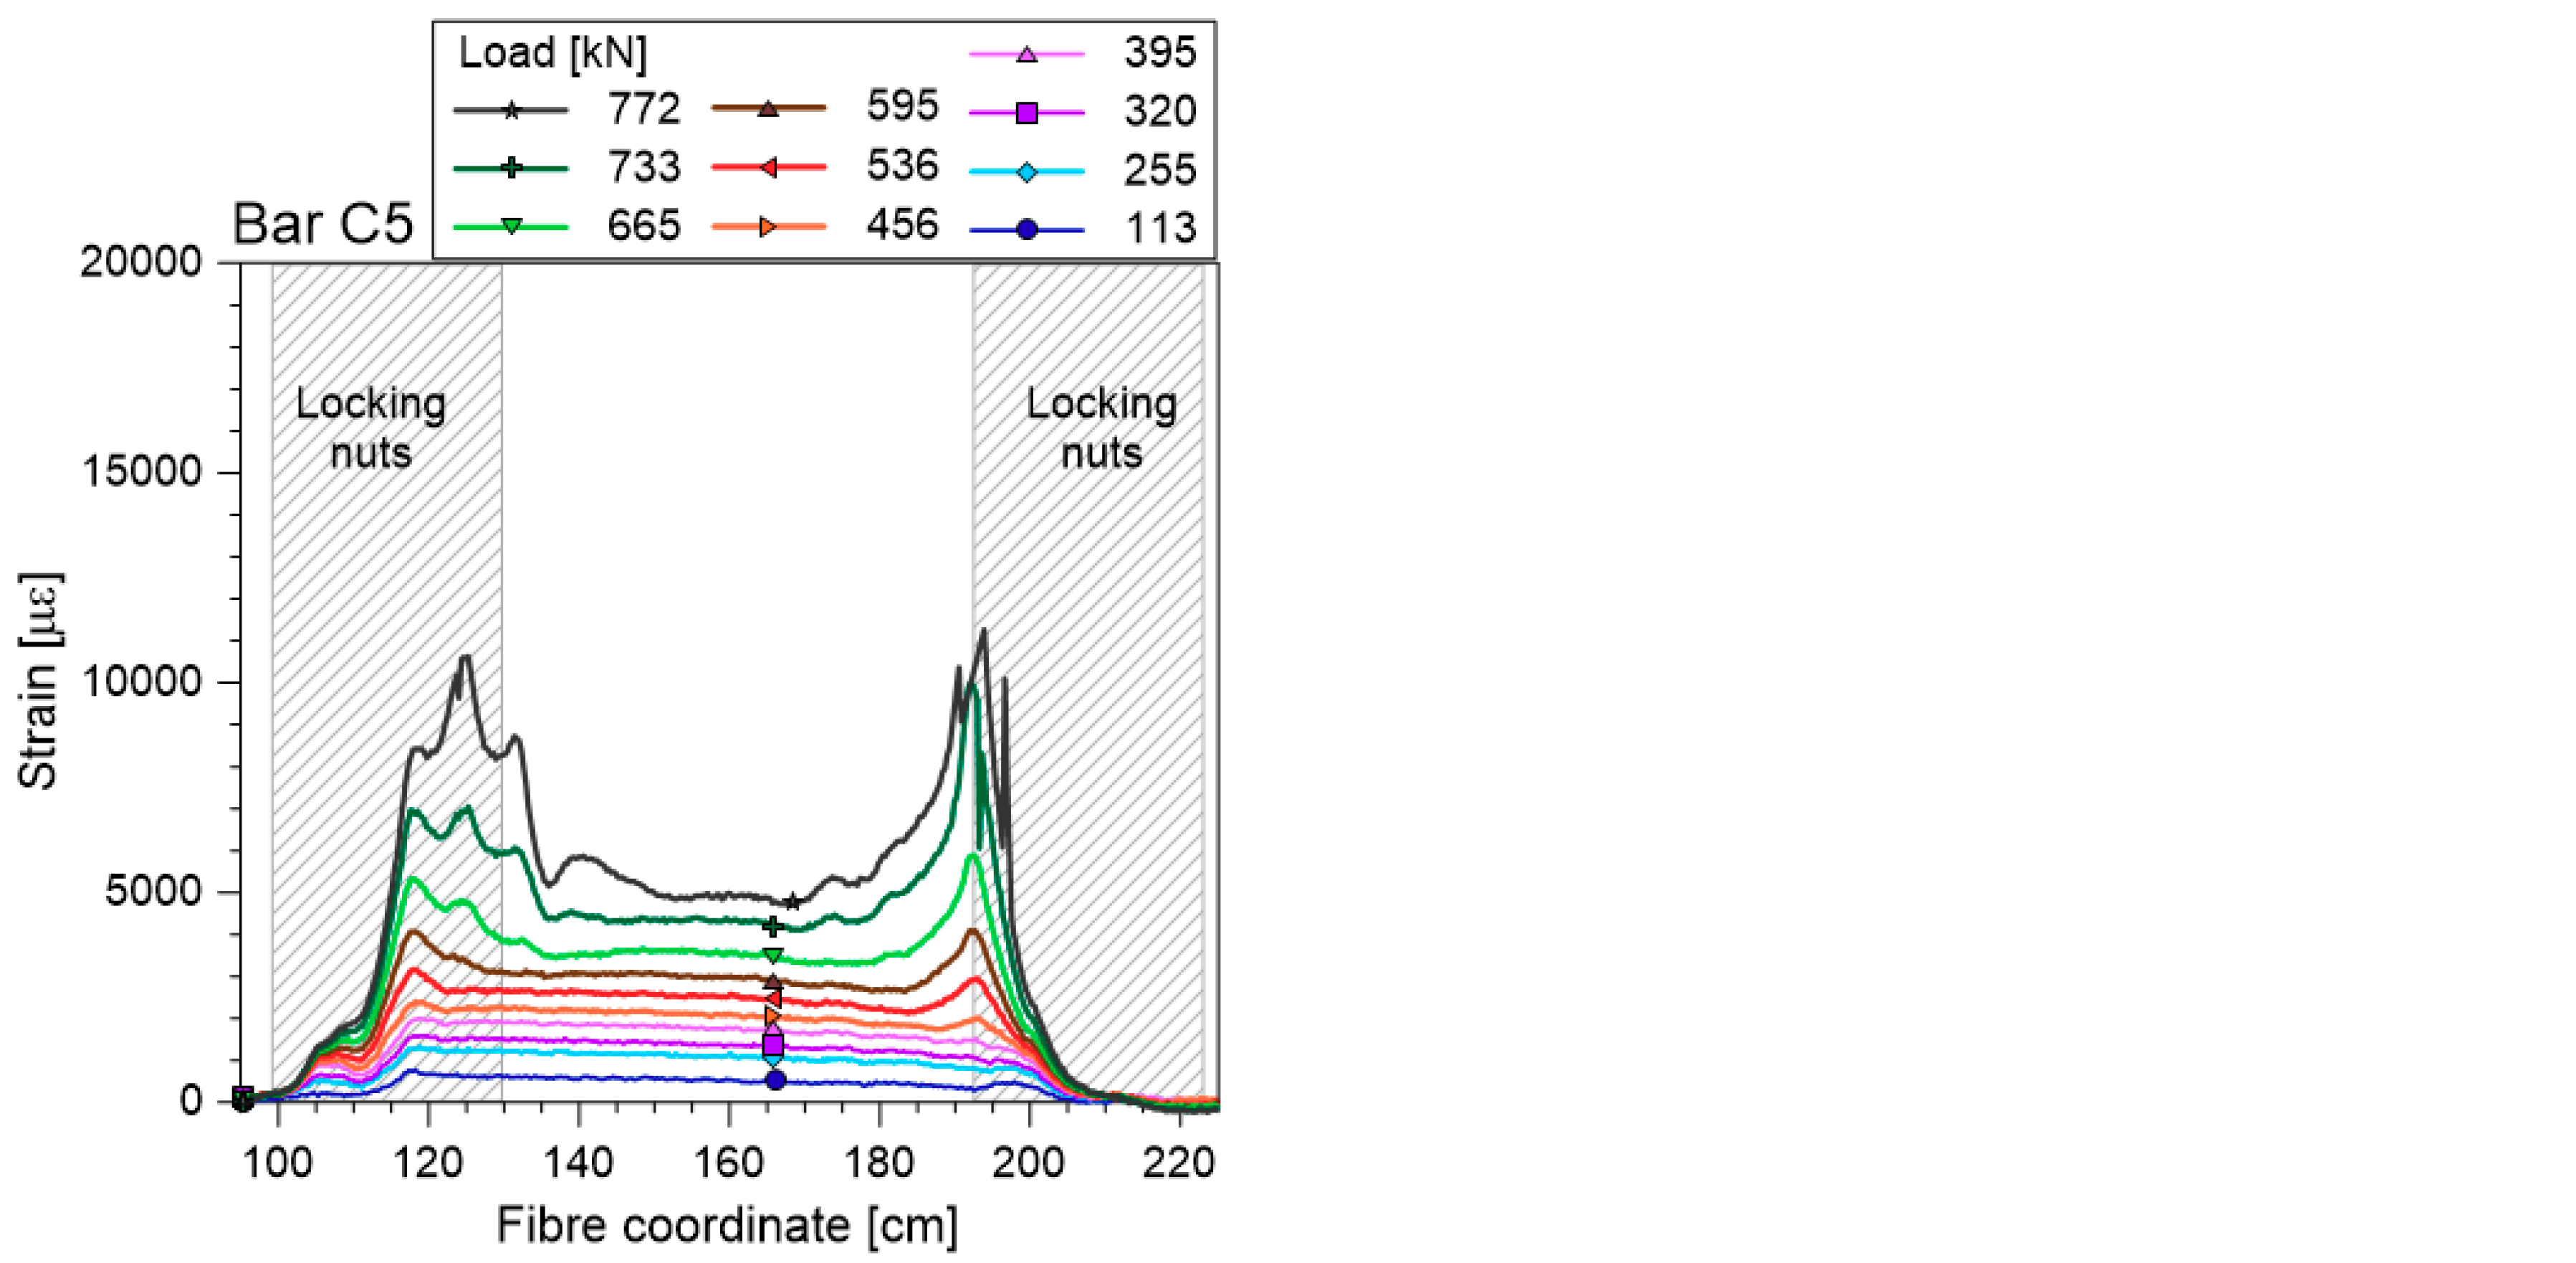
  • Up to 3.9 m, in which the F-s curve is almost constant, i.e., the shear stress is almost zero.
  • s in the range of 3.9 to 10.8 m, in which the slope of the F-s curve is constant and the mobilised shear stress is equal to τmob = 88 kPa.
  • s in the range of 10.8 to 12.0 m, characterised by a τmob ≈ 225 kPa.
  • From 12.0 to 17.5 m, in which the gradient reduces gradually to zero.
In bars n.2 and n.3, the homogeneous parts seem to be only two:
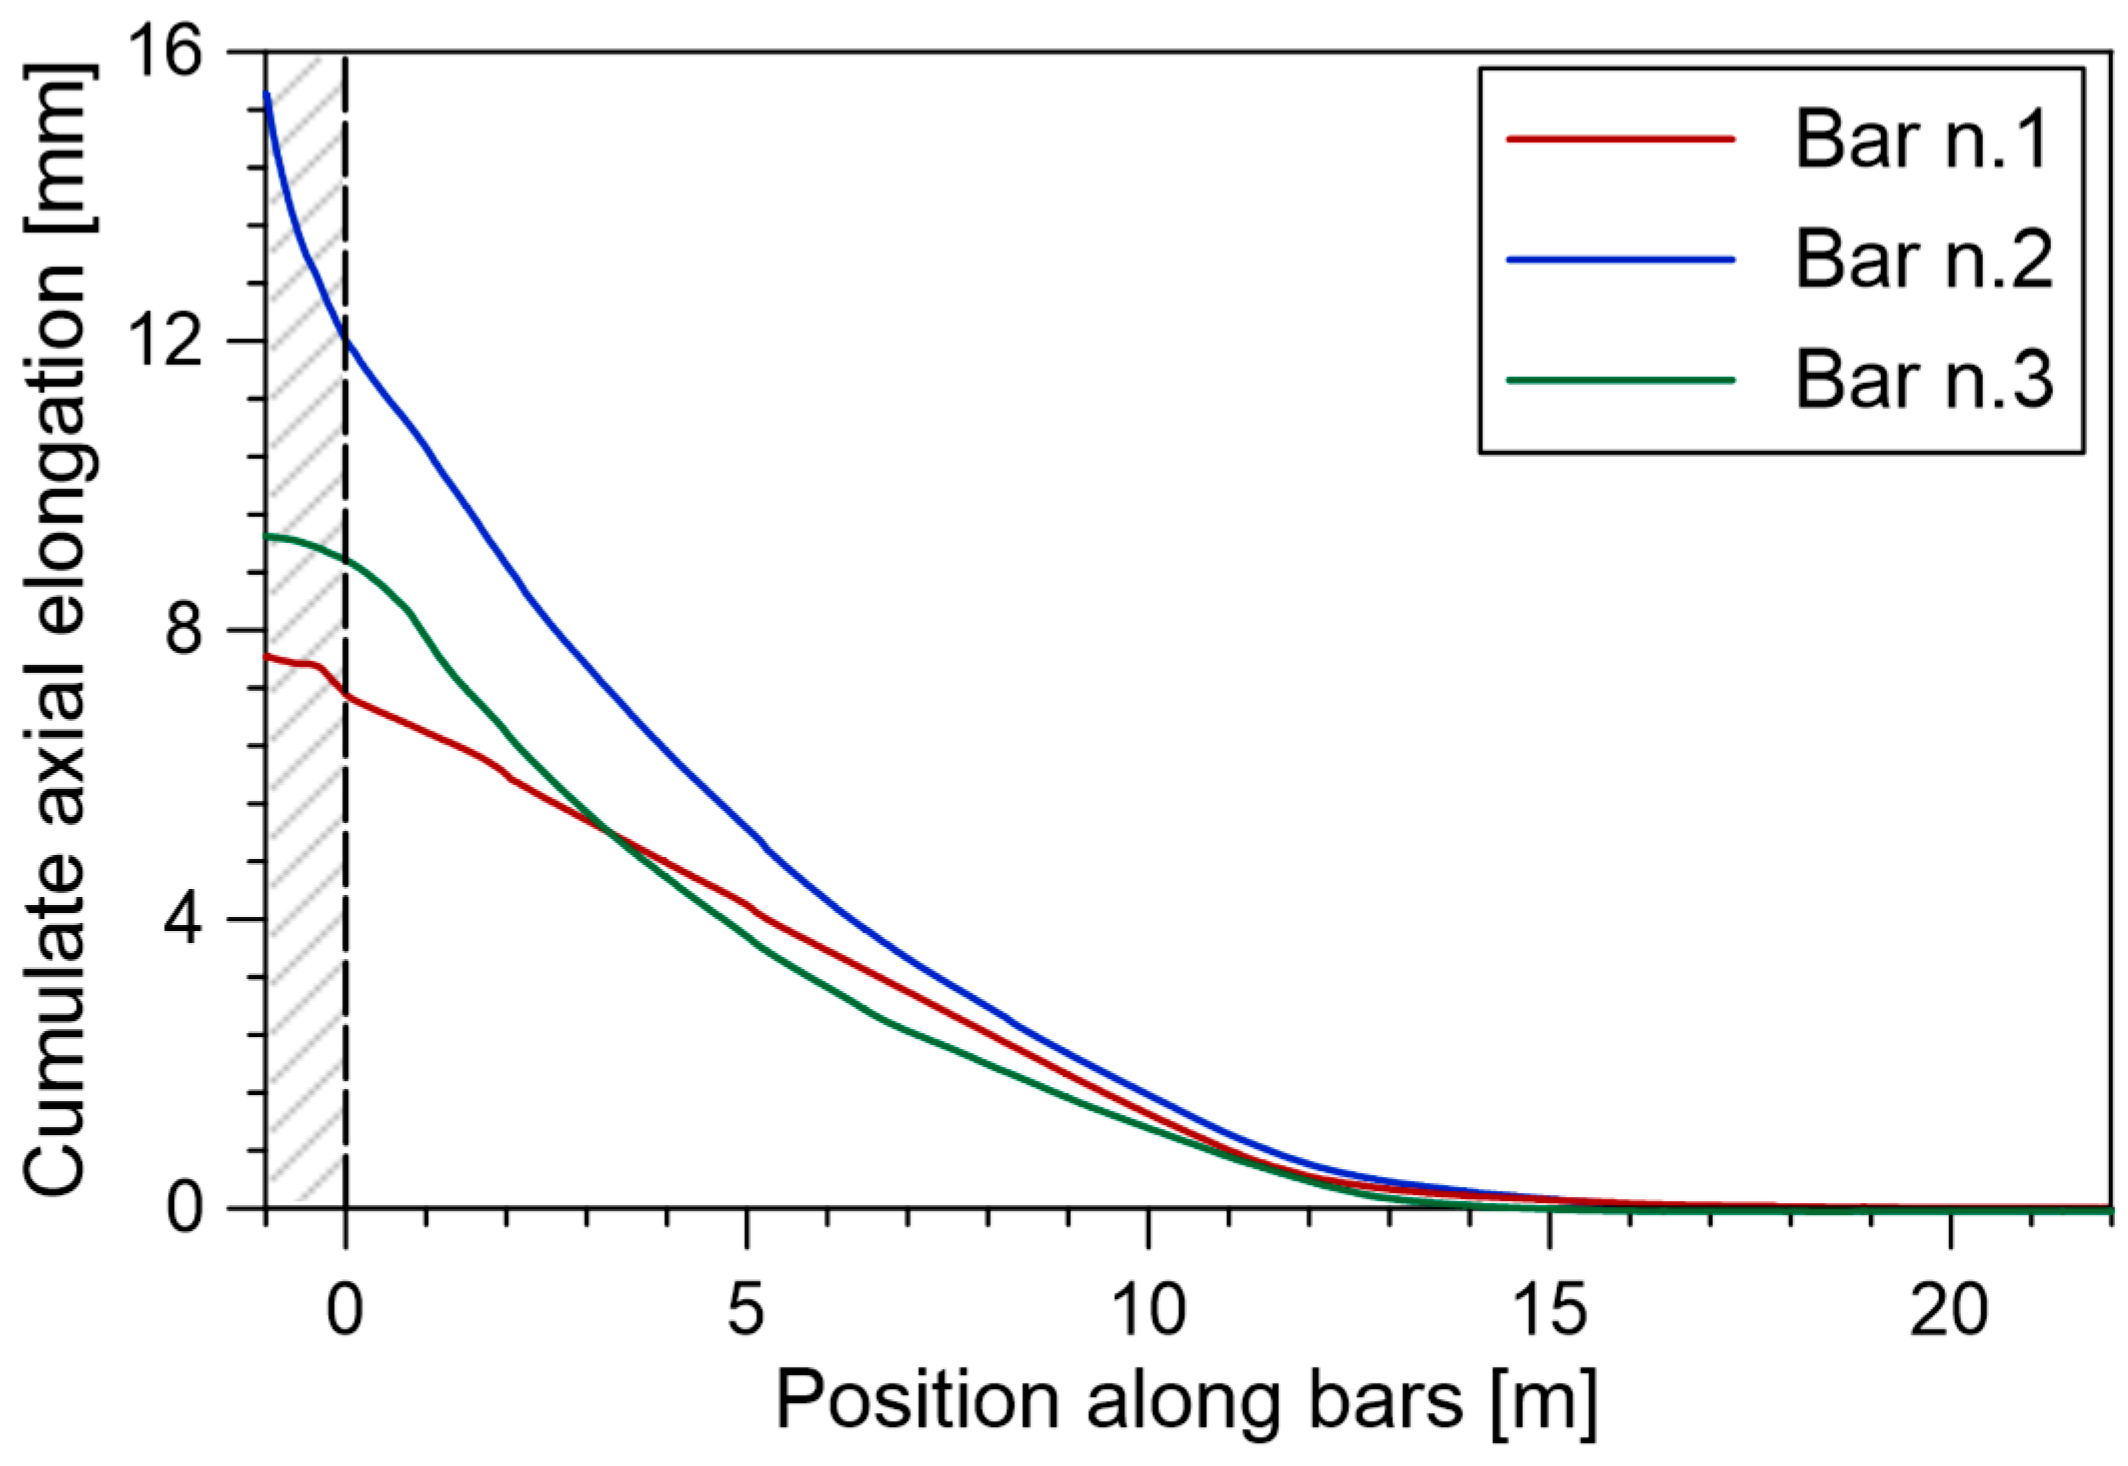
  • From 1.5 to 9.5 m for bar n.2 and from 2 m to 7 m for bar n.3, in which the slope of the F-s curve is constant, and the mobilised shear stress is τmob ≈ 225 and 260 kPa, respectively.
  • The deepest part in which the gradient gradually reduces to zero.
To evaluate the effective vertical stress in each portion, the soil is assumed to have a unit weight of 19 kN/m3 in the absence of water (the soil is the product of the rock weathering, and it has a clayey-silty matrix). From the map of Figure 10, the slope angle is around 27°, while the dip angle of the bars is 17.5°.
For bar n.1, between 3.9 and 10.8 m, qu equals 88 kPa; the depth of the portion is 5.8 m and the corresponding mean vertical stress, σ′v, is about 110 kPa. The friction coefficient in this portion is f′ult = 88/110 = 0.80. On the contrary, between 10.8 and 12.0 m, qu is 225 kPa; as the mean depth is 8.97 m, f′ult is equal to 225/170 = 1.32.
Both f′ult values are quite small when compared with the values reported in the literature for self-drilling nails [41] and obtained by pull-out tests. These low values may be related to the great length of the anchors used in this study (pull-out tests are generally performed on bars of a maximum length of 15 to 20 m) or to the cohesive nature of the fine matrix composing the weathered soil crossed by the anchors.
In any case, it is interesting to note that the pull-out resistance is reached with a slight strain of the bars, which corresponds to a small relative displacement at the contact soil-anchor. Figure 15 shows the cumulated axial elongation of the bars, determined by integrating the axial strain along the bar profile. The plots are limited to a distance from the head of less than 22 m, as the other parts of the curves all have zero values.
The maximum cumulated axial elongation is equal to less than 7.2 mm for bar n.1, 12 mm for bar n.2, and 9.0 mm for bar n.3. Even if these elongations are minor, they seem to be large enough to permit the soil to reach plasticity along the contact with the bars.
A final comment regarding the ε-s curves after pre-tension is on the position of the bedrock. The position at which the traction along the bars nullifies is at a depth of about 9.2 to 10.5 m, which approximately corresponds to the depth of the sliding surface detected in the inclinometers. It is possible to consider that at this depth, there is the transition to the bedrock, as also determined by the geo-seismic survey. Likely, during the pre-tension phase, the full pull-out action performable by the bedrock was not yet activated and the anchors still have a large reserve of resistance.
Considering now the ε-s curves recorded in the optical fibres after 3 months (October 2018), it is evident that all the anchors have experienced a relaxation process because the maximum strain is strongly reduced. In bars n.1 and n.3, the reduction of maximum strain is about 50% of the strain reached after pre-tension; it is equal to about 30% for bar n.2.
This relaxation may be due to the viscous behaviour of the soil. It was observed on other occasions [3,42] when a load cell was used to monitor the axial force in the reinforcement close to the plate over time. In the case examined here, the reduction of the maximum force at the plate is accomplished by a general decrease of the strain also along the bar profile, even if the three bars behave quite differently from each other.
Consequent to relaxation, the strain profile in bar n.1 becomes constant in a large external portion (i.e., 2 to 10 m from the anchor’s head). This indicates that the force guaranteed by the reinforcement is constant here and the shear stress mobilised at the soil-grout interface is nullified. The residual traction is completely absorbed by the portion of the bar at greater depths (10 to 16 m from the head), which shows no relaxation.
In bar n.2, the strain reduction is distributed along the profile, proportional to the strain recorded immediately after pre-tension. Even in this case, the deeper portion does not reduce its contribution.
Finally, in bar n.3, the time-variation of the force has an intermediate trend between that of bar n.1 and bar n.2: The strain decreases gradually in the more external part (down to 7 m), but a constant strain value is recorded in the deeper portion (from 11 m). Another particularity of this bar is that in the deepest portion, the strain increases with respect to the initial value, perhaps to compensate the loss of pull-out resistance in the more superficial portion.
Of course, the increase of strain in the deeper zone of bar n.3 may be related to landslide movements, but the displacement recorded at the inclinometers is so small that the link is not evident and other measurements must be carried out in the future to prove this fact. Nor is it known if those movements occurred before the last measurement carried out with the optical fibres.

5. Final Remarks

The results shown here must be considered as only preliminary results of research that will continue in the future over a prolonged time period. Despite being only preliminary, the results permit some important considerations to be made.
Firstly, the tests carried out in the laboratory demonstrate the feasibility of OFDR DFOS technology for monitoring composite bars. An effective mechanical coupling is easily created and the embedment of the fibres within the bars protects them from possible damage. The strain measured in laboratory tests highlights particular features of the anchors’ operation, such as the formation of a transition zone or the anchorage length needed in order to effectively transmit the external forces applied to the bars to the inner strands. The length of this transition zone is a function of the applied solicitation, but even in the more undersized bars, it is less than 25 cm at the maximum load.
Another important effect is the squeezing of the bars that occurred in correspondence to the locking nuts, which caused local anomalies in the measured strain by the optical fibres, likely due to a substantial strain gradient. Nevertheless, measurement with optical fibres guarantees high reliability and repeatability. The mechanical characteristics obtained from the tests with DFOS are congruent with the theoretical values and confirmed that the bars and the inner strands work in synergy on contrasting the applied force, both absorbing a traction proportional to their stiffness.
The distributed optical fibre sensors are very versatile also when monitoring composite anchors on-site, in particular at remarkably high spatial resolution. The tests carried out so far highlight the advantage of having a continuous measurement of strain inside the bars. The fibre permits immediate pull-out testing of the anchors, using only the external plate, which is a standard component of the composite anchors. No other devices are needed to carry out the test, so this configuration could become a standard practice for composite anchors, and the developer could be provided with information about the real pull-out resistance offered by the soil.
The strain profiles acquired after 3 months show a general relaxation of the anchors, probably due to the viscous behaviour of soil. The measurements will continue over a prolonged period of time in order to study the behaviour of these reinforcements during the activation phases of the landslide.

Author Contributions

Conceptualization, S.C., A.B. and L.S.; Methodology, S.C., A.B., L.B. and L.S; Validation, L.S.; Formal Analysis, L.S, L.B., A.B and F.C.T.P.; Investigation, A.B. and L.S.; Resources, A.B.; Data Curation, A.B., S.C., L.B., F.C.T.P. and L.S.; Writing—Original Draft Preparation, S.C., L.B., L.S.; Writing—Review & Editing, L.B. and L.S.; Visualization, A.B., F.C.T.P, L.B and L.P.; Supervision, S.C.; Funding Acquisition, S.C. and A.B.

Funding

This research was funded by Sirive s.r.l. company.

Acknowledgments

The composite anchors for landslide stabilization have a European Patent realised in 2015 (Sirive® Floating Anchor, EP 2354323 B1). We thank all those who contributed to this study, in particular Sirive s.r.l. company, who granted the study, the Mayor of the Municipality of Fosdinovo (MS, Italy), who gave permission for the in-situ installation, and the geologist M. Maracchioli, who gave information about the geology of the landslide area.

Conflicts of Interest

The authors declare no conflict of interest.

References

  1. Petley, D. Global patterns of loss of life from landslides. Geology 2012, 40, 927–930. [Google Scholar] [CrossRef]
  2. Froude, M.J.; Petley, D.N. Global fatal landslide occurrence from 2004 to 2016. Nat. Hazards Earth Syst. Sci. 2018, 18, 2161–2181. [Google Scholar] [CrossRef] [Green Version]
  3. Bisson, A.; Cola, S.; Tessari, G.; Floris, M. Floating anchors in landslide stabilization: The Cortiana case in North-Eastern Italy. In Engineering Geology for Society and Territory; Lollino, G., Giordan, D., Crosta, G.B., Corominas, J., Azzam, R., Wasowski, J., Sciarra, N., Eds.; Springer: Cham, Switzerland, 2015; Volume 2, pp. 2083–2087. [Google Scholar]
  4. Bisson, A.; Cola, S. Floating anchors for the stabilization of Cischele landslide in the Venetian Prealps. In Proceedings of the 13th Congress INTERPRAEVENT, Lucerne, Switzerland, 30 May–2 June 2016; pp. 288–289. [Google Scholar]
  5. Bisson, A.; Cola, S.; Baran, P.; Zydroń, T.; Gruchot, A.T.; Murzyn, R. Passive composite anchors for landslide stabilization: An Italian-Polish research program. In Proceedings of the In Landslides and Engineered Slopes. Experience, Theory and Practice: Proceedings of the 12th International Symposium on Landslides, Napoli, Italy, 12–19 June 2016; p. 433. [Google Scholar]
  6. Bisson, A. Sirive® Floating Anchor for Landslide Stabilization. Ph.D. Thesis, University of Padova, Padua, Italy, January 2015. [Google Scholar]
  7. UNI EN 14490:2010 Execution of special geotechnical works-Soil nailing. Italian. Available online: https://infostore.saiglobal.com/en-au/standards/uni-en-14490-2010-1093491_SAIG_UNI_UNI_2544990/ (accessed on 25 May 2019).
  8. FHWA-IF-03-017 Geotechnical Engineering Circular No. 7. Soil Nail Walls. Available online: https://www.fhwa.dot.gov/engineering/geotech/pubs/nhi14007.pdf (accessed on 25 May 2019).
  9. Stocker, M.F.; Korber, G.W.; Gassler, G.; Gudehus, G. Soil nailing. In Proceedings of the International Conference on Soil Reinforcement, Paris, France, 20–22 March 1979; pp. 469–474. [Google Scholar]
  10. Plumelle, C.; Schlosser, F.; Oclage, P.; Knochenmus, G. French national research project on Soil Nailing: Clouterre. Geotech. Spec. Publ. ASCE 1990, 25, 660–675. [Google Scholar]
  11. Phear, A.; Dew, C.; Ozsoy, B.; Wharmby, N.J.; Judge, J.; Barley, A.D. Soil Nailing: Best Practice Guidance; Report C63.; CIRIA: London, UK, 2005; ISBN 978-0860176374. [Google Scholar]
  12. Schenato, L. A review of distributed fibre optic sensors for geo-hydrological applications. Appl. Sci. 2017, 7, 896. [Google Scholar] [CrossRef]
  13. Schenato, L.; Palmieri, L.; Camporese, M.; Bersan, S.; Cola, S.; Pasuto, A.; Galtarossa, A.; Salandin, P.; Simonini, P. Distributed optical fibre sensing for early detection of shallow landslides triggering. Sci. Rep. 2017. [Google Scholar] [CrossRef]
  14. de Battista, N.; Kechavarzi, C.; Seo, H.; Soga, K.; Pennington, S. Distributed fibre optic sensors for measuring strain and temperature of cast-in-situ concrete test piles. In Proceedings of the International Conference on Smart Infrastructure and Construction (ICSIC), Cambridge, UK, 27–29 June 2016. [Google Scholar] [CrossRef]
  15. Bersan, S.; Schenato, L.; Rajendran, A.; Palmieri, L.; Cola, S.; Pasuto, A.; Simonini, P. Application of a high resolution distributed temperature sensor in a physical model reproducing subsurface water flow. Meas. J. Int. Meas. Confed. 2017, 98, 321–324. [Google Scholar] [CrossRef]
  16. Bersan, S.; Bergamo, O.; Palmieri, L.; Schenato, L.; Simonini, P. Distributed strain measurements in a CFA pile using high spatial resolution fibre optic sensors. Eng. Struct. 2018, 160, 554–565. [Google Scholar] [CrossRef]
  17. Palmieri, L.; Schenato, L. Distribuited optical fibre fensing based on rayleigh scattering. Open Opt. J. 2013, 7, 104–127. [Google Scholar] [CrossRef]
  18. Milligan, G.W.E.; Tei, K. The pull-out resistance of model soil nails. Soils Found. 1998, 38, 179–190. [Google Scholar] [CrossRef]
  19. Luo, S.Q.; Tan, S.A.; Yong, K.Y. Pull-out resistance mechanism of a soil nail reinforcement in dilative soils. SOILS Found. 2011, 40, 47–56. [Google Scholar] [CrossRef]
  20. Hong, Y.-S.; Wu, C.-S.; Yang, S.-H. Pullout resistance of single and double nails in a model sandbox. Can. Geotech. J. 2003, 40, 1039–1047. [Google Scholar] [CrossRef]
  21. Junaideen, S.M.; Tham, L.G.; Law, K.T.; Lee, C.F.; Yue, Z.Q. Laboratory study of soil–nail interaction in loose, completely decomposed granite. Can. Geotech. J. 2004, 41, 274–286. [Google Scholar] [CrossRef]
  22. Chu, L.-M.; Yin, J.-H. Comparison of interface shear strength of soil nails measured by both direct shear box tests and pullout tests. J. Geotech. Geoenviron. Eng. 2005, 131, 1097–1107. [Google Scholar] [CrossRef]
  23. Su, L.-J.; Chan, T.C.F.; Yin, J.-H.; Shiu, Y.K.; Chiu, S.L. Influence of overburden pressure on soil–nail pullout resistance in a compacted fill. J. Geotech. Geoenviron. Eng. 2008, 134, 1339–1347. [Google Scholar] [CrossRef]
  24. Pradhan, B.; Tham, L.G.; Yue, Z.Q.; Junaideen, S.M.; Lee, C.F. Soil–nail pullout interaction in loose fill materials. Int. J. Geomech. 2006. [Google Scholar] [CrossRef]
  25. Schroeck, M.; Ecke, W.; Graupner, A. Strain monitoring in steel rock bolts using FBG sensor arrays. Appl. Opt. Fiber Sensors. Int. Soc. Opt. Photonics 2000, 4074, 298–305. [Google Scholar]
  26. Zhang, B.; Benmokrane, B.; Ebead, U.A.A. Design and evaluation of Fiber-Reinforced Polymer bond-type anchorages and ground anchors. Int. J. Geomech. 2006, 6, 166–175. [Google Scholar] [CrossRef]
  27. Hong, C.-Y.; Yin, J.-H.; Jin, W.; Wang, C.; Zhou, W.-H.; Zhu, H.-H. Comparative study on the elongation measurement of a soil nail using Optical Lower Coherence Interferometry method and FBG method. Adv. Struct. Eng. 2010, 13, 309–319. [Google Scholar] [CrossRef]
  28. Pei, H.; Yin, J.; Zhu, H.; Hong, C. Performance monitoring of a glass fiber-reinforced polymer bar soil nail during laboratory pullout test using FBG sensing technology. Int. J. Geomech. 2012, 13, 467–472. [Google Scholar] [CrossRef]
  29. Zhu, H.-H.; Yin, J.-H.; Jin, W. Soil nail monitoring using Fiber Bragg Grating sensors during pullout test. In Proceedings of the Joint 60th Canadian Geotechnical and 8th Joint CGS/IAH-CNC Groundwater Conferences, Ottawa, ON, Canada, 21–24 October 2007; pp. 821–828. [Google Scholar]
  30. Zhu, H.H.; Shi, B.; Zhang, J.; Yan, J.F.; Zhang, C.C. Distributed fiber optic monitoring and stability analysis of a model slope under surcharge loading. J. Mt. Sci. 2014, 11, 979–989. [Google Scholar] [CrossRef]
  31. Weng, X.; Ma, H.; Wang, J. Stress monitoring for anchor rods system in subway tunnel using FBG technology. Adv. Mater. Sci. Eng. 2015. [Google Scholar] [CrossRef]
  32. Amatya, B.; Bennett, P.; Uchimura, T.; Soga, K.; Ball, P.; Lung, R. Installation of optical fibre strain sensors on soil nails used for stabilising a steep highway cut slope. In Proceedings of the 1st International Conference on Transportation Geotechnics, Nottingham, UK, 25–27 August 2008; pp. 277–282. [Google Scholar]
  33. Iten, M.; Puzrin, A.M. Monitoring of stress distribution along a ground anchor using BOTDA. Sensors Smart Struct. Technol. Civil, Mech. Aerosp. Syst. 2010 2010, 7647, 76472J. [Google Scholar]
  34. Hong, C.Y.; Yin, J.H.; Zhang, Y.F. Deformation monitoring of long GFRP bar soil nails using distributed optical fiber sensing technology. Smart Mater. Struct. 2016, 25, 085044. [Google Scholar] [CrossRef]
  35. Monsberger, C.M.; Lienhart, W.; Caporossi, P. Distributed fiber optic sensing along grouted anchors to assess curvature and bending characteristics. In Proceedings of the 26th International Conference on Optical Fiber Sensors, Lausanne Switzerland, 24–28 September 2018. [Google Scholar]
  36. Bado, M.F.; Casas, J.R.; Barrias, A. Performance of rayleigh-based distributed optical fiber sensors bonded to reinforcing bars in bending. Sensors 2018, 18, 3125. [Google Scholar] [CrossRef] [PubMed]
  37. Sirgiovanni, E. Movimento franoso in località Giucano su SP56: Relazione geologico-geomorfologica e geologio-tecnica. Available online: http://www.comune.cereseto.al.it/doc/file/RelazionegeologicadivarianteconIIIfaseefranadefinitiva01-06-2011.pdf (accessed on 25 May 2019).
  38. Cola, S.; San Vitale, N. Interazione tra rivestimento, barre e terreno nelle pareti sostenute con Soil Nailing. In Proceedings of the XXIV CNG–Innovazione Tecnologica nell’Ingegneria Geotecnica, Napoli, Italy, 22–24 June 2011; Volume 1, pp. 217–230. [Google Scholar]
  39. Bustamante, M.; Doix, B. Une méthode pour le calcul des tirants et des micropieux injectés. Bull. Liaison Lab. des Ponts Chaussèes 1985, 140, 75–95. [Google Scholar]
  40. Hong, C.-Y.; Yin, J.-H.; Zhou, W.-H.; Pei, H.-F. Analytical study on progressive pullout behavior of a soil nail. J. Geotech. Geoenviron. Eng. 2011, 138, 500–507. [Google Scholar] [CrossRef]
  41. Elias, V.; Juran, I. Soil Nailing for Stabilization of Highway Slopes and Excavations; publication FHWA-RD-89-198; Federal Highway Administration: Washington, DC, USA, 1991. [Google Scholar]
  42. Bisson, A.; Cola, S. Stabilizzazione di movimenti franosi con ancoraggi flottanti: il caso di frana Val Maso (Valli del Pasubio, Vicenza). In Proceedings of the 5° IAGIG. L’Ingegneria geotecnica a servizio delle grandi opere: Necessità e opportunità, Roma, Italy, 22–23 May 2015. [Google Scholar]
Figure 1. Elements of the composite anchors.
Geosciences 09 00240 g001
Figure 2. Working schemes of the “floating anchor” technique with composite bars and external slab [6].
Geosciences 09 00240 g002
Figure 3. Plastic hooks for coupling the DFOS (distributed fibre optic sensors) to the tendon in a composite bar: (a) element for extremity; (b) internal element.
Geosciences 09 00240 g003
Figure 4. Set up for traction tests on composite and single bars in the laboratory: the segments OA and DF are free portions; portions AB and CD are nuts for fixing the bar to the jack; the central segment BC is the portion loaded with the jack.
Geosciences 09 00240 g004
Figure 5. Strain recorded by DFOSs on simple bars (S1–S5) tested in the laboratory.
Geosciences 09 00240 g005aGeosciences 09 00240 g005b
Figure 6. Strain recorded by DFOSs on composite bars (C1–C5) tested in the laboratory.
Geosciences 09 00240 g006aGeosciences 09 00240 g006b
Figure 7. Traction vs strain and bar stiffness vs strain on simple bars tested in the laboratory: (a) mean strain recorded by the DFOS in the central 20 cm; (b) mean strain recorded by the DFOS in the central 20 cm vs. entire portion BC.
Geosciences 09 00240 g007
Figure 8. Traction vs strain and bar stiffness vs strain on composite bars tested in the laboratory: (a) mean strain recorded by the DFOS in the central 20 cm; (b) mean strain recorded by the DFOS in the central 20 cm vs entire portion BC.
Geosciences 09 00240 g008
Figure 9. Comparison of traction and bar equivalent stiffness vs strain of simple and composite bars tested in the laboratory: (a) mean strain recorded by the DFOS in the central 20 cm; (b) mean strain recorded by external analogical micrometers.
Geosciences 09 00240 g009
Figure 10. Map of the Giucano landslide activated in May 2013.
Geosciences 09 00240 g010
Figure 11. P-wave propagation rate according to surficial refraction tests compared with inclinometer lectures and down-hole profiles.
Geosciences 09 00240 g011
Figure 12. Comparison between displacements recorded in 2014 and in 2018 in the same borehole.
Geosciences 09 00240 g012
Figure 13. In-situ installation of the composite bars equipped with optical cables: (a) view of the external portion of bars with metallic boxes for hosting cables; (b) set up of the oleo-dynamic piston for the application of pre-tension to the bars.
Geosciences 09 00240 g013
Figure 14. Axial strain along anchors immediately after pre-tension and after about 3 months of the three tested composite anchors.
Geosciences 09 00240 g014
Figure 15. Cumulated axial elongation along anchors immediately after pre-tension.
Geosciences 09 00240 g015

