A Preliminary Investigation on the Role of Brittle Fracture in the Kinematics of the 2014 San Leo Landslide


1
Department of Earth Sciences, Simon Fraser University, Burnaby, BC V5A 1S6, Canada
2
Norman B. Keevil Institute of Mining Engineering, University of British Columbia,Vancouver, BC V6T 1Z4, Canada
3
DICAM–Dipartimento di Ingegneria Civile, Ambientale, e dei Materiali, University of Bologna,40136 Bologna, Italy
*
Author to whom correspondence should be addressed.
Geosciences 2019, 9(6), 256; https://doi.org/10.3390/geosciences9060256
Submission received: 11 May 2019
/
Revised: 3 June 2019
/
Accepted: 5 June 2019
/
Published: 7 June 2019
(This article belongs to the Special Issue Mountain Landslides: Monitoring, Modeling, and Mitigation)
Abstract
:The stability of high rock slopes is largely controlled by the location and orientation of geological features, such as faults, folds, joints, and bedding planes, which can induce structurally controlled slope instability. Under certain conditions, slope kinematics may vary with time, as propagation of existing fractures due to brittle failure may allow development of fully persistent release surfaces. In this paper, the progressive accumulation of brittle damage that occurred prior to and during the 2014 San Leo landslide (northern Italy) is investigated using a synthetic rock mass (SRM) approach. Mapping of brittle fractures, rock bridge failures, and major structures is undertaken using terrestrial laser scanning, photogrammetry, and high-resolution photography. Numerical analyses are conducted to investigate the role of intact rock fracturing on the evolution of kinematic freedom using the two-dimensional Finite-discrete element method (FDEM) code Elfen, and the three-dimensional lattice-spring scheme code Slope Model. Numerical analyses show that the gradual erosion of clay-rich material below the base of the plateau drives the brittle propagation of fractures within the rock mass, until a fully persistent, subvertical rupture surface form, causing toppling of fault-bounded rock columns. This study clearly highlights the potential role of intact rock fracturing on the slope kinematics, and the interaction between intact rock strength, structural geology, and slope morphology.
1. Introduction
The stability of rock slopes is largely controlled by the location and orientation of geological features such as faults, shear zones, bedding, foliation, and discontinuities [1,2]. The intersection of these features may allow the removability and the failure of rock mass blocks at various scales. The condition that characterizes removable blocks is generally referred to as “kinematic freedom”. Many major rockslides have been controlled by the orientation of geological features [3,4].
Geomorphic features, such as gullies and crevices, may also reduce lateral constraint in potentially unstable slopes, thus enhancing their kinematic freedom [5,6,7].
Under certain conditions, the kinematics of a rock slope may evolve over time due to brittle damage accumulation and fracture propagation. The geomorphic evolution of valley sides may enhance the brittle propagation of fractures due to stress concentration [8]. Time-dependent mechanisms, such as subcritical fracture propagation, may cause the formation of fully persistent rupture surfaces that provide kinematic release to blocks that were previously nonremovable [9]. The accumulation of brittle damage is a critical component in the development of footwall failures and large-scale, biplanar, and compound rockslides, due to the formation of a highly damaged transition zone at the interface between active and passive blocks [10,11,12]. Additionally, intact rock fracturing may cause the failure of nondaylighting rock wedges, due to the formation of a basal rupture surface caused by failure of rock bridges and coalescence of brittle cracks [13].
The strength of intact rock is orders of magnitude higher than discontinuities; therefore, strength and size of intact rock bridges between discontinuities have a great impact on the stability of rock slopes [9]. A small amount (0.1–10%) of rock bridges favorably distributed within a rock slope strongly increases the stability of the slope [14,15]. Despite the major significance of intact rock bridges in controlling the behavior of rock masses, their characterization remains an extremely challenging task [14], and the deterministic quantification of the rock bridges existing along a rupture surface may be undertaken only after failure occurs [15,16,17]. Discrete fracture networks (DFNs) are consequently being increasingly employed in rock engineering to investigate the distribution and dimensions of rock bridges using a stochastic approach [18].
In this paper, the effects of intact rock fracturing on the evolution of the kinematic freedom of rock slopes are investigated using the 2014 San Leo landslide (Northern Italy) as a case study. This failure occurred as a toppling instability that caused the detachment of a 100 m high slab from the San Leo plateau, due to the erosion of the underlying clay shales and progressive, brittle propagation of fractures to form the eventual rupture surface [19]. The San Leo 2014 failure is modelled using a DFN approach, and the simulations conducted using both the two-dimensional finite-discrete element code Elfen [20], and the three-dimensional lattice-spring code Slope Model [21].
Methods for Numerical Modelling of Brittle Fracture
The stability analysis of rock slopes with nonpersistent rupture surfaces is a challenging task. Initial investigations were performed by assigning a cohesion value to fully-persistent, equivalent sliding surfaces, in order to implicitly simulate the presence of rock bridges [22,23]. A more sophisticated approach was also proposed, which allowed for rock slope failures along step-path rupture surfaces to be preliminarily investigated [24]. Recently, the development of advanced numerical modelling methods has allowed for the investigation of rock slopes with the explicit implementation of rock bridges between discontinuities. A brief overview of continuum, discontinuum, hybrid, and lattice-spring methods that can be used to simulate such intact rock fracturing follows.
Continuum methods, such as the finite element method (FEM), treat the rock mass as a continuous medium and require the discretization of the model domain (i.e., the slope) using a finite-element mesh [25]. These methods are largely employed to identify areas of stress concentration and material strain and failure [26,27]. However, continuum methods such as Rock Failure Process Analysis code (RFPA, [28]) have been successfully applied to explicitly modelling brittle fracturing in intact materials. RS2 may allow the simulation of intact rock fracturing by implementing a Voronoi tessellation in a finite element mesh [29,30].
Discontinuum methods, such as the distinct element method (DEM), model the rock mass as an assembly of discrete blocks bounded by contacts. Contact-bounded blocks represent the intact material (e.g., intact rock or rock mass), whereas contacts simulate the behavior of discontinuities or grain boundaries [31]. Although the fracturing of the intact material cannot be directly simulated, a Voronoi or Trigon tessellation may be implemented to allow intact blocks to break along the boundaries of the Voronoi/Trigon polygons [32]. Typical DEM codes include the Particle Flow Code, PFC [33], the Universal Distinct Element Code, UDEC [34], and the 3D Distinct Element Code, 3DEC [35].
Hybrid methods employ a combined continuum–discontinuum numerical approach to overcome the limitations and exploit the advantages of each method. The finite-element discrete-element method (also referred to as FDEM), is among the most effective hybrid methods for the numerical modelling of brittle material [25]. The FDEM method models the intact material using a finite-element mesh, while a discrete element approach is used to simulate fractures and discontinuities [36,37]. This method is capable of modelling both the formation and the propagation of brittle fractures, allowing discrete contacts to form within a continuous material. Elfen and IRAZU are FDEM commercial codes that have been employed for investigating the brittle fracture of rock in underground excavations and high rock slopes [20,38,39,40].
Lattice-spring scheme techniques were among the first approaches adopted to explicitly simulate intact rock fracturing by modelling the intact material as an assembly of springs and particles (also referred to as “nodes” or “point masses”) [41]. Springs are used to model the mechanical and strength parameters of the material, whereas nodes define the density of the intact material [42]. When the stress applied to a spring reaches its strength, a microcrack forms, which can then propagate if the subsequent stress redistribution causes the failure of other springs. The application of this approach, although effective in simulating the brittle propagation of cracks in intact rock, has been limited due to the absence of commercially available software. Recently, the introduction of Slope Model allowed the lattice spring technique to be applied in the investigation of rock slope stability.
2. The 2014 San Leo Landslide
San Leo is an historic village located in northern Italy, about 90 km east of Florence. It is located in the Marecchia River Valley, which outlines the boundary between the northern and central sectors of the Apennines (Figure 1a). The town is located on top of a 120 m thick rocky plateau, comprising sandstone and limestone overlying a soft, marine clay shale that extends throughout the Val Marecchia region. On the afternoon of 27th February 2014, a 300,000 m3 landslide detached from the north-eastern flank of the plateau, toppling and fragmenting at the base of the slope [45]. The failure involved the detachment of a 200 m wide slab of rock mass and resulted in a retrogression of about 30 m of the edge of the plateau (Figure 1b). The landslide transitioned into a rock and debris avalanche that crossed the Campone gully at the base of the slope and climbed the opposite valley side by about 30 m. The undrained load induced on the underlying clay-rich materials also caused the activation of an earthflow that started to move with a velocity of 30 cm/day [45]. The slope failure generated a seismic wave that was felt by the local population and recorded by the Mount Carpegna seismic station, managed by INGV (the Italian National Institute for Geophysics and Volcanology) [45]. Based on eye-witness reports and seismographic data, the event was estimated to have occurred over a time frame of 150 s. The seismograph log, in particular, shows two marked peaks in ground acceleration, suggesting that the failure may have occurred in two stages: the first involving the detachment of the slab, and the second coinciding with the toppling and the following impact of the debris onto the valley bottom [45].
After the failure, a persistent, iron-oxidized discontinuity surface (referred to as SL3.1) was visible in the upper part of the rupture surface (Figure 1c). The discontinuity network within the plateau and progressive undermining processes affecting the underlying clays played a major role in the failure [30]. Investigations conducted after the event highlighted numerous open fractures with aperture width up to 25 cm located in the area behind the headscarp. A monitoring system was therefore installed to observe the evolution of the slope, including surface and in-hole extensometers.
The triggering factors of the San Leo landslide remain unclear. However, an exceptional snowfall event (over 2 m) occurred in 2012 and the subsequent snowmelt may have enhanced opening of fractures, promoting the rock slope failure [45]. Important preparatory factors also include (a) the structural setting and the discontinuity network of the rock mass forming the plateau, (b) the progressive undermining of the rock slab, due to remolding and erosion of the soft material underlying the rocky plateau [30].
2.1. Geological Overview of the Area
The geological stratigraphy in the area is characterized by opposite lithologies, such as the scaly clay shale formation of the Argille Varicolori (literally, “multicolored clays”), underlying a fractured rock masses of the San Marino and Monte Fumaiolo formations [46]. The Argille Varicolori formation ranges from lower Cretaceous to lower Eocene in age [47], and comprises multicolored, marine shaly clays, ranging in color from green, to red, to dark grey. Discontinuous siltstone and sandstone layers, organized in turbiditic sequences, are intercalated within the clay deposit [46]. The Argille Varicolori formation is overlain by the San Marino formation, which alternates limestones and white calcarenites rich in bioclastic fragments, and ranging in age from early to middle Miocene [47]. The bedding is predominantly lenticular, locally characterized by megaripple and storm structures, reflecting a shallower depositional environment compared to the underlying clays. The San Marino formation underlies and is in gradational contact with the Monte Fumaiolo formation, middle Miocene in age, comprising yellow, cross-stratified sandstones, representing a shallow depth continental shelf depositional environment [48].
Rocky plateau capping soft clayey terrains are a common geomorphological feature in the Northern Apennines. In addition to the San Leo plateau, other examples include the San Marino, Monte Fumaiolo, Sasso Simone, and Simoncello plateaus. These massive, steep, and elevated features lie above gently sloping clayey units. The edges of the plateaus are often affected by structurally-controlled instability phenomena that cause their gradual recession [49]. It has been suggested that the long-term geomorphic evolution of the plateaus is predominantly driven by lateral spreading phenomena, induced by the deformation and failure of the underlying clayey materials [45,47,50].
The San Leo rock slab is characterized by a roughly quadrangular base and extends over a surface area of 600 m by 500 m. A maximum thickness of 120 m is observed along the eastern edge. The plateau is characterized by a relatively irregular surface that dips in a north-westerly direction. The 2014 failure occurred along the north-eastern corner of the plateau. Previously, another large landslide occurred in 2006 along the northern side [51]. Additionally, the gentle slopes formed by the Argille Varicolori formation are affected by earth flows, earth slides, and soil creep. These landslides are common and can be considered as collateral slope failure events associated with the main rock spread, as reported in the northwestern Malta for the Blue Clays [52].
The hydrogeological setting of the San Leo plateau has been recently investigated, and was found to be affected by the rainfall regime [53,54], which shows mean annual values ranging between 369 mm and 1258 mm in the investigated area [53]. The San Leo plateau is characterized by a high secondary permeability that causes the rock slab to act as a small-scale aquifer, fed by rainfall infiltration through open discontinuities. Water infiltration promotes slope failure processes along the vertical cliffs of the plateau [54]. Conversely, the underlying clays are characterized by extremely low primary and secondary permeability. The permeability contrast between limestone and the clay shale induces the formation of perennial and ephemeral springs at the base of the plateau [53,54,55].
2.1.1. Rock Slope and Clay Shale Characterization
The rock slope involved in the 2014 failure extends vertically for about 110 m, and has been characterized using both traditional field techniques and remote sensing methods [56]. Geological investigations conducted prior to the failure evidenced the presence of a cave system at the base of the plateau, at the geological contact between the San Marino limestone and the Argille Varicolori clay shales (Figure 2a,b). Caves are carved in the clay shale and display a complex pattern. The morphology appears hummocky due to the irregular contact between the lithotypes, with variable width and height in different sectors. It has been suggested that the springs at the base of the rock slab may have induced undermining of the plateau, due to erosion of the underlying, softer clay shale [54]. In turn, the lack of support promoted the opening of fractures in the rock mass, further enhancing the water infiltration and erosion. At the site of the 2014 slope failure, such undermining was suggested to extend for approximately 20 m beneath the rock slab. Additionally, a 6 m thick softened layer at the surface of the clay deposit was observed, which may have also promoted the development of the slope failure [30].
Laboratory tests were conducted to characterize both the intact rock and the clayey materials [19]. Uniaxial compression and indirect tension, Brazilian tests were performed on specimens obtained from borehole cores drilled on the plateau. The unconfined compressive strength was found to vary between 74.6 MPa and 93.0 MPa. Tensile strength was found to range between 3.3 MPa and 4.9 MPa. Clay shale samples were subjected to several laboratory procedures. Direct shear strength tests estimated the friction angle and cohesion of the clay shale at 29.8° and 11 kPa, respectively. For a detailed description of experimental procedures and results of the compression and swelling indices, consistency indices, and in situ suction tests, the reader is referred to [19].
Five faults are visible along the rupture surface, which could also be observed in the prefailure slope (Figure 2a,d). A large-scale kinematic analysis was performed using the orientation data of the first-order geological structures observed within the slope, and it was noted that wedges form due to the intersections between fault F1 and faults F2, F3, F4, and F5 (Figure 2c). However, the only discrete block that can be observed within the prefailure slope is formed by the geological structures F1 and F2 and is hereafter referred to as Wedge F1–F2. The F1–F2 intersection plunges at an angle lower than the slope, but does not daylight as the wedge is located at the toe of the subvertical slope.
Terrestrial laser scanning (TLS) and close-range terrestrial digital photogrammetry (TDP) were also undertaken at the site in order to perform discontinuity mapping [56].
2.1.2. Preliminary Slope Damage Analysis
In the summer of 2016, a field- and remote sensing-based slope damage analysis was conducted at the site. The area behind the 2014 headscarp was investigated, and the orientation and width of open fractures was recorded. Digital photogrammetric and terrestrial laser scanner surveys of the rock slopes were undertaken, in order to characterize fracture intensity and brittle slope damage features along the rupture surface.
Within the area behind the 2014 headscarp, several high persistence (>10 m), subvertical, open discontinuities can be observed (Figure 3a), that are presently being monitored using extensometers. The width of the open discontinuities varies throughout the investigated area, from 2 cm to 25 cm. Cracks wider than 15 cm were found to be filled with soil. Conversely, tighter fractures appear to be characterized by clean surfaces (Figure 3b). The orientation of the observed cracks was measured and plotted in a rosette diagram (inset in Figure 3a). Two main trends were observed, striking 160° N and 130° N, respectively, roughly parallel with the first-order features observed along the rupture surface. East–west striking cracks were also observed, subparallel to the oxidized discontinuity SL3.1 visible along the headscarp (fracture SL3.2 in Figure 3b). In some instances, the presence of open fractures is indicated by groups of aligned trees, subparallel to the main observed crack orientation trends (Figure 3a).
The occurrence of the 2014 event may have affected the width of both soil-filled and open cracks, due to stress release following the removal of kinematic constraint. However, the progressive opening of soil-filled and vegetated cracks is probably driven by the long-term lateral spreading mechanism that affects the plateau.
Remote sensing techniques included TLS surveys from two locations and structure-from-motion (SfM) (Figure 4). TLS datasets were collected using a Riegl VZ-4000 laser scanner (RIEGL Laser Measurement Systems GmbH, Horn, Austria), characterized by a maximum range of 4 km. Photographs were taken using a Canon EOS 5D Mark II (Canon Inc., Tokio, Japan) with an f = 200 mm focal length lens. One of the TLS stations and two SfM camera stations were located at a distance of 300 m from the slope, on the opposite side of the Campone gully. The second TLS station was located within the Campone gully at a distance of 650 m from the slope and was located to provide a full coverage of the rupture surface, avoiding any occlusion due to the irregular slope morphology (inset in Figure 4). The TLS point cloud was characterized by a point spacing of 3 cm, and was used to finely register the SfM three-dimensional model into a real world, UTM coordinate system. The SfM survey then allowed for the creation of a high-resolution orthorectified photograph, which was used as a base for fracture intensity investigations and slope damage analyses.
The fracture intensity (often referred to as P21, [57]) is defined as the total fracture length over the investigated area, and is measured in m-1. For the analysis of the rupture surface of the San Leo landslide, the traces of the fractures visible on the orthorectified photograph were mapped in ArcGIS [58] (Figure 5a). The investigated area was then subdivided into square cells (10 m side length), and the total fracture length in each cell was measured. P21 values for each cell were then computed by dividing the total fracture length by the cell area. The central point of each cell was then exported, together with the P21 value of the cell, and imported into Surfer [59], allowing a fracture intensity map to be interpolated (Figure 5b).
A possible correlation between the distribution of fracture intensity and the location of first-order structures was noted. In particular, relatively high P21 values were observed near the intersection between F1 and F2, near F4, and within the footwall of F5. The iron-oxidized discontinuity SL3.1 appears to be characterized by low P21 values, due to the low number of discrete fractures mapped on its surface. However, the strong surface alteration may have reduced the visibility of the fractures, thus decreasing the value of the computed fracture intensity. No obvious correlation was observed between P21 and the thickness of the bedding; however, the presence of smaller fractures, not visible at the scale of the analysis, may affect the distribution of the fracture intensity.
The analysis of the orthorectified photograph allowed brittle slope damage features to be identified along the rupture surface (Figure 6a). One of the most evident examples of slope damage is represented by the brittle tension cracks visible in the eastern part of the headscarp. Brittle fracturing occurred due to tensile stress concentration at the tip of tectonic discontinuities, and has resulted in the propagation of tectonic fractures that terminate in intact rock (Figure 6b). This process was likely driven by slope displacement normal to the discontinuity orientation (dip/dip direction: 72°/070°), probably in an easterly direction. On the eastern side of the San Leo plateau, the deposit of an older landslide can be observed. This slope failure may have caused the brittle propagation of the described cracks (Figure 6c). The visual investigation of the rupture surface also allows for the identification of several out-of-plane failed rock bridges, which locally contribute to the formation of multi-modal step-path geometries (Figure 6d–g).
Rock mass dilation features can also be observed throughout the rupture surface. In general, these features are represented by open discontinuities that do not show obvious sign of brittle fracturing. Rock mass dilation features appear to be concentrated in the western part of the rupture surface (Figure 6h), where the orientation changes from an east–west to a nearly north–south direction. The formation of these damage features may be related to the removal of lateral constraint, which causes the opening of discontinuities parallel to the slope orientation.
2.2. Previous Numerical Modelling Analyses
Since the occurrence of the 2014 slope failure, various numerical analyses have been conducted. These include two-dimensional FEM and three-dimensional DEM analyses and are described in detail in [30,60].
2.2.1. FEM Analysis
Numerical modelling of the 2014 event was conducted using the finite element code RS2 [29] to investigate the potential role of (a) softening of a clay horizon at the contact with the plateau, and (b) the undermining of the rock slab [30]. In both cases, the rock slab was modelled as a continuous body, and only the trace of the discontinuity SL3.1 was included. Both the plateau and the clay shale were assigned a Mohr–Coulomb failure criterion (plateau: ϕ = 39°, c’ = 7.2 MPa; clay shale: ϕ = 28°, c’ = 0.04 MPa).
The progressive softening of the clay was investigated by gradually decreasing the strength of a layer at the top of the Argille Varicolori formation. The rock slope failure was simulated after an 80–85% degradation (depending on the extent of the softened layer below the slab), and was caused by the backward propagation of the discontinuity SL3.1 [30]. The implementation of a water table within the rock slab and pore pressure within the SL3.1 fracture further decreased the stability of the slope.
The landslide was also modelled using a pseudodiscontinuum FEM approach, with the implementation of a simple discontinuity network and a Voronoi tessellation to simulate the intact, continuous material forming the rock slab. Different amounts of joint persistence were simulated, by considering the 25%, 50%, and 75% of the total length of a fully persistent discontinuity trace. The failure was simulated through staged undermining of the plateau. It was observed that using a 50% discontinuity persistence, the results were comparable with the continuous model and in agreement with the observed postfailure topography. Conversely, considering a 25% or 75% discontinuity persistence the slope failure could not be realistically reproduced [30].
2.2.2. DEM Analysis
A three-dimensional distinct element investigation was conducted using the code 3DEC [60]. The model geometry and the discontinuity network were derived from field and remote sensing surveys of the rock face, and the joint-bounded blocks were assigned a rigid constitutive model (i.e., nondeformable). The numerical analysis aimed to investigate the effects of (a) decrease in the strength properties of the discontinuities (without any excavation), and (b) the undermining of the rock slab (without any decrease in joint properties). The numerical modelling results showed that the simulated undermining of the rock slab was essential for the failure to occur. Conversely, the discontinuity degradation alone was not sufficient to promote the failure, and displacement was limited to a small number of blocks at the surface of the modelled slope [60].
3. Numerical Modelling of Brittle Fracture during the San Leo Landslide
Field and remote sensing investigations, as well as previous FEM and DEM analyses, indicate that two factors had a major impact on the failure process, the joint persistence (and thus the size of rock bridges) and the gradual undermining of the edge of the plateau. A semiautomated procedure for mapping intact rock fractures in high-resolution photographs has been developed [61]. A preliminary analysis of the postfailure slope suggests that as much as the 45% of the rupture surface was constituted by rock bridges. This estimation is significantly higher than values previously published in literature (see [14,62]), and highlights the key role that intact material fracturing played in the San Leo failure.
This study focuses on the investigation of the brittle rock fracturing prior to and during the 2014 event, and its effects on the kinematic freedom of the rock slope. The research takes advantage of two different numerical modelling approaches. First, a two-dimensional hybrid, FDEM analysis is conducted using the Elfen code. Then, a three-dimensional investigation is performed using the lattice-spring code Slope Model. In both instances, a synthetic rock mass approach (SRM, [63]), a numerical modelling approach that simulates the brittle fracturing behavior of fractured rock masses, is employed. An SRM approach entails the implementation of discrete fracture networks (DFNs) within a matrix where fracturing of intact material is allowed. The SRM technique was originally implemented into discrete element models (e.g., PFC), but the application to FDEM and lattice-spring models has proved very effective in simulating the mechanical behavior of rock masses at various scales [64,65,66,67].
3.1. Model Geometry and DFN Construction
The main objective of the numerical modelling of the 2014 San Leo landslide presented in this paper is to investigate how the kinematic freedom of the slope changed with the progressive accumulation of brittle damage (i.e., intact rock fracturing). The analysis is performed assuming the prefailure model geometry previously investigated in [60], and obtained from laser scanning surveys conducted between 2008 and 2013. Additionally, the plateau rock slab was considered to consist of a single material (i.e., limestone). This initial assumption was deemed acceptable in view of the gradational nature of the lithological contact between the San Marino and Monte Fumaiolo formations, as well as their similar geomechanical characteristics. This simplified approach also facilitates the comparison with previous numerical analyses, in which the lithological boundary was not explicitly considered.
The first-order geological structures mapped along the rock face were implemented in the model and subdivide the slope into six discrete, fault-bounded blocks. Each block was assigned a name, based on the shape and the bounding faults. From east to west, they are: Side Block, Wedge F1–F2, Slab F2–F3, Slab F3–F4, and Slab F4–F5 (Figure 7). It is noted that the Side Block was only marginally involved in the 2014 event.
The discontinuity sets mapped on the TLS point clouds were subdivided into three main groups, as summarized in Table 1 [19]. A discrete fracture network was then built using FracMan 7.6 [68]. Various authors (see [44,69]) suggested that single discontinuities that play an important role in the slope failure should be explicitly incorporated within the DFN. In this case, the discontinuity SL3.1 was critical in defining the shape and location of the rupture surface [30,45], and was therefore explicitly included in the DFN. The numerical investigation in Elfen and Slope Model is conducted by progressively undermining the plateau, thus simulating the gradual erosion of the Argille Varicolori formation.
3.2. 2D Analysis Using ELFEN
The two-dimensional model geometry for the analysis using Elfen was obtained by extracting a section traced across the three-dimensional model geometry and the DFN, perpendicular to the discontinuity SL3.1 (Figure 8). It is noted that a limitation of using a two-dimensional approach is that the discontinuity traces in the section are characterized by an apparent orientation. The selected slope section is similar to that investigated in previous two-dimensional FEM analyses of San Leo [30]. In order to simulate the changes in the stress distribution that occurred within the slope in the long-term, the progressive retrogression of the cliff was also simulated, by including a series of three excavations parallel to the rock slope. Using this approach, the erosion of the plateau due to progressive lateral spreading and retrogressive rock slope failure is conceptually represented. The undercutting of the rock slab due to remolding and erosion of the Argille Varicolori formation is also simulated in three stages (Figure 9).
It is expected that the geological structures in the model play a key role in defining the stability of the slope. The faults intersecting the investigated section, namely F2 and F3, form a small angle (<30°) with the slope section direction, suggesting that these features may in fact act as lateral release surfaces. Therefore, it was decided to run two different models, Model 1 and Model 2. Geological structures F2 and F3 were excluded from Model 1 (considering F2 and F3 as lateral release surfaces for the investigated slope section) and implemented in Model 2 (considering F2 and F3 as potential rear release surfaces). The trace of discontinuity SL3.1 was implemented in both models (Figure 9). The two-dimensional geometry was meshed using an element size of 1 m in the part of the plateau where failure occurred (Figure 9c). Mesh element size progressively increased towards the edges of the model (up to 10 m element size), in order to optimize the considerable computational effort. The numerical modelling was performed using a dedicated high-performance workstation (3.4 GHz i7 Intel CPU, 24 GB RAM). The average model runtime required to model the failure up to the complete detachment of the unstable slab from the plateau was approximately 200 h (8 days).
The intact rock forming the plateau was assigned a Mohr–Coulomb constitutive criterion, with a Rankine rotating crack criterion to model failure in tension of the intact rock [20,37]. Elastic and plastic, Mohr–Coulomb shear strength parameters were initially assumed from literature data [70], and subsequently adjusted to match the uniaxial compressive strength obtained from geotechnical laboratory tests [19]. The tensile strength value (i.e., tensile cut-off value) was obtained from Brazilian tests described in [19]. The lower section of the model is formed by the Argille Varicolori formation. Elastic properties of the clay shales were obtained from published literature data [30,47,55]. The main objective of the FDEM analysis is the investigation of the brittle fracturing occurring in the limestone. Therefore, failure of the clay shales in the FDEM model is not considered and an elastic constitutive model is assigned. Table 2 and Table 3 summarize the mechanical properties assigned to discontinuities and intact material, respectively, in the numerical model.
3.2.1. Model 1
In this model, first-order geological structures F2 and F3 are not considered and the only geological structure deterministically included in the model is the discontinuity SL3.1. The model geometry assumed is based on previous two-dimensional numerical analysis by [30].
Results of the numerical analysis show that no brittle damage is simulated in the slope during the slope excavation stages used to replicate the progressive, lateral erosion of the plateau. The simulation of the first undermining stage induces elastic deformations within the plateau, without the formation of brittle damage. Millimeter-scale total deformation occurs, due to limited opening of the discontinuity SL3.1, and the rock slope remains stable (Figure 10a).
The second simulated undermining stage induces limited propagation of new brittle fractures in the lower part of the plateau. Further opening of discontinuity SL3.1 is simulated. However, slope displacements remain limited, and the stability of the slope is maintained throughout the second stage (Figure 10b).
The simulation of the third undermining stage induces failure of the slope, with the development of a fully-persistent rupture surface causing the progressive detachment of a slender, overhanging slab. The continuous rupture surface occurs as a combination of a) the downward propagation of SL3.1, and b) the upward, brittle propagation of fractures at the base of the plateau (Figure 10c,d). Vertical and horizontal displacements progressively increase up to a maximum of 1.5 m (Figure 11).
Brittle propagation of fractures in the lower part of the unstable slab causes the separation and detachment of this section of the slope, which displaces vertically in a free fall motion. With continued simulation, a transverse fracture forms, which divides the slab into two blocks (hereafter referred to as “upper” and “lower”) that appear to fail through a toppling mechanism. The simulated fragmentation of the column is a result of tensile stress concentration due to varying kinematic constraints throughout the slab. The lower block is characterized by a higher kinematic freedom, as the gradual undermining of the plateau removes any basal support. However, the irregular morphology of the simulated rear rupture surface causes the upper part of the unstable column to interlock, reducing its kinematic freedom (Figure 11a). As a result, tensile stresses increase in the displacing column, causing fracturing when the tensile strength of the intact material is exceeded (Figure 11b). Tensile stresses dissipate after the formation of the transverse fracture. Additionally, as a result of the interlocking, the hinge of the upper toppling block appears to be located approximately 30 m above that of the lower block (Figure 11c–f).
The simulation ended after 50 s (modelling time), after an 8-day actual runtime, as the impact of the lower part of the block on the underneath clay shale caused the stable time step to decrease and the model to run considerably slower.
The numerical analysis shows that the fragmentation of the undermined slab causes the formation of blocks bounded by a combination of pre-existing and brittle fractures, with surface areas ranging in size from ca. 400 m2 to ca. 2000 m2. Modelled blocks appear larger in size than those observed in the debris, as they were subjected to a lower degree of comminution during the FDEM simulation. The morphology of the simulated rupture surface agrees with the observed postfailure slope, which is characterized by a slight overhang. It should be noted that the simulated detachment surface is strictly dependent on the DFN used, and the deterministic location of the individual discontinuities is critical in forming a realistic simulated postfailure morphology. Behind the discontinuity SL3.1, low or negligible displacements are simulated. These results indicate that the opening of fractures that can be presently observed in the area behind the headscarp may be due to long-term, rather than syn-failure, deformation of the plateau. However, the geometry and location of fractures in the DFN may have an effect on the results.
3.2.2. Model 2
In this model, the first-order geological structures F2 and F3 are included and are assumed fully persistent and cohesionless (Figure 12a). During the progressive slope excavation stages, no brittle damage accumulation was observed within the plateau rock slab.
Brittle propagation of fractures initiates associated with the simulated undermining of the plateau. Wing cracks form at the tip of the discontinuity SL3.1, which further propagate when the second undermining stage is simulated (Figure 12b,c). The progressive removal of the clay-shale material below the edge of the plateau provides kinematic freedom for Wedge F1–F2. The block detaches and displaces vertically with a free fall motion and comes to rest at the base of the excavation, leaning against the rock slope. During the free-fall of Wedge F1–F2, brittle propagation of fractures is simulated within the plateau, indicating the incipient formation of a rupture surface located about 20 m behind the location of the observed headscarp.
The simulated third stage of undermining results in further brittle propagation of fractures, and formation of a fully-persistent, subvertical rupture surface. Instability involves a toppling mechanism, centered at the edge of the undermining. After 150 s (modelling time), the total displacement of the toppling slope is approximately 50 cm, and the simulation is terminated (Figure 12d).
3.3. 3D Analysis Using the Lattice-Spring Code, Slope Model
Numerical analysis using Slope Model involved incorporation of a DFN into the three-dimensional San Leo slope geometry. The minimum feature size that can be modelled in Slope Model depends on the resolution of the lattice-spring. Itasca suggest that features and volumes larger than five times the model resolution (i.e., the node spacing) can be adequately modelled [71]. The numerical model was run on a high-performance workstation (2.9 GHz, 12 cores, Intel i9 CPU, 128 GB RAM memory). In order to limit the runtime to approximately 72 h, the lattice-spring resolution was set to 2 m. Thus, fractures with diameter lower than 10 m were removed from the DFN, and equivalent rock mass material properties were selected to implicitly consider the presence of small discontinuities, as suggested by [72]. In addition to the DFN and the SL3.1 discontinuity, the fully-persistent faults mapped in the investigated area were also included in the model geometry and assumed cohesionless. Table 4 and Table 5 summarize the assumed discontinuity and material parameters, respectively, for the numerical analysis. The primary objective of the analysis in Slope Model was the investigation of the brittle fracturing occurring in the limestone, as a result of undermining. Therefore, in this preliminary investigation sufficiently high material properties have been assigned to the lower part of the model (i.e., the clay shales), in order to prevent the occurrence of unrealistic brittle fracturing due to the load of the rocky plateau.
The numerical analysis conducted in Slope Model consists of four stages: one to apply stresses and achieve the equilibrium, and three to model the progressive undermining of the plateau and simulate the failure. The three-dimensional extent of the excavation is the same as used in previous three-dimensional DEM analyses described in [60].
The first simulated undermining stage of the San Leo plateau showed a gradual accumulation of microcracks, predominantly concentrated at the base of the plateau. The microcrack counter (i.e., number of failed springs) showed an increase, before stabilizing at 1630 cracks after 10 seconds of modelling time (box 1 in Figure 13). No major block displacement was simulated during the first undermining stage.
With the second undermining stage the eastern part of the slope became unstable. Toppling of Wedge F1–F2 is simulated, and a limited number of microcracks form within the unstable volume (Figure 14a,b). The microcrack counter increased to 9900 after 20 s of modelling time (box 2 in Figure 13). Due to the small strain approach used by Slope Model, the removal of the failed block is not explicitly modelled and displacement of single nodes is displayed instead using vectors and color-coded nodes (Figure 14c). A visual analysis of the total displacement plot suggests that the toppling direction is approximately normal to the slope (about 0° N). Negligible displacements occur throughout the rest of the slope.
When the third excavation stage is modelled, the global failure of the slope is simulated (boxes 3–5 in Figure 13). The instability initiates in the eastern part of the slope, and then gradually propagates westwards. It occurs as a series of toppling failures of rock mass slabs separated by first-order faults. The failure initiates within Slab F2-F3 (Figure 15a). The undermining causes the slab to break in two separate blocks, approximately equal in volume (about 40,000 m3). Toppling of the lower block occurs in a direction normal to the slope orientation (approximately 0° N). Conversely, toppling of the upper block occurs with a lower displacement rate, in a direction normal to the discontinuity SL3.1 (20 to 25° N), and is probably driven by the brittle propagation of the same fracture. The brittle propagation of fractures along the developing rupture surface, together with the displacement of Slab F2-F3, provides kinematic freedom to the Slab F3-F4 (Figure 15b). The slab appears to topple as a single, intact block, in a direction between 5° N and 15° N, except for the base of the slab, which detaches and moves vertically in free fall.
Throughout the analysis, the discontinuity SL3.1 was simulated to act as a rear release surface for the landslide in the eastern part of the slope. Towards the west, the rear boundary of the slide was simulated to form due to brittle propagation low-order discontinuities forming the DFN. As a result, the morphology of the simulated rear release surface in the western part of the slope is more irregular compared to the eastern part, where the discontinuity SL3.1 outlines a linear rupture surface (see plan view in Figure 15a,b). The simulated rupture surface agrees closely with the observed morphology of the headscarp, suggesting that the numerical model realistically simulates the landslide behavior (Figure 15c).
During the numerical modelling, Slab F4–F5 appears to be only partially involved in the slope failure (Figure 15b). Here, displacement occurs in a direction varying between 350° N and 20° N. Such a variation suggests that progressive failure of rock bridges causes the formation of separate blocks that move independently.
Numerical modelling of the 2014 San Leo landslide has shown the importance of varying kinematic conditions within the slope. The progressive undermining of the plateau appears to induce a series of toppling failures that also involve intact rock fracturing. In the investigated model, the Wedge F1–F2 represents the only potentially removable block, as it is bounded by fully persistent geological features (i.e., faults and lithologic contact). As the line of intersection between the faults F1–F2 does not daylight, undermining causes the failure to occur through a toppling mechanism during the second excavation stage, while the remaining part of the slope failed during the third undermining stage. The failure of the remaining part of the rock slope appears to involve an oblique toppling mechanism.
The analysis of the simulated microcracks and their distribution within the slope throughout the numerical simulation allows the formation of a fully continuous rupture surface to be visualized. Figure 16 shows the progressive accumulation of microcracks (i.e., failed springs in the model lattice) in oblique view and along two sections through the numerical model. In the eastern part of the simulated slope, the rupture surface forms due to the downward propagation of the geological structure SL3.1, beginning at 20 s (modelling time), after the implementation of the second undermining stage (Figure 16a), and ends with activation of the third undermining stage, after 30 s (Figure 16b). Conversely, in the western part of the slope, the formation of a fully-persistent rupture surface is simulated after 40 s (Figure 16c). The model results suggest that the westward propagation of the slope instability is driven by accumulation of brittle damage and rock bridge failure, which progressively provides increased kinematic freedom to the fault-bounded slabs.
The accumulation of brittle damage is not limited to the failed volume of rock mass, but is also simulated within the rock volume behind the rupture surface, particularly in the western part (Section 2 in Figure 16a–d). It can be hypothesized that failures occurring at the edge of the plateau may decrease the rock mass quality of the remaining slope, thus promoting further eventual retrogression of the rock slope instability.
4. Discussion
The analysis of the 2014 San Leo landslide provides interesting insights in the role of brittle fracturing of intact rock on the kinematics of rock slopes. It is clear that a kinematic analysis conducted considering the first-order geological structures observed in the pre- and postfailure slope surface does not, on its own, show potential for structurally-controlled failures. However, if the rupture surface of the 2014 landslide is included, oblique toppling is then kinematically feasible, due to the intersections with faults F2 to F5 (Figure 17). The numerical modelling results in this research appears to confirm this observation.
In two-dimensional slope models, the displacement direction is assumed to be parallel to the investigated section. Similarly, the strike of structures is assumed to be normal to the slope section. In general, these assumptions induce an overestimation of the kinematic freedom compared to the real slope, as any lateral constraint or confinement in the out-of-plane direction is disregarded. Therefore, the two-dimensional numerical modelling conducted using Elfen required a careful consideration of the geological structures F2 and F3, which intersect the investigated section at a low angle (20° to 30°).
In the analysis of Model 1, it was noted that the exclusion of these geological structures, thus implicitly considering them as lateral release surfaces, allowed the observed postfailure slope surface to be reproduced in the model. Conversely, the explicit implementation of these features in Model 2 did not allow the observed postevent morphology to be reproduced, and a rupture surface developed approximately 20 m behind the observed location.
The numerical modelling in Elfen confirmed that the 2014 slope failure was predominantly governed by the progressive softening and erosion of the clay shale, which in turn induced brittle fracturing due to stress concentrations along the developing rupture surface.
Three-dimensional numerical modelling performed using Slope Model simulated a staged slope failure. The numerical results show that undermining of the plateau played a key role in the failure, causing a) the removal of Wedge F1–F2, thus limiting kinematic constraint for the failure of other blocks, and b) the tensile stress concentration along the developing rupture surface, which favored the brittle propagation of fractures and the formation of a continuous rear release surface. The simulated failure began with the removal of Wedge F1–F2, and followed by the propagation of the instability to the west involving progressive toppling of fault-bounded slabs. The removal of Wedge F1–F2, although not instrumental in causing the failure of the rest of the slope may have contributed by creating free space. The consequent increase in kinematic freedom allows Slab F2–F3 to fail as a single block through an oblique toppling mechanism. The gradual accumulation of brittle damage was critical in driving the westward propagation of the failure, by both inducing the lateral extension of the rupture surface and providing kinematic freedom to the fault-bounded slabs F3–F4 and F4–F5.
The detachment of Wedge F1–F2 was simulated during the second undermining stage, whereas the global slope failure was simulated during the third undermining stage. The Slope Model results suggest that undermining at San Leo may have been characterized by a more complex morphology, in terms of spatial extent and height compared to that assumed in the numerical analysis, also as a consequence of the geometry of the geological contact between limestones and clay shales. However, reconstructing the true three-dimensional morphology of the undermining was not possible due to limited exposure, accessibility, and safety. In future analyses, numerical modelling could be undertaken using different assumed undermining rates and considering spatial variation in undermining, in order to observe the effects on the stability of the simulated slope.
In addition to an evaluation of the varying kinematic conditions within the rock slope, this research has allowed for an improved understanding of the role of kinematics and intact rock fracture/damage factors in the development of the San Leo failure. The factors controlling instability and their potential influence on the San Leo slopes are summarized in Table 6.
5. Conclusions and Future Work
Kinematics represents one of the most important factors controlling the stability of rock slopes. In common practice, the kinematic feasibility of structurally controlled instability mechanisms is preliminarily studied using kinematic and block theory analyses. These methods investigate whether intersecting geological features and structures, at various scales, may form blocks that are removable through planar sliding, wedge sliding, and toppling. The morphology of the slope (i.e., orientation and gradient) also affects the feasibility of these failure mechanisms, for example, by allowing or preventing daylighting of basal sliding surfaces. The condition at which a block become removable from the rock slope is referred to as “kinematic freedom”. The presence of rock bridges along and between geological structures may reduce the kinematic freedom of the blocks forming a rock slope.
It has been suggested that kinematic conditions of a slope may vary with time, due to changes in slope morphology (for instance, as a result of glacial retreat), or to stress concentration inducing fracturing of intact rock (e.g., failure of nondaylighting wedges, [13]). Brittle fracturing represents one of the most important, yet comparatively unstudied phenomena occurring in rock slopes. The progressive development of brittle damage may lead to the failure of rock slopes that may have been quasistable for many thousands of years. Therefore, understanding how brittle fractures form and accumulate within a rock mass is of considerable importance for the purpose of hazard assessment in the context of slope failure evolution.
In this paper, the varying kinematic conditions of the 2014 San Leo landslide were investigated using a numerical modelling approach. The landslide was induced by the progressive erosion of clay shales underneath the edge of the San Leo rocky plateau. From a kinematic perspective, this process was critical in removing basal constraint at the base of a 110 m high rock slab. The clay erosion alone was likely insufficient to cause the failure of the rock slope, as a fully-persistent rear release surface was not available to provide kinematic freedom. However, this erosion induced increasing stress concentrations at the tips of tectonic discontinuities, which in turn caused the progressive propagation and coalescence of fractures, and eventually the formation of a fully-persistent rupture surface.
Numerical modelling was conducted using a Synthetic Rock Mass approach in a two-dimensional code (Elfen) and a three-dimensional code (Slope Model), both capable of simulating brittle fracturing of intact rock. The two-dimensional FDEM analysis was able to reproduce the rear rupture surface observed in situ, through the simulated propagation and coalescence of fractures. However, first-order geological structures intersecting the investigated section at a low angle (F2 and F3) were simplified, and implicitly considered as lateral release surfaces. Conversely, when explicitly incorporated in the model these structures produced results in conflict with the observed failure. The numerical modelling performed in Slope Model allowed for the three-dimensional deformation behavior of the slope to be investigated. The undermining of the plateau caused the simulated failure of Wedge F1-F2 through a toppling mechanism. Progressive intact rock fracturing along the incipient rupture surface resulted in a westward propagation of the instability, involving the toppling of slabs bounded by first-order geological structures.
Both two- and three-dimensional numerical modelling highlighted that discontinuity SL3.1 was critical in replicating the location and morphology of the rear rupture surface. Additionally, the implementation of first-order geological structures in Slope Model allowed the model to successfully reproduce the observed lateral extension of the failure event. It is therefore strongly recommended that any geological structure considered to be potentially relevant to the stability of a slope stability should be deterministically included within an FDEM-DFN synthetic rock mass.
Several important advantages of using a three-dimensional approach as opposed to a two-dimensional method were noted when modelling the 2014 San Leo landslide. It is evident that two-dimensional numerical modelling approaches cannot realistically simulate any slope displacement that occurs in the out-of-plane direction. Consequently, the location and trend of the investigated slope section must be chosen carefully in order to prevent bias in the results, due to the angle between the section and the observed displacement direction. Additionally, model structures may be characterized by an apparent orientation, depending on the difference in orientation with the investigated section, which may affect the quality of the results. Thus, the applicability of two-dimensional numerical modelling methods may be limited to slopes with simple morphology, structural setting, and failure mechanism. Conversely, three-dimensional numerical modelling techniques allow complex rock slope deformation mechanisms to be simulated, with displacement directions that may vary both spatially and temporally, throughout the numerical analysis.
With respect to previous work, the analyses described in this paper, by incorporating intact rock fracturing mechanisms, allow a more realistic behavior of the rock slope to be simulated. Additionally, insight on the role of brittle fracturing on the kinematics and progressive nature of the San Leo slope failure was provided. Table 7 summarizes the advantages and limitations of methods that have been employed to date in the investigation of the 2014 San Leo landslide.
The three-dimensional code Slope Model is characterized by a small-strain approach, as the coordinates of the nodes forming the model are not updated throughout the simulation. In future analyses, a three-dimensional FDEM code (e.g., Irazu3D) may be employed to investigate the postfailure behavior of blocks detaching from the slope.
Additionally, in the course of this research it was observed that the spatial variation and the rate of the undermining may have played an important role in the timing and development of the slope failure. Future analyses should focus on the simulation of varied clay shale softening and erosion patterns, in order to identify undermining geometries that provide the most realistic results. Finally, parametric analyses may be conducted to investigate the effect of uncertainty of the geomechanical input data (such as discontinuity roughness and friction angle, tangential and normal stiffness).
This research has highlighted the potential role of intact rock fracturing on the evolution of kinematic freedom of rock slopes. It is stressed that geomorphic processes such as stream erosion, slope steepening, and undermining, are critical in defining the long-term stability of a rock slope, not only because they may remove constraint at the base of the slope, but also because they can cause the accumulation of brittle damage, and control its spatial distribution within the slope. The progressive accumulation of brittle damage may provide kinematic freedom to previously stable rock slopes, which may not show obvious signs of deformation until failure occurs. Thus, it is suggested that any rock slope stability analysis should not be limited to the investigation of the present-day conditions of rock mass and rock slope. On the contrary, it should extend to the analysis of the factors and processes that may cause, with time, variations in the kinematic conditions of the slope, potentially inducing the occurrence of major rock slope failures.
Author Contributions
Conceptualization, D.D., D.S., D.E., L.B.; investigation, D.D.; writing—original draft, D.D.; writing—review and editing, D.S., D.E., L.B.; supervision, D.S., D.E., L.B.; funding acquisition, D.S.
Funding
The authors would like to acknowledge financial support provided through NSERC Discovery (Grant number RGPIN 05817) and FRBC Endowment funds provided to D.S.
Acknowledgments
The authors would like to thank the sponsors of the Large Open Pit, LOP, project for the opportunity to use the Slope Model code in this research. The author would also like to thank Loren Lorig, Itasca and John Read formerly of CSIRO, Australia, for their assistance in the provision of the Slope Model code. The authors would also like to thank the Emilia-Romagna Region Territorial Safety and Civil Protection Agency (Agenzia per la sicurezza territoriale e la protezione civile) for providing access to the DEM 2008, and Bitelli (DICAM, University of Bologna) for the DEM 2013. Thanks to Margherita Spreafico for support during the field work and data provision.
Conflicts of Interest
The authors declare no conflict of interest.
References
- Agliardi, F.; Crosta, G.; Zanchi, A. Structural constraints on deep-seated slope deformation kinematics. Eng. Geol. 2001, 59, 83–102. [Google Scholar] [CrossRef]
- Badger, T.C. Fracturing within anticlines and its kinematic control on slope stability. Environ. Eng. Geosci. 2002, 8, 19–33. [Google Scholar] [CrossRef]
- Brideau, M.-A.; Stead, D.; Kinakin, D.; Fecova, K. Influence of tectonic structures on the Hope Slide, British Columbia, Canada. Eng. Geol. 2005, 80, 242–259. [Google Scholar] [CrossRef]
- Pedrazzini, A.; Jaboyedoff, M.; Froese, C.R.; Langenberg, C.W.; Moreno, F. Structural analysis of Turtle Mountain: Origin and influence of fractures in the development of rock slope failures. Geol. Soc. Lond. Spec. Publ. 2011, 351, 163–183. [Google Scholar] [CrossRef]
- Brideau, M.-A. Three-Dimensional Kinematic Controls on Rock Slope Stability Conditions; Simon Fraser University: Burnaby, BC, Canada, 2010. [Google Scholar]
- Ganerød, G.V.; Grøneng, G.; Rønning, J.S.; Dalsegg, E.; Elvebakk, H.; Tønnesen, J.F.; Kveldsvik, V.; Eiken, T.; Blikra, L.H.; Braathen, A. Geological model of the Åknes rockslide, western Norway. Eng. Geol. 2008, 102, 1–18. [Google Scholar] [CrossRef]
- Sartori, M.; Baillifard, F.; Jaboyedoff, M.; Rouiller, J.-D. Kinematics of the 1991 Randa rockslides (Valais, Switzerland). Nat. Hazards Earth Syst. Sci. 2003, 3, 423–433. [Google Scholar] [CrossRef] [Green Version]
- Leith, K. Stress Development and Geomechanical Controls on the Geomorphic Evolution of Alpine Valleys. Ph.D. Thesis, ETH Zurich, Zürich, Switzerland, 2012. [Google Scholar]
- Kemeny, J. Time-dependent drift degradation due to the progressive failure of rock bridges along discontinuities. Int. J. Rock Mech. Min. Sci. 2005, 42, 35–46. [Google Scholar] [CrossRef]
- Havaej, M.; Stead, D.; Eberhardt, E.; Fisher, B.R. Characterization of bi-planar and ploughing failure mechanisms in footwall slopes using numerical modelling. Eng. Geol. 2014, 178, 109–120. [Google Scholar] [CrossRef]
- Kvapil, R.; Clews, M. An examination of the Prandtl mechanism in large dimension slope failures. Trans. Inst. Min. Metall. Sect. A 1979, 88, A1–A5. [Google Scholar]
- Havaej, M.; Wolter, A.; Stead, D. The possible role of brittle rock fracture in the 1963 Vajont Slide, Italy. Int. J. Rock Mech. Min. Sci. 2015, 78, 319–330. [Google Scholar] [CrossRef]
- Havaej, M.; Stead, D.; Mayer, J.; Wolter, A. Modelling the relation between failure kinematics and slope damage in high rock slopes using a lattice scheme approach. In Proceedings of the 48th US Rock Mechanics/Geomechanics Symposium, Minneapolis, MN, USA, 25–28 June 2014; ARMA, Ed.; Paper ARMA-14-7374. [Google Scholar]
- Tuckey, Z.; Stead, D. Improvements to field and remote sensing methods for mapping discontinuity persistence and intact rock bridges in rock slopes. Eng. Geol. 2016, 208, 136–153. [Google Scholar] [CrossRef]
- Paronuzzi, P.; Serafini, W. The influence of rock bridges in block fall processes. Ital. J. Eng. Geol. Environ. 2005, 1, 37–55. [Google Scholar] [CrossRef]
- Elmo, D.; Donati, D.; Stead, D. Challenges in the characterisation of intact rock bridges in rock slopes. Eng. Geol. 2018, 245, 81–96. [Google Scholar] [CrossRef]
- Shang, J.; Hencher, S.R.; West, L.J.; Handley, K. Forensic Excavation of Rock Masses: A Technique to Investigate Discontinuity Persistence. Rock Mech. Rock Eng. 2017, 50, 2911–2928. [Google Scholar] [CrossRef] [Green Version]
- Alghalandis, Y.F.; Elmo, D. Application of graph theory for robust and efficient rock bridge analysis. In Proceedings of the 2nd International Discrete Fracture Network Engineering Conference, Seattle, WA, USA, 20–22 June 2018; ARMA, Ed.; Paper ARMA-DFNE-18-0733. [Google Scholar]
- Spreafico, M.C. Lateral Spreading and Associated Slope Processes in Fractured Rock Slabs. Ph.D. Thesis, Università di Bologna, Bologna, Italy, 2015. [Google Scholar]
- Rockfield Software Ltd. ELFEN 2D/3D Numerical Modelling Package and User’s Manual, version 4.8; Rockfield Software Ltd.: Swansea, UK, 2017. [Google Scholar]
- Itasca Consulting Group. Large Open Pit. Slope Model, version 3.0; Itasca Consulting Group: Minneapolis, MN, USA, 2017. [Google Scholar]
- Terzaghi, K. Stability of Steep Slopes on Hard Unweathered Rock. Géotechnique 1962, 12, 251–270. [Google Scholar] [CrossRef]
- Jennings, J.E. A Mathematical theory for the calculation of the stability of slopes in open cast mines. In Planning Open Pit Mines, Proceedings of the Symposium on the Theoretical Background to the Planning of Open Pit Mines with Special Reference to Slope Stability, Johannesburg, Republic of South Africa, 29 August–4 September 1970; Van Rensburg, P., Ed.; South African Institute of Mining and Metallurgy: Marshalltown, South Africa, 1970; pp. 87–102. [Google Scholar]
- Einstein, H.H.; Veneziano, D.; Baecher, G.B.; O’Reilly, K.J. The effect of discontinuity persistence on rock slope stability. Int. J. Rock Mech. Min. Sci. Geomech. Abstr. 1983, 20, 227–236. [Google Scholar] [CrossRef]
- Hoek, E.; Grabinsky, M.; Diederichs, M.S. Numerical modelling for underground excavation design. Trans. Inst. Min. Metall. Sect. A 1991, 100, A22–A30. [Google Scholar]
- Budetta, P.; De Luca, C.; Simonelli, M.G.; Guarracino, F. Geological analysis and stability assessment of a sea arch in Palinuro, southern Italy. Eng. Geol. 2019, 250, 142–154. [Google Scholar] [CrossRef]
- Stead, D.; Coggan, J. Numerical modeling of rock-slope instability. In Landslides: Types, Mechanisms and Modeling; Clague, J.J., Stead, D., Eds.; Cambridge University Press: Cambridge, UK, 2012; pp. 144–158. [Google Scholar]
- Tang, C.; Tang, S. Applications of rock failure process analysis (RFPA) method. J. Rock Mech. Geotech. Eng. 2011, 3, 352–372. [Google Scholar] [CrossRef]
- Rocscience. RS2 Version 9.0; Rocscience: Toronto, ON, Canada, 2017. [Google Scholar]
- Spreafico, M.C.; Cervi, F.; Francioni, M.; Stead, D.; Borgatti, L. An investigation into the development of toppling at the edge of fractured rock plateaux using a numerical modelling approach. Geomorphology 2017, 288, 83–98. [Google Scholar] [CrossRef] [Green Version]
- Ghazvinian, E.; Diederichs, M.S.; Quey, R. 3D random Voronoi grain-based models for simulation of brittle rock damage and fabric-guided micro-fractuing. J. Rock Mech. Geotech. Eng. 2014, 6, 506–521. [Google Scholar] [CrossRef]
- Gao, F.Q.; Stead, D. The application of a modified Voronoi logic to brittle fracture modelling at the laboratory and field scale. Int. J. Rock Mech. Min. Sci. 2014, 68, 1–14. [Google Scholar] [CrossRef]
- Itasca Consulting Group. PFC—Particle Flow Code, version 6.0; Itasca Consulting Group: Minneapolis, MN, USA, 2019. [Google Scholar]
- Itasca Consulting Group. UDEC, version 7.0; Itasca Consulting Group: Minneapolis, MN, USA, 2018. [Google Scholar]
- Itasca Consulting Group. 3DEC, version 5.2; Itasca Consulting Group: Minneapolis, MN, USA, 2016. [Google Scholar]
- Munjiza, A.; Owen, D.R.J.; Bicanic, N. A combined finite-discrete element method in transient dynamics of fracturing solids. Eng. Comput. 1995, 12, 145–174. [Google Scholar] [CrossRef]
- Klerck, P.A. The Finite Element Modelling of Discrete Fracture in Quasi-Brittle Materials. Ph.D. Thesis, University of Wales Swansea, Cardiff, UK, 2000. [Google Scholar]
- Geomechanica Inc. Irazu FEMDEM 3D; Geomechanica Inc.: Toronto, ON, Canada, 2018. [Google Scholar]
- Lisjak, A.; Grasselli, G.; Vietor, T. Continuum-discontinuum analysis of failure mechanisms around unsupported circular excavations in anisotropic clay shales. Int. J. Rock Mech. Min. Sci. 2014, 65, 96–115. [Google Scholar] [CrossRef]
- Elmo, D.; Stead, D.; Eberhardt, E.; Vyazmensky, A. Applications of finite/discrete element modeling to rock engineering problems. Int. J. Geomech. 2013, 565–581. [Google Scholar] [CrossRef]
- Huang, J.-I. Modeling dynamic fracture growth with an elastic network. Geophys. Res. Lett. 1992, 19, 1855–1858. [Google Scholar] [CrossRef]
- Cundall, P.A. Lattice method for modeling brittle, jointed rock. In Continuum and Distinct Element Numerical Modeling in Geomechanics, Proceedings of the 2nd International FLAC/DEM Symposium, Melbourne, Australia, 14–16 February 2011; Sainsbury, D., Hart, R., Detournay, C., Nelson, M., Eds.; Paper 01-02; Itasca Consulting Group: Minneapolis, MN, USA, 2011. [Google Scholar]
- Lisjak, A.; Grasselli, G. A review of discrete modeling techniques for fracturing processes in discontinuous rock masses. J. Rock Mech. Geotech. Eng. 2014, 6, 301–314. [Google Scholar] [CrossRef] [Green Version]
- Donati, D.; Stead, D.; Elmo, D.; Karimi Sharif, L.; Gao, F.; Borgatti, L.; Spreafico, M.C. Experience gained in modelling brittle fracture in rock. In Proceedings of the 52nd US Rock Mechanics/Geomechanics Symposium, Seattle, WA, USA, 17–20 June 2018; ARMA, Ed.; Paper ARMA-2018-821. [Google Scholar]
- Borgatti, L.; Guerra, C.; Nesci, O.; Romeo, R.W.; Veneri, F.; Landuzzi, A.; Benedetti, G.; Marchi, G.; Lucente, C.C. The 27 February 2014 San Leo landslide (northern Italy). Landslides 2015, 387–394. [Google Scholar] [CrossRef]
- Caturani, A.; Ribacchi, P.; Tommasi, P. The San Leo cliff, Italy: Stability conditions and remedial measures. In Proceedings of the 7th ISRM Congress, Aachen, Germany, 16–20 September 1991; ISRM, Ed.; Paper ISRM-7CONGRESS-1991-171. pp. 853–858. [Google Scholar]
- Cornamusini, G.; Martelli, L.; Conti, P.; Pieruccini, P.; Benini, A.; Bonciani, F.; Callegari, I.; Carmigiani, L. Note illustrative della carta geologica d’Italia alla scala 1:50.000. Foglio 266. Mercato Saraceno; Servizio Geologico d’Italia: Roma, Italy, 2009; 124p. (In Italian) [Google Scholar]
- Bettelli, G.; Boccaletti, M.; Cibin, U.; Panini, F.; Poccianti, C.; Rosselli, S.; Sani, F. Note illustrative alla carta geologica d’Italia alla scala 1:50.000. Foglio 252. Barberino di Mugello; Servizio Geologico d’Italia: Roma, Italy, 2002; 130p. (In Italian) [Google Scholar]
- Casagli, N. Fenomeni di instabilità in ammassi rocciosi sovrastanti un substrato deformabile: Analisi di alcuni esempi nell’Appennino Settentrionale. Geol. Rom. 1994, 30, 607–618. (In Italian) [Google Scholar]
- Pasuto, A.; Soldati, M. 7.25 Lateral Spreading. In Treatise on Geomorphology; Shroder, J., Ed.; Mountain and Hillslope geomorphology; Academic Press: San Diego, CA, USA, 2013; Volume 7, pp. 239–248. [Google Scholar] [CrossRef]
- Benedetti, G.; Bernardi, M.; Bonaga, G.; Borgatti, L.; Continelli, F.; Ghirotti, M.; Guerra, C.; Landuzzi, A.; Lucente, C.C.; Marchi, G. San Leo: Centuries of coexistence with landslides. In Landslide Science and Practice; Margottini, C., Canuti, P., Sassa, K., Eds.; Risk Assessment, Management and Mitigation; Springer: Berlin, Germany, 2013; Volume 6, pp. 529–537. [Google Scholar] [CrossRef]
- Mantovani, M.; Devoto, S.; Piacentini, D.; Prampolini, M.; Soldati, M.; Pasuto, A. Advanced SAR interferometric analysis to support geomorphological interpretation of slow-moving coastal landslides (Malta, Mediterranean Sea). Remote Sens. 2016, 8, 443. [Google Scholar] [CrossRef]
- Spreafico, M.C.; Cervi, F.; Petronici, F.; Borgatti, L. Modelling groundwater and slope processes in a calcarenitic slab: The case of San Leo (northern Apennines). Rend. Online Soc. Geol. Ital. 2015, 34, 23–27. [Google Scholar] [CrossRef]
- Spreafico, M.C.; Cervi, F.; Marc, V.; Borgatti, L. Hydrogeological features of a highly fractured rock-slab. Rend. Online Soc. Geol. Ital. 2015, 35, 283–287. [Google Scholar] [CrossRef]
- Ribacchi, R.; Tommasi, P. Preservation and protection of the historical town of San Leo (Italy). In The Engineering Geology of Ancient Works, Monuments and Historical Sites: Preservation and Protection, Volume 2: Proceedings of the International Symposium Organized by the Greek National Group of IAEG, Athens, 19–23 September 1988; Marinos, P., Koukis, G.C., Eds.; Balkema: Roptterdam, The Netherlands, 1988; pp. 55–64. [Google Scholar]
- Spreafico, M.C.; Perotti, L.; Cervi, F.; Bacenetti, M.; Bitelli, G.; Girelli, V.A.; Mandanici, E.; Tini, M.A.; Borgatti, L. Terrestrial remote sensing techniques to complement conventional geomechanical surveys for the assessment of landslide hazard: The San Leo case study (Italy). Eur. J. Remote Sens. 2015, 48, 639–660. [Google Scholar] [CrossRef]
- Dershowitz, W.; Hermanson, J.; Follin, S.; Mauldon, M. Fracture Intensity Measures in 1-D, 2-D, and 3-D at Aspo, Sweden. In Proceedings of the 4th North American Rock Mechanics Symposium, Seattle, WA, USA, 31 July–3 August 2000; ARMA, Ed.; Paper ARMA-2000-0849. pp. 849–853. [Google Scholar]
- ESRI. ArcGIS, version 10.5; ESRI: Redlands, CA, USA, 2017. [Google Scholar]
- Golden Software. Surfer, version 14; Golden Software: Golden, CO, USA, 2016. [Google Scholar]
- Spreafico, M.C.; Francioni, M.; Cervi, F.; Stead, D.; Bitelli, G.; Ghirotti, M.; Girelli, V.A.; Lucente, C.C.; Tini, M.A.; Borgatti, L. Back Analysis of the 2014 San Leo Landslide Using Combined Terrestrial Laser Scanning and 3D Distinct Element Modelling. Rock Mech. Rock Eng. 2016, 49, 2235–2251. [Google Scholar] [CrossRef]
- Spreafico, M.C.; Franci, F.; Bitelli, G.; Borgatti, L.; Ghirotti, M. Intact rock bridge breakage and rock mass fragmentation upon failure: Quantification using remote sensing techniques. Photogramm. Rec. 2017, 32, 513–536. [Google Scholar] [CrossRef]
- Martin, C.D. The Influence of Fabric Geometry and Fabric History on the Stability of Rock Slopes. Ph.D. Thesis, Imperial College, London, UK, 1978. [Google Scholar]
- Mas Ivars, D.; Pierce, M.E.; Darcel, C.; Reyes-Montes, J.; Potyondy, D.O.; Paul Young, R.; Cundall, P.A. The synthetic rock mass approach for jointed rock mass modelling. Int. J. Rock Mech. Min. Sci. 2011, 48, 219–244. [Google Scholar] [CrossRef]
- Vyazmensky, A.; Elmo, D.; Stead, D.; Rance, J.R. Combined finite-discrete element modelling of surface subsidence associated with block caving mining. In Proceedings of the 1st Canada—U.S. Rock Mechanics Symposium, Vancouver, BC, Canada, 27–31 May 2007; ARMA, Ed.; Paper ARMA-07-058. [Google Scholar]
- Elmo, D.; Stead, D. An integrated numerical modelling-discrete fracture network approach applied to the characterisation of rock mass strength of naturally fractured pillars. Rock Mech. Rock Eng. 2010, 43, 3–19. [Google Scholar] [CrossRef]
- Lorig, L.J.; Cundall, P.A.; Damjanac, B.; Emam, S. A three-dimensional model for rock slopes based on micromechanics. In Proceedings of the 44th U.S. Rock Mechanics Symposium and 5th U.S.—Canada Rock Mechanics Symposium, Salt Lake City, UT, USA, 27–30 June 2010; ARMA, Ed.; Paper ARMA-10-163. [Google Scholar]
- Hamdi, P.; Stead, D.; Elmo, D.; Töyrä, J. Use of an integrated finite/discrete element method-discrete fracture network approach to characterize surface subsidence associated with sublevel caving. Int. J. Rock Mech. Min. Sci. 2018, 103, 55–67. [Google Scholar] [CrossRef]
- Golder Associates. FracmMan, version 7.60; Golder Associates: Toronto, ON, Canada, 2018. [Google Scholar]
- Panton, B.; Elmo, D.; Stead, D.; Schlotfeldt, P. A discrete fracture network approach for the design of rock foundation anchorage. Min. Technol. 2015, 124, 150–162. [Google Scholar] [CrossRef]
- De Vallejo, L.I.G.; Ferrer, M. Geological Engineering, 1st ed.; CRC Press: Boca Raton, FL, USA, 2011; pp. 144–153. [Google Scholar]
- Itasca Consulting Group. Slope Model: Description of Formulation with Verification and Example Problems; Revision 2; Itasca Consulting Group: Minneapolis, MN, USA, 2010; 132p. [Google Scholar]
- Elmo, D.; Vyazmensky, A.; Stead, D.; Rogers, S. Applications of a finite discrete element approach to model block cave mining. In Innovative Numerical Modelling in Geomechanics, 1st ed.; Ribeiro e Sousa, L., Vargas, E., Fernandes, M.M., Azevedo, R., Eds.; Taylor & Francis Group: London, UK, 2012; Volume 6, pp. 355–371. [Google Scholar]
Figure 1.
Geographic overview of the investigated slope. (a) Location of the San Leo plateau in northern Italy; (b) 2011 aerial photograph of the rock slab (courtesy of Emilia-Romagna region). The red polygon highlights the area involved in the 2014 event; (c) Oblique view of the rock slope after the failure. Note the iron-oxidized discontinuity SL3.1 (photograph summer 2015).

Figure 2.
View of the investigated rock slope before and after the 2014 event. (a) Overview of the 110 m high slope before the failure. Red, dashed lines highlight the faults that cross the San Leo plateau. Note the wedge formed by the intersection of first-order geological structures F1 and F2. The white, dashed line indicates the contact between the Argille Varicolori and San Marino formations. Black, dotted line outlines the volume failed in 2014; (b) Detail of the undermining at the base of the plateau, due to remolding and erosion of clay shale; (c) Kinematic wedge failure analysis. The large, red cross highlights the intersection forming Wedge F1–F2; (d) Structural interpretation of the rock slope after the 2014 event. Red, dashed lines identify first-order faults; note the subvertical, oxidized surface of discontinuity SL3.1 (photographs a and b are courtesy of C. Guerra).

Figure 3.
Fractures observed behind the San Leo landslide headscarp. (a) Plan view of the area behind the headscarp (2019 imagery from Google Earth). The red, dashed line outlines the 2014 rupture surface. White lines show the location of fractures. Red dot marks the location of the photograph in b; (b) Detail of two intersecting fractures. Fracture SL3.2 is parallel to the discontinuity SL3.1 observed in the headscarp. In the background, one of the extensometers monitoring fracture opening can be observed. Photograph summer 2016.

Figure 4.
2019 Google Earth satellite image showing the remote sensing stations. Red stars identify the TLS stations. Yellow diamond mark SfM camera locations. Insets shows the view from location SfM1 and TLS2.
Figure 4.
2019 Google Earth satellite image showing the remote sensing stations. Red stars identify the TLS stations. Yellow diamond mark SfM camera locations. Insets shows the view from location SfM1 and TLS2.

Figure 5.
Overview of P21 analysis. (a) Traces of the fractures mapped along the rupture surface; (b) P21 distribution computed by dividing the orthorectified photograph in square cells.
Figure 5.
Overview of P21 analysis. (a) Traces of the fractures mapped along the rupture surface; (b) P21 distribution computed by dividing the orthorectified photograph in square cells.

Figure 6.
Slope damage features observed along the rupture surface of the 2014 San Leo landslide. (a) Overview of the rock slope; (b) Tension crack at the eastern edge of the headscarp; (c) Old landslide deposit along the eastern side of the plateau. This failure may have induced the propagation of the cracks shown in (b); (d–g) Examples of failed rock bridges (in red) and step-path morphologies (white traces) observed along the rupture surface; (h) rock mass dilation observed at the western side of the rupture surface.

Figure 7.
Three-dimensional view of the investigated slope and the discrete blocks formed by the first-order geological structures. The rear surface of each slab in this preliminary representation is obtained by extending the discontinuity SL3.1.
Figure 7.
Three-dimensional view of the investigated slope and the discrete blocks formed by the first-order geological structures. The rear surface of each slab in this preliminary representation is obtained by extending the discontinuity SL3.1.

Figure 8.
(a) Location of the investigated section in the 3D model of the San Leo plateau; (b) Approximate location of the section in the prefailure slope (photograph is courtesy of C. Guerra).
Figure 8.
(a) Location of the investigated section in the 3D model of the San Leo plateau; (b) Approximate location of the section in the prefailure slope (photograph is courtesy of C. Guerra).

Figure 9.
Two-dimensional geometry investigated in Elfen. (a) Overview of the modelled excavation and undermining of the plateau. Numbers in the circles show the progressive excavation and undermining stages; (b) Detail of the DFN and first-order geological structures; (c) Meshed model. Note that F2 and F3 are omitted from Model 1 and included in Model 2.

Figure 10.
Overview of the San Leo landslide Model 1. (a) First undermining stage. No brittle damage forms; (b) Second undermining stage. Minor brittle fracturing is simulated at the base of the undermined slab; (c) Third undermining stage. Note the brittle propagation of SL3.1 and fractures at the base of the plateau; (d) Model after 28 s showing the formation of a continuous rupture surface (dotted, red line in the inset box).

Figure 11.
Brittle fracturing modelled in the unstable slab. (a,b) total displacement and direct stress plot at calculation time of 28.6 s. The undermining and partial failure of the slab provide an increased kinematic freedom in the lower part of the slope. Interlocking causes tensile stress concentration; (c,d) tensile stress exceeds tensile strength of the material and brittle fracturing occurs, dissipating and redistributing tensile stress; (e,f) further fracture propagation causes the lower and upper blocks to begin toppling separately.

Figure 12.
Overview of the San Leo landslide Model 2. (a) First undermining stage. No brittle damage is simulated; (b) Second undermining stage. Wedge F1–F2 is kinematically free, and displaces vertically. Fracture propagation occurs in the rock mass behind SL3.1; (c) Third undermining stage. Fracture propagation causes the formation of a continuous rupture surface. Brittle fracture propagation occurs in the undermined area; (d) Total displacement magnitude plot after 150 s (modelling time). Note that the toppling instability in model 2 involves a volume higher than that observed in situ.

Figure 13.
Summary of the numerical modelling results obtained using Slope Model. The graph of total microcrack number vs. numerical time shows the progressive increase in cracking (spring failure) within the model. U1, U2, and U3 identify the three simulated undermining stages. 1–5 identify the model states represented in boxes 1–5. Note that during undermining stage U2, the failure of wedge F1–F2 coincides with a low increase in microcrack count, whereas brittle damage accumulates with the progressive toppling of rock slabs.

Figure 14.
Slope model numerical analysis of the 2014 San Leo landslide after 20 s (numerical time). (a) Overview of the brittle damage accumulated within the slope. Red dots identify broken springs in the lattice; (b) Microcracks formed in the toppling wedge F1–F2; (c) Detail of the total displacement contour plot in the wedge F1-F2 area.

Figure 15.
Overview of the slope model numerical analysis of the 2014 San Leo landslide after 30 s and 40 s (numerical time). (a) Oblique view (above) and plan view (below) of the total displacement contour plot after 30 s (modelling time); (b) Oblique view (above) and plan view (below) of the total displacement contour plot after 40 s (modelling time). Red arrows show the displacement of the fault-bounded slabs. White, dashed lines outline the first-order faults F1–F5. Note the westward propagation of the instability and the discontinuity SL3.1 marking the rear boundary of the landslide in the eastern part of the simulated slope; (c) 2017 satellite image from Google Earth, showing the morphology of the headscarp (red, solid line). Note the irregular, curved outline in the western part, and the linear morphology in the eastern part.

Figure 16.
Simulated accumulation of brittle damage during the numerical modelling of the 2014 San Leo landslide. Red, dashed lines in the oblique views outline the first-order faults (F1–F5). White, dashed lines show the location of sections 1 and 2. The microcracks are color-coded based on the time of formation. In the sections, black, dotted lines outline the developing rupture surface. (a) microcracks simulated after 20 s (modelling time); (b) microcracks simulated after 30 s (modelling time). Note that the rear rupture surface is fully continuous in the eastern part of the slope (section 1); (c) microcracks simulated after 40 s (modelling time). Note the formation of a fully continuous rupture surface in the western slope (section 2); (d) microcracks simulated after 60 s (modelling time). Note the accumulation of brittle damage behind the rupture surface, particularly in the western part (section 2).

Figure 17.
Toppling analysis at San Leo using first-order geological structures and the rear release surface (RS) formed during the slope failure. (a) Flexural toppling envelop. F2–F5 may potentially act as lateral release surfaces; (b) Direct toppling envelop. Intersections plotting in the yellow area are susceptible to oblique toppling.


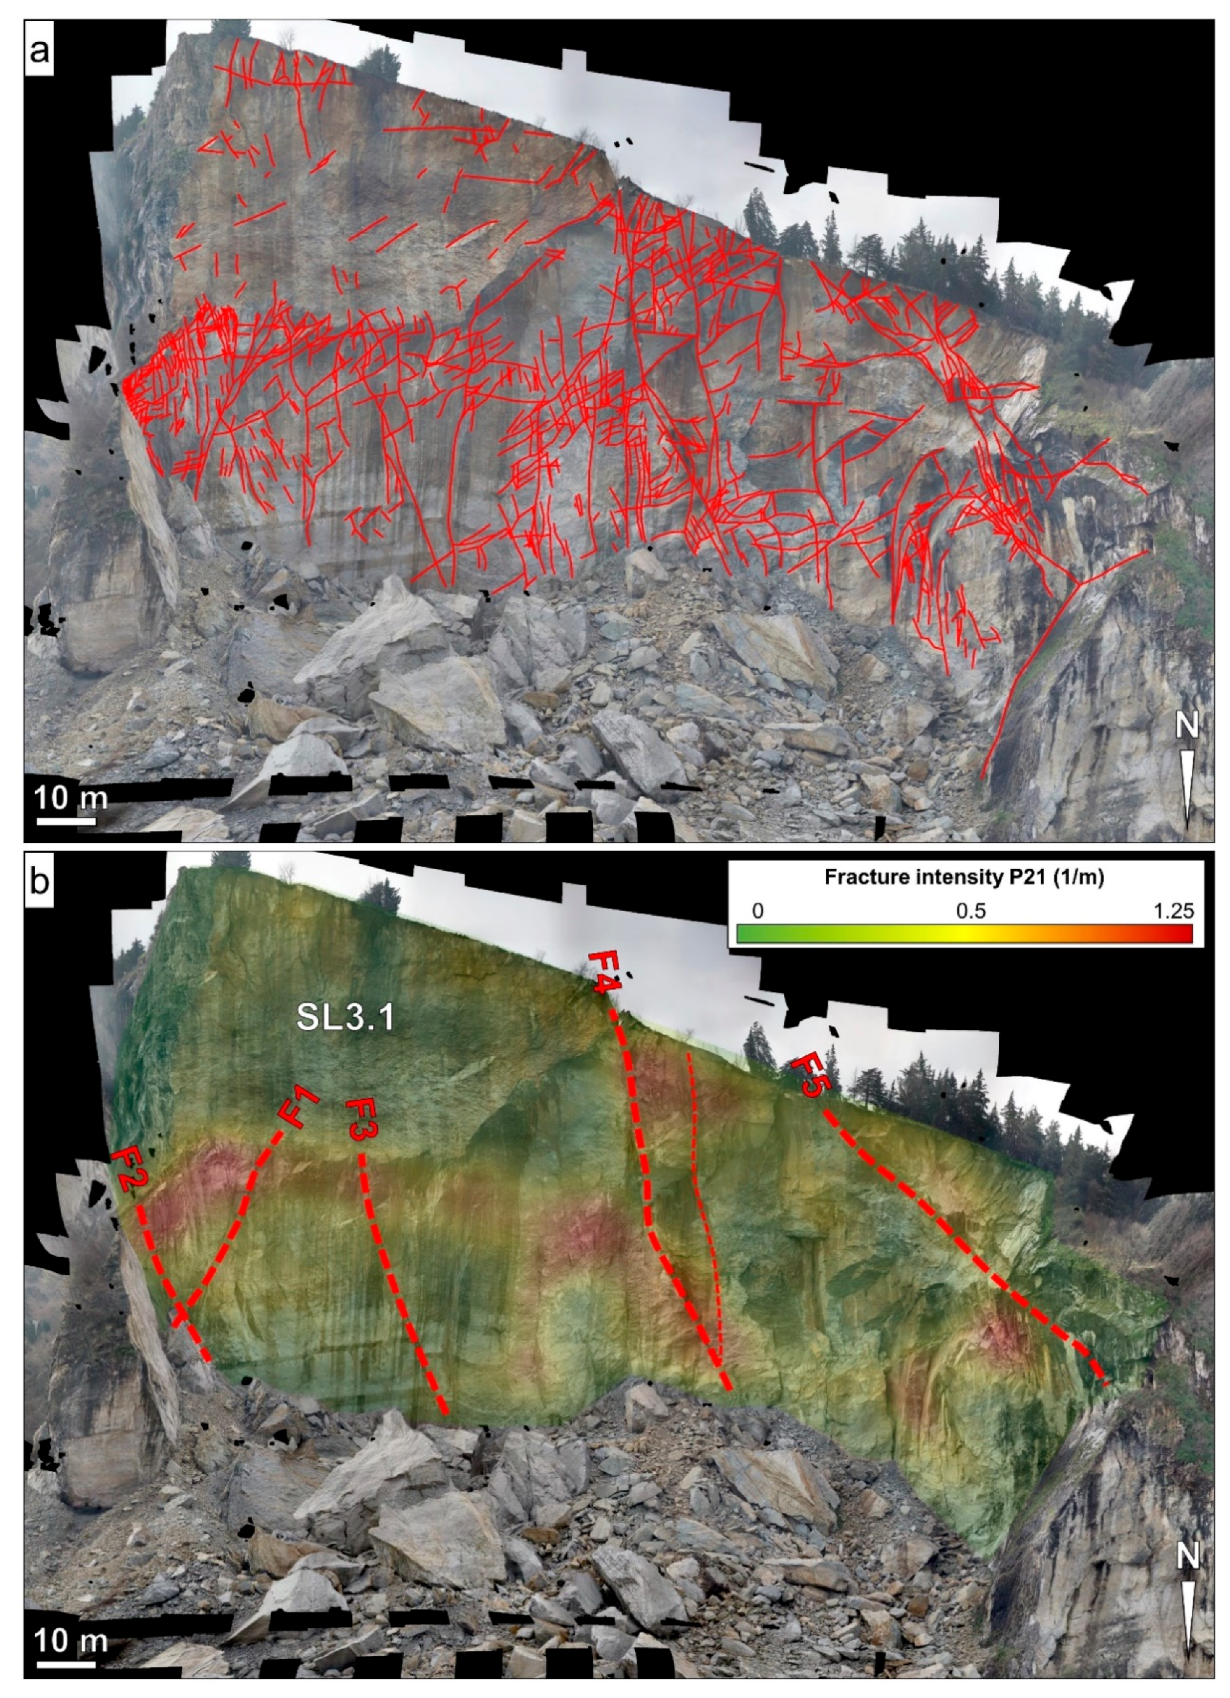
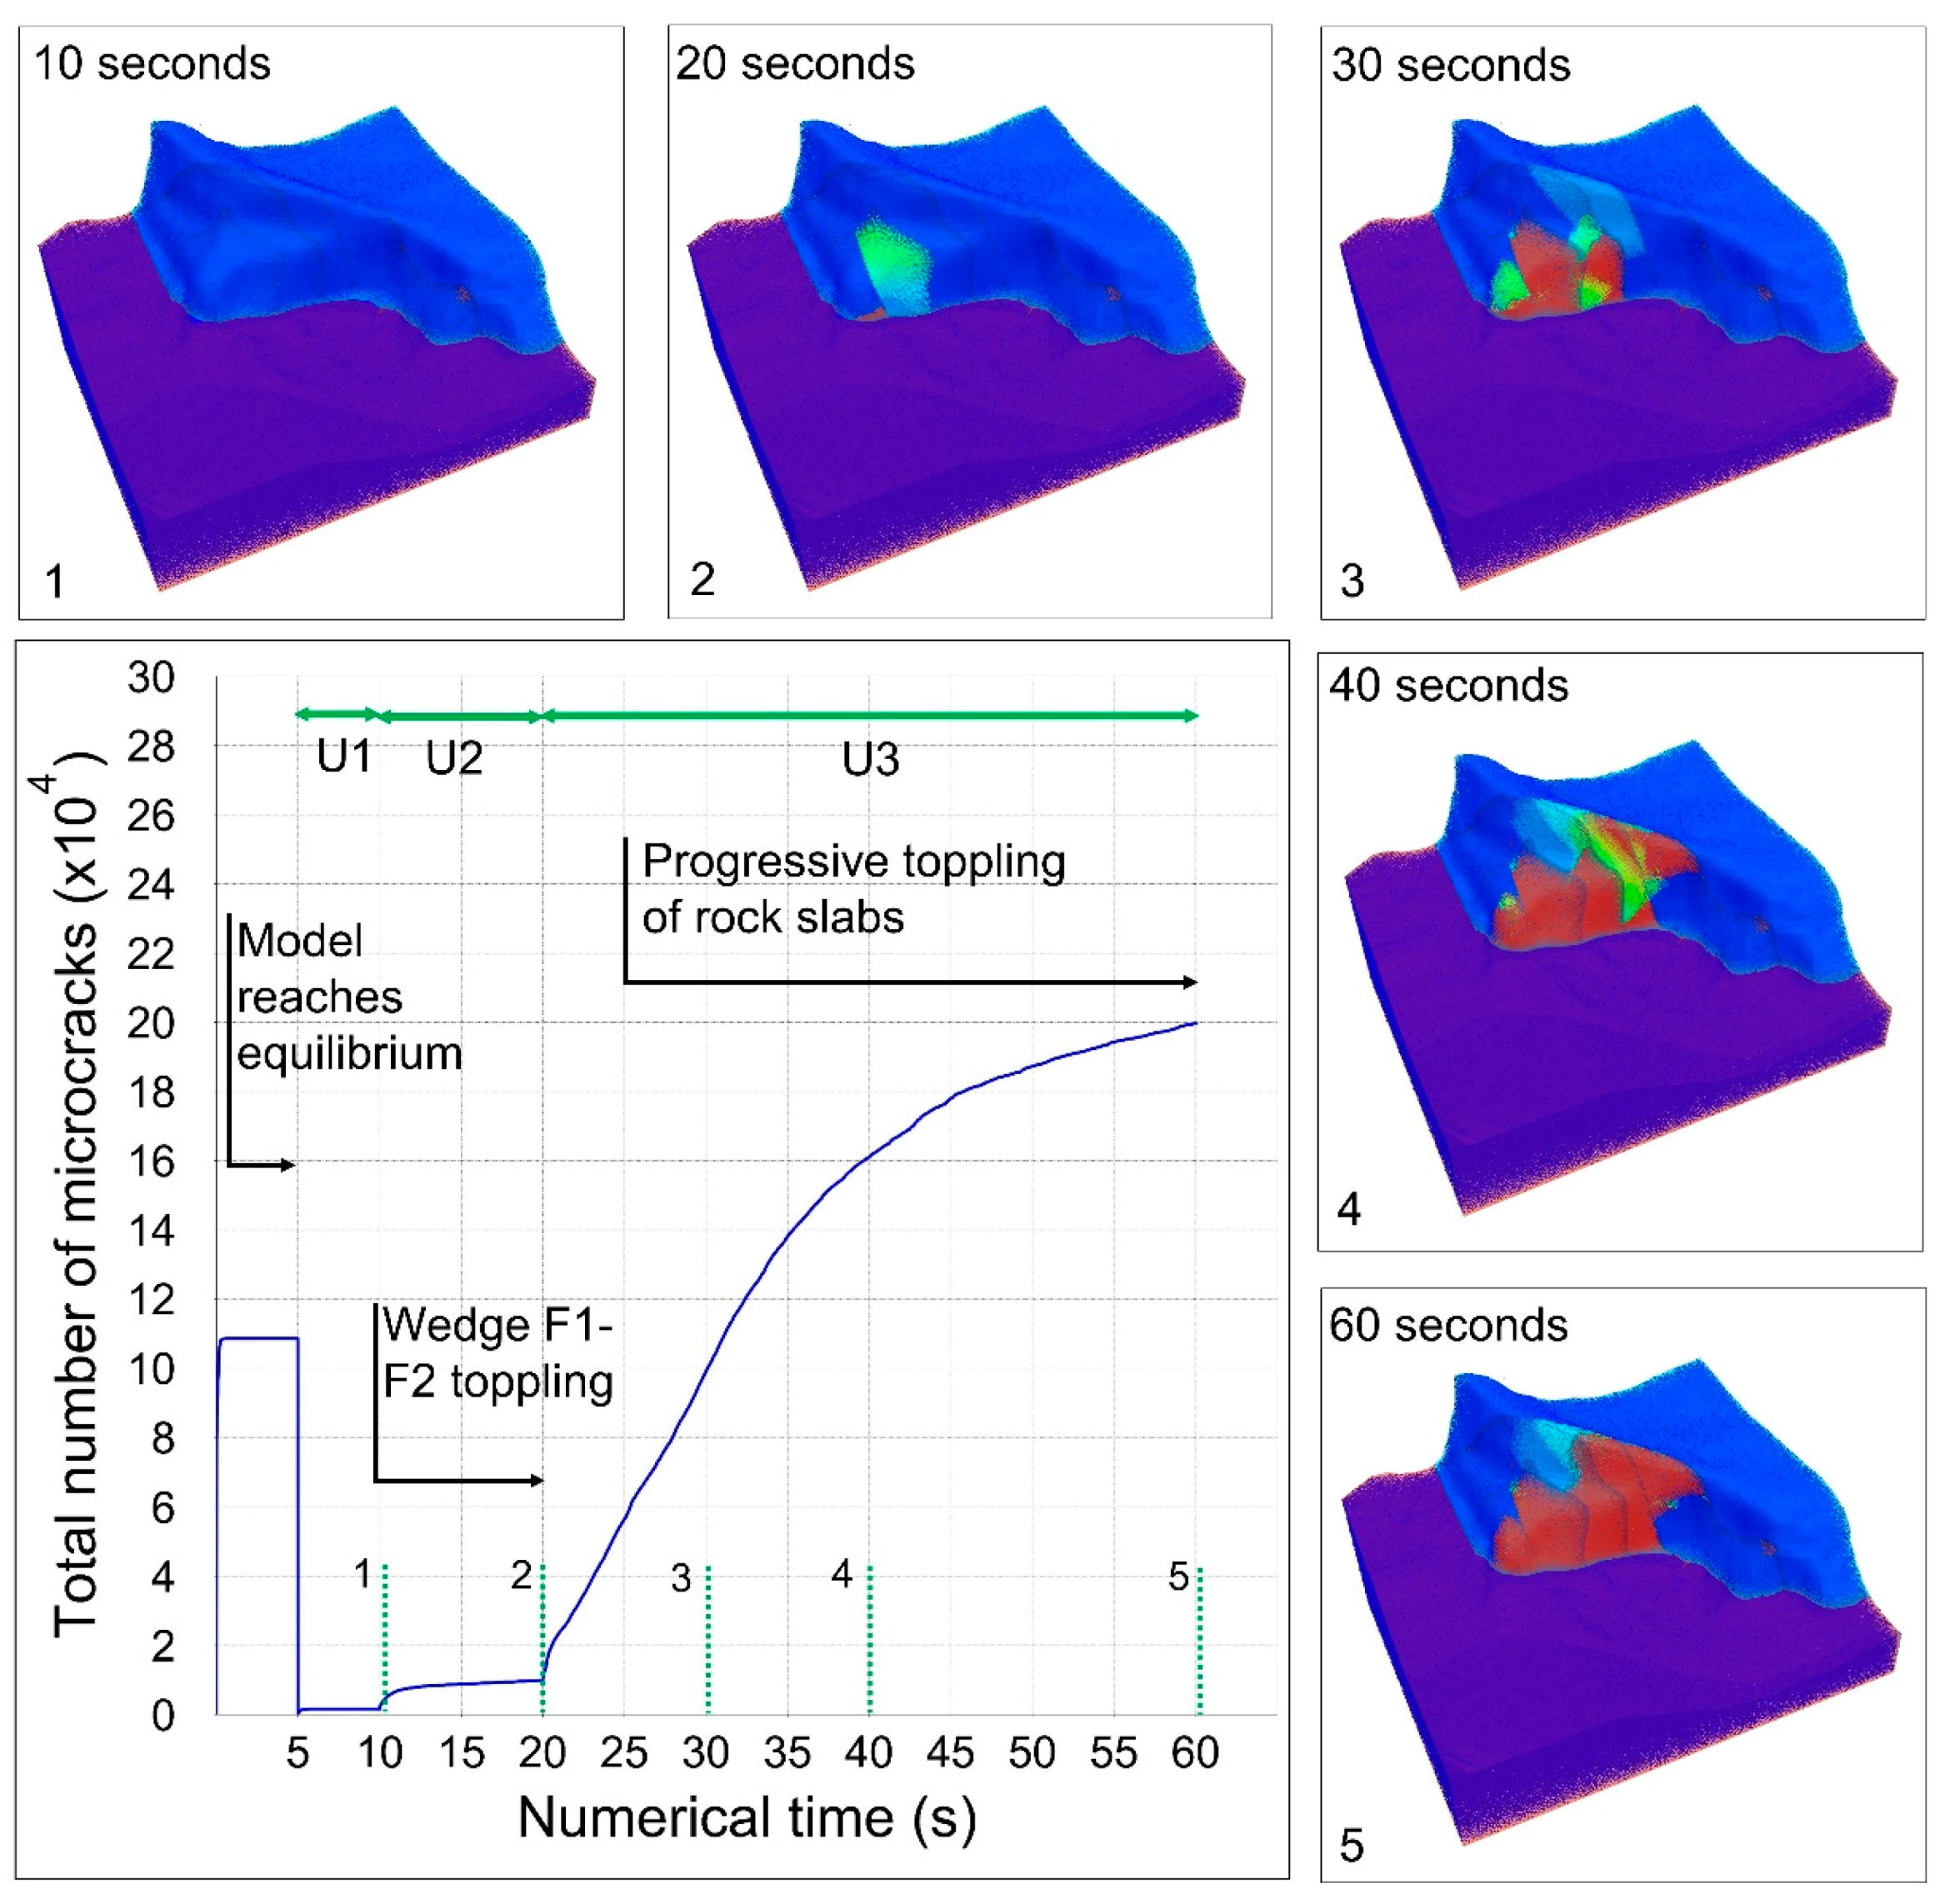
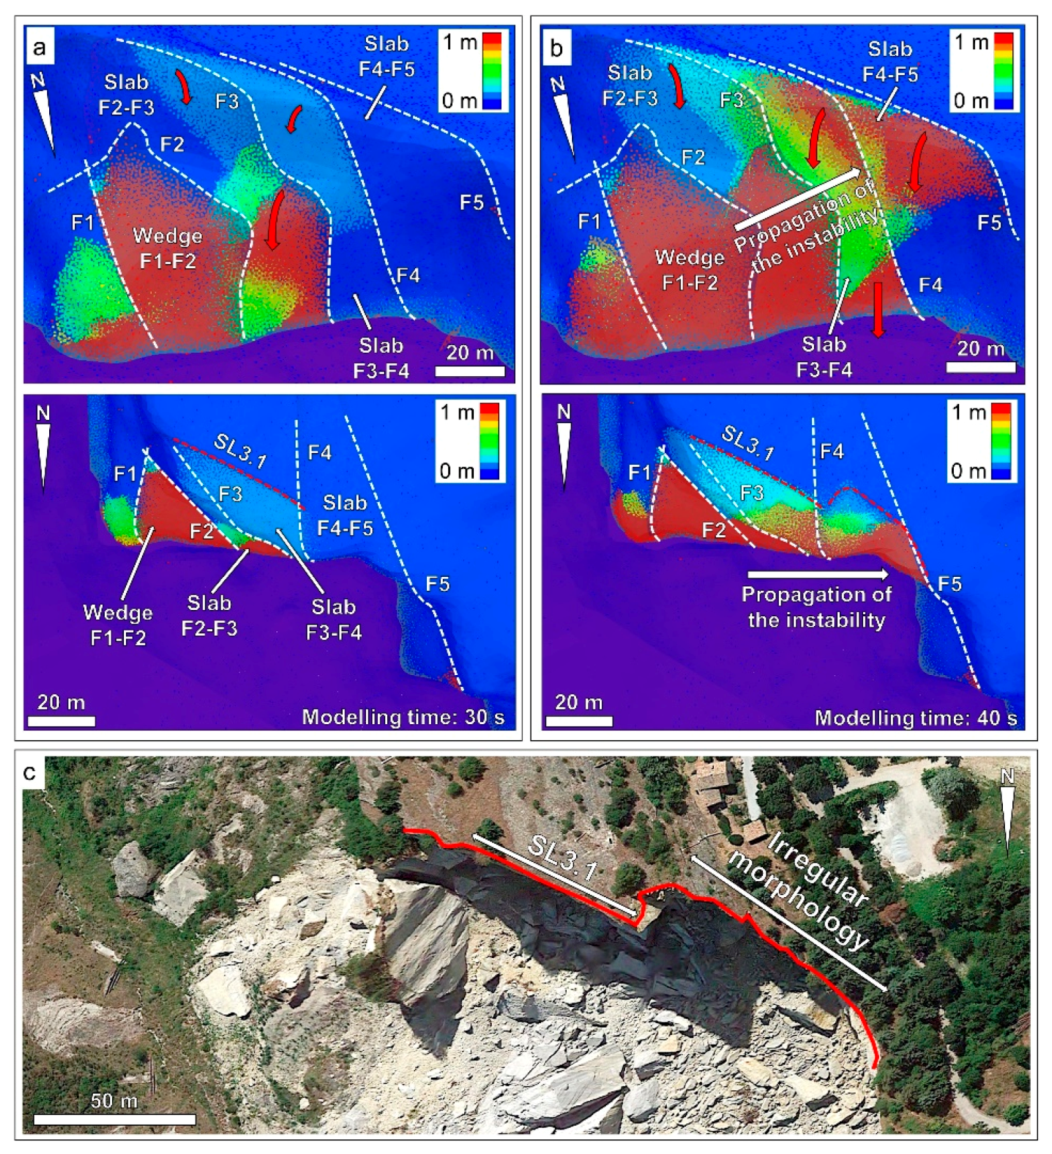
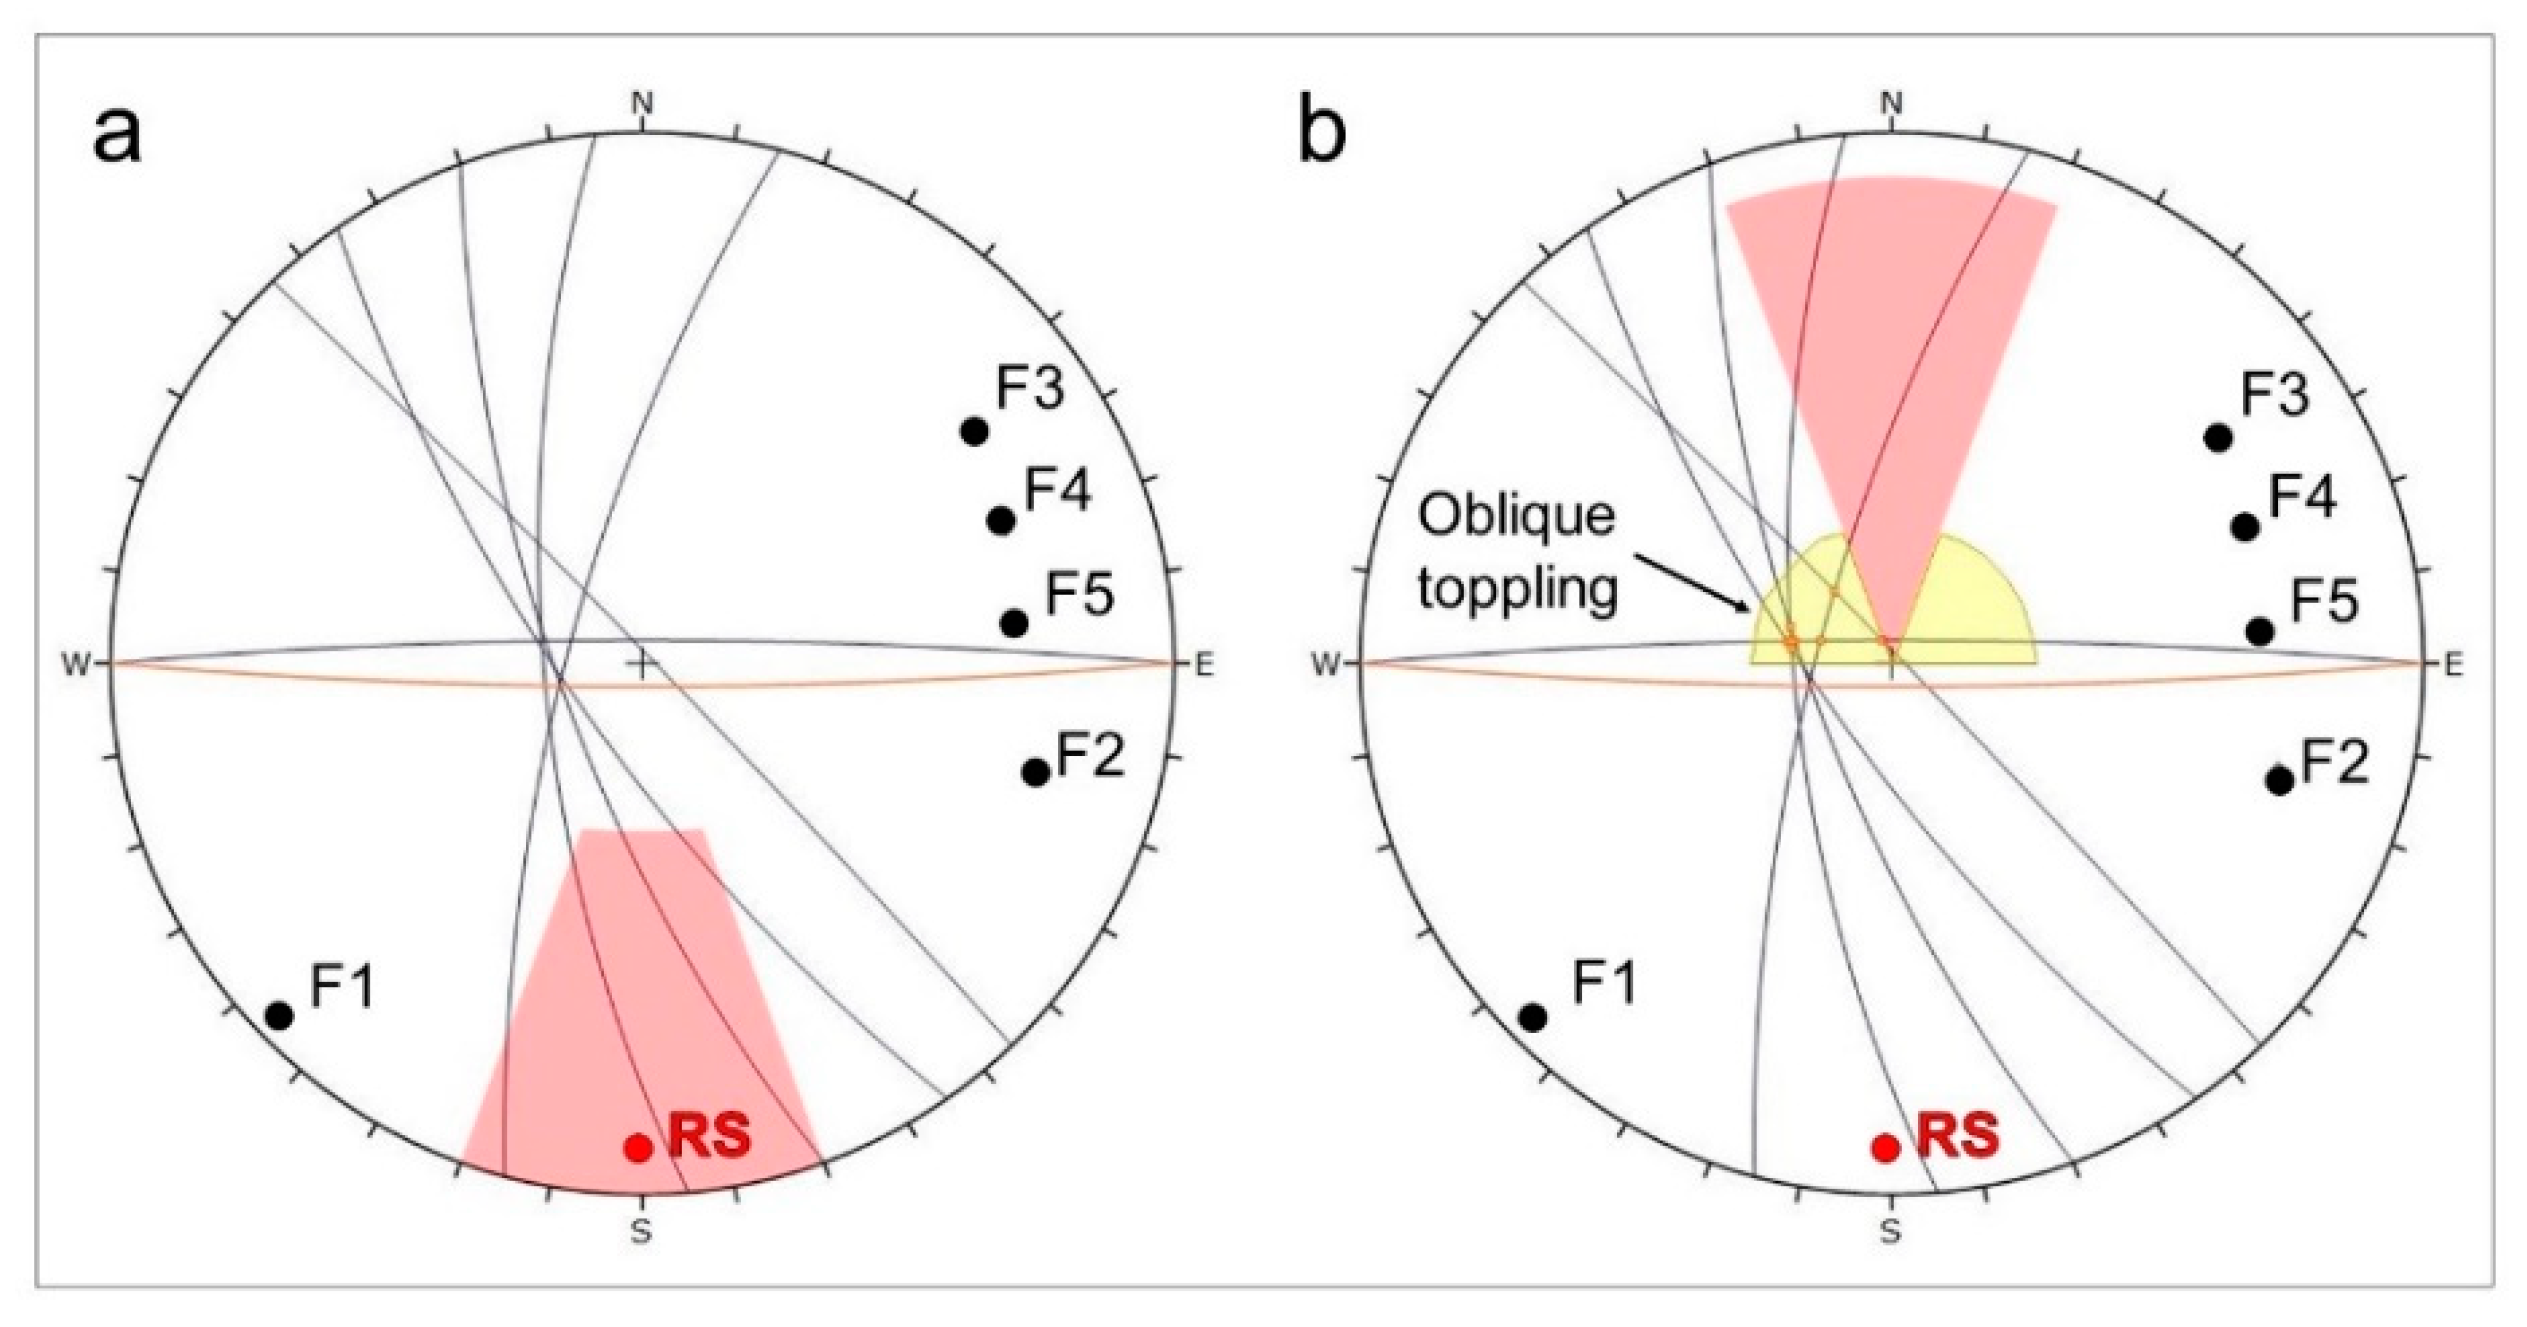
Table 1.
Discontinuity sets included in the investigated DFN (from [19]).
Table 1.
Discontinuity sets included in the investigated DFN (from [19]).
| Discontinuity Set | Dip | Dip Direction | Fisher K | Persistence Average/Max | P21 |
|---|---|---|---|---|---|
| K1 | 79° | 239° | 18.5 | 6.9 m/64.8 m | 0.10 m−1 |
| K2 | 84° | 023° | 49.5 | 4.4 m/31.8 m | 0.08 m−1 |
| K3 | 59° | 043° | 23.7 | 7.6 m/48.3 m | 0.11 m−1 |
Table 2.
Discontinuity parameters assumed for FDEM numerical modelling of the 2014 San Leo landslide in Elfen.
Table 2.
Discontinuity parameters assumed for FDEM numerical modelling of the 2014 San Leo landslide in Elfen.
| Property | First-Order Structures (Faults) | Joints and New Fractures |
|---|---|---|
| Normal penalty (GPa/m) | 0.1 | 10 |
| Tangential penalty (GPa/m) | 0.01 | 1 |
| Friction angle (°) | 20 | 30 |
Table 3.
Intact material properties assumed for the FDEM numerical modelling of the 2014 San Leo landslide in Elfen.
Table 3.
Intact material properties assumed for the FDEM numerical modelling of the 2014 San Leo landslide in Elfen.
| Property | San Marino Limestone | Argille Varicolori Clay Shale |
|---|---|---|
| Constitutive model | Mohr–Coulomb with Rankine rotating crack | Elastic |
| Unit weight (kN/m3) | 25.7 | 20.6 |
| Elastic modulus (GPa) | 17 | 5 |
| Shear modulus (GPa) | 6.8 | 1.9 |
| Poisson’s ratio | 0.25 | 0.3 |
| Cohesion (MPa) | 18 | - |
| Friction angle (°) | 39 | - |
| Tensile strength (MPa) | 4.9 | - |
| Fracture energy (J/m2) | 100 | - |
Table 4.
Discontinuity properties assumed for numerical modelling of the San Leo landslide in Slope Model.
Table 4.
Discontinuity properties assumed for numerical modelling of the San Leo landslide in Slope Model.
| Property | SL3.1 | DFN and Faults |
|---|---|---|
| Friction angle (°) | 30 | 30 |
| Cohesion (kPa) | 0 | 0 |
| Normal stiffness (GPa/m) | 1 | 10 |
| Shear stiffness (GPa/m) | 0.1 | 1 |
Table 5.
Intact material properties assumed for the numerical modelling of the San Leo landslide in Slope Model.
Table 5.
Intact material properties assumed for the numerical modelling of the San Leo landslide in Slope Model.
| Property | San Marino Limestone | Argille Varicolori Clay Shale |
|---|---|---|
| Unit weight (kN/m3) | 25.7 | 20.6 |
| UCS (MPa) | 75 | 50 |
| Tensile strength (MPa) | 1.4 | 3 1 |
| Friction angle (°) | 39 | 28 |
| Young’s modulus (GPa) | 17 | 5 |
| Poisson’s ratio | 0.25 | 0.3 |
1 high tensile stress assigned to prevent failure in the lower part of the model.
Table 6.
Summary of the potential factors controlling the stability of the slopes at San Leo.
| Geological Factors | Description | Effects on the Slope Stability |
|---|---|---|
| Lithology | A hard rock plateau overlies softer, clayey material. | Geological setting causes the development of rock spread; Instabilities are localized along the edges of the plateau. |
| Geological structures | Joints and faults subdivide the plateau into discrete blocks. | Discontinuities enhance kinematic freedom and promote structurally-controlled failure of discontinuity-bounded blocks; Open and very persistent fractures promote rainfall infiltration within the rocky plateau [54]. |
| Groundwater [53,54] | An aquifer exists within the plateau, fed by rainfall infiltrating through open discontinuities; Perennial and ephemeral springs form at the base of the plateau. | Groundwater flow at the interface between plateau rock mass and clay substratum induces softening in the clay, and erosion at the edge of the plateau. Water pressure in discontinuities promotes instability, due to reduction of effective stresses. |
| Clay shale softening and erosion [30] | Seepage and water flow cause the progressive undermining of the plateau, due to remolding and erosion of the clay shale. | Undermining caused stress to concentrate at the tip of tectonic discontinuities, potentially promoting long term subcritical crack growth; Progressive rock mass dilation enhances rainfall infiltration rate, further increasing the clay shale erosion rate. |
| Intact rock fracture/slope damage | Intact rock bridges enhance rock slope stability. Fracture propagation damage weakens the slope and may cause episodic failures. | Brittle fracture propagation occurs, driven by undermining of the plateau and tensile stress concentration along the incipient rupture surface; Fracture coalescence caused the formation of a fully-persistent rupture surface and provided full kinematic freedom to the unstable slabs. Dilation of pre-existing discontinuities. |
Table 7.
Summary of the numerical modelling techniques employed to investigate the 2014 San Leo landslide.
Table 7.
Summary of the numerical modelling techniques employed to investigate the 2014 San Leo landslide.
| Numerical Modelling Method | Advantages | Limitations |
|---|---|---|
| 2D FEM [30] | Simple and rapid analysis; Observed rupture surface reproduced; | Discontinuities not implemented (except for SL3.1); Does not realistically model large deformations; |
| 2D FEM with Voronoi tessellation [30] | Simplified discontinuity network included; Fracture propagation preliminarily investigated; | Longer runtime; Cannot realistically model large deformations; Voronoi tessellation requires calibration to simulate observed behavior of intact rock; |
| 3D DEM [60] | Discontinuity sets included; 3D analysis allows for realistic behavior of discontinuity-bounded blocks; Lateral extension of the landslide adequately reproduced; | Long runtimes mean that intact rock fracturing cannot currently be addressed for large/complex rock slopes; Time-dependent processes not addressed; |
| 2D FDEM (This study) | Discontinuity network included using DFN; Intact rock fracturing/damage modelled during the analysis; Observed rupture surface reproduced; | Long runtimes; Assumption of sophisticated input data required (e.g., fracture energy); Realistic failure of fault-bounded block difficult to achieve in 2D; |
| 3D lattice-spring (This study) | Realistic discontinuity network included using DFN; Intact rock fracturing/damage modelled during the analysis; 3D analysis allows for realistic behavior of discontinuity-bounded blocks; Lateral extension of the landslide adequately reproduced; | Small-strain approach does not allow advanced postfailure analysis; Small strain approach makes processing of results more challenging; Model resolution limited by long runtime and large file size; |
© 2019 by the authors. Licensee MDPI, Basel, Switzerland. This article is an open access article distributed under the terms and conditions of the Creative Commons Attribution (CC BY) license (http://creativecommons.org/licenses/by/4.0/).
Share and Cite
MDPI and ACS Style
Donati, D.; Stead, D.; Elmo, D.; Borgatti, L. A Preliminary Investigation on the Role of Brittle Fracture in the Kinematics of the 2014 San Leo Landslide. Geosciences 2019, 9, 256. https://doi.org/10.3390/geosciences9060256
AMA Style
Donati D, Stead D, Elmo D, Borgatti L. A Preliminary Investigation on the Role of Brittle Fracture in the Kinematics of the 2014 San Leo Landslide. Geosciences. 2019; 9(6):256. https://doi.org/10.3390/geosciences9060256
Chicago/Turabian StyleDonati, Davide, Doug Stead, Davide Elmo, and Lisa Borgatti. 2019. "A Preliminary Investigation on the Role of Brittle Fracture in the Kinematics of the 2014 San Leo Landslide" Geosciences 9, no. 6: 256. https://doi.org/10.3390/geosciences9060256
Note that from the first issue of 2016, this journal uses article numbers instead of page numbers. See further details here.