Article

Numerical Simulation of Deformation Band Occurrence and the Associated Stress Field during the Growth of a Fault-Propagation Fold

Laboratoire GEC, 1 rue Descartes, Université de Cergy-Pontoise, 95000 Neuville sur Oise, France
*
Author to whom correspondence should be addressed.
Geosciences 2019, 9(6), 257; https://doi.org/10.3390/geosciences9060257
Submission received: 15 March 2019 / Revised: 3 June 2019 / Accepted: 5 June 2019 / Published: 9 June 2019
(This article belongs to the Special Issue Stress Quantification in Sedimentary Basins)

Abstract

:
Knowledge of the paleo-stress distribution is crucial to understand the fracture set up and orientations during the tectonic evolution of a basin, and thus the corresponding fluid flow patterns in a reservoir. This study aims to predict the main stress orientations and evolution during the growth of a fold by using the limit analysis method. Fourteen different steps have been integrated as 2D cross sections from an early stage to an evolved stage of a schematic and balanced propagation fold. The stress evolution was followed during the time and burial of syn tectonic layers localized in front of the thrust. Numerical simulations were used to predict the occurrence and orientation of deformation bands, i.e., compaction and shear bands, by following the kinematic of a fault-propagation fold. The case study of the Sant-Corneli-Boixols anticline was selected, located in the South Central Pyrenees in the Tremp basin, to constrain the dimension of the starting models (or prototypes) used in our numerical simulations. The predictions of the numerical simulations were compared to field observations of an early occurrence of both pure compaction- and shear-enhanced compaction bands in the syn-tectonic Aren formation located in front of the fold, which are subjected to early layer parallel shortening during the burial history. Stress magnitude and stress ratio variations define the type of deformation band produced. Our results show that the band occurrence depends on the yield envelope of the host material and that a small yield envelope is required for these shallow depths, which can only be explained by the heterogeneity of the host rock facies. In our case, the heterogeneity can be explained by a significant contribution of carbonate bioclasts in the calcarenite rock, which change the mechanical behavior of the whole rock.

1. Introduction

The distribution of deformation bands and their mode of occurrence are key aspects of reservoir appraisal for oil and gas exploration. These structures are mainly formed in high-porosity granular media and affect the petrophysical properties of the whole rock, such as the porosity and permeability, and can act as a barrier to fluid flow [1,2].
The type of deformation bands is known to be related to the stress magnitude evolution [3,4,5,6,7,8,9,10,11,12] and in particular, to the Q/P ratio, where Q is the differential stress (Q = σ1 − σ3) and P is the effective mean stress (here taken as a biaxial parameter, P = (σ1 + 2σ3)/3). In a Q-P plot (Figure 1), a direct analysis can be made between the stress path and the failure envelopes, whose sizes can vary, depending on the porosity or the grain radius of the rock [13,14]. Interestingly, the type of deformation bands can also be related to the band orientation where the stress path intersects the failure envelope; for low Q/P values (0.35 < Q/P < 0.7), the bands are perpendicular or sub-perpendicular to the maximum stress direction and are called Pure Compaction Bands (PCBs) [15]. For higher Q/P values (>0.7), the bands are oblique to the maximum stress direction, with a lower α angle (Figure 1B): Such structures are called Shear Enhanced Compaction Bands (SECBs) and can be observed with conjugated orientations [15]. The conjugated angle (2α Figure 1B) can change within the SECB domain [16] and may present a shear component that offsets preexistent structures. The Q/P threshold value separating the two types of bands (i.e., PCBs and SECBs) is not fixed and can depend on the nature of the materials. In the following, we will take a value of Q/P = 0.7 (Figure 1), which is consistent with the average observation provided by geomechanical experiments conducted on different sandstones [14,17,18,19,20,21,22,23].
In some cases, deformation bands can occur at shallow depths, in unconsolidated to poorly lithified sediments (e.g., [2,25,26,27,28,29,30]). Most of these shallow band occurrences are explained by the large grain size and porosity of the host rocks, or by the kinematics of the general tectonic setting and the related stress evolution.
Recently, Robert et al. [24] analyzed cataclastic bands in the calcarenite facies of the Aren formation, formed under a compressive regime and in front of a thrust in the Tremp basin situated in the southern central Pyrenees. The Meso-Cenozoic Tremp basin was formed during the late Cretaceous and Cenozoic. The basin is limited at its northern border by the Sant-Corneli-Boixols fold and thrust belt, which developed during the Pyrenean orogeny [31,32,33,34,35]. The Sant-Corneli-Boixols is a fault-propagation fold that emerged above a detachment located within the Triassic evaporites, resulting from an inversion of lower Cretaceous basins [32,34,36,37,38]. In front of the fold, syn-tectonic growth-strata developed from the late upper Cretaceous (Campanian) to Paleocene [39,40], in which the deformation bands in the Aren formation (Maastrichtian) have been analyzed [24].
This article aims to verify the hypothesis proposed by Robert et al. [24] of a shallow occurrence of these bands, involving both the material properties in each facies and the fold and thrust kinematics, based on geological evidence and confirmed by a magnetic fabric study.
Geomechanical experiments directly conducted on the Aren formation could have been a way to proceed in order to estimate the P* value and an ad hoc failure envelope for the materials involved. Unfortunately, the original porosity of this calcarenite was completely filled with cement, which means the mechanical properties are nowadays very different from those prevailing at the time of the deformation bands’ occurrence, proposed to be directly linked with the Boixols thrust activity. The other method is to precisely estimate the stress path, taking into account the horizontal tectonic shortening during the burial of the formation. This was partly done by Robert et al. [24] in a 1D approach, without considering either the fold geometry or its kinematic, i.e., we have imposed on a simple lithological column, with a constant density, a horizontal tectonic shortening component in order to reverse the tectonic regime. With this method, the authors proposed a depth that is supposed to be relatively shallow, approximately less than 500 m [24]. They also proposed associated yield envelopes compatible with the field observations and burial history, with low values (<30 MPa) for the critical pressure P* (intersection between the envelope and the P axis on a Q-P plot) [24]. Therefore, in this article, we propose to follow the stress evolution more precisely with 2D numerical modelling of the Sant-Corneli-Boixols fold by comparing it with the proposed yield envelopes [24].
Many numerical modelling studies on the stress regime evolution and whether the distribution is linked, or not, with a thrust or fold at the basin scale, have been conducted [41,42]. Other studies have been made to constrain the distribution of fractures and/or faults to compare the data with field observations, in particular, those related to fold growth [40,43,44,45,46,47,48,49,50]. However, none of these studies have really focused on deformation bands’ occurrence. Finally, only a few studies have dealt with modelling the stress evolution with a finite element during the shortening of a folding layer to show the distribution of deformation and stress [51,52,53], also adding some heterogeneity in different layers of the prototypes [54].
In this study, we focused on the stress evolution in front of a growing fold and thrust in direct connection with the thrust activation by using the Limit Analysis Method (LAM). Previously, various studies have already been completed by applying the LAM, but were focused on mechanical conditions to localize and activate faults or thrusts [55,56,57,58,59,60,61] and not to understand the spatial distribution of the stress field.
The simulation of a fault propagation fold was undertaken to test the hypothesis of shallow deformation bands, as described in front of the Boixols thrust, in the Tremp basin, Spain [24]. The numerical results mechanically constrain the stress evolution for the fault propagation, allowing us to compare the data with the theoretical stress paths presented in our previous study [24]. Consequently, this methodology will allow us to predict the occurrence of different types of bands, their distribution, and the chronology within the fold. Although this study is only based on 2D modelling, the aim is to focus on the stress magnitude and evolution through burial and compression. The models, however, do not take into account the problematic issue of the 3D nature of the stress regime, as implied by the formation of deformation bands under a strike-slip regime.

2. Methods

2.1. Numerical Method
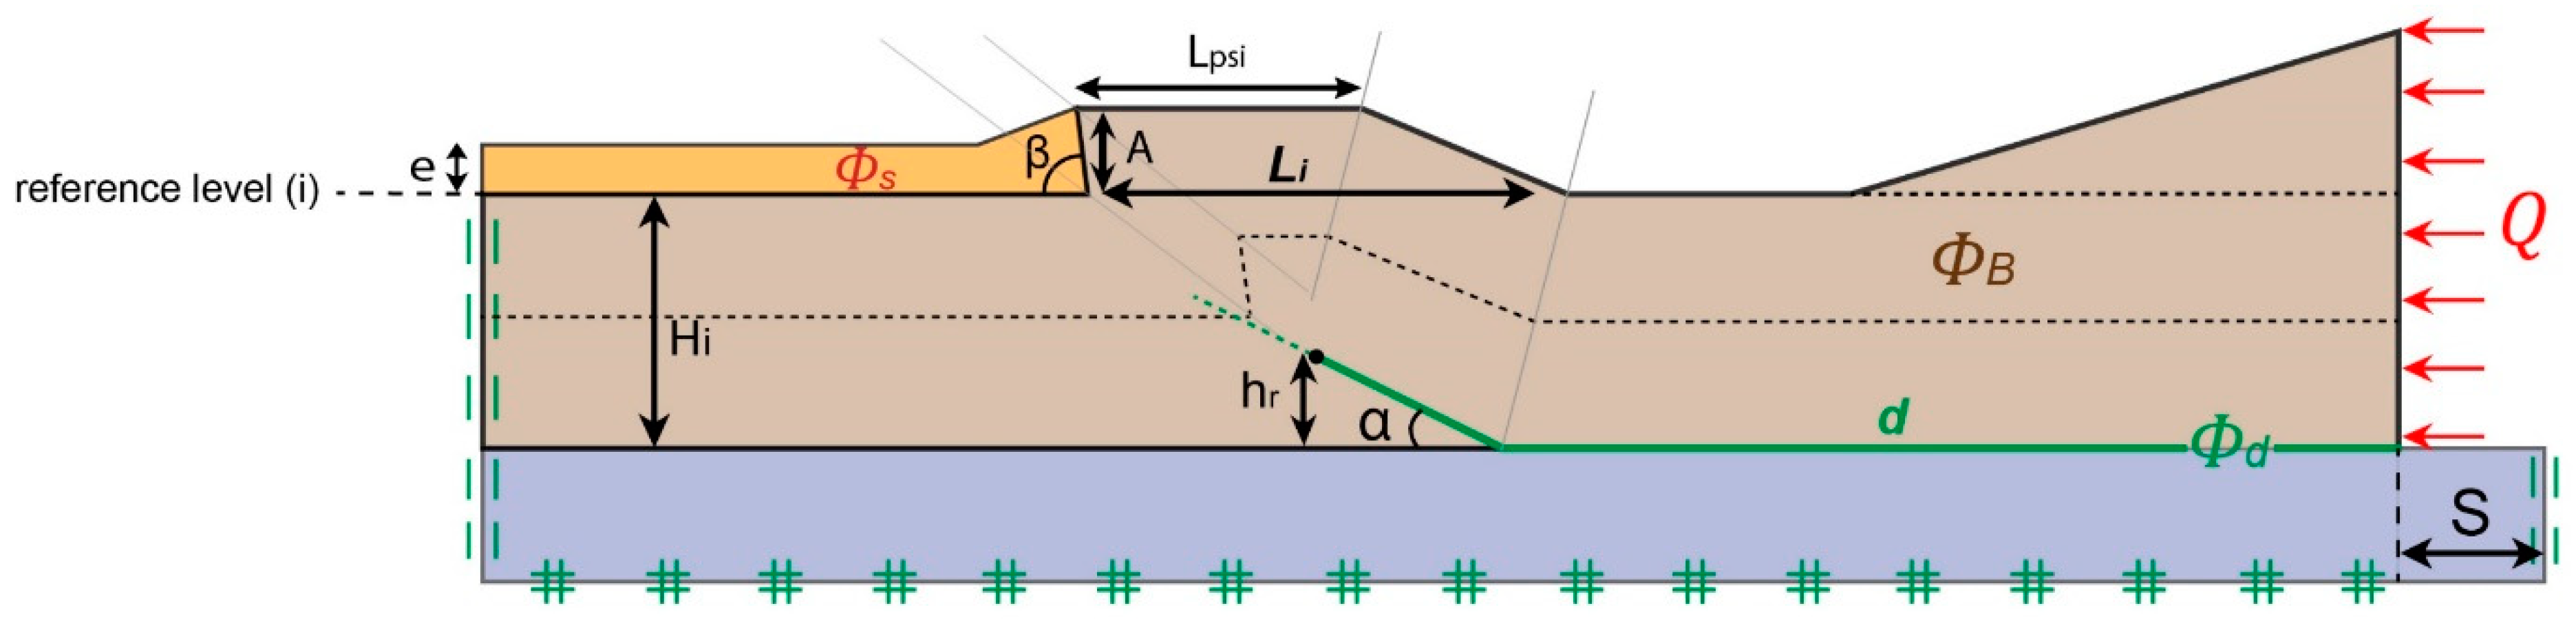
The numerical analysis was based on the limit analysis theory [62]. The LAM is applicable to frictional materials and to mechanical modelling in geology, and elasticity is not taken into account. This method is based on the principle of virtual powers [63]. The application of this principle predicts the collapse mechanisms (i.e., faults in geology) and the associated stress field. Two independent approaches compose the LAM. For a given geometry, i.e., in the present study, the geometry of a fault propagation fold, the kinematic approach of LAM calculates the lowest upper bound of the tectonic force Q and the distribution of resulting optimal virtual velocities by optimization. To complete the solution, the static approach of limit analysis calculates the lower bound of the tectonic force Q, i.e., the highest tectonic force for which no plastic failure develops, and the associated distribution of optimal stress, by optimization [57]. Specifically, the static approach is applied in the present study. For this approach, the optimum stress field is searched for among the set of statically admissible (SA) stress fields, i.e., satisfies mechanical equilibrium (1) and boundary conditions (2) and (3) (see [57] for details).
d i v ( σ ) = ρ · g , x Ω
[ [ σ ] ] · n = 0 , x Ω Λ
σ · n = Q d , x δ Ω Q
The method thereby accounts for a mechanical equilibrium and for a finite rock strength, like the Coulomb criterion (4). With τ being the shear stress related to σn representing the normal stress, φ is the internal friction and c is the cohesion of the material.
τ = σ n · t a n ( φ ) + c
Force optimization and velocity fields were obtained by automatic Delaunay meshing using the software Optum G2 [64], based on the developments of Krabbenhøft and Damkilde [65], Krabbenhøft et al. [66], Lyamin et al. [67], and Souloumiac et al. [57,63].
The results correspond with the onset of failure in the model (Figure 2), which means that no progressive evolution can be obtained between the initial step and the final step of the simulation. In order to take into account a complete fold kinematic, we created fourteen steps inferred from the balanced geometry proposed by Suppe and Medwedeff [68]. It starts from an early and flat surface (step 1, Figure 3) state to a vertical front limb after a total of 3.1 km of shortening (step 14, Figure 3). During this evolution, we chose to add syn-tectonic material in front of the fold to maintain a consistent kinematic compared to the field example. The thickness of these layers (e parameter, Figure 2) is arbitrarily half the amplitude of the fold (Parameter A, Figure 2). Erosion has not been taken into account for these simulations in order to only focus on the impact of the burial on the stress behavior without adding a new parameter. The fourteen steps have been analyzed one by one, using the static approach, in order to focus on the stress distribution provided by OptumG2.

2.2. Model Details

For the fourteen steps, we consider a body of sedimentary rocks lying on a planar décollement level d (Figure 2). On the foreland side, called the plateau, its planar surface for the first stage is parallel to the décollement and its thickness is Hi. The sedimentary rocks above the décollement have a bulk friction angle (Coulomb criterion) φB, and the friction on the décollement and the thrust is φd (Figure 2). A low value for φd was chosen (φd = 4°), corresponding to classical values of friction in evaporites. The thrust retains a dip angle of α = 23°, which is the approximate value observed in the Boixols thrust, with an evolving height of the fault tip (hr) throughout the fold growth. The density of these rocks is ρ = 2300 kg/m3. The material below the décollement is the same as that above it. A tectonic force Q parallel to the décollement is applied on the hinterland side of the wedge, above the décollement (Figure 2, red arrows). Note that its magnitude is an outcome of the numerical mechanical analysis. The topographic surface is free of any stress. On the other prototype boundaries (base, extreme left or right sides of the models), displacements are constrained, as indicated in Figure 2. Adding an internal topography allows one to use the Critical Coulomb Wedge (CCW) theory, which guarantees that the compression Q will result in activation of the thrust in the central region. The models are size calibrated compared with the stress gradient evolving with depth, taken at the fold front, away from the deformed zone, and following the relation σv = ρ·g·z, where σv represents the vertical stress, g is the standard gravity (g = 9.8 m.s−2), z is the depth in meters, and ρ indicates the rock density, as previously mentioned. This means that for a depth of 2000 m, which is the depth between the Maastrichtian and Trias décollement in the Sant-Corneli area [69,70], the principal minimum stress (σ3 = σv) is approximately 45 MPa. The models are geometrically constrained by several parameters that are evolving with the growth of the fold, as detailed in Table 1.
Through these fourteen steps, we particularly followed the local stress variations during the fold development and the resulting distribution of the damaged zone. Consequently, we focused on six different key points in front of the fold, at the base of the syn-tectonic layers (Figure 3). The aim of these punctual analyses was to compute the local stress variations during the fold evolution and associated burial at different distances of the deformed zone. Values of maximum (σ1) and minimum (σ3) stresses obtained from the numerical results were used to calculate the effective mean stress (P) and the differential stress (Q), and then the Q/P ratios.

3. Results

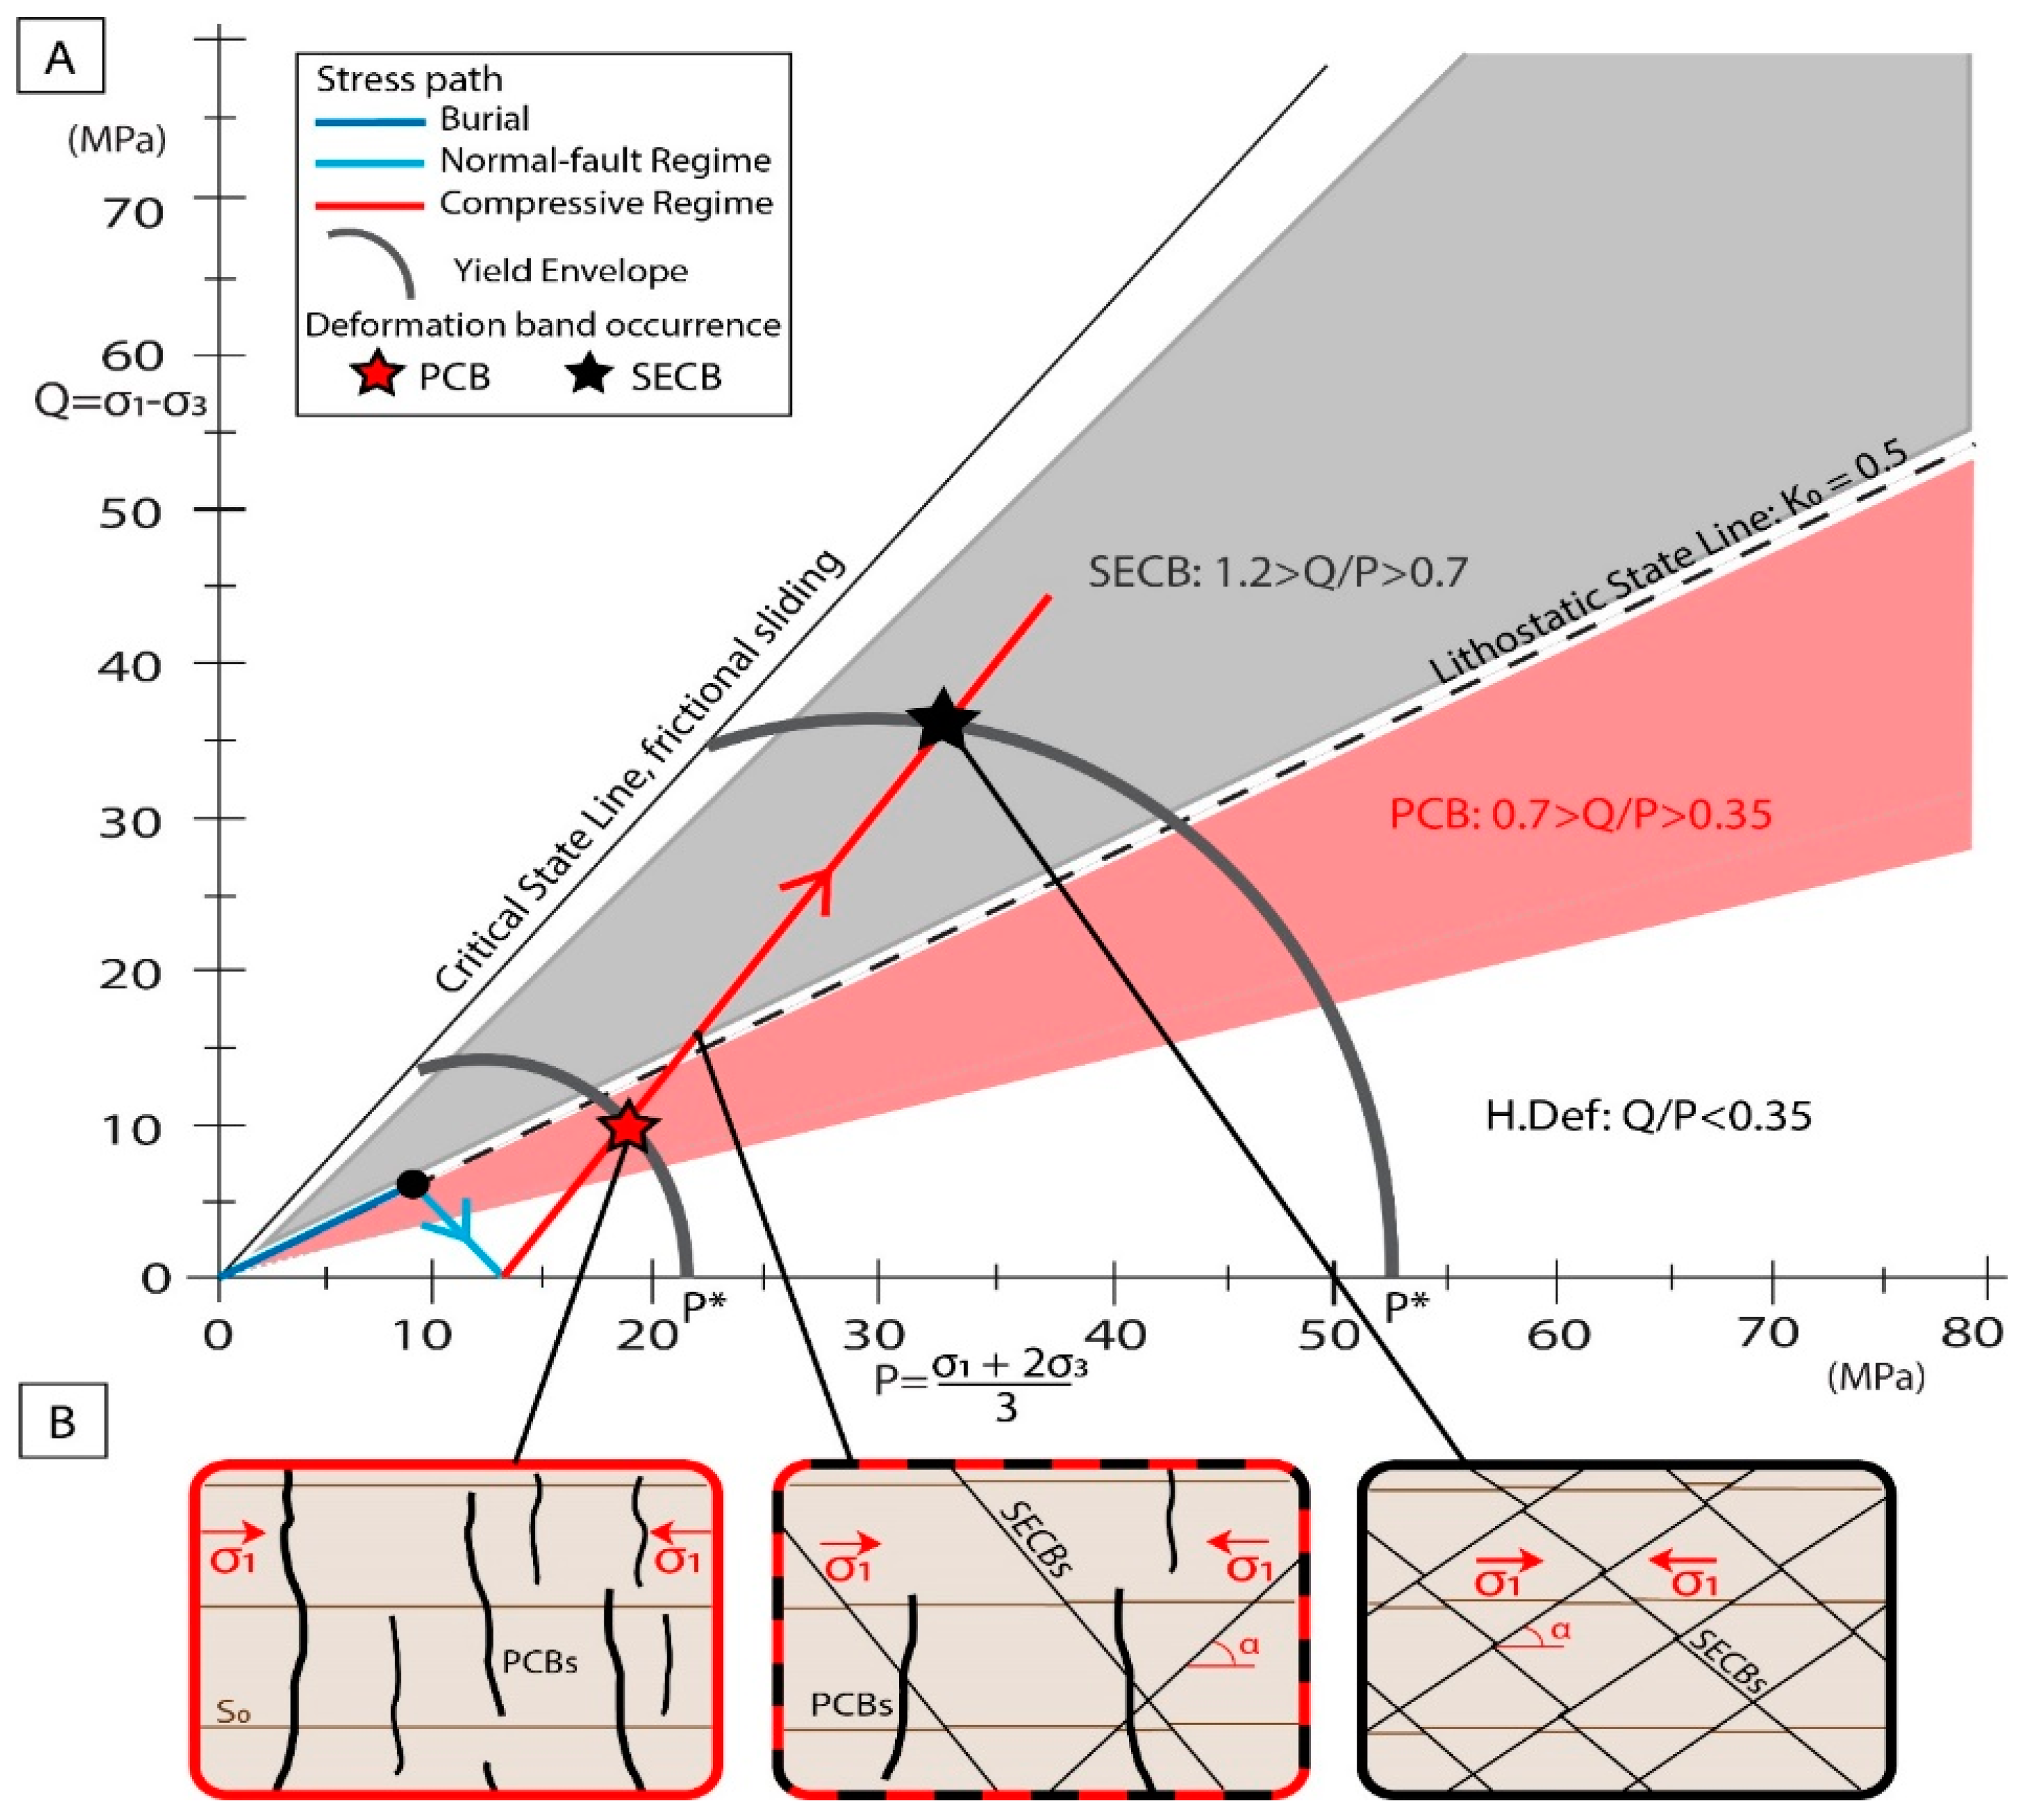
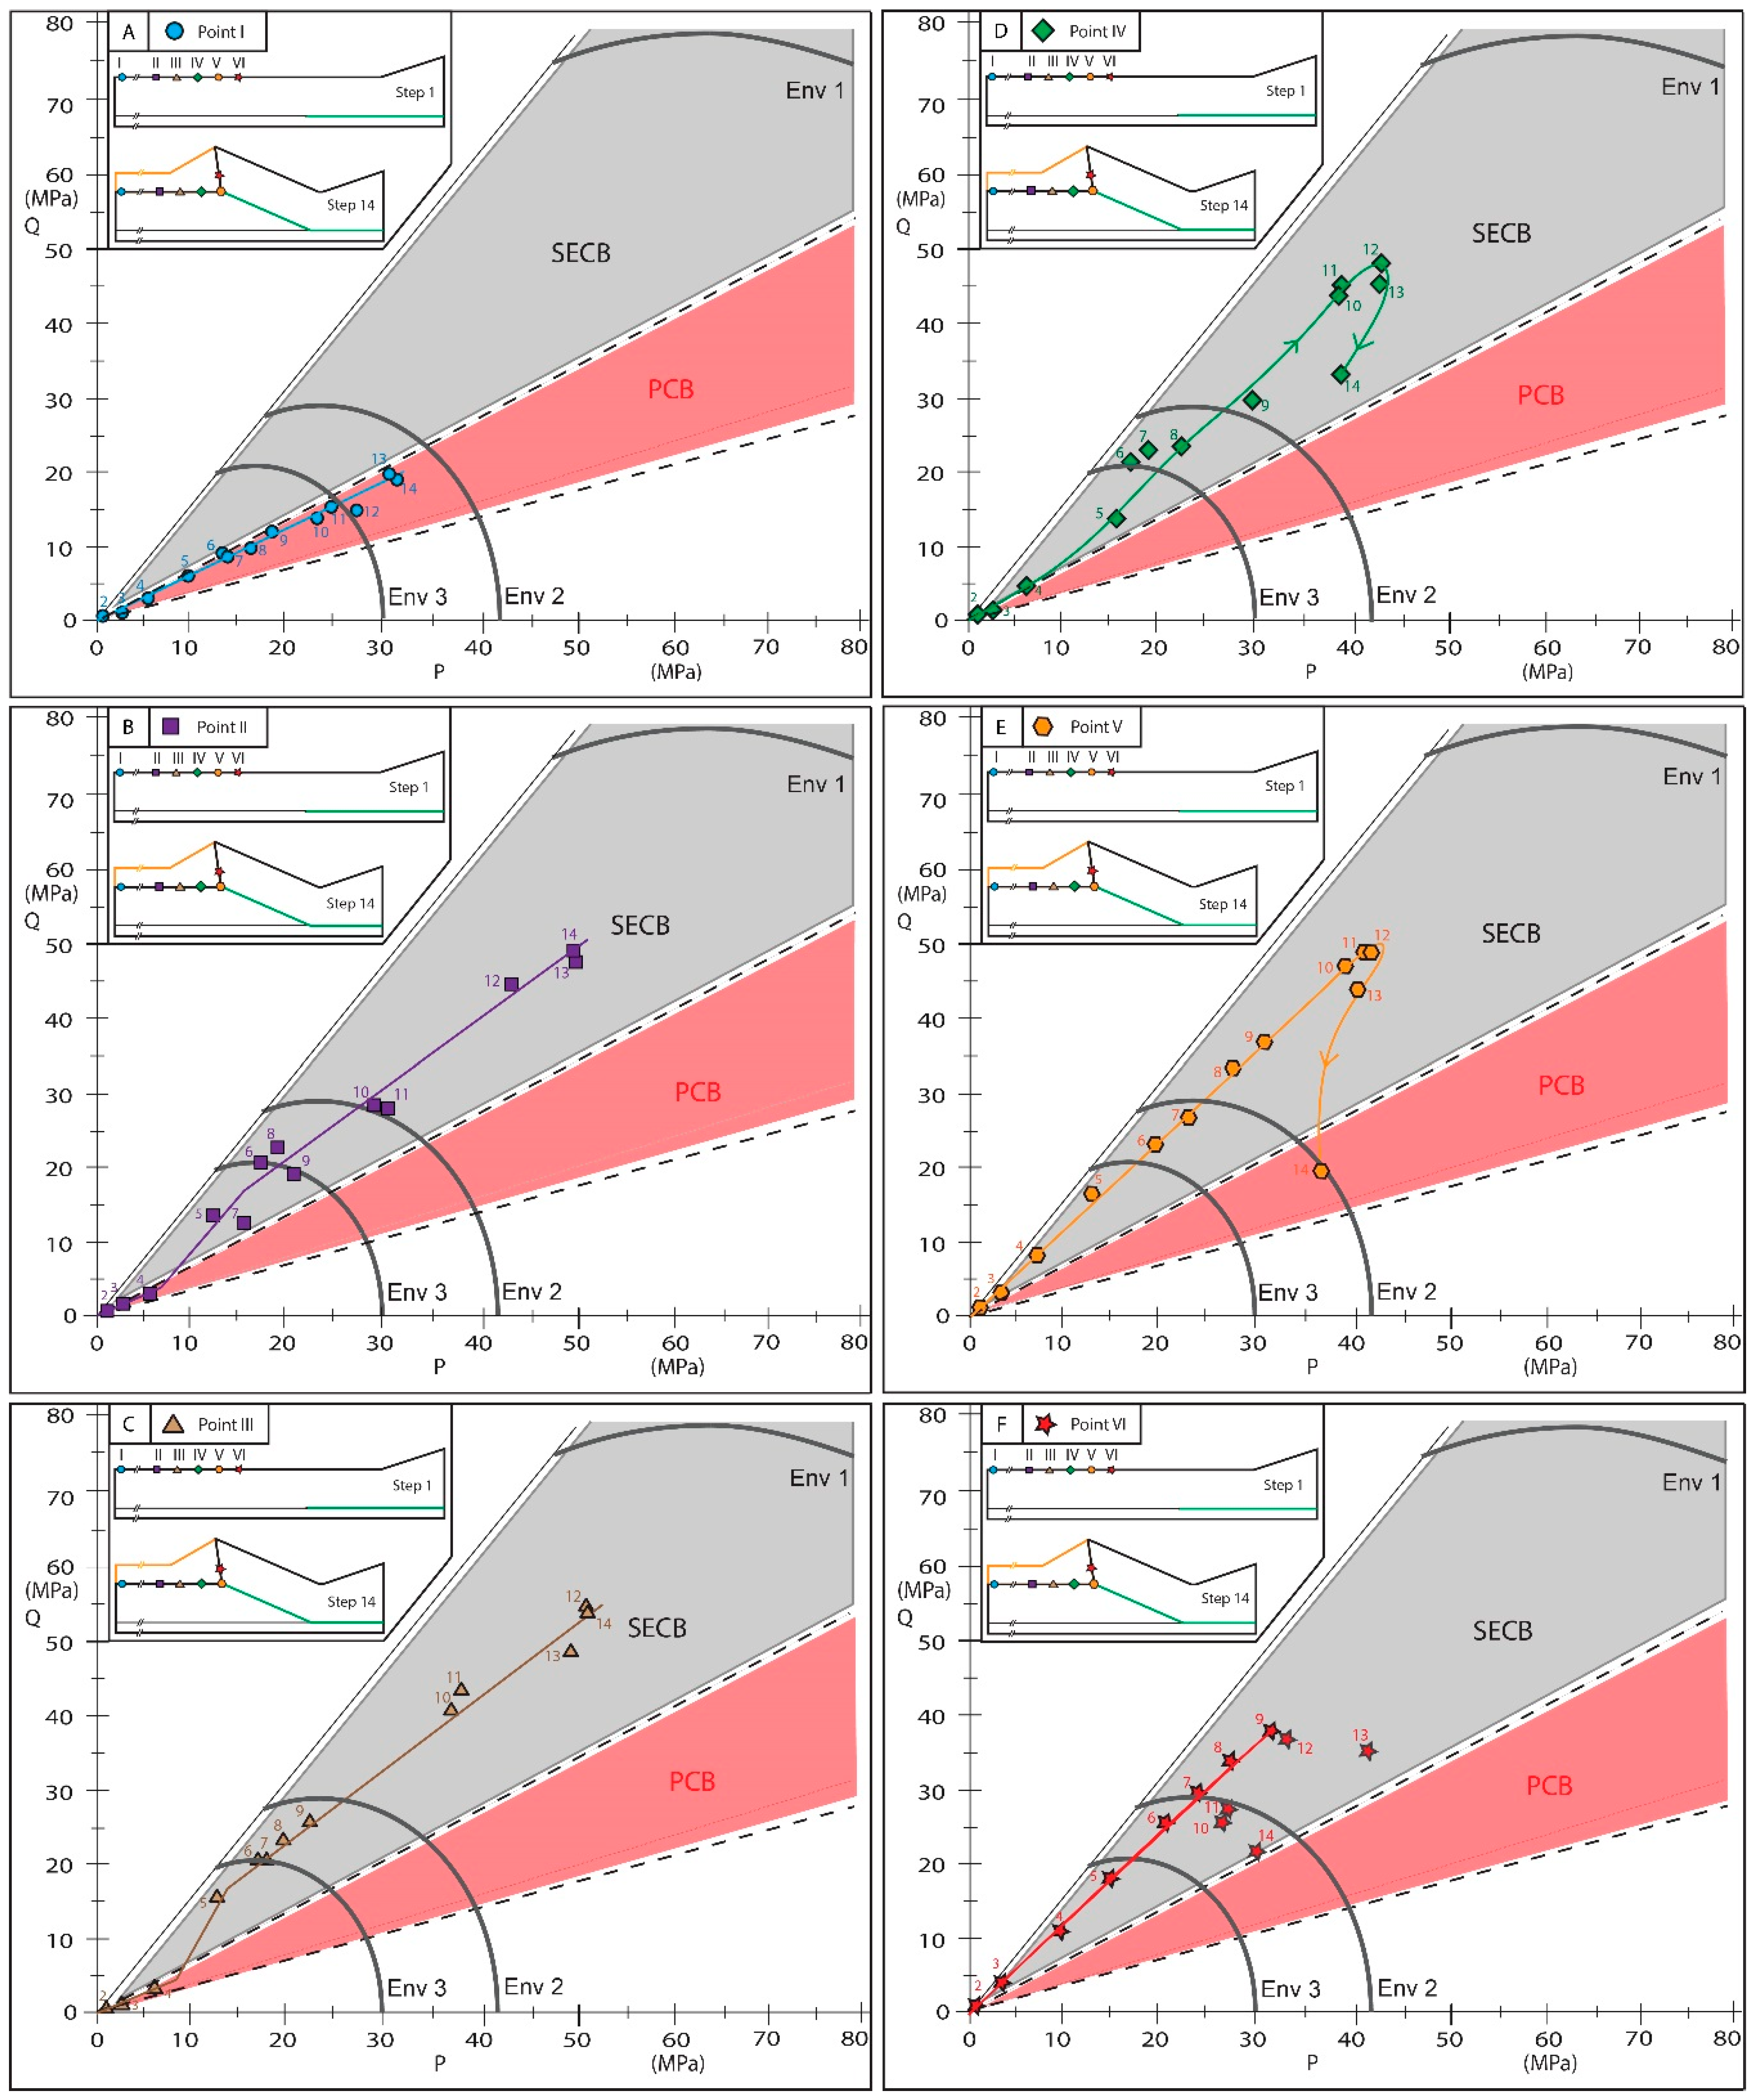
3.1. Q/P Ratios Distribution and Stress Path

Figure 4 shows the distribution of the Q/P ratio estimated by the numerical model for each step of the fold growth. This ratio determines the type of bands potentially created, as presented in Figure 1. These results correspond to the onset of the thrust development. Q/P ratios ranging between 0.7 and 1.2 are in black, those between 0.35 and 0.7 are in red, and in white are the ratios lower than 0.35 (Figure 1). We decided to present the results with three-color coding rather than a continuous color scale to fit with the convention in our previous study, which used red (PCBs) and black (SECBs) colors only [24]. Generally, these results show that the Q/P ratio is relatively high when close to the thrust tip and at shallow depths in front of the fold. This high ratio zone can extend up to 5 or 6 km ahead of the fault tip and even further in the shallow depth layers. This ratio then decreases further from the deformed zone and also with depth for the later stages or below the thrust. At the fold crest, a few white spots can be observed, representing very low Q/P ratios. These are delimiting the extensional domain, where the maximum stress is sub-vertical. This means that, at the onset of the thrust activity, SECBs are more likely to form close to the thrust tip area, whereas the PCBs could occur below the thrust or far ahead from the thrust. These observations need to be compared to the yield envelope attributed to the host material.
In Figure 5, the stress paths for the six selected key points are presented on Q-P plots, where each fold stage is represented from step 1 to 14. On these diagrams, different areas mark the type of deformation bands that would occur if failure was observed, depending on the Q/P ratios presented previously (Figure 1 and Figure 4). Note that Point I was not presented in Figure 4 as it was located at the extreme front of the model; however, the stress estimations are given in Figure 5.
The six selected key points are presented from the farthest from the fold (blue circles numbered I on Figure 3) to the closest (Point VI, Figure 3) for all fourteen steps. The first important result is that, in any case, the maximum differential (Q) and/or effective mean stress (P) do not exceed 55 MPa for the later stages. In most cases, the closer to the fault tip we made the measurements, the higher the stress values were. The furthest point I (Figure 5A) shows a linear stress path that stays in the PCB domain (in red), but with a relatively low stress magnitude, even for advanced stages. This linear trend and low values of Q/P evolution can be observed for the early stages (step 1 to 4, Figure 5A–D) at the other points measured, except for Points V and VI, which are the closest to the deformed area. After this early stage at Point II to point IV, the stress path is located in the SECB domain with a higher Q/P ratio (generally from stage 4 to 14).
This second part of the stress path evolution is also approximately linear, with a steeper slope than the previous part. This slope is also increasing from one point to another when moving closer to the fault (from step 5 to step 14 for Point II up to step 2 to step 9 for Point VI). Then, a slight decrease is observed in mean stress and a strong decrease can be observed in differential stress for the closest points to the fold in the last stages (Figure 5D–F). Finally, for stages 10 to 14 of the closest point (Figure 5F), the stress evolution does not show any clear trend as Point VI is located in the back hinge of the syn-tectonic deposit, which means that the burial is then stopped. The stress results are consequently lower than in the previous stages, but remain the same in the SECB domain, despite the decrease of the differential stress.

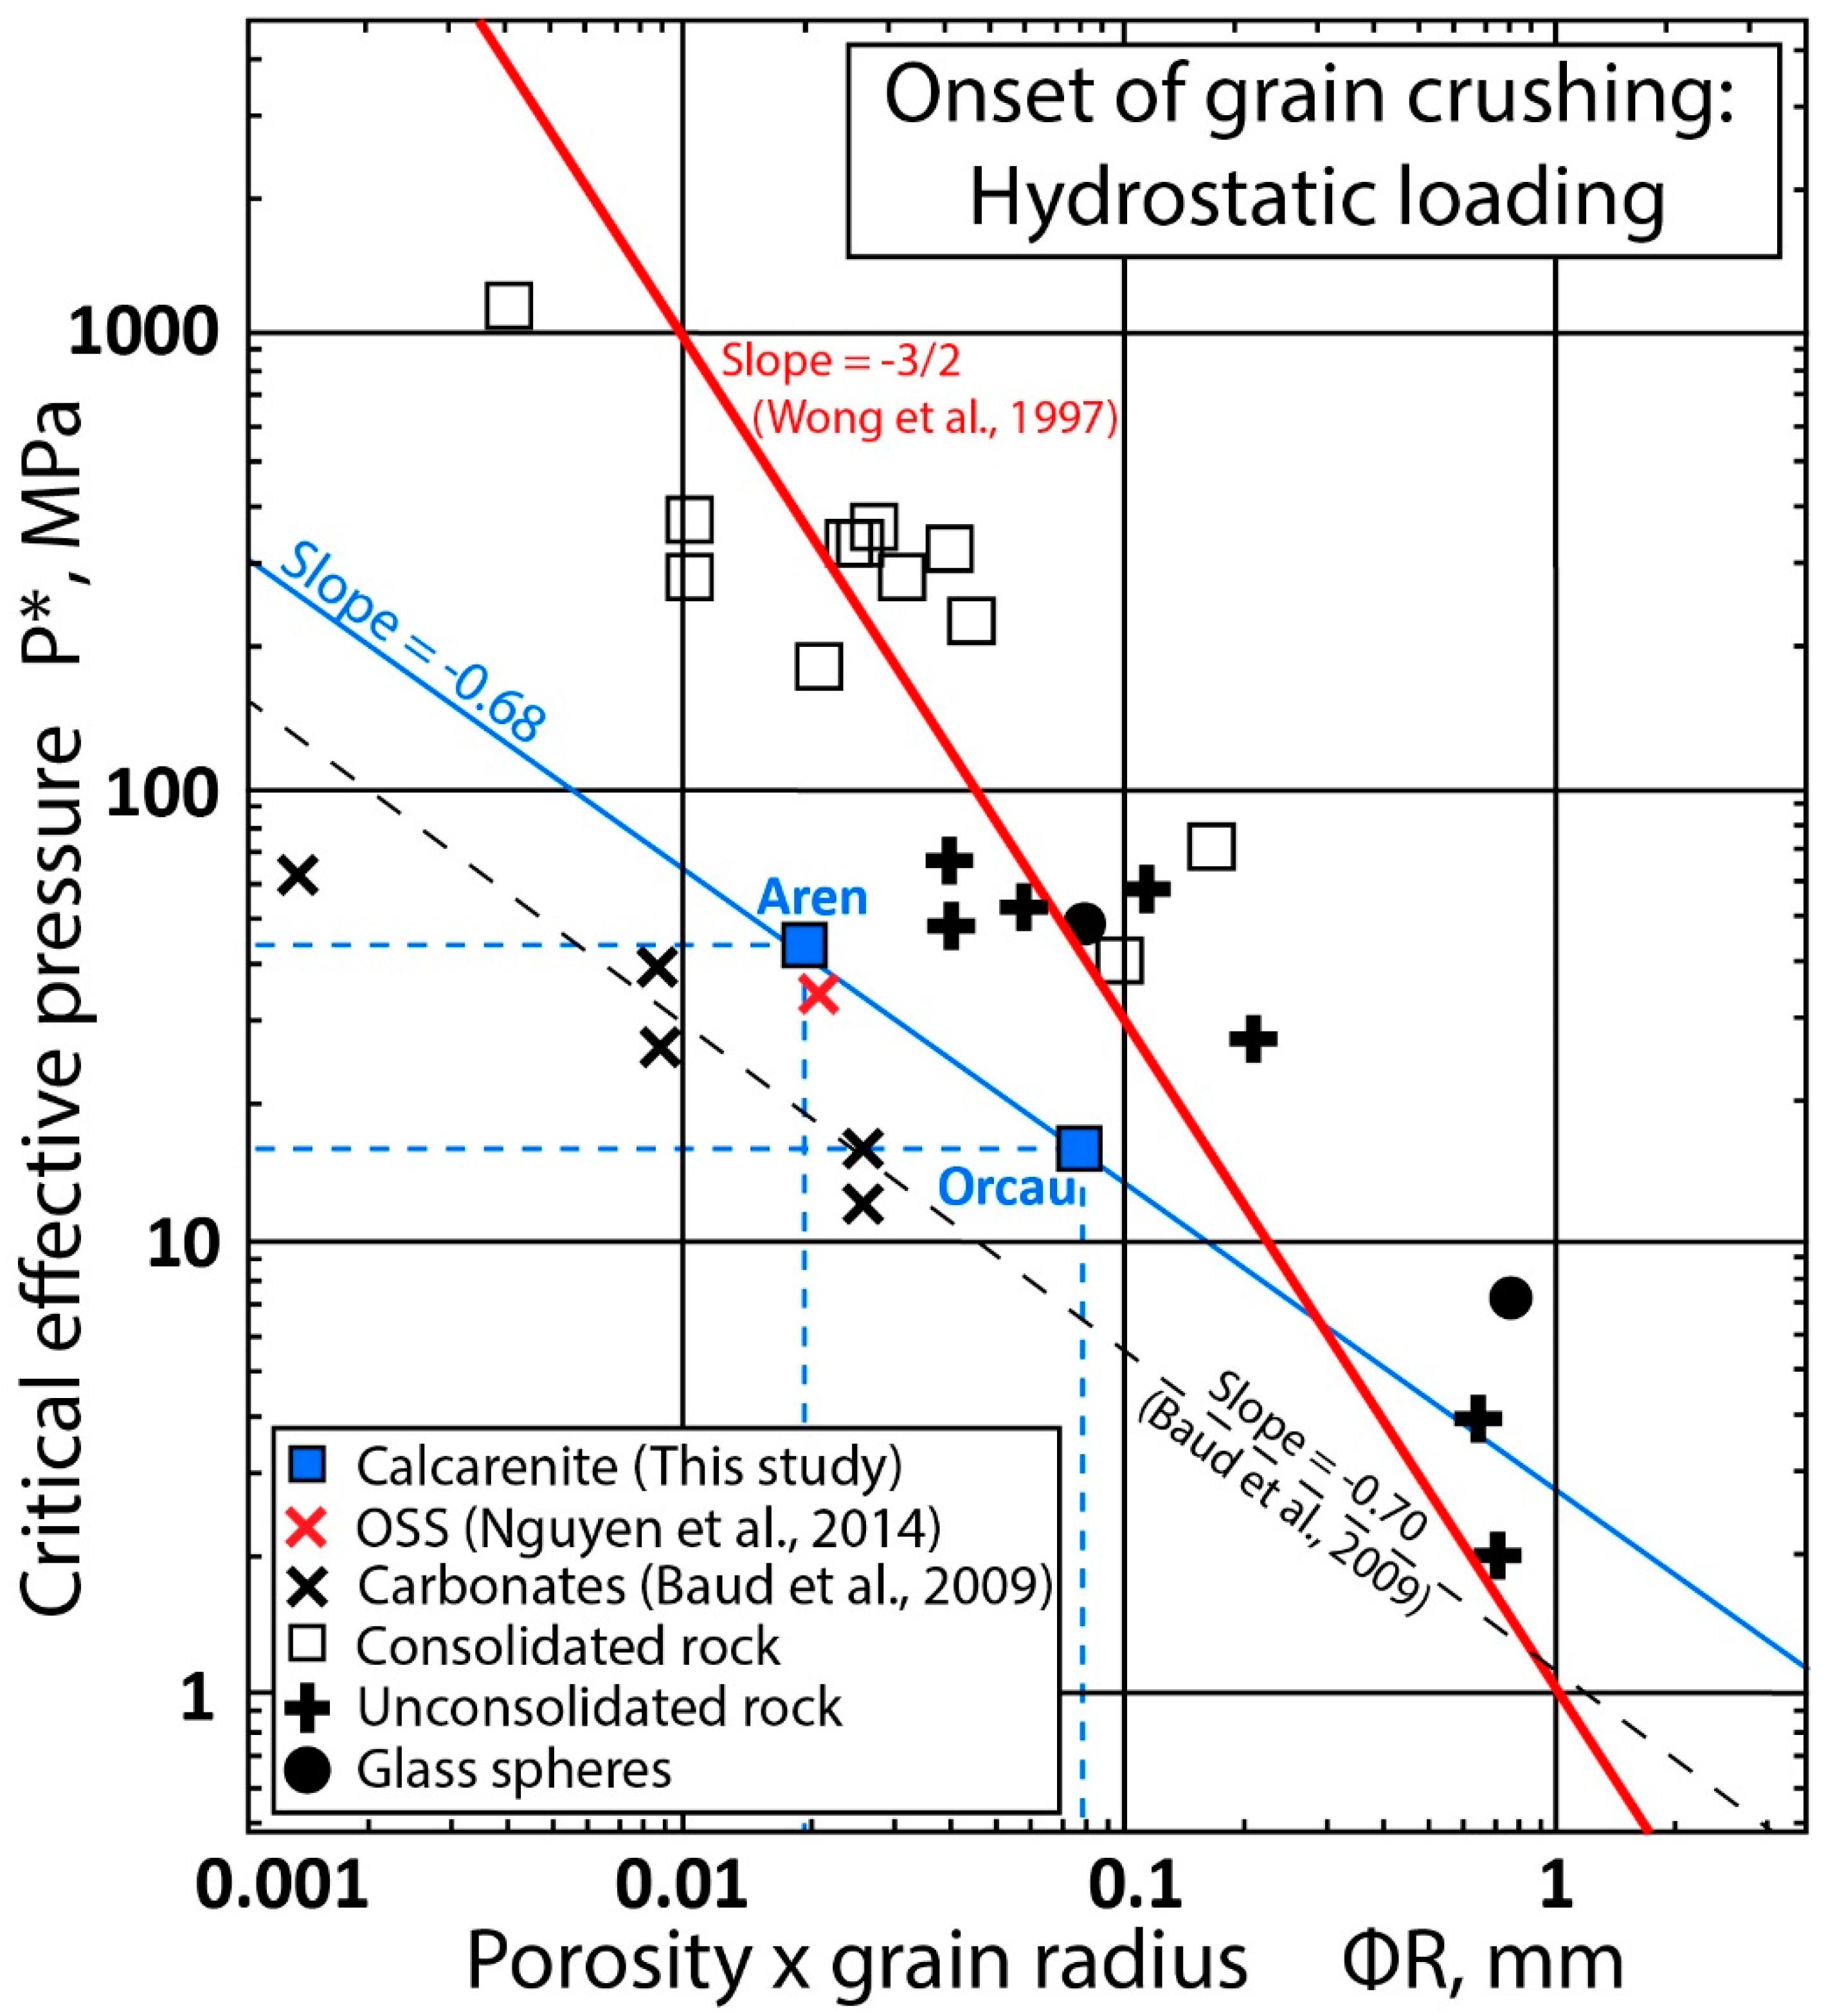
3.2. Failure Envelopes

To focus on the deformation band occurrence, we compared it with the closing failure envelope, also known as “cap”, corresponding to the compaction and shear enhanced compaction part of the yield envelope. The shape of this cap is often represented by a quarter of an ellipse which intersects the P axis at the P* key point, known as the critical pressure, indicating the onset of grain crushing and pore collapse. It has been shown that both P* and the corresponding failure envelope are mainly controlled by the grain size and porosity [13,14].
The stress evolution at the different points represented on the prototypes and located at different distances from the fold was compared in Figure 5 using either experimental failure envelopes obtained by geomechanical experiments under triaxial conditions in the laboratory or estimated ones based on the material properties.
Firstly, the empirical value of P* was drawn for the Aren formation of the Tremp basin, derived from the equation proposed by Zhang et al. [13] and Wong et al. [14], which predicts the value of P* from the initial porosity and the grain size of the rock. The obtained value is about P* = 116 MPa (“Env 1“) for a mean initial porosity of 35% and a mean grain size of 0.12 mm [24]. Here, the main result is the absence of an intersection between the stress paths and the “Env 1” envelope. This is telling us that for the Sant-Corneli fold kinematics, it is not possible to form deformation bands with such a yield envelope. The stress paths obtained in this study are consistent with the theoretical ones previously proposed in terms of general magnitude [24]. This means that the yield envelope for the calcarenite formation is lower than the one empirically calculated using the equations proposed by Zhang et al. [13] and Wong et al. [14].
Secondly, the experimental envelope (“Env 2“) was drawn for the Boise II sandstone, a rock with a similar porosity to the Aren formation before cementation. The measured P* value for this sandstone is approximately 42 MPa [14] and the envelope is drawn from this point. With the Boise II envelope, it is possible to form deformation bands starting from a depth of approximately 700 m for the points II, III, and IV (Figure 5B–D) and approximately a 550 m depth for the points V and VI (Figure 5E,F) near the main thrusting zone. These depths are relatively shallow compared to the general cataclastic deformation band depth occurrences analyzed in the literature [15]. However, our hypothesis proposed an even shallower set up of bands in the Tremp basin, with an average yield envelope estimated to be scattered between 20 and 40 MPa [24], with a mean value of P* = 30 MPa.
Therefore, we built a third envelope (“Env 3”) with P* = 30 MPa, which is not derived from microstructural information (i.e., porosity and grain size), but directly linked to the stress path behavior fitting the tectono-burial history of the Aren formation. The results are consistent with what we hypothesized, as the first deformation bands occur at approximately 450 m for the majority of the points we followed (Figure 5B–F) because the stress paths intersect the envelope at approximately step 6, which is the maximum depth at which the formation was during the Paleocene Boixols thrust activity [24,39,71].

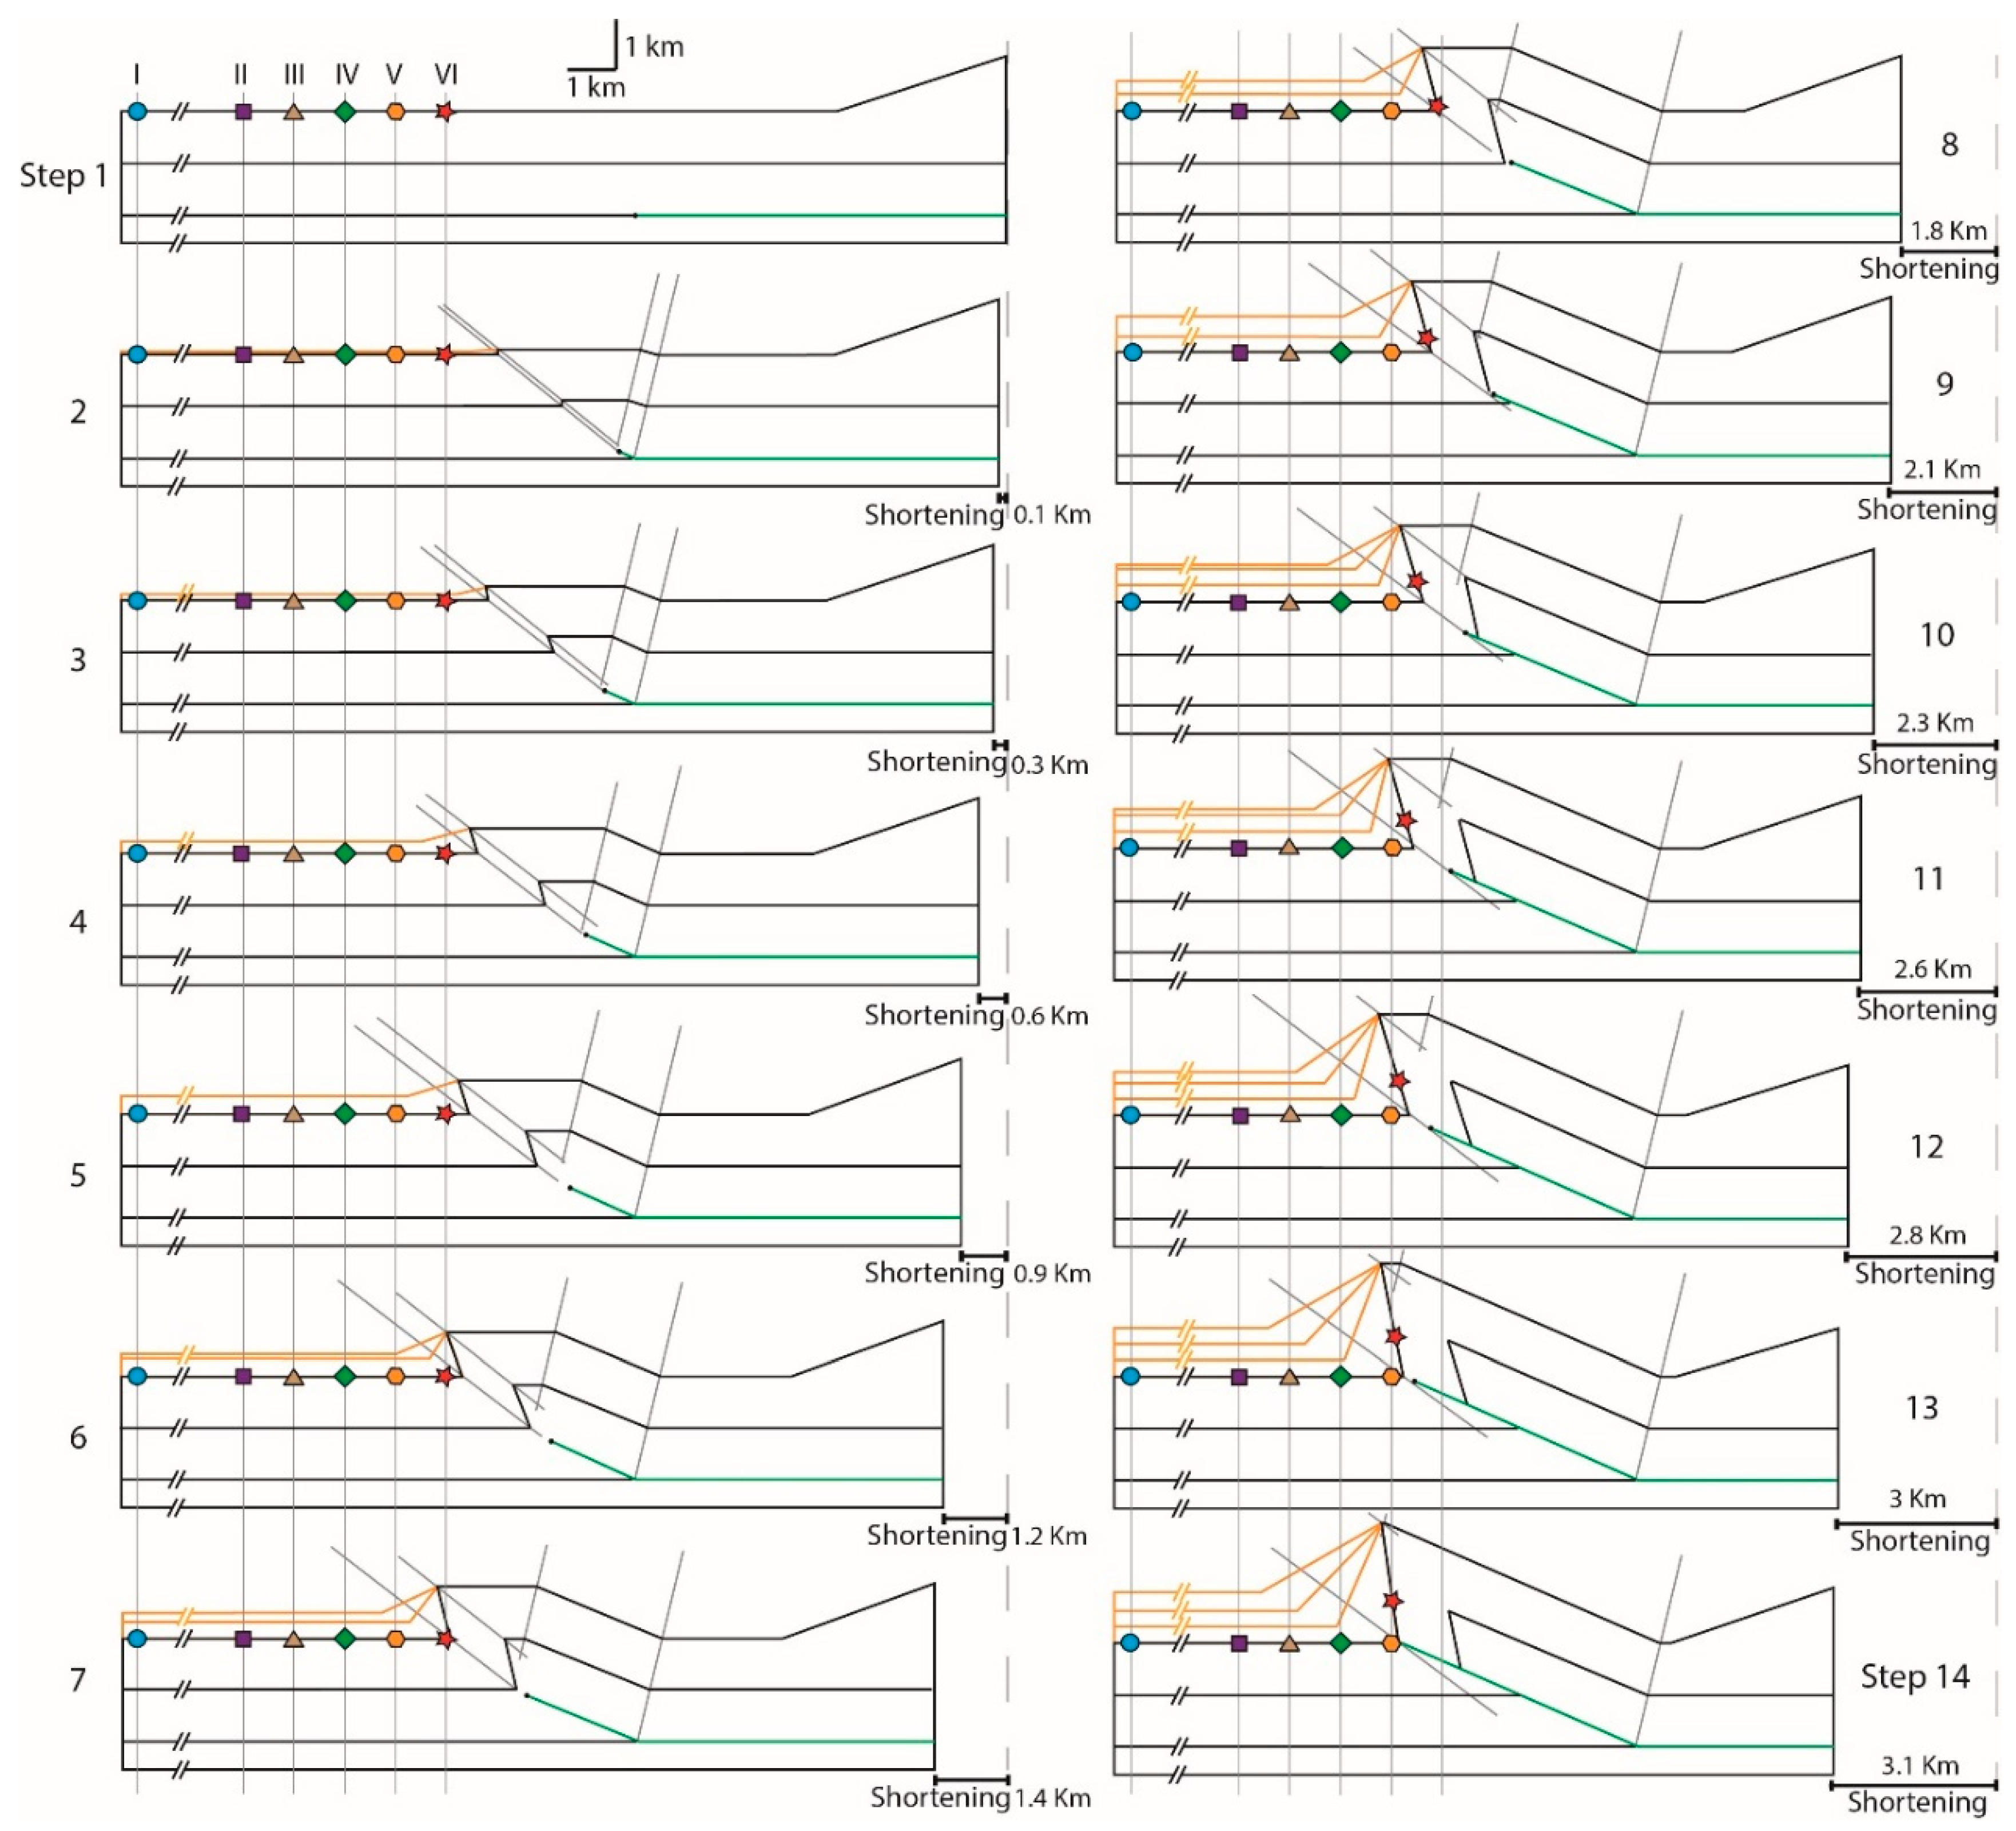
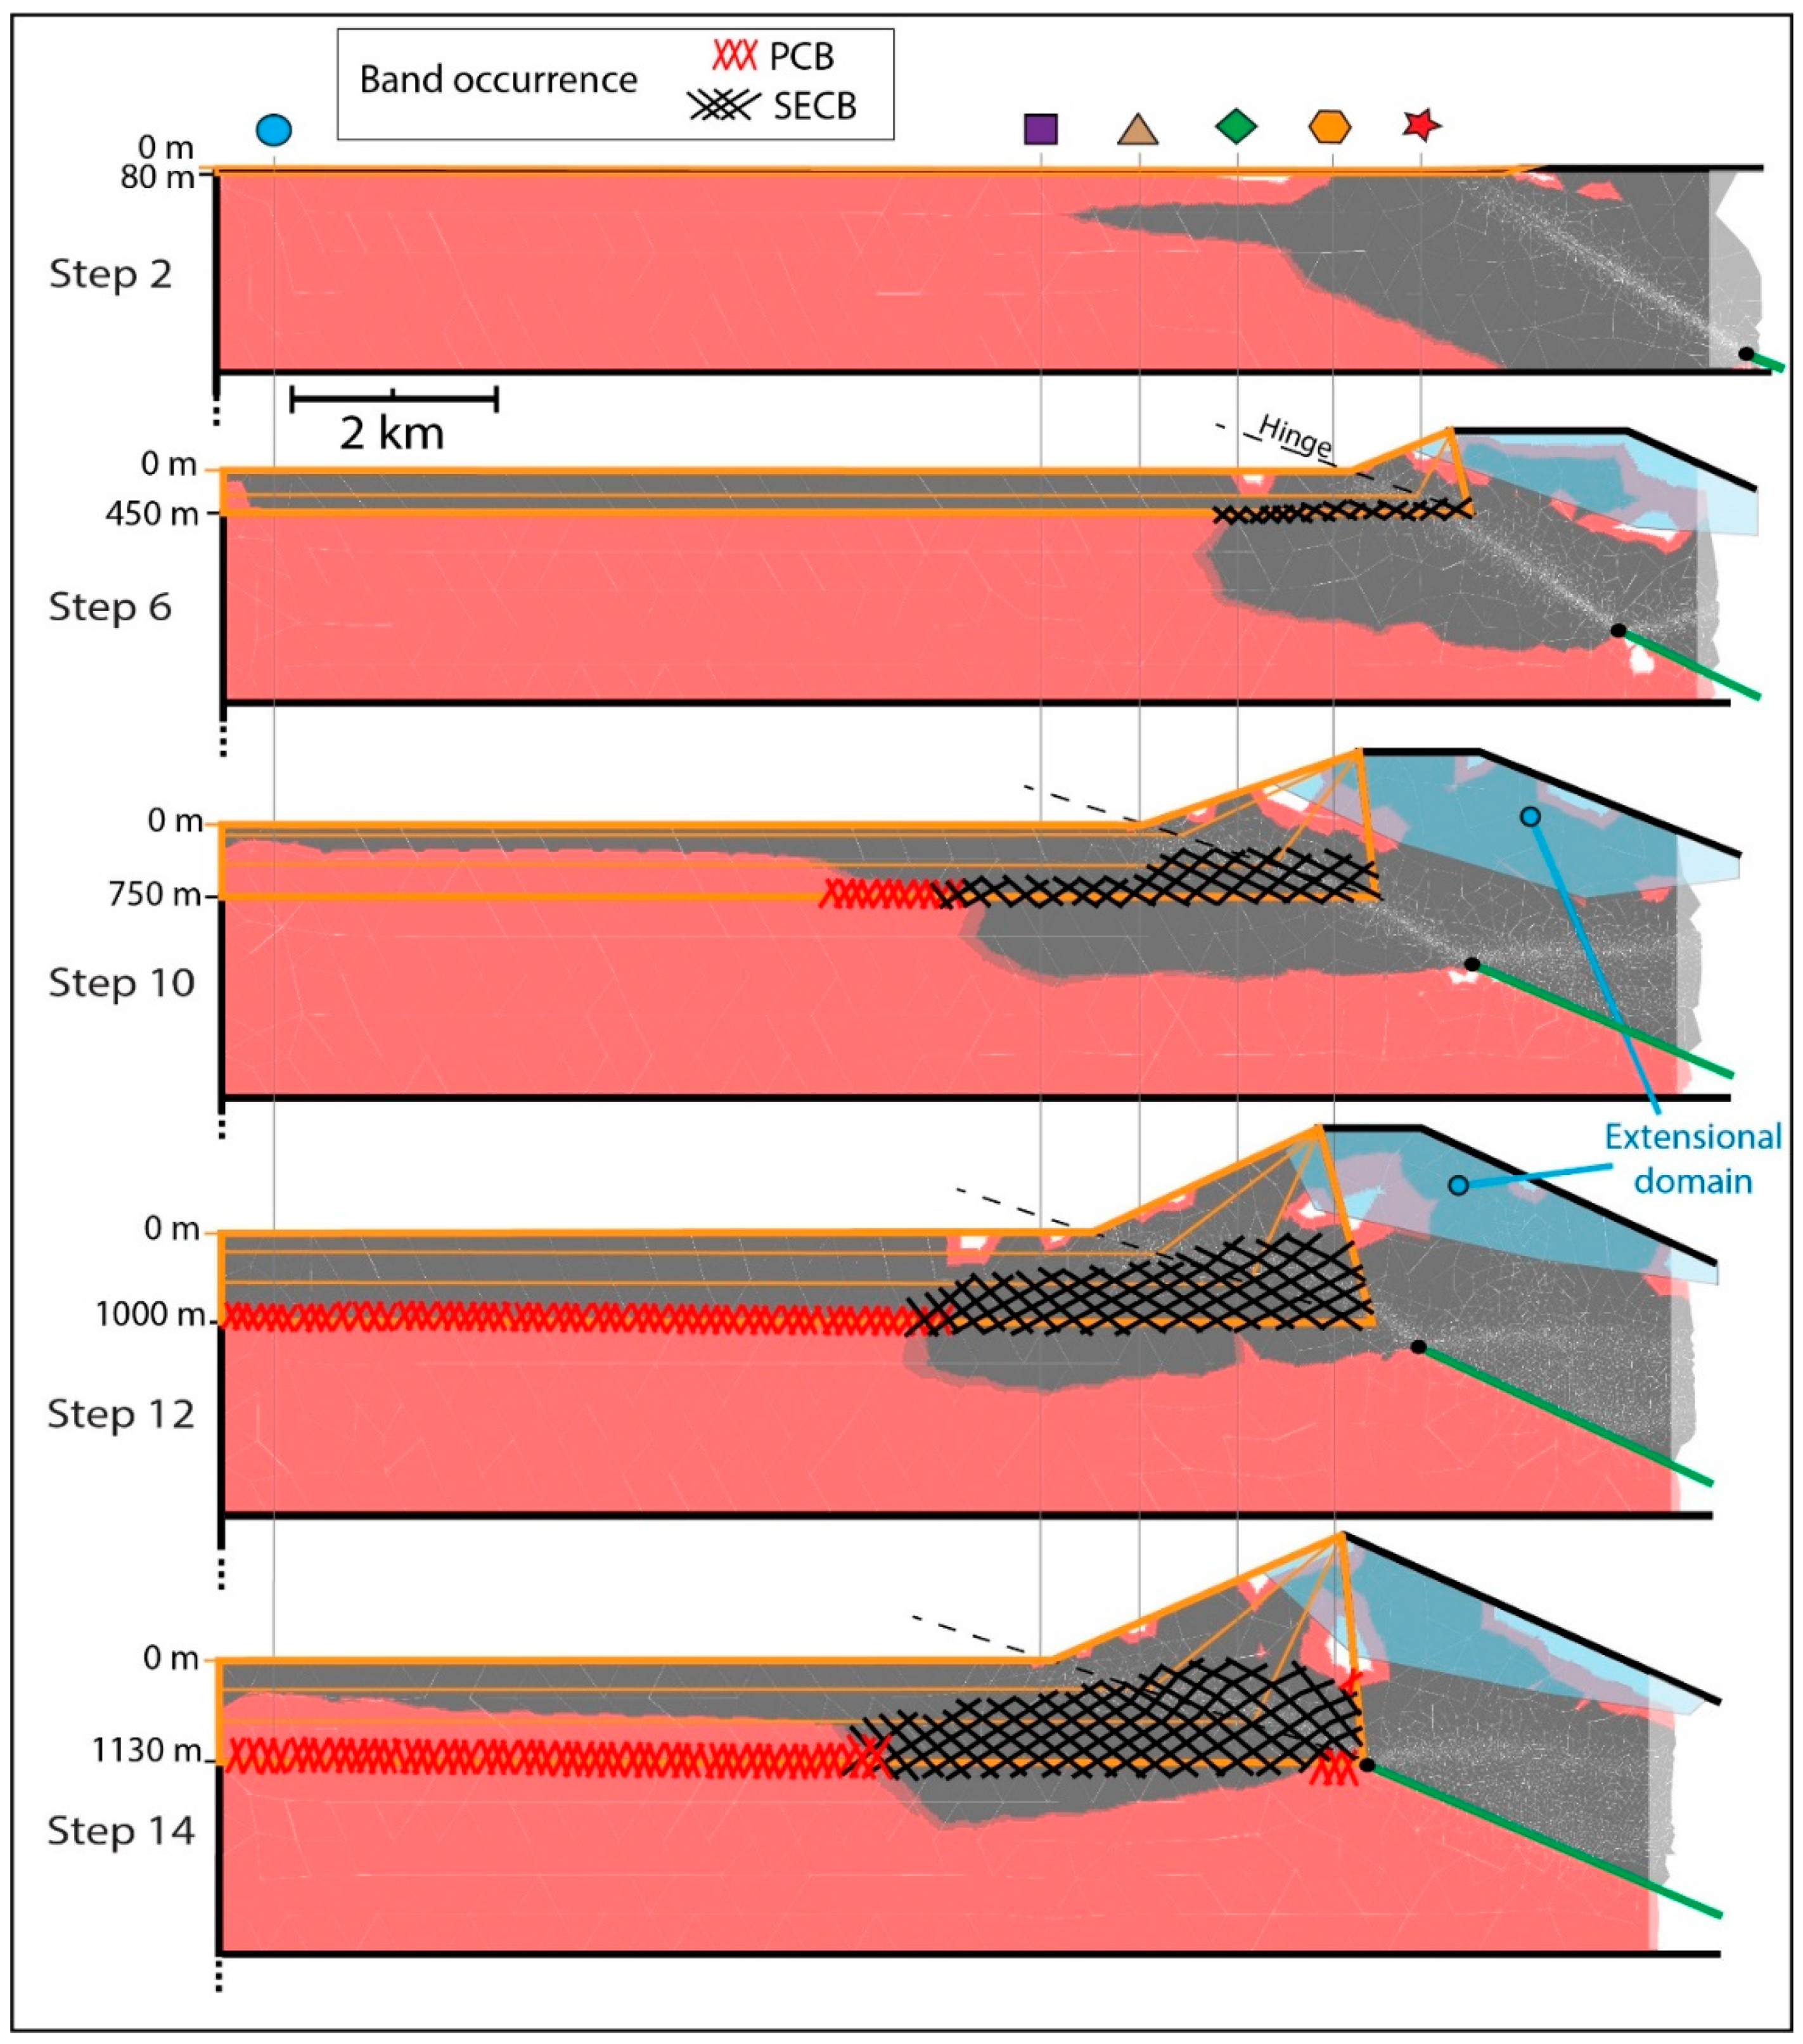
3.3. Band Timing and Distribution

The distribution of deformation bands in the case of the theoretical calcarenite yield envelope (“Env 3” in Figure 5) is shown in Figure 6. This representation shows that the first bands to form are Shear Enhanced Compaction Bands (SECBs) and are occurring at a minimum depth of approximately 450 m (step 6 of the fold evolution in Figure 3) and a maximum distance of approximately 4 km from the fault tip (Figure 6). These early bands are formed as the differential stress Q is already relatively high (around 20 MPa, see the stress evolution Figure 5B–F) compared to the effective mean stress. For the following steps, the band distribution grows progressively ahead of the fold and also at the end of the fold evolution, where PCBs are created outside of the stress bead linked to the fault tip. This bead is represented by the black area moving toward the basin in front of the fold and with the growing fault (Figure 6). The first PCBs are formed at a depth of approximately 750 m at a maximum distance of 6 km from the fault tip, but this cannot be seen in the key points’ stress evolution (Figure 5) as it is localized outside the measurement range. However, it can be seen on the Point I stress path, where it crosscuts the ”Env 3” cap at step 12, which is also represented in Figure 5A.
At the end of the fold evolution, i.e., step 14 (Figure 6), we observed a small area located below the fault tip showing a relatively low differential stress where newly formed PCBs could occur, which corresponds to step 14 of Point V plotted in Figure 3, with a decreasing Q in the stress path (Figure 5E).

4. Discussion

4.1. Chronology of Band Occurrence

The fact that high Q/P ratio values were found close to the surface (few hundreds of meters depth), decreasing with depth, does not mean that SECBs generally form before the PCBs. The numerical results suggest that it is not possible to create PCBs, or only in particular areas, which is not what we expected, as these structures were found in most of the sites analyzed in the Tremp basin by Robert et al. [24] and also in other areas associated with contractional deformation [7,10,72,73,74,75]. The numerical results based on LAM only highlight the onset of the deformation, directly linked with the thrust activity, but the method does not allow us to view the stress evolution related to the compression before the fault movement. We suggest that the missing stress path, which could be compared to “Layer Parallel Shortening” (LPS), is first represented by a downward stress path until a low Q value is reached, when there is a maximum stress inversion from an extensional to compressional regime (blue and red paths in Figure 1, see Soliva et al. [12] for details) with upward stresses values (differential and effective mean stress). With such stress evolution not considered in the previous analysis, it is possible to reach small yield envelopes in the PCB domain. The PCBs, in that case, can only be linked to this missing part of the stress path related to LPS, before the thrust activity.
Following this assumption, PCBs would occur in early stages of the fold deformation and would be primarily compared to the secondary SECBs that would be related to the direct propagation of the thrust. This chronology is consistent with the general shallow occurrence of PCBs compared to the relative deep SECBs that have been synthetized in the literature [15].
The present study does not take into account several parameters that may have a role in the deformation distribution or the band occurrence, such as the fluid and the diagenesis that chemically fill the porosity. It is important to note that this porosity can also be mechanically reduced with depth by the burial load or by strain hardening due to the fracturing evolution of the rock [1,4], which will reduce the possibility to form deformation bands with depth as the porosity can quickly decrease.

4.2. Deformation Band Occurrence in Heterogeneous Granular Materials

The Aren formation is known to be classified as a calcarenite, which represents a mix of quartz grains with bioclastics particles that is nowadays fully cemented with carbonate cement. The onset of grain crushing for hydrostatic stress in siliciclastic rocks is quite well constrained by geomechanical experiments on sandstones: the critical pressure P* depends on the grain radius (R) and porosity (φ) [13,14] following an empirical power law P* = α(φ.R)−3/2, where α is considered a constant mostly depending on grain elastic properties (Fig. 7). Our study shows that the Aren formation cannot follow the same empirical relation base for measurements on siliciclastic materials. Indeed, the stress path for the kinematic we proposed is insufficient to reach the empirical envelope (“Env 1”). Another study [76] tested the empirical relationship between P*, φ, and R for carbonate rocks: a slope of −0.7 was found to match the data for carbonate rocks (Figure 7), which is different from the siliciclastic one (−1.5).
For the calcarenite of the Tremp basin, we used the results of our previous study [24], where cap envelopes were theoretically plotted in a Q-P diagram to be consistent with a stress path responsible for the deformation bands analyzed (Figure 17B in [24]). The smallest theoretical envelope (P* = 16 MPa) was attributed to the Orcau site that presents a coarser grain size (mean grain size of 0.44 mm), and the largest cap envelope (P* = 42 MPa) to the Aren site with a finer grain size (mean grain size of 0.12 mm). With these two theoretical cap envelopes, we were able to plot both sites in the classical diagram of Wong et al. [14]: both points stand slightly out of the siliciclastic rock correlation (Figure 7). From these two points, we can draw a line with a slope of −0.68, which means that the empirical power law between P* and (φ.R) has an exponent of −0.68 instead of −1.5 for the siliciclastic rocks ([13,14], Figure 7). This slope is similar to the one found for carbonate rocks [76], but presents a small offset. Lastly, we added a result from a geomechanical test on Otter Sherwood sandstones to the plot (OSS, red cross, Figure 7) [77]: this last point is consistent with our results for the Tremp basin. Interestingly, both materials are characterized by a strong heterogeneity in mineralogical composition, in disagreement with the assumptions in the theoretical model leading to the power-law with exponent −1.5 valid for siliciclastic rocks with only a quartz composition. The Sherwood sandstone presents a non-negligible amount of feldspar (~30%) and detrital clays (mainly illite, ~18%, values taken from Nguyen et al. [77]), in addition to quartz. The calcarenite of the Tremp basin is made of quartz grains with a significant amount of bioclasts.
Our study suggests that heterogeneity is a key factor in the mechanical behavior of rocks. Even a small heterogeneity (a few percent) in the rock composition, especially the addition of weaker material compared to quartz grains, such as bioclasts or clays, is sufficient to lower the mechanical properties of the reservoir and the local strength of the rock. This is even more important when this fraction becomes non negligible in comparison with the whole rock composition. Similar observations have been made for volcanoclastic or feldspar-rich host rock compared to quartz-rich host rock [30]. Deformation bands analyzed in carbonate sandstones show that pressure-solution seems to play an important role in the compaction and the shear localization in those rocks. Intergranular pressure solution is considered an important process that contributes to grain size and porosity reduction in band development, often analyzed to occur at a near-surface depth [78,79,80,81,82,83].
The deformation at the micro-scale that we observed in the calcarenite of the Aren formation is then a hybrid of a pressure-solution for the bioclasts and brittle fracturing of the quartz grains, like in the bands presented by Tavani et al. [84] in a similar facies. Interestingly, the pressure-solution in our samples, without any expression outside the band, appears to be localized at the place of the future deformation band s.s. and playing, likely before brittle fracturing appears, as a proto-band. When physical properties are mainly taken into account in the empirical geomechanical relation for purely siliciclastic rocks [13,14], chemical parameters should be added to this relation when working on heterogeneous rocks such as calcarenites.

5. Conclusions

This study complements the previous work by Robert et al. [24]. This study presents a macro- and micro-analysis of the deformation bands during Boixols thrust and fold growth in order to test the hypothesis of a shallow occurrence of these bands (Tremp basin, Spain) [24]. Numerical simulations were made using the LAM with OptumG2 software in order to follow the stress evolution and to predict the band distribution through 2D cross sections with an imposed fault-propagation fold kinematic.
Our simulations show that the thrust is guiding the high values of stress, which implies relatively high values of the Q/P ratio (between 0.7 and 1.2) at the back of the fold and ahead of the thrust tip. Below the thrust and far away, in front of the deformed area, this ratio is decreasing to lower values, although close to 0.7.
The stress results were used to determine the deformation bands’ distribution during the fold evolution and the relative burial of syn-tectonic layers that we added to the models. Low values of the Q/P ratios will potentially form Pure Compaction Bands, whereas Shear Enhanced Compaction Bands will occur for higher values of this ratio (higher than 0.7).
We compared these results with known values of mechanical properties of siliciclastic rocks to predict the actual band distribution observed by Robert et al. [24] and to explain a shallow occurrence of these deformation bands. Using ad hoc yield envelopes proposed for the calcarenite, the first deformation bands would occur at a depth of approximately 450 m, which was the depth proposed in our previous work [24].
Finally, we suggested that the calcarenite mechanical properties do not follow the same trend as sandstones and carbonates with respect to the relationship between critical pressure, porosity, and grain size. We propose, in a diagram that relates P* to porosity times grain size [13,14], that the calcarenite follows an intermediate trend, with an estimated slope of −0.68, similar to the results obtained for carbonate rocks, although with a slight shift towards higher values of P*. This still needs to be confirmed by geomechanical experiments on similar facies of high-porosity rocks with a heterogeneous composition.
The protocol we used in this study can be reused for other geological settings, or for different types of rock, to predict the damage state of a reservoir from the knowledge of the kinematic and the rock facies. Here, we chose to check the hypothesis for strike-slip structures, but other studies can be conducted on the thrust fault regime to increase the accuracy for the 2D issue.

Author Contributions

Conceptualization, writing—original draft preparation, R.R.; writing—review and editing, supervision, P.S., P.R. and C.D.

Funding

This research received no external funding.

Acknowledgments

We are grateful to the University of Cergy-Pontoise for the financing of the first author’s PhD. We are also thankful to the three anonymous reviewers for their useful advices.

Conflicts of Interest

The authors declare no conflict of interest.

References

  1. Fossen, H.; Schultz, R.A.; Shipton, Z.K.; Mair, K. Deformation bands in sandstone: A review. J. Geol. Soc. Lond. 2007, 164, 755–769. [Google Scholar] [CrossRef]
  2. Ballas, G.; Soliva, R.; Sizun, J.-P.; Benedicto, A.; Cavailhes, T.; Raynaud, S.; Cycle, A.N. The importance of the degree of cataclasis in shear bands for fluid flow in porous sandstone, Provence, France. Am. Assoc. Pet. Geol. Bull. 2012, 96, 2167–2186. [Google Scholar] [CrossRef]
  3. Antonellini, M.A.; Aydin, A.; Pollard, D.D. Microstructure of deformation bands in porous sandstones at Arches National Park, Utah. J. Struct. Geol. 1994, 16, 941–959. [Google Scholar] [CrossRef]
  4. Schultz, R.A.; Siddharthan, R. A general framework for the occurence and faulting of deformation bands in porous granular rocks. Tectonophysics 2005, 411, 1–18. [Google Scholar] [CrossRef]
  5. Aydin, A.; Borja, R.I.; Eichhubl, P. Geological and mathematical framework for failure modes in granular rocks. J. Struct. Geol. 2006, 28, 83–98. [Google Scholar] [CrossRef]
  6. Wibberley, C.A.J.; Petit, J.-P.; Rives, T. The mechanics of fault distribution and localization in high-porosity sands, provence, France. Relatsh. between damage localization. Geol. Soc. Lond. Spec. Publ. 2007, 164, 599–608. [Google Scholar] [CrossRef]
  7. Eichhubl, P.; Hooker, J.N.; Laubach, S.E. Pure and shear-enhanced compaction bands in Aztec Sandstone. J. Struct. Geol. 2010, 32, 1873–1886. [Google Scholar] [CrossRef]
  8. Fossen, H. Deformation bands formed during soft-sediment deformation: Observations from SE Utah. Mar. Pet. Geol. 2010, 27, 215–222. [Google Scholar] [CrossRef]
  9. Saillet, E.; Wibberley, C.A.J. Evolution of cataclastic faulting in high-porosity sandstone, bassin du Sud-Est, Provence, France. J. Struct. Geol. 2010, 32, 1590–1608. [Google Scholar] [CrossRef]
  10. Schultz, R.A.; Okubo, C.H.; Fossen, H. Porosity and grain size controls on compaction band formation in Jurassic Navajo Sandstone. Geophys. Res. Lett. 2010, 37, L22306. [Google Scholar] [CrossRef]
  11. Ballas, G.; Soliva, R.; Sizun, J.-P.; Fossen, H.; Benedicto, A.; Skurtveit, E. Shear-enhanced compaction bands formed at shallow burial conditions; implications for fluid flow (Provence, France). J. Struct. Geol. 2013, 47, 3–15. [Google Scholar] [CrossRef]
  12. Soliva, R.; Schultz, R.A.; Ballas, G.; Taboada, A.; Wibberley, C.; Saillet, E.; Benedicto, A. A model of strain localization in porous sandstone as a function of tectonic setting, burial and material properties; new insight from Provence (southern France). J. Struct. Geol. 2013, 49, 50–63. [Google Scholar] [CrossRef]
  13. Zhang, J.; Wong, T.-F.; Davis, D.M. Micromechanics of pressure-induced grain crushing in porous rocks. J. Geophys. Res. 1990, 95, 341. [Google Scholar] [CrossRef]
  14. Wong, T.; David, C.; Zhu, W. The transition from brittle faulting to cataclastic flow in porous sandstones: Mechanical deformation. J. Geophys. Res. Solid Earth 1997, 102, 3009–3025. [Google Scholar] [CrossRef]
  15. Fossen, H.; Soliva, R.; Ballas, G.; Trzaskos, B.; Cavalcante, C.; Schultz, R.A. A review of deformation bands in reservoir sandstones: Geometries, mechanisms and distribution. Geol. Soc. Lond. Spec. Publ. 2018, 459, 9–33. [Google Scholar] [CrossRef]
  16. Ballas, G.; Soliva, R.; Benedicto, A.; Sizun, J.-P. Control of tectonic setting and large-scale faults on the basin-scale distribution of deformation bands in porous sandstone (Provence, France). Mar. Pet. Geol. 2014, 55, 142–159. [Google Scholar] [CrossRef]
  17. Baud, P.; Zhu, W.; Wong, T. Failure mode and weakening effect of water on sandstone. J. Geophys. Res. 2000, 105, 16371–16389. [Google Scholar] [CrossRef]
  18. Baud, P.; Klein, E.; Wong, T. Compaction localization in porous sandstones: Spatial evolution of damage and acoustic emission activity. J. Struct. Geol. 2004, 26, 603–624. [Google Scholar] [CrossRef]
  19. Baud, P.; Vajdova, V.; Wong, T. Shear-enhanced compaction and strain localization: Inelastic deformation and constitutive modeling of four porous sandstones. J. Geophys. Res. Solid Earth 2006, 111, B12401. [Google Scholar] [CrossRef]
  20. Klein, E.; Reuschlé, T. A pore crack model for the mechanical behaviour of porous granular rocks in the brittle deformation regime. Int. J. Rock Mech. Min. Sci. 2004, 41, 975–986. [Google Scholar] [CrossRef]
  21. Tembe, S.; Baud, P.; Wong, T. Stress conditions for the propagation of discrete compaction bands in porous sandstone. J. Geophys. Res. 2008, 113, B09409. [Google Scholar] [CrossRef]
  22. Rutter, E.H.; Glover, C.T. The deformation of porous sandstones; are Byerlee friction and the critical state line equivalent? J. Struct. Geol. 2012, 44, 129–140. [Google Scholar] [CrossRef]
  23. Philit, S. Elaboration of a Structural, Petrophysical and Mechanical Model of Faults in Porous Sandstones; Implication for Migration and Fluid Entrapment. Ph.D. Thesis, Université de Montpellier, Montpellier, France, 2017. [Google Scholar]
  24. Robert, R.; Robion, P.; Souloumiac, P.; David, C.; Saillet, E. Deformation bands, early markers of tectonic activity in front of a fold-and-thrust belt: Example from the Tremp-Graus basin, southern Pyrenees, Spain. J. Struct. Geol. 2018, 110, 65–85. [Google Scholar] [CrossRef]
  25. Heynekamp, M.R.; Goodwin, L.B.; Mozley, P.S.; Haneberg, W.C. Controls on fault-zone architecture in poorly lithified sediments, Rio Grande Rift, New Mexico: Implications for fault-zone permeability and fluid flow. In Faults and Subsurface Fluid Flow in the Shallow Crust; Haneberg, W.C., Mozley, P.S., Moore, J.C., Goodwin, L.B., Eds.; Washington DC American Geophysical Union Geophysical Monograph Series: Washington, DC, USA, 1999; pp. 27–49. [Google Scholar]
  26. Cashman, S.; Cashman, K. Cataclasis and deformation-band formation in unconsolidated marine terrace sand, Humboldt County, California. Geology 2000, 28, 111–114. [Google Scholar] [CrossRef]
  27. Bense, V.F.; Van den Berg, E.H.; Van Balen, R.T. Deformation mechanisms and hydraulic properties of fault zones in unconsolidated sediments; the Roer Valley Rift System, The Netherlands. Hydrogeol. J. 2003, 11, 319–332. [Google Scholar] [CrossRef]
  28. Rawling, G.C.; Goodwin, L.B. Cataclasis and particulate flow in faulted, poorly lithified sediments. J. Struct. Geol. 2003, 25, 317–331. [Google Scholar] [CrossRef]
  29. Balsamo, F.; Storti, F. Grain size and permeability evolution of soft-sediment extensional sub-seismic and seismic fault zones in high-porosity sediments from the Crotone basin, southern Apennines, Italy. Mar. Pet. Geol. 2010, 27, 822–837. [Google Scholar] [CrossRef]
  30. Beke, B.; Fodor, L.; Millar, L.; Petrik, A. Deformation band formation as a function of progressive burial: Depth calibration and mechanism change in the Pannonian Basin (Hungary). Mar. Pet. Geol. 2019, 105, 1–16. [Google Scholar] [CrossRef]
  31. Puigdefàbregas, C.; Souquet, P. Tecto-sedimentary cycles and depositional sequences of the Mesozoic and Tertiary from the Pyrenees. Tectonophysics 1986, 129, 173–203. [Google Scholar] [CrossRef]
  32. Berastegui, X.; Garcia-Senz, J.M.; Losantos, M. Tecto-sedimentary evolution of the Organya extensional basin (central south Pyrenean unit, Spain) during the Lower Cretaceous. Bull. Soc. Géol. Fr. 1990, 6, 251–264. [Google Scholar] [CrossRef]
  33. Puigdefàbregas, C.; Muñoz, J.A.; Vergés, J. Thrusting and foreland basin evolution in the Southern Pyrenees. In Thrust Tectonics; Springer: Dordrecht, The Netherlands, 1992; pp. 247–254. [Google Scholar]
  34. Bond, R.M.G.; McClay, K.R. Inversion of a Lower Cretaceous extensional basin, south central Pyrenees, Spain. Geol. Soc. Lond. Spec. Publ. 1995, 88, 415–431. [Google Scholar] [CrossRef]
  35. Garcia-Senz, J.M. Cuencas Extensivas del Cretácico Inferior en Los Pirineos Centrales, Formación y Subsecuente Inversión; Universitat de Barcelona: Barcelona, Spain, 2002. [Google Scholar]
  36. Muñoz, J.A. Evolution of a continental collision belt: ECORS-Pyrenees crustal balanced cross-section. In Thrust Tectonics; Springer: Dordrecht, The Netherlands, 1992; pp. 235–246. [Google Scholar]
  37. Deramond, J.; Souquet, P.; Fondecave-Wallez, M.-J.; Specht, M. Relationships between thrust tectonics and sequence stratigraphy surfaces in foredeeps: Model and examples from the Pyrenees (Cretaceous-Eocene, France, Spain). Geol. Soc. Lond. Spec. Publ. 1993, 71, 193–219. [Google Scholar] [CrossRef]
  38. Vergés, J. Studi Geològic del Vessant Sud del Pirineu Oriental i Central. Evolució Cinemàtica en 3D. Ph.D. Thesis, Universitet de Barcelona, Barcelona, Spain, 1993. [Google Scholar]
  39. Vergés, J.; Fernàndez, M.; Martìnez, A. The Pyrenean orogen: Pre-, syn-, and post-collisional evolution. J. Virtual Explor. 2002, 8, 55–74. [Google Scholar]
  40. Shackleton, J.R.; Cooke, M.L.; Vergés, J.; Simó, T. Temporal constraints on fracturing associated with fault-related folding at Sant Corneli anticline, Spanish Pyrenees. J. Struct. Geol. 2011, 33, 5–19. [Google Scholar] [CrossRef]
  41. Erickson, G.S.; Jamison, W.R. Viscous-plastic finite-element models of fault-bend folds. J. Struct. Geol. 1995, 17, 561–573. [Google Scholar] [CrossRef]
  42. Erickson, S.G.; Strayer, L.M.; Suppe, J. Initiation and reactivation of faults during movement over a thrust-fault ramp: Numerical mechanical models. J. Struct. Geol. 2001, 23, 11–23. [Google Scholar] [CrossRef]
  43. Cooke, M.L.; Mollema, P.N.; Pollard, D.D.; Aydin, A. Interlayer slip and joint localization in the East Kaibab Monocline, Utah: Field evidence and results from numerical modelling. Geol. Soc. Lond. Spec. Publ. 1999, 169, 23–49. [Google Scholar] [CrossRef]
  44. Guiton, M.L.E.; Sassi, W.; Leroy, Y.M.; Gauthier, B.D.M. Mechanical constraints on the chronology of fracture activation in folded Devonian sandstone of the western Moroccan Anti-Atlas. J. Struct. Geol. 2003, 25, 1317–1330. [Google Scholar] [CrossRef] [Green Version]
  45. Casey, M.; Butler, R.W. Modelling approaches to understanding fold development: Implications for hydrocarbon reservoirs. Mar. Pet. Geol. 2004, 21, 933–946. [Google Scholar] [CrossRef]
  46. Reber, J.E.; Schmalholz, S.M.; Burg, J.-P. Stress orientation and fracturing during three-dimensional buckling: Numerical simulation and application to chocolate-tablet structures in folded turbidites, SW Portugal. Tectonophysics 2010, 493, 187–195. [Google Scholar] [CrossRef]
  47. Frehner, M. The neutral lines in buckle folds. J. Struct. Geol. 2011, 33, 1501–1508. [Google Scholar] [CrossRef]
  48. Sassi, W.; Guiton, M.L.E.; Leroy, Y.M.; Daniel, J.M.; Callot, J.P. Constraints on bed scale fracture chronology with a FEM mechanical model of folding: The case of Split Mountain (Utah, USA). Tectonophysics 2012, 576–577, 197–215. [Google Scholar] [CrossRef]
  49. Liu, X.; Eckert, A.; Connolly, P. Stress evolution during 3D single-layer visco-elastic buckle folding: Implications for the initiation of fractures. Tectonophysics 2016, 679, 140–155. [Google Scholar] [CrossRef]
  50. Peace, A.L.; Dempsey, E.; Schiffer, C.; Welford, J.; McCaffrey, K.J.W.; Imber, J.; Phethean, J.J.J. Evidence for basement reactivation during the Province, Labrador, Canada: Insights from field data. Geosciences 2018, 8, 308. [Google Scholar] [CrossRef]
  51. Sanz, P.F.; Pollard, D.D.; Allwardt, P.F.; Borja, R.I. Mechanical models of fracture reactivation and slip on bedding surfaces during folding of the asymmetric anticline at Sheep Mountain, Wyoming. J. Struct. Geol. 2008, 30, 1177–1191. [Google Scholar] [CrossRef]
  52. Albertz, M.; Lingrey, S. Critical state finite element models of contractional fault-related folding: Part 1. Structural analysis. Tectonophysics 2012, 576–577, 133–149. [Google Scholar] [CrossRef]
  53. Smart, K.J.; Ferrill, D.A.; Morris, A.P.; McGinnis, R.N. Geomechanical modeling of stress and strain evolution during contractional fault-related folding. Tectonophysics 2012, 576, 171–196. [Google Scholar] [CrossRef]
  54. Albertz, M.; Sanz, P.F. Critical state finite element models of contractional fault-related folding: Part 2. Mechanical analysis. Tectonophysics 2012, 576, 150–170. [Google Scholar] [CrossRef]
  55. Maillot, B.; Leroy, Y.M. Kink-fold onset and development based on the maximum strength theorem. J. Mech. Phys. Solids 2006, 54, 2030–2059. [Google Scholar] [CrossRef]
  56. Cubas, N.; Leroy, Y.M.; Maillot, B. Prediction of thrusting sequences in accretionary wedges. J. Geophys. Res. 2008, 113, B12412. [Google Scholar] [CrossRef]
  57. Souloumiac, P.; Leroy, Y.M.; Maillot, B.; Krabbenhøft, K. Predicting stress distributions in fold-and-thrust belts and accretionary wedges by optimization. J. Geophys. Res. 2009, 114, B09404. [Google Scholar] [CrossRef]
  58. Mary, B. Au delà du Prisme Critique de Coulomb par L’analyse Séquentielle et Contributions Expérimentales. Ph.D. Thesis, Université de Cergy-Pontoise, Cergy, France, 2012. [Google Scholar]
  59. Pons, A. Surpressions de Fuide et Stabilité des Prismes D’accrétion: Théorie et Validation Numérique et Expérimentale. Ph.D. Thesis, Université Paris Diderot, Paris, France, 2012. [Google Scholar]
  60. Caër, T. Interprétation Structurale et Équilibre Mécanique: Le Calcul à la Rupture Appliqué aux Chaînes D’avant-Pays. Ph.D. Thesis, Université de Cergy-Pontoise, Cergu, France, 2016. [Google Scholar]
  61. Yuan, X.P. Extensional Collapses in the Overpressured Frictional Upper Crust Based on Limit Analysis. Ph.D. Thesis, PSL Research University, Paris, France, 2016. [Google Scholar]
  62. Salençon, J. De L’élasto-Plasticité au Calcul à la Rupture; Editions Ecole Polytechnique: Paris, France, 2002. [Google Scholar]
  63. Souloumiac, P.; Krabbenhøft, K.; Leroy, Y.M.; Maillot, B. Failure in accretionary wedges with the maximum strength theorem: Numerical algorithm and 2D validation. Comput. Geosci. 2010, 14, 793–811. [Google Scholar] [CrossRef]
  64. Krabbenhøft, K.; Lyamin, A.V. Optum G2 (2014). Available online: https://optumce.com (accessed on 5 June 2019).
  65. Krabbenhøft, K.; Damkilde, L. A general non-linear optimization algorithm for lower bound limit analysis. Int. J. Numer. Methods Eng. 2003, 56, 165–184. [Google Scholar] [CrossRef]
  66. Krabbenhøft, K.; Lyamin, A.V.; Hjiaj, M.; Sloan, S.W. A new discontinuous upper bound limit analysis formulation. Int. J. Numer. Methods Eng. 2005, 63, 1069–1088. [Google Scholar] [CrossRef]
  67. Lyamin, A.V.; Sloan, S.W.; Krabbenhøft, K.; Hjiaj, M. Lower bound limit analysis with adaptive remeshing. Int. J. Numer. Methods Eng. 2005, 63, 1961–1974. [Google Scholar] [CrossRef]
  68. Suppe, B.J.; Medwedeff, D.A. Geometry and kinematics of fault-propagation folding. Eclogae Geol. Helv. 1990, 454, 409–454. [Google Scholar]
  69. Mencos, J.; Munoz, J.A.; Hardy, S. Three-Dimensional Geometry and Forward Numerical Modeling of the Sant Corneli Anticline (Southern Pyrenees, Spain). In Thrust Fault-Related Folding (AAPG Memoir); AAPG Special Publications: Tulsa, OK, USA, 2011; pp. 283–300. [Google Scholar]
  70. Mencos, J.; Carrera, N.; Muñoz, J.A. Influence of rift basin geometry on the subsequent postrift sedimentation and basin inversion: The Organyà Basin and the Bóixols thrust sheet (south central Pyrenees). Tectonics 2015, 34, 1452–1474. [Google Scholar] [CrossRef]
  71. Fillon, C.; Gautheron, C.; Van, P.; Beek, D. Oligocene-Miocene burial and exhumation of the Southern Pyrenean foreland quantified by low-temperature thermochronology. J. Geol. Soc. Lond. 2013, 107, 67–77. [Google Scholar] [CrossRef]
  72. Mollema, P.N.; Antonellini, M.A. Compaction bands: A structural analog for anti-mode I cracks in aeolian sandstone. Tectonophysics 1996, 267, 209–228. [Google Scholar] [CrossRef]
  73. Schultz, R.A. Scaling and paleodepth of compaction bands, Nevada and Utah. J. Geophys. Res. 2009, 114, B03407. [Google Scholar] [CrossRef]
  74. Fossen, H.; Schultz, R.A.; Torabi, A. Conditions and implications for compaction band formation in the Navajo Sandstone, Utah. J. Struct. Geol. 2011, 33, 1477–1490. [Google Scholar] [CrossRef]
  75. Fossen, H.; Zuluaga, L.F.; Ballas, G.; Soliva, R.; Rotevatn, A. Contractional deformation of porous sandstone: Insights from the Aztec Sandstone, SE Nevada, USA. J. Struct. Geol. 2015, 74, 172–184. [Google Scholar] [CrossRef] [Green Version]
  76. Baud, P.; Vinciguerra, S.; David, C.; Cavallo, A.; Walker, E.; Reuschlé, T. Compaction and failure in high porosity carbonates: Mechanical data and microstructural observations. Pure Appl. Geophys. 2009, 166, 869–898. [Google Scholar] [CrossRef]
  77. Nguyen, V.H.; Gland, N.; Dautriat, J.; David, C.; Wassermann, J.; Guélard, J. Compaction, permeability evolution and stress path effects in unconsolidated sand and weakly consolidated sandstone. Int. J. Rock Mech. Min. Sci. 2014, 67, 226–239. [Google Scholar] [CrossRef]
  78. Tondi, E.; Antonellini, M.; Aydin, A.; Marchegiani, L.; Cello, G. The role of deformation bands, stylolites and sheared stylolites in fault development in carbonate grainstones of Majella Mountain, Italy. J. Struct. Geol. 2006, 28, 376–391. [Google Scholar] [CrossRef]
  79. Tondi, E.; Cilona, A.; Agosta, F.; Aydin, A.; Rustichelli, A.; Renda, P.; Giunta, G. Growth processes, dimensional parameters and scaling relationships of two conjugate sets of compactive shear bands in porous carbonate grainstones, Favignana Island, Italy. J. Struct. Geol. 2012, 37, 53–64. [Google Scholar] [CrossRef]
  80. Rustichelli, A.; Tondi, E.; Agosta, F.; Cilona, A.; Giorgioni, M. Development and distribution of bed-parallel compaction bands and pressure solution seams in carbonates (Bolognano Formation, Majella Mountain, Italy). J. Struct. Geol. 2012, 37, 181–199. [Google Scholar] [CrossRef]
  81. Cilona, A.; Baud, P.; Tondi, E.; Vinciguerra, S.; Rustichelli, A.; Spiers, C.J. Deformation bands in porous carbonate grainstones: Field and laboratory observations. J. Struct. Geol. 2012, 45, 137–157. [Google Scholar] [CrossRef] [Green Version]
  82. Cilona, A.; Faulkner, D.R.; Tondi, E.; Agosta, F.; Mancini, L.; Rustichelli, A.; Baud, P.; Vinciguerra, S. The effects of rock heterogeneity on compaction localization in porous carbonates. J. Struct. Geol. 2014, 67, 75–93. [Google Scholar] [CrossRef]
  83. Rotevatn, A.; Thorsheim, E.; Bastesen, E.; Fossmark, H.S.S.; Torabi, A.; Sælen, G. Sequential growth of deformation bands in carbonate grainstones in the hangingwall of an active growth fault: Implications for deformation mechanisms in different tectonic regimes. J. Struct. Geol. 2016, 90, 27–47. [Google Scholar] [CrossRef] [Green Version]
  84. Tavani, S.; Granado, P.; Balsamo, F.; Pizzati, M.; Cantarero, I.; Corradetti, A.; Muñoz, J.A. Shear-enhanced compaction-solution bands in quartz-rich calcarenites of the Cotiella Massif (Spanish Pyrenees). J. Struct. Geol. 2017, 114, 274–279. [Google Scholar] [CrossRef]
Figure 1. (A) Q-P plot with definition of the stress path (adapted from Figure 17 in [24]; Burial in dark blue and extensive regime in light blue, followed by the compressive regime in red). The stress path crosscut the envelopes, leading to the deformation bands’ set up. The type of band depends on the crosscut area; Shear Enhanced Compaction Bands (SECBs) will form in Q/P ratios between 0.7 and 1.2 (grey area); Pure Compaction Bands (PCBs) are set up between 0.7 > Q/P > 0.35 (red area); finally, for lower values of Q/P ratios (below 0.35), no localized structures will form as the deformation is homogeneous. (B) Examples of band structures potentially set up depending on the Q/P ratios, where α represents the angle between the maximum principal stress and the band orientation.
Geosciences 09 00257 g001
Figure 2. Schematic base model geometry at an intermediary stage. Hi: initial pre tectonic thickness; Lpsi: length of the fold top; Li: horizontal length at the base of the fold; A: amplitude of the front limb of the fold; hr: height of the fault tip; α: angle of the thrust; β: angle of the fold front limb; S: shortening; e: thickness of the syn-tectonic layer; φB: internal friction of the bulk material; φd: internal friction of the decollement (d, green line); φS: internal friction of the syn-tectonic material. Green symbols correspond to the movements allowed at the border of the section.
Geosciences 09 00257 g002
Figure 3. Schematic representation of the fold evolution geometry for each step and localization of the different key points used for the local stress estimations represented by the markers.
Geosciences 09 00257 g003
Figure 4. Q/P ratio estimated by the Limit Analysis Method (LAM) model for each step. White color is for a Q/P ratio lower than 0.35; red is for a Q/P ratio between 0.35 and 0.7; black is for ratios higher than 0.7. Shadow markers show the point measurements (Point I is not shown in this figure).
Geosciences 09 00257 g004
Figure 5. Stress path evolution for the different key points (See Figure 3 for point positions) in a Q-P plot from the numerical results. (A) Point I; (B) Point II; (C) Point III; (D) Point IV; (E) Point V; (F) Point VI. Stage numbers are indicated next to the points. Three yield envelopes are represented. “Env 1” represents the empirical value of the calcarenite formation with P* = 116 MPa (see text for details); “Env 2” corresponds to the Boise II sandstone with P* = 42 MPa [14]; and “Env 3” corresponds to the theoretical envelope of the calcarenite proposed by Robert et al. [24], with P* = 30 MPa.
Geosciences 09 00257 g005
Figure 6. Deformation band distribution with the numerical stress results in comparison to the yield cap of the theoretical Aren calcarenite (P* = 30 MPa) for the steps 2, 6, 10, 12, and 14. Pure Compaction Bands (PCBs) are represented in red and Shear Enhanced Compaction Bands (SECBs) are represented in grey. The blue part on the top of the fold represents the extensional domain (maximum stress is sub-vertical). In the background, light red and grey colors represent the Q/P ratio obtained in Figure 4.
Geosciences 09 00257 g006
Figure 7. Diagram of critical effective pressure (P*) vs. the product of porosity and the grain radius. Results of geomechanical experiments and slope trend are plotted for siliciclastic materials [13,14], porous carbonate rocks [76], and an Otter Sherwood Sandstone (OSS, [77]). Theoretical results for the Aren calcarenite of Aren and Orcau sites are also plotted, see text for calculus details.
Geosciences 09 00257 g007
Table 1. Parameter table for each step of the fold evolution (See parameter details in Figure 2’s caption).
Exp.Hi (km)Lpsi (km)Li (km)A (km)hr (km)α (°)β (°)S (km)e (m)φB (°)φd (°)φs (°)
Step 120000000030430
Step 223.13.20.10.1523750.17030430
Step 322.73.30.250.2523750.312530430
Step 422.63.60.50.4523750.625030430
Step 522.43.70.60.5523750.932530430
Step 622.13.90.90.7523751.245030430
Step 721.94.110.8523751.450030430
Step 821.84.31.21.0523751.854030430
Step 921.64.41.41.1523752.170030430
Step 1021.34.51.51.3523752.375030430
Step 1121.154.81.71.523752.685030430
Step 1221521.723752.8100030430
Step 1320.55.12.21.923803108030430
Step 14205.22.3223853.1113030430

