Suitability Analysis for the Emergency Shelters Allocation after an Earthquake in Japan


Graduate School of Informatics of Engineering, University of Electro-Communications, Chofu, Tokyo 182-8585, Japan
*
Author to whom correspondence should be addressed.
Geosciences 2019, 9(8), 336; https://doi.org/10.3390/geosciences9080336
Submission received: 12 June 2019
/
Revised: 19 July 2019
/
Accepted: 24 July 2019
/
Published: 30 July 2019
(This article belongs to the Special Issue New Perspectives in the Definition/Evaluation of Seismic Hazard through Analysis of the Environmental Effects Induced by Earthquakes)
Abstract
:Japan is exposed to several natural phenomena; the damages caused by earthquakes were enormous in particular. An emergency shelter is a place for people to temporarily live when they cannot remain in their previous homes, and it is necessary for each community to, respectively, allocate such facilities in Japan. There are the districts that are short of such facilities, especially in rural and suburban areas, because emergency shelters mainly concentrate near large-scale stations and city centres in Japan. Against these backdrops, using geographic information systems (GIS), an applied statistical method and public open data related to population and emergency shelters, the present research aims to quantitatively conduct a suitability analysis for the emergency shelters allocation after an earthquake in Japan. Based on the results, the present research grasps the districts that are short of emergency shelters, and visually shows the places where such facilities should be newly established on the digital map of GIS. Additionally, the assessment method is reproducible in the spatial and temporal dimension. It is necessary to create an original data related to emergency shelters to raise the reliability of the results, as the present research has the limitation of data availability.
1. Introduction
In Japan, various disasters have been frequently occurred, and the damages especially caused by earthquakes were enormous. According to Yamaga (2019) [1], the earthquake catalog search conducted by the United States (U.S.) Geological Survey (USGS), 14.8% of the earthquakes larger than magnitude 5.0, which occurred worldwide from 2010 to 2015 concentrated in Japan. Therefore, it can be said that Japan is one of the few earthquake-ridden countries.
Meanwhile, due to the serious damages that are caused by disasters, victims who cannot remain in their homes stay in emergency shelters until they can settle in new places. The maximum distance elderly people and children can evacuate on foot is called as the maximum evacuation distance, and it is estimated to be around 1.5 to 2.0 km (Dictionary of Housing Terms, 2019) [2]. However, the distance that elderly people over 70 years old can walk is 879 m, which is significantly shorter when compared with those of the other age groups (Cabinet Office, 2019) [3]. The physical abilities of elderly people over 70 years old drastically decrease, which makes long-distance evacuations extremely difficult. Additionally, in Japan, as emergency shelters mainly concentrate near large-scale stations and city centres, there are districts that are short of such facilities, especially in rural and suburban areas. Additionally, focusing on the communities, Civiletti et al. (2016) [4] identified the institutional and social decisions that increase the resilience of the communities that are exposed at risk, by analyzing observations during seismic sequences that occurred in Italy in the last decades, and Cerchiello et al. (2018) [5] addressed the assessment of the social vulnerability and resilience level of the city of Nablus, Palestine. Mojica et al. (2010) [6] and Awaotona (2012) [7] pointed out that it is necessary to take the countermeasures against disasters while considering vulnerable people (elderly and disabled people). However, in Japan, due to the Basic Act on Disaster Control Measures, it is possible to already take the measures for disabled people requiring assistance at the time of disasters in each municipality (Cabinet Office, 2013) [8]. Additionally, in Japan, the aging rate of elderly population who are over 65 years old is 26.7% in 2015, which is the highest in the world. For reference, the above rates are 22.4% in Italy, 21.2% in German, 19.9% in Sweden, and 19.1% in France (Ministry of Health, Labour and Welfare, 2016) [9]. Therefore, when considering the regional characteristics, such as the ratio of elderly people and population distribution, it is necessary to evaluate not only facility location, but also capacity, this is because elderly people have special needs. Additionally, it is also necessary to grasp the districts (made up of streets and towns, and the minimum level of Japanese communities), with a lack of emergency shelters.
Based on the social and academic background mentioned above, using Geographic Information Systems (GIS), which is an applied statistical method and public open data related to population and emergency shelters, and while considering regional characteristics, such as the ratio of elderly people and population distribution, the present research aims to conduct a suitability analysis for the emergency shelters allocation after an earthquake on a district scale in Japan. In the present research, the analysis will be conducted to examine whether emergency shelters are sufficient or not in the unit of districts, and where such facilities should be newly established. Additionally, referring the results of the preceding research studies both within and outside Japan introduced in the next section, the present research will develop a method for the suitability analysis for the emergency shelters allocation. Based on the results, the present research provides effective information that can be referred to determine the locations to establish new emergency shelters.
2. Literature Review
As mentioned in the previous section, Japan is exposed to several natural phenomena, and there is an accumulation of many research studies in the field related to emergency shelters. The present literature review is related to (1) research studies that are related to the suitability analysis of emergency shelters location, and (2) research studies related to the establishment of new emergency shelters. The following will introduce the major preceding research studies in the above two study areas, and discuss the originality of the present research in comparison with the others.
Regarding the representative research studies that are related to the suitability analysis of emergency shelters location, especially in Japan, Furihata et al. (1994) [10] evaluated the location of evacuation facilities taking the spatial patterns of distributed users into consideration and using GIS. Takeuchi et al. (2002) [11] proposed a shared area in the taking emergency shelter to have considered the approaching direction of the tsunami that is generated by a huge earthquake. Kongsomsaksakul et al. (2005) [12] proposed the optimal locations of emergency shelters for the flood evacuation planning, while using the combined distribution and assignment (CDA) model and genetic algorism (GA) in the U.S. Asou et al. (2007) [13] clarified evacuation behavior while using GA to propose the optimal arrangements of emergency shelters. Wei et al. (2008) [14] presented a diagnosis model for emergency shelter planning from the viewpoint of local people using GIS. Ng et al. (2010) [15] presented a hybrid bi-level model for the optimal shelter assignment in emergency evacuations in the U.S. Tai et al. (2010) [16] used six indicators to evaluate shelter and applied a spatial statistic model with local indicators of spatial association (LISA) to the evacuation choice of residents in the case of an earthquake in Taiwan. Kitajima (2013) [17] evaluated the location of emergency shelters using network analysis. Yu et al. (2016) [18] introduced a framework for the multi-criteria satisfaction assessment of the spatial distribution of urban emergency shelters while using a GIS-based analytic hierarchy process approach in Shanghai City, China. Vecere et al. (2016, 2017) [19,20] focused on a critical review of currently available methodologies and corresponding software packages that were specifically developed for estimating the number of displaced people and those who need public sheltering and temporary housing at the time of the 2011 Christchurch earthquake in New Zealand. Ashish et al. (2017) [21] presented a hybrid algorithm for efficiently managing location and relocation projects, by proposing a hybrid multi-objective decision model that is based on analytic hierarchy process (AHP), fuzzy set theory, and goal programming approach, referring two real case studies of Nepal earthquake. Xu et al. (2018) [22] developed a multi-objective mathematical model with four groups of the objectives, allied with a modified particle swarm optimization algorithm to solve the location-allocation problem for earthquake shelter in Beijing City, China. Nozaki et al. (2019) [23] conducted the location analysis of tsunami emergency shelter while considering inhabitants’ preparedness for the coming Nankai Trough Earthquake.
Regarding the representative research studies that were related to the establishment of new emergency shelters, especially in Japan, Yamada et al. (2004) [24] proposed the planning support system for the locations of emergency shelters from the viewpoint of residents. Notsuda et al. (2005) [25] considered the optimum location of new emergency shelters and the placement of evacuees to each facility that is based on the location and capacity of existing emergency shelters, as well as the population distribution of evacuees. Nakai et al. (2012) [26] and Ikenaga et al. (2017) [27] considered the possibility of using vacant houses as emergency shelters and temporary evacuation shelters in the time of accidents. Asano et al. (2013) [28] and Miyoshi et al. (2017) [29] considered the possibility of using public and private lands as emergency shelters and safety evacuation areas. Araki et al. (2017) [30] examined setting up the patterns of non-designated emergency shelters at the time of the Great East Japan Earthquake (2011), which were based on GIS analysis and interview surveys. Sasaki et al. (2018) [31] examined the possibility of approximately 70,000 temples nationwide, complementing emergency shelters and safety evacuation areas that are expected to be in shortage when many disaster-affected residents appear during widespread disasters. Umeki et al. (2019) [32] proposed a method to determine the location of emergency shelters to aim at the reduction of the evacuation time of all victims.
In other countries, Kar et al. (2008) [33] developed a GIS-based model to determine the site suitability of emergency shelters for hurricane events, and proposed the candidate places to arrange new ones in the U.S. Alçada-Almeida et al. (2009) [34] incorporated multi-objective model into a GIS-based decision support system to locate emergency shelters during major fires in Portugal. Park et al. (2012) [35] developed a method that applied genetic optimization to determine optimal tsunami shelter locations with the goal of reducing evacuation time, thereby maximizing the probability of survival for the population in a coastal community in the U.S. Li et al. (2012) [36] developed a scenario-based bi-level programming model to optimize the selection of shelter locations, with explicit consideration of a range of possible hurricane events and the evacuation needs under each of those events in the U.S. Anhorn et al. (2015) [37] proposed a methodology to rank the suitability of open spaces for contingency planning and the placement of emergency shelter while using GIS in the immediate aftermath of a disaster in Turkey. Bayram et al. (2018) [38] proposed a scenario-based two-stage stochastic evacuation planning model that optimally locates shelter sites and assigns evacuees to nearest shelters and to shortest paths within a tolerance degree to minimize the expected total evacuation time in Turkey. Xu et al. (2016) [39] proposed a multi-criteria constraint location model to select and analyze the candidate for emergency shelters, and to determine the location of new ones while using GIS in China.
From the above, especially in Japan, research studies that are related to the suitability analysis of emergency shelters location increased after the Great Hanshin earthquake (1995), and research studies that are related to the establishment of new emergency shelters remarkably increased after the Great East Japan Earthquake. Because, at the time of the Great East Earthquake, large earthquake, tsunami, and an accident at the nuclear power station occurred at the almost same time, and it was essential to keep sufficient emergency shelters for many victims.
The present research will reveal its effectiveness by newly proposing the use of facilities, such as temporary evacuation shelters in the time of accidents, safety evacuation areas, and large-scale retail stores that are not set up to be emergency shelters as new ones, unlike the preceding research studies that were related to the establishment of new emergency shelters, as discussed in detail in Section 3. Additionally, though the preceding research studies that are related to the suitability analysis of emergency shelters location derived the optimum locations for emergency shelters, the present research will demonstrate the originality by conducting a quantitative assessment of current location of emergency shelters, and proposing an assessment method to consider regional characteristics, such as the ratio of elderly population and population distribution. Therefore, it is possible to conduct a suitability analysis for the emergency shelters allocation that appropriately reflect current conditions of each district, and decide on the location of new emergency shelters by suggesting specific sites on a small spatial scale as the unit of districts while using GIS.
3. Methods
From the results of the research studies that were related to the suitability analysis of emergency shelters location in the previous section, for the suitability analysis for the emergency shelters allocation, it is necessary to consider regional characteristics, such as location and capacity of existing emergency shelters, as well as the population distribution of evacuees. It is evident that GIS-based analysis, spatial data analysis, and an applied statistical method are effective for the above purpose. Additionally, from the results of the research studies related to the establishment of new emergency shelters in Japan, it is necessary to set new candidate facilities in both public and private lands, especially in the districts that are short of emergency shelters. On the other hand, from the results of the above research studies in other countries, it is evident that GIS-based methods are effective in conducting a suitability analysis for the emergency shelters allocation. Referring these results, in this section, the method of the present study will be proposed.
3.1. Framework and Process of Analysis
GIS will be used for the method of suitability analysis for the emergency shelter allocation after an earthquake. The framework and process of analysis in the present research are as shown below.
(1) Calculation of weighted coefficients and creation of the distribution map of emergency shelters in each district
The weighted coefficient for each district will be calculated. A distribution map for all the emergency shelters will be created in the form of the digital map of GIS. Additionally, the facility scale (area) will be added to the data of each emergency shelter.
(2) Calculation of the linear distance between each district and each emergency shelter
The linear distance between the center of each district and each emergency shelter will be calculated while using the distribution map of emergency shelters in (1).
(3) Suitability analysis for the emergency shelters allocation using weighted coefficients
Using the weighted coefficients and distribution maps of emergency shelters in (1) as well as the linear distance between each district and each emergency shelter in (2), the assessment value for each district will be calculated. In the present research, analysis will be separately conducted using the four types of weighted coefficients related to the regional characteristics that are described in detail in the next section. When determining the locations to establish new emergency shelters, the important regional characteristics might vary with areas. Based on the results, the present research provides the effective information to assist the policy and decision makers in planning new emergency shelters.
3.2. Assessment Method
3.2.1. Calculation of Weighted Coefficients and Creation of the Distribution Map of Emergency Shelters in Each District
(1) Distribution map of different types of weighted coefficients for each district
In the present research, the degree of importance is indicated by the weighted coefficient and an assessment method will be proposed. There are four types of weighted coefficients, including (a) the specialization coefficient of elderly population, (b) the ratio of permanent population, (c) the ratio of elderly population, and (d) the specialization coefficient of population density, indicating various regional characteristics. Regarding (a) (d), the specialization coefficients are the values that reveals which area has the highest against the average rates of elderly population and population density in the city.
Regarding (a), Saino (1992) [40] set a “specialization coefficient of elderly people” which divided the rate of people who are over 65 years old in each district by the same rate in the entire area. However, the health span in Japan for 2016 was 72.14 for men and 74.79 for woman and both greatly exceed the age of 70, and it is increasing every year (the 11th Japan 21 (secondary) Health Promotion Committee, 2018) [41]. Therefore, the present research sets the specialization coefficient of elderly population who are over 75 years old, instead of those who are 65 years old as the target. The specialization coefficient of elderly population is a value that reveals which area has the highest aging rate of elderly population in the city. The aging rate of elderly population can be calculated with Equation (1). Additionally, the specialization coefficient of elderly population can be calculated while adopting this in Equation (2).
- : Aging rate of elderly population in district i
- : Elderly population in district i (persons)
- : Population of district i (persons)
- : Specialization coefficient of elderly population in district i
- : Aging rate of elderly population in district i (%)
- A: Aging rate of elderly population in the City (%)
Regarding (b), the ratio of permanent population for each district is important, as there is a greater need for emergency shelters in districts with a higher population. Equation (3) is adopted to calculate the ratio of permanent population.
- : Ratio of permanent population in district i
- : Population of district i (persons)
- p: Population of the City (persons)
Regarding (c), the population distribution of elderly group is not reflected in this weighted coefficients, as (a) the specialization coefficient of elderly population only indicates which district has the highest aging rate of elderly population. Therefore, it is weighted with the ratio of elderly population in order for the weighting to reflect the population distribution of elderly group. The ratio of elderly population can be calculated with Equation (4).
- : Ratio of elderly population in district i
- : Elderly population in district i (persons)
- : Elderly population in the City (persons)
Regarding (d), districts that are larger than others and are around large-scale stations and city centres generally have larger populations. Therefore, it is important to take the population density into consideration, as it is necessary to prioritize the establishment of new emergency shelters in districts that are short of such facilities due to the high population density. Thus, new emergency shelters can be established and victims can stay in such facilities near their homes even in the districts with high population density. The specialization coefficient of population density is a value that reveals which area has the highest aging rate of population density in the city. Population density can be calculated with Equation (5), and adopting this in Equation (6), the specialization coefficient of population density can be calculated.
- : Population density in district i (
- : Population of district i (persons)
- : Area of district i ()
- : Specialization coefficient of population density in district i
- : Population density in district i (
- F: Population density in the City (
(2) Creating distribution maps of emergency shelters
The distribution of emergency shelters will be displayed on the digital map of GIS. In the present research, the facilities, such as temporary evacuation shelters in the time of accidents and safety evacuation areas, are newly added to emergency shelters. These facilities were actually utilized as emergency shelters after the occurrence of disasters in the past. However, it is necessary to assume that an emergency shelter should be established as a temporary house in safety evacuation areas that are located outdoors. Based on Shigenobu et al. (2013) [42], the total size (area) of temporary houses can be calculated by multiplying the size of safety evacuation areas by the area ratio that is available for temporary houses. As there are multiple types of safety evacuation areas, the area ratio according to each type is set, as shown in Table 1. According to the Basic Act on Disaster Control Measures in Japan, it is possible to establish temporary houses in safety evacuation areas, such as open spaces and urban greens spaces that are shown in Table 1. Additionally, temporary houses were actually established in the above safety evacuation areas after the occurrence of disasters in the past. Additionally, after the Great East Japan Earthquake, over 2,000 people evacuated and stayed at large-scale retail stores in Ishinomaki City of Miyagi Prefecture. Therefore, since such large-scale retail stores are extremely wide and have a high capacity, they are also added as new emergency shelters.
3.2.2. Calculation of the Linear Distance between Each District and Each Emergency Shelter
In the present research, the linear distance between each district and each emergency shelter, and the scale of each emergency shelter will be used when conducting analyses. Regarding the former, the evacuations can be quickly completed in areas that are close to emergency shelters. Additionally, regarding the latter, the larger an emergency shelter is, the more people it can contain. In order to calculate the former, one of the ArcGIS Pro analysis tools, called the “Generate Near Table”, is used. Using this tool, on the digital map of GIS, a proximity feature (emergency shelter) that is within 879 m from one or more features (center of each district) is selected, and n value is obtained. For each district, the n value will be the average of the number of emergency shelters within 879 m, which is the average walking distance for those in their 70’s. Subsequently, using this tool again, the maximum number of features (n value) is set for each district, and the linear distance between each district and each emergency shelter is calculated.
3.2.3. Suitability Analysis for the Emergency Shelters Allocation
The present research develops an assessment method that is based on the p-median problem. The p-median problem, which is one of the facility location problems, places facilities by minimizing the total sum of the linear distance from users to their nearest facility, and it can be modeled, as shown in Equation (7). This model derives the optimum location that lessens the load for users in all districts as much as possible by changing Xij. Equation (7) is changed to Equation (8) in order to respond the purpose of the present research.
- : allocation to facility in district
- : Demand in district
- : Linear distance from district to facility
- : Assessment value of district i
- : Weighted coefficient of district i
- : Linear distance to the No. j closest emergency shelter from district i (m)
- : Facility scale of the No. j closest emergency shelter from district i
Specifically, of Equation (7) is removed in order to fix the locations of emergency shelters. Additionally, by calculating the assessment value for each district, it is possible to quantitatively grasp the emergency shelters allocation in each district. Additionally, as far as the originality of the present research, the average of the linear distance to the No. i closest emergency shelter in each district , divided by the square root of the facility scale of the emergency shelter , will be weighted with the coefficient , and this will be the assessment value for that district.
As shown in the previous section, the four types of weighted coefficients, the linear distance between each district and each emergency shelter, and the facility scale of emergency shelters will be applied to Equation (8), the assessment value of each district will be calculated, and the results will be displayed on the digital maps of GIS. When not using a weighted coefficient, analyses are conducted based on the linear distance between each district and each emergency shelter, and the scale of such facilities.
3.2.4. Application of Assessment Method
The following two types of comparisons will be conducted in the discussion section in order to verify the validity of the assessment method proposed in the present research (Section 6).
(1) Comparison of the results between multiple areas with different regional characteristics
In the present research, multiple areas with different regional characteristics will be selected as target areas, and the suitability of emergency shelters allocation will be analyzed. Therefore, it is possible to verify the validity of the assessment method by comparing results of the selected areas with and without the four types of weighted coefficients that are related to the regional characteristics.
(2) Comparison of the results with and without weighted coefficients
The assessment method in the present research will adopt the four types of weighted coefficients as introduced in Section 3.2.1. Therefore, it is also possible to verify the validity of assessment method by comparing results with and without the four types of weighted coefficients that are related to the regional characteristics, focusing on the increase and decrease of the assessment values for both cases.
4. Selection of Target Areas and the Data Processing
4.1. Selection of Target Areas
For the analysis in the present research, it is essential to obtain the public open data that are related to population and emergency shelters, which will be introduced in the next section. However, in present Japan, very few cities make public the data related to emergency shelters. Among the cities that make public the above public open data, the four target areas selected for the present research are Chofu and Fuchu Cities in Tokyo metropolis, Toda City in Saitama Prefecture, and Shobara City in Hiroshima Prefecture. Table 2 describes the outlines of target areas. As described below, there are differences concerning the four types of weighted coefficients that are related to the regional characteristics introduced in Section 3.2.1 and the distribution of emergency shelters among these four cities.
Specifically, while the aging rate of elderly population (population aged over 75 years old) in Shobara City is significantly high, the rates in Toda City re fairly lower than the national average (11.2%). Additionally, the total populations of these two cities are 35,575 and 139,616, respectively, which makes them medium and small-scale cities. On the other hand, Chofu and Fuchu Cities, which are residential areas in Tokyo Metropolis, are large-scale cities with a population of 230,303 and 260,116, respectively. However, the distribution conditions of emergency shelters in these two cities are extremely different. Specifically, though emergency shelters are evenly distributed in the entire Chofu City, they are mostly located in the central part of Fuchu City.
According to the “Ordinance Covering Measures for Stranded Persons” in Tokyo Metropolis (2013), in the time of accidents, it is necessary for the companies in central Tokyo to keep employees at the workplaces. Therefore, central Tokyo, which has a concentration of companies as well as an extremely high daytime population, is not considered to be a target area in the present research. Additionally, according to the Basic Act on Disaster Control Measures in Japan, it is preferable for victims to stay in emergency shelters near their homes at the time of earthquakes. In the case of earthquakes, aftershocks follow for a while and additional damages might be generated, and it is dangerous for victims to still stay in their homes, even in good maintenance conditions that were constructed according to the Building Standards Act in Japan. Additionally, if victims stay together in emergency shelters near their homes, it is appropriate for rescue parties and government administrators to accurately confirm their safety and efficiently deliver relief goods to them.
4.2. Data Processing
Table 3 shows the utilized data and sources, and the utilization method of data in the present research.
5. Results
The section will, respectively, describe the distinctive features of the result for each target area, referring Figure 1, Figure 2, Figure 3, Figure 4, Figure 5, Figure 6, Figure 7, Figure 8, Figure 9, Figure 10, Figure 11, Figure 12, Figure 13, Figure 14, Figure 15, Figure 16, Figure 17, Figure 18, Figure 19 and Figure 20. These figures show the results with and without the four types of weighted coefficients that are related to the regional characteristics described in Section 3.2.1. These results are based on the suitability analysis for the emergency shelters allocation in the unit of districts of each target area mentioned in Section 3.2.3. Referring to these figures, the comparison of the results with and without the four types of weighted coefficients will be easily conducted. Furthermore, in these figures, all of the values have no units. As clearly shown in Table 2, the area of Shobara City is tremendously larger than those of other three cities. Therefore, the scale of results for Shobara City is different from those for other three cities on the digital maps of GIS.
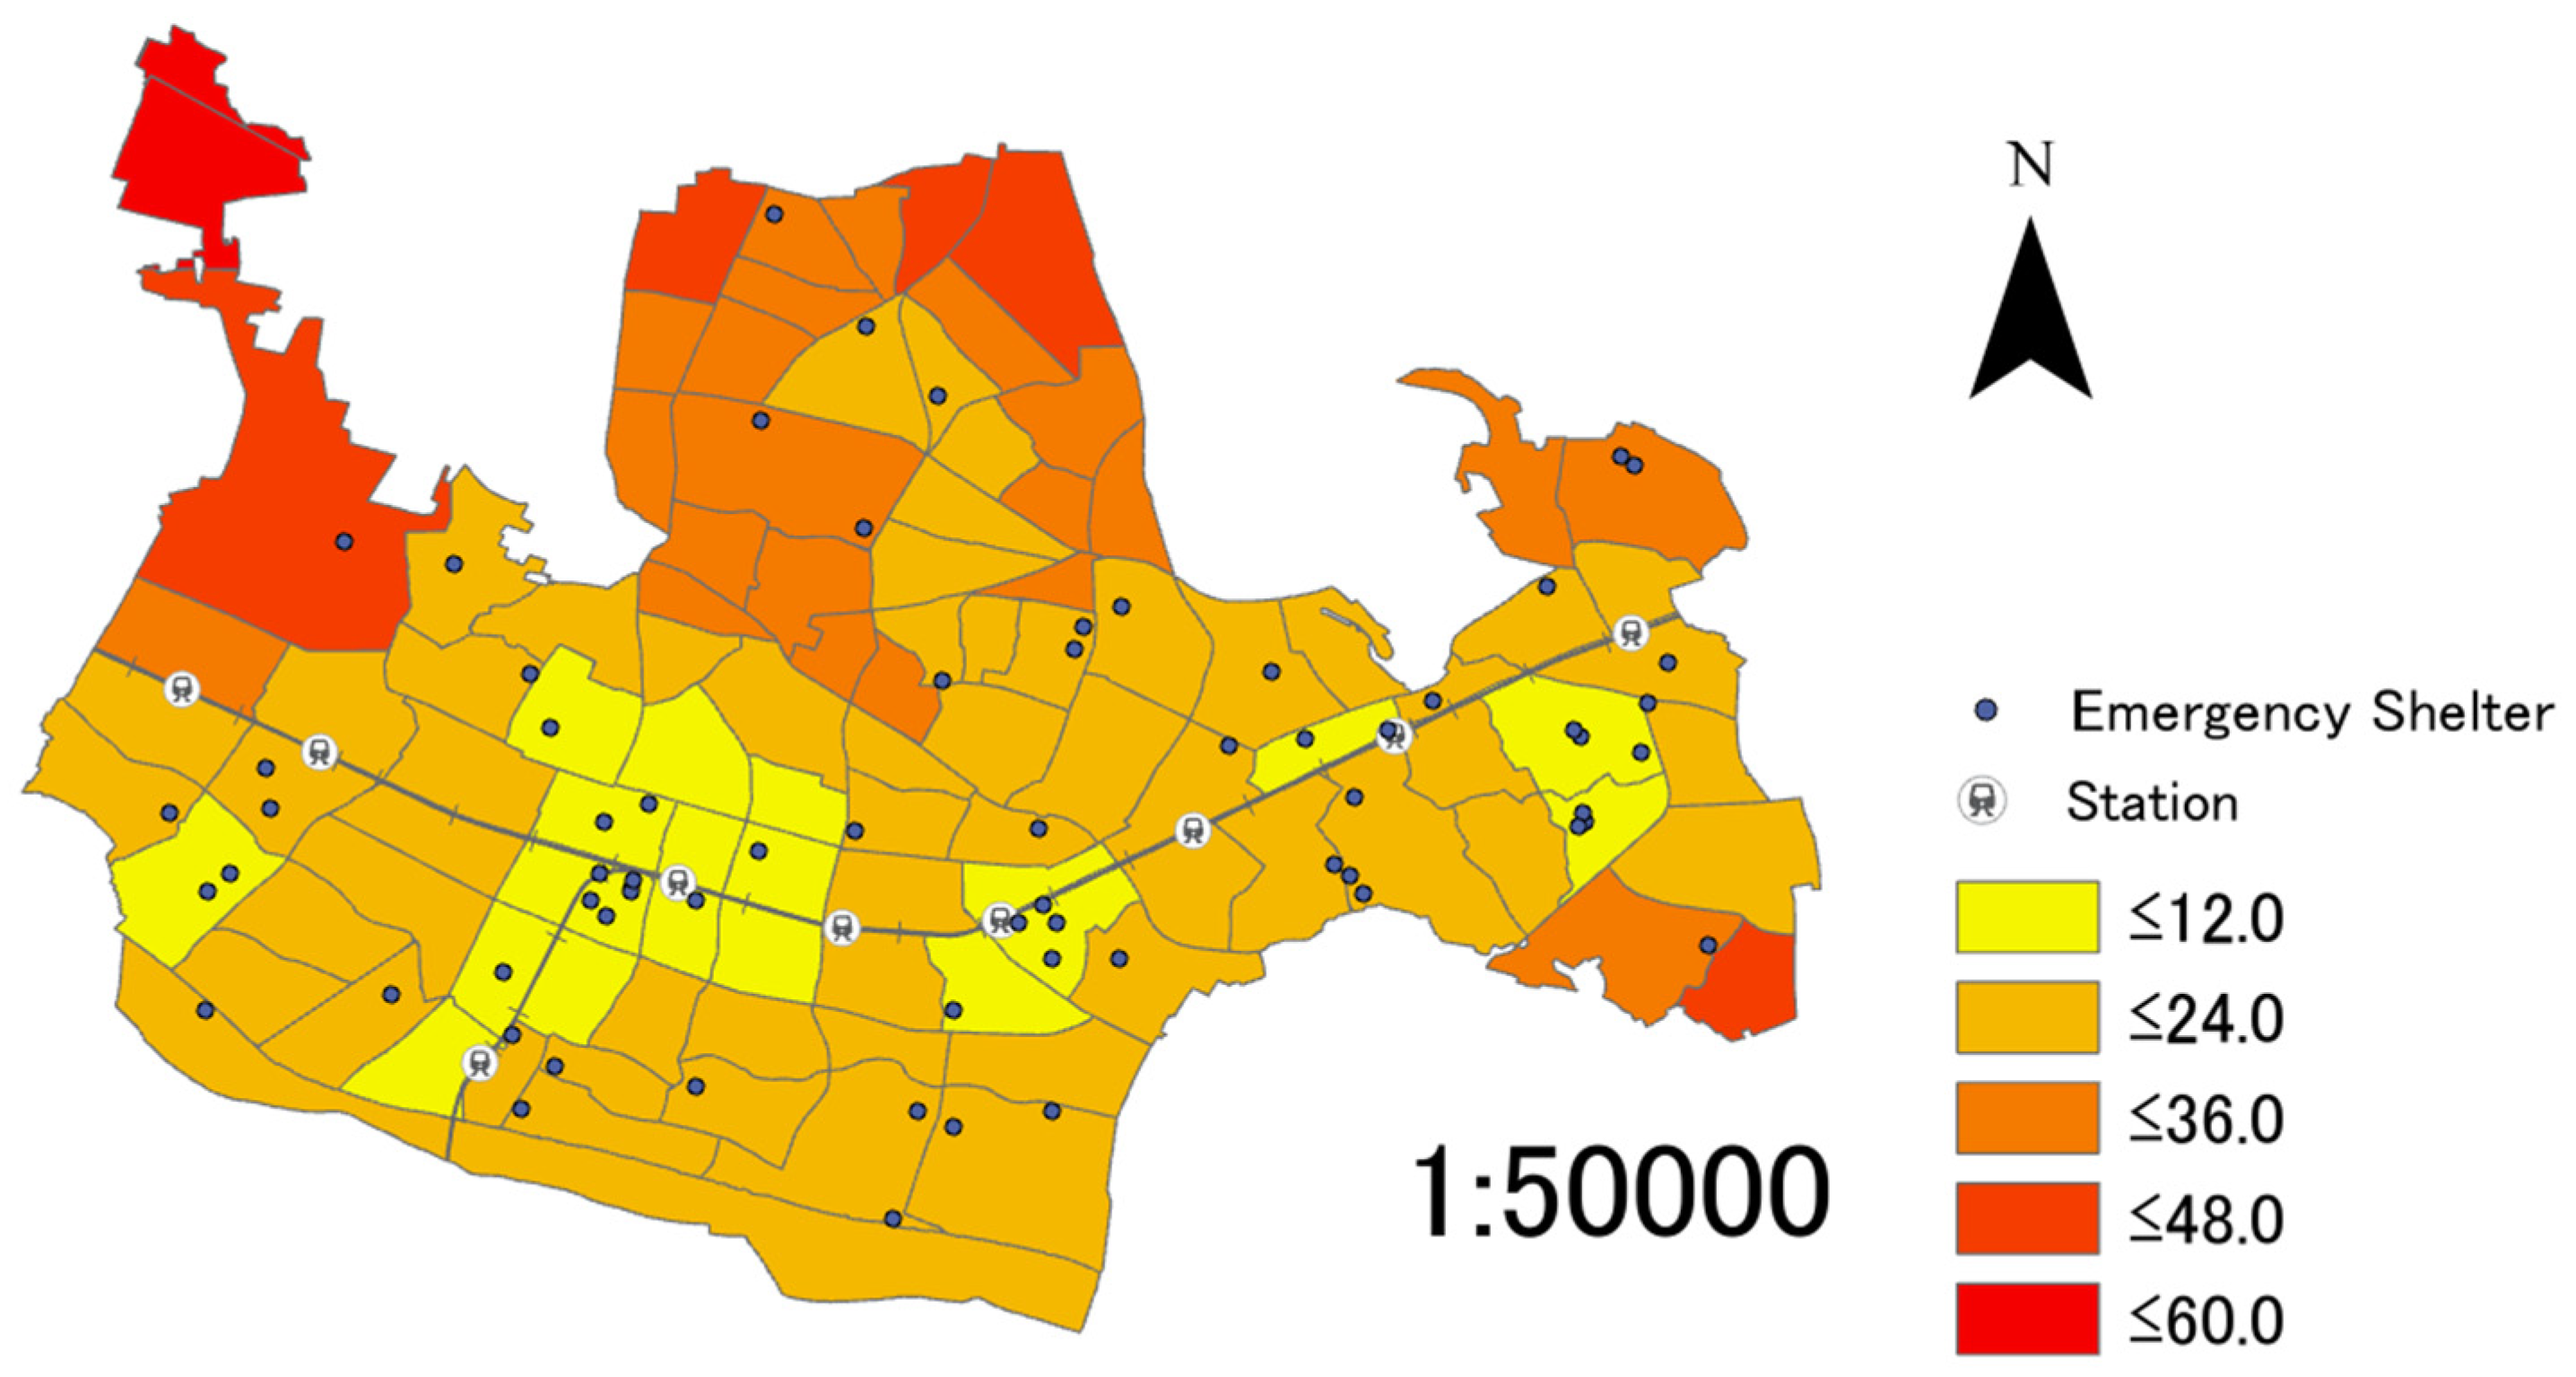
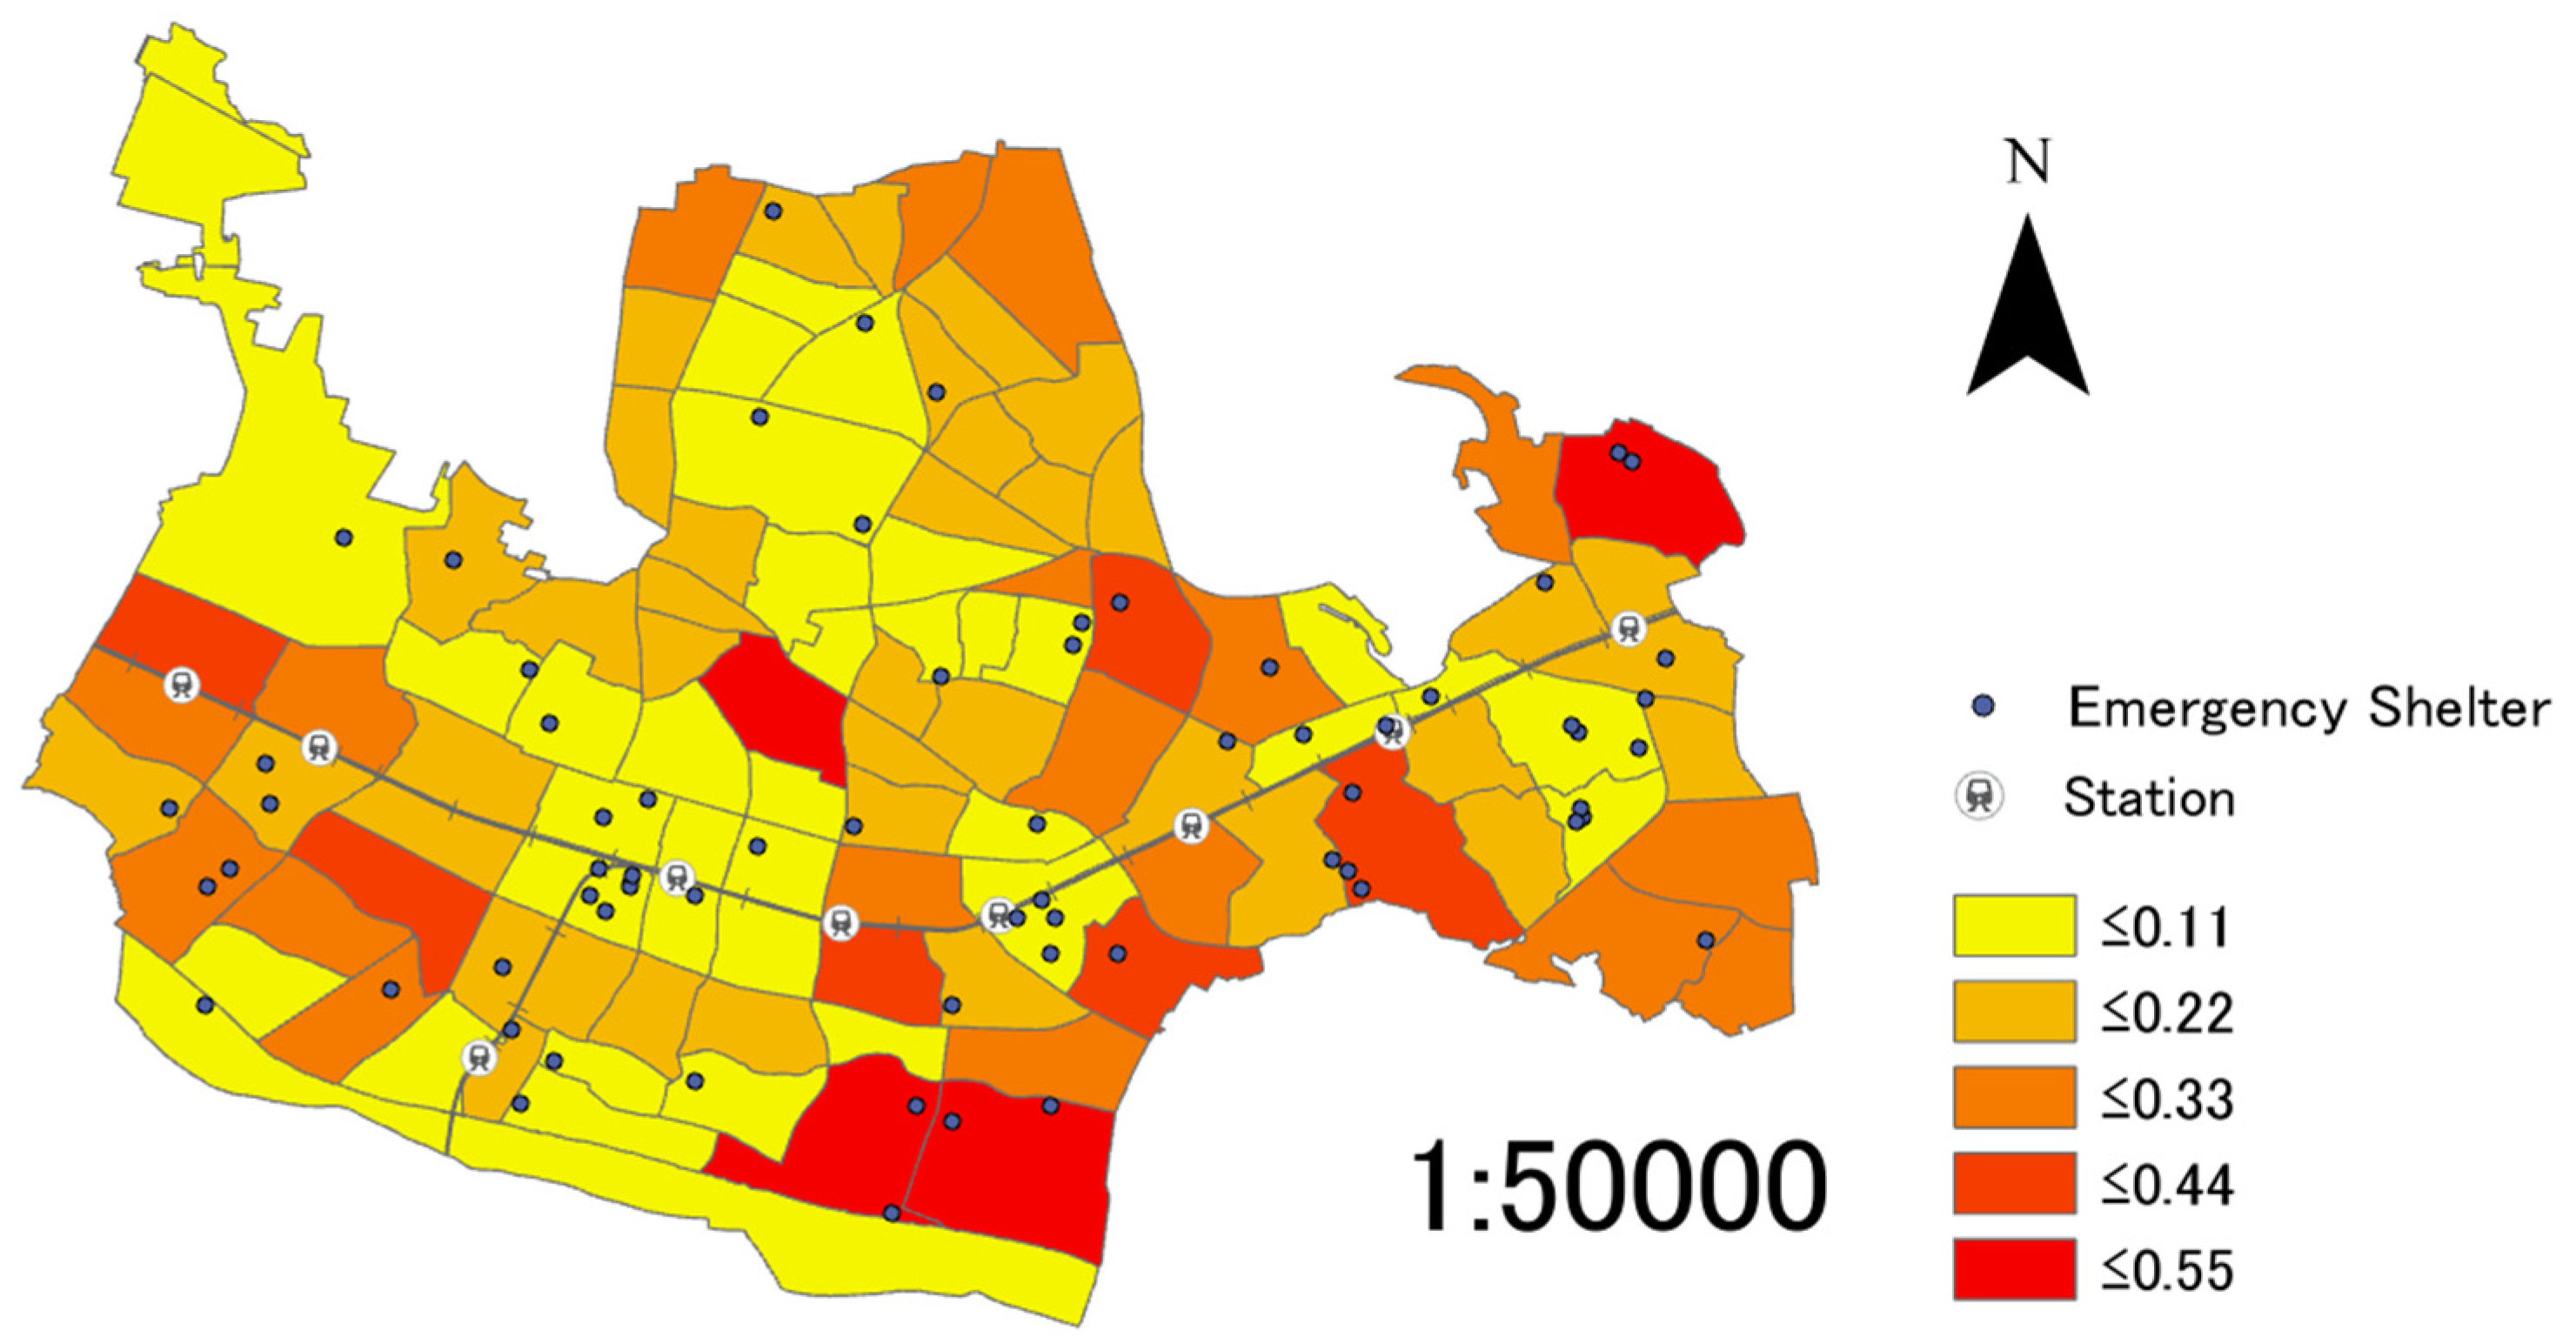
5.1. Results for Chofu City
Figure 1, Figure 2, Figure 3, Figure 4 and Figure 5 shows the results and n value is 6 for Chofu City. As mentioned in Section 3.2.2, for each district, the n value is the average of the number of emergency shelters within 879 m. From these figures, it is evident that there is a large difference between districts when not using a weighted coefficient (Figure 1), and when using the ratio of permanent population as a weighted coefficient (Figure 3). Without a weighted coefficient, there are districts with extremely high assessment values in the northern part, which are far from emergency shelters. With the ratio of permanent population as a weighted coefficient, there are districts with extremely high assessment values in the southeastern and southwestern parts, which have a large number of populations.
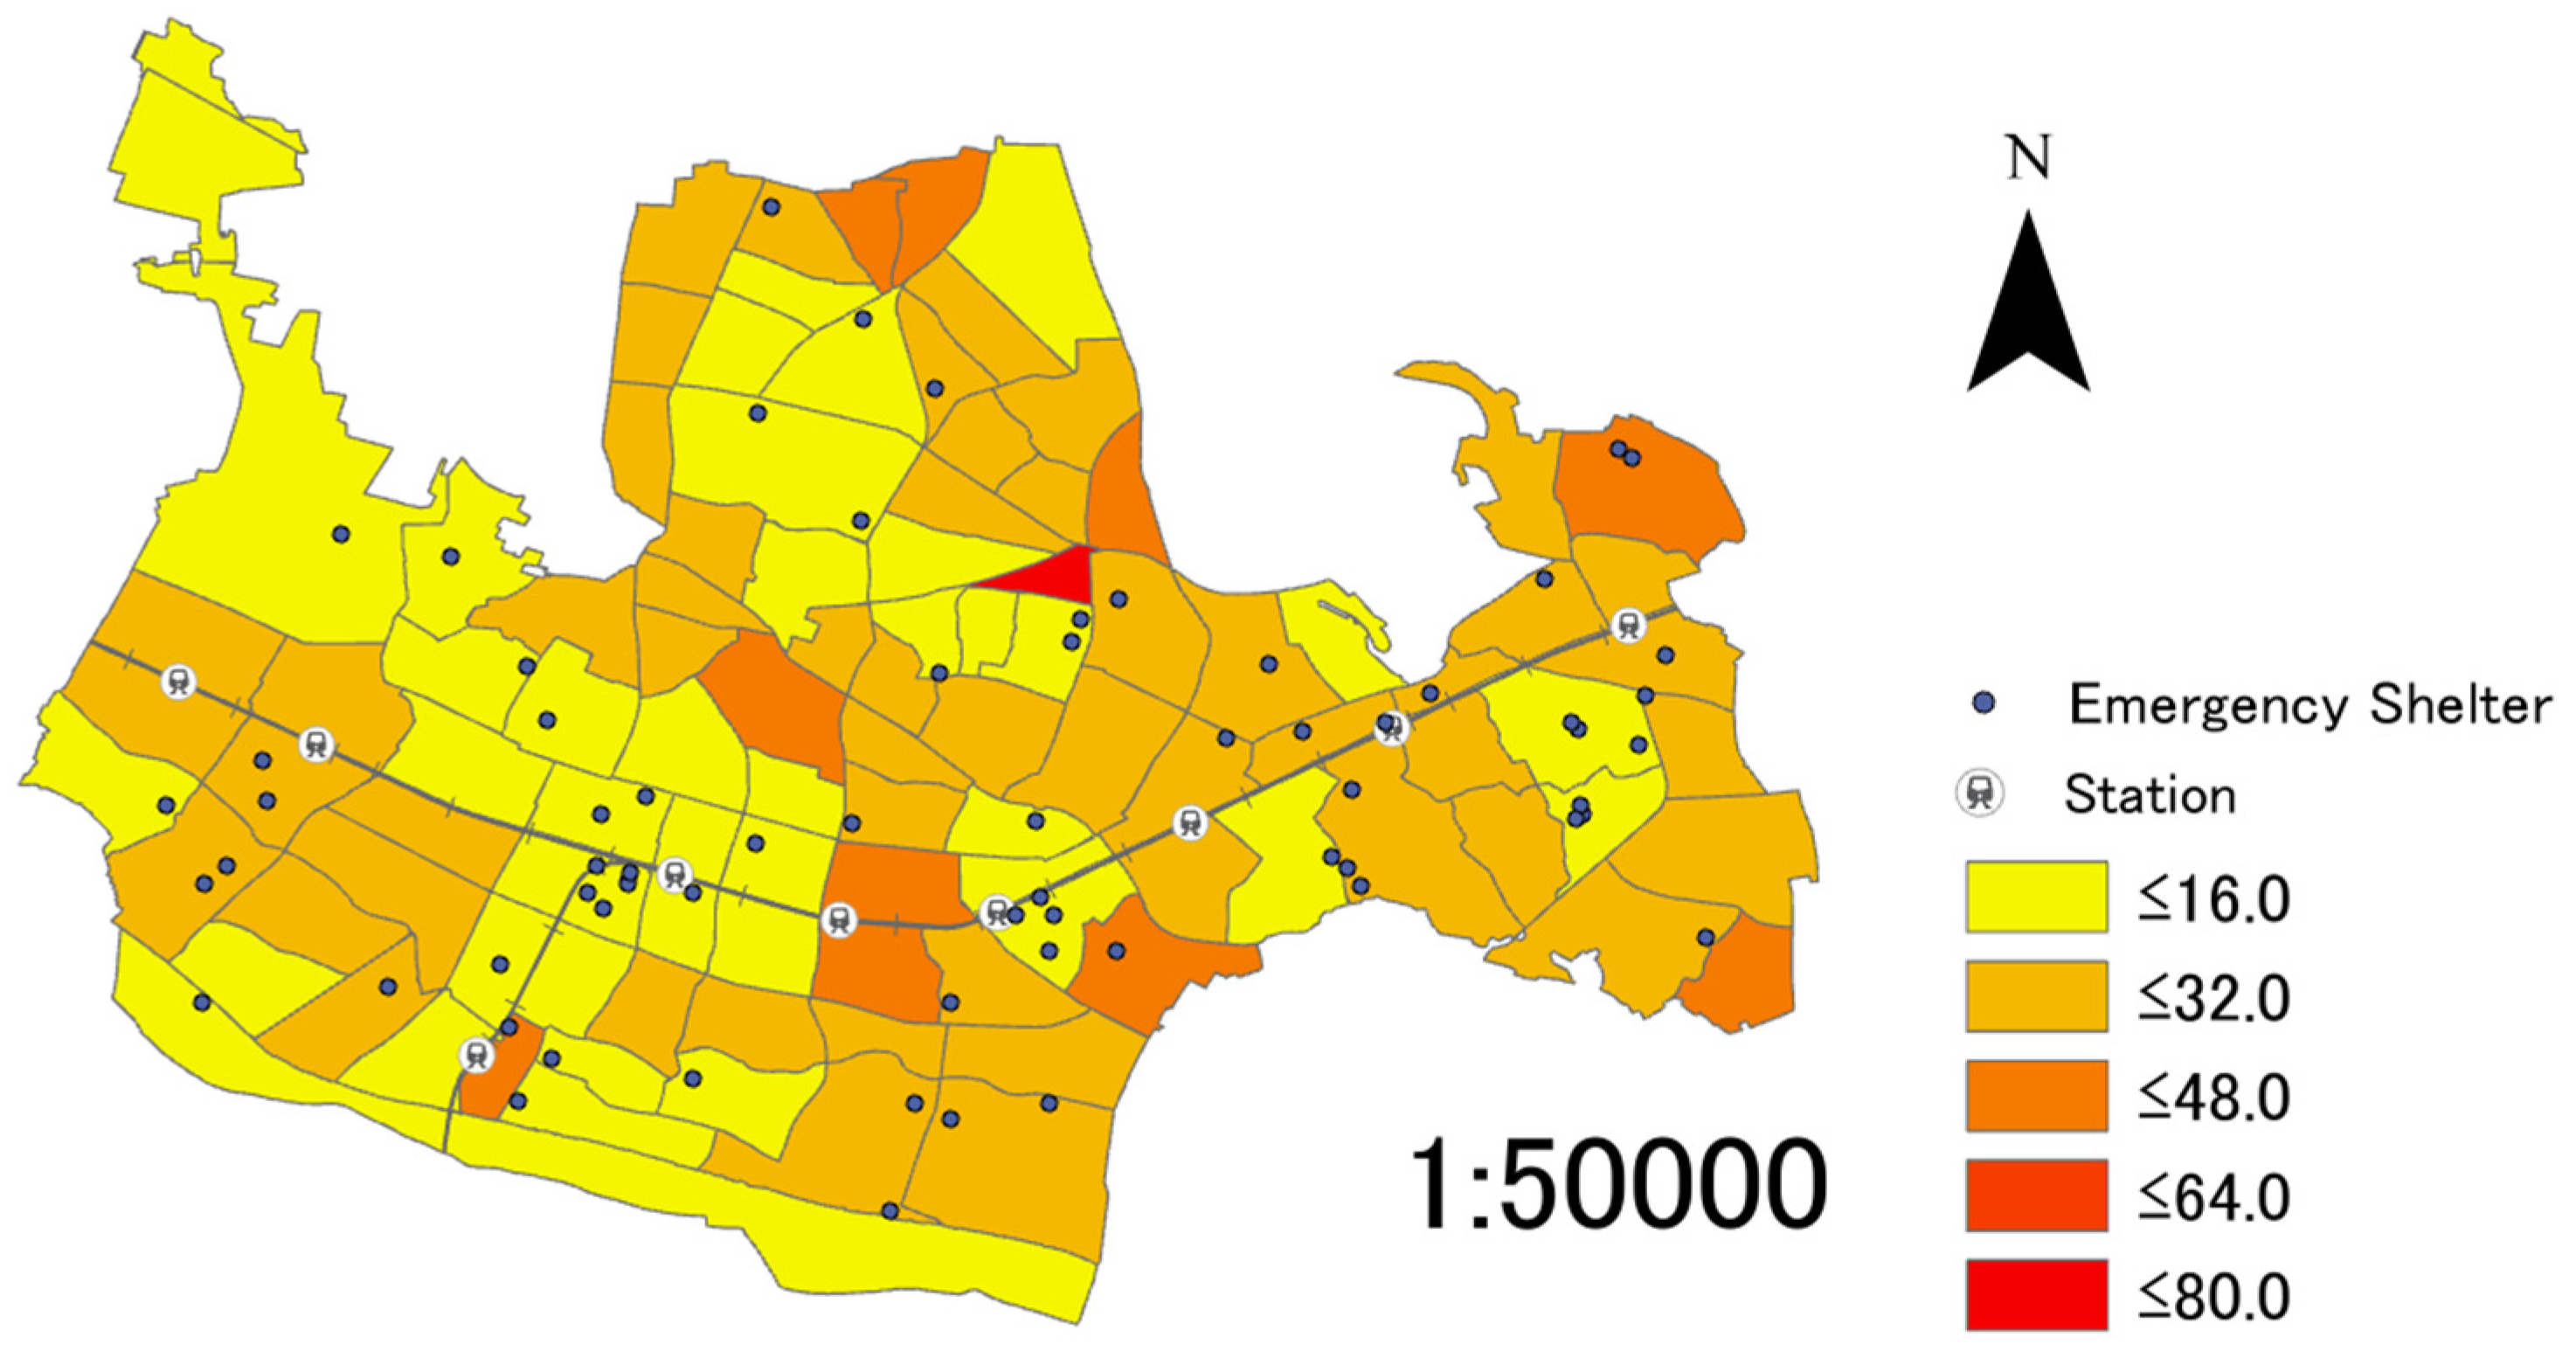
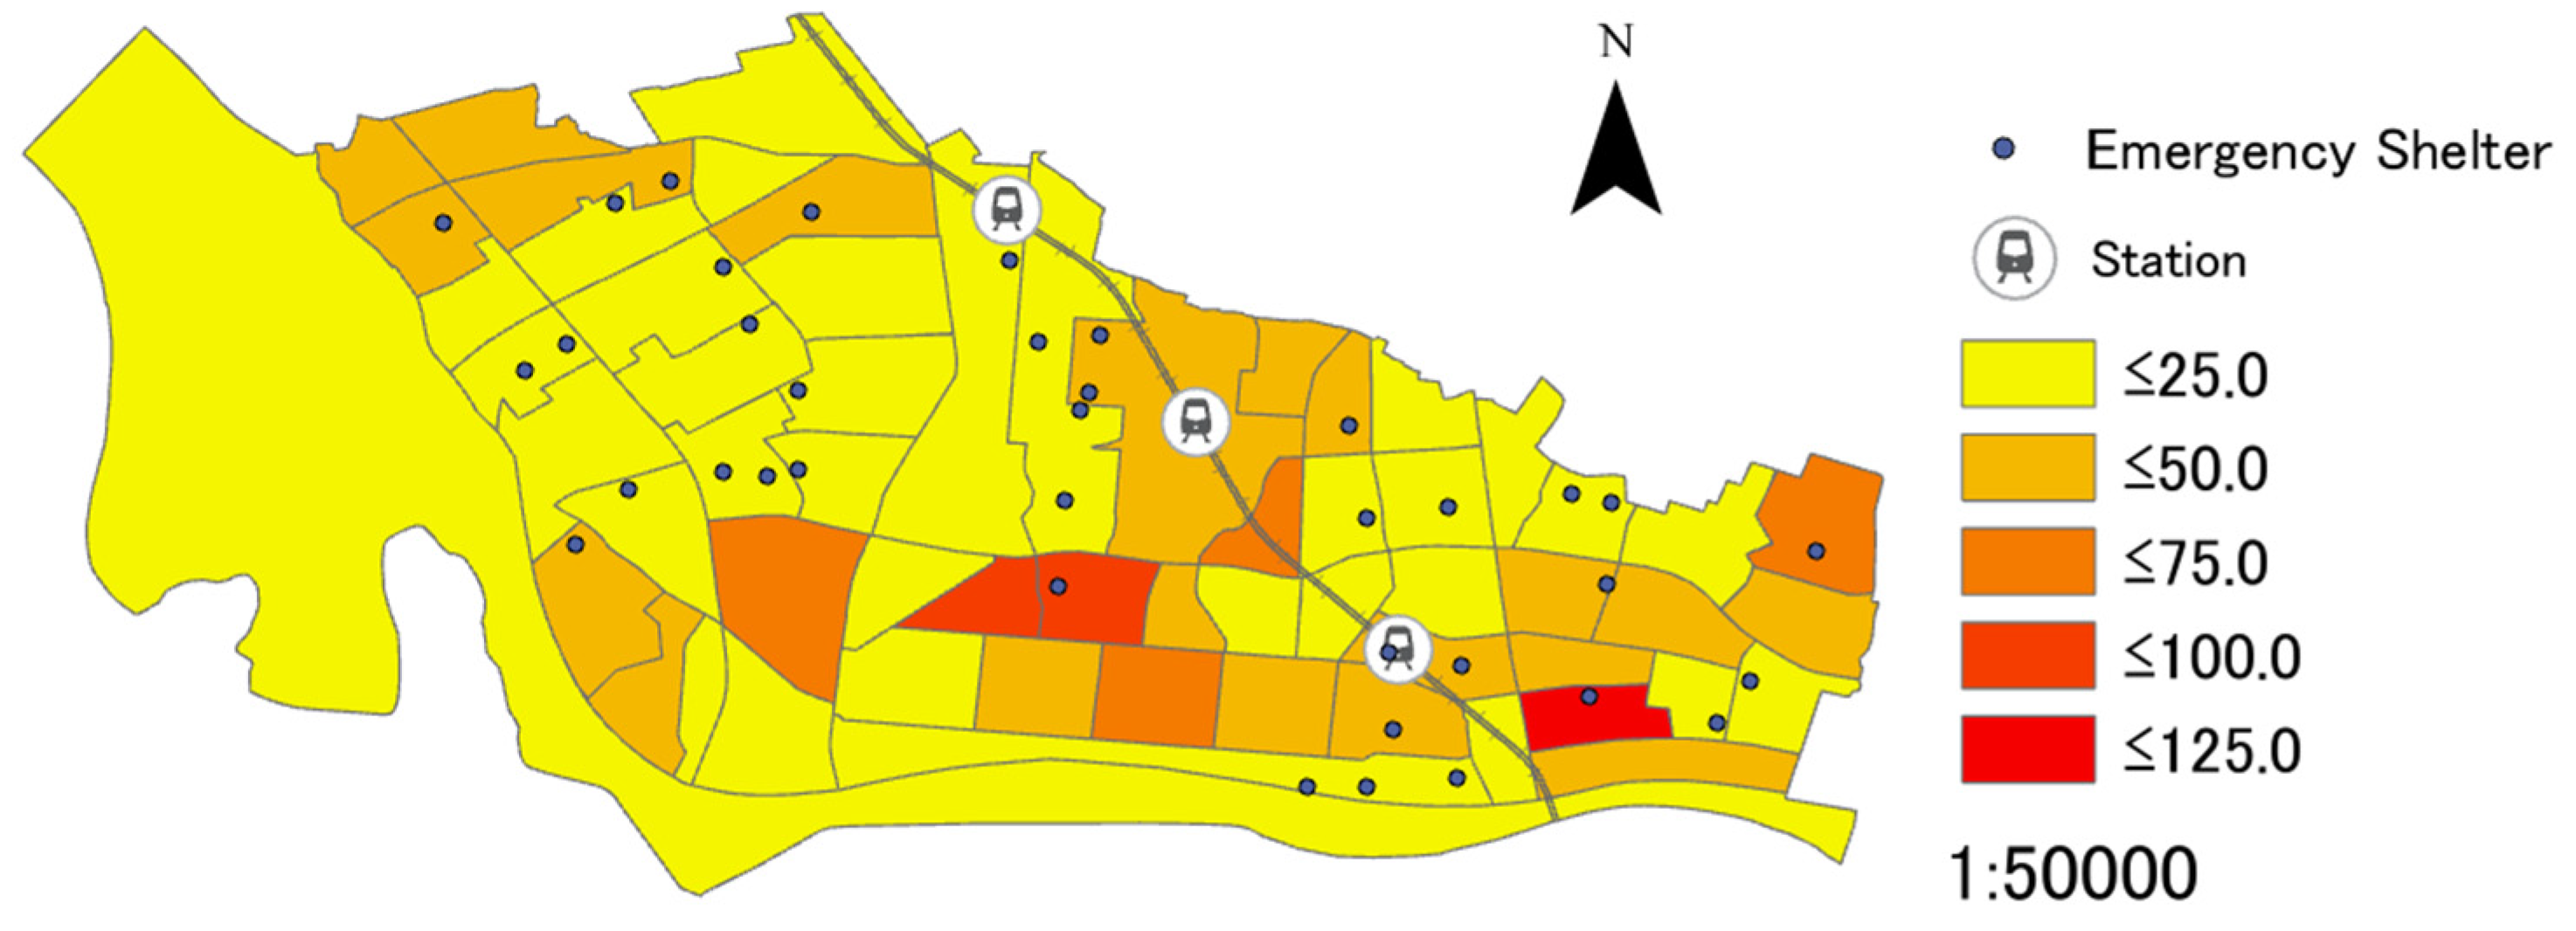
5.2. Results for Fuchu City
Figure 6, Figure 7, Figure 8, Figure 9, Figure 10 shows the results and n value is 6 for Fuchu City. From these figures, it is evident that there is a large difference between districts when not using a weighted coefficient (Figure 6), and when using the ratio of permanent population (Figure 8). Without a weighted coefficient, the emergency shelters concentrated in the central part that has a low assessment value. With the ratio of permanent population as a weighted coefficient, there are districts with extremely high assessment values in the southeastern part, which are far from emergency shelters. Additionally, there are districts with low assessment values in central part, which have a large number of populations and emergency shelters.
5.3. Results for Toda City
Figure 11, Figure 12, Figure 13, Figure 14 and Figure 15 shows the results and n value is 5 for Toda City. From these figures, it is evident that there is a large difference between districts when not using a weighted coefficient (Figure 11), and when using the ratio of permanent population and the ratio of elderly population as the weighted coefficients (Figure 13 and Figure 14). Without a weighted coefficient, emergency shelters concentrated in the districts that have low assessment values. With the ratio of permanent population and the ratio of elderly population as weighted coefficients, there are districts with extremely high assessment values in central part, which have a large number of populations and elderly populations.
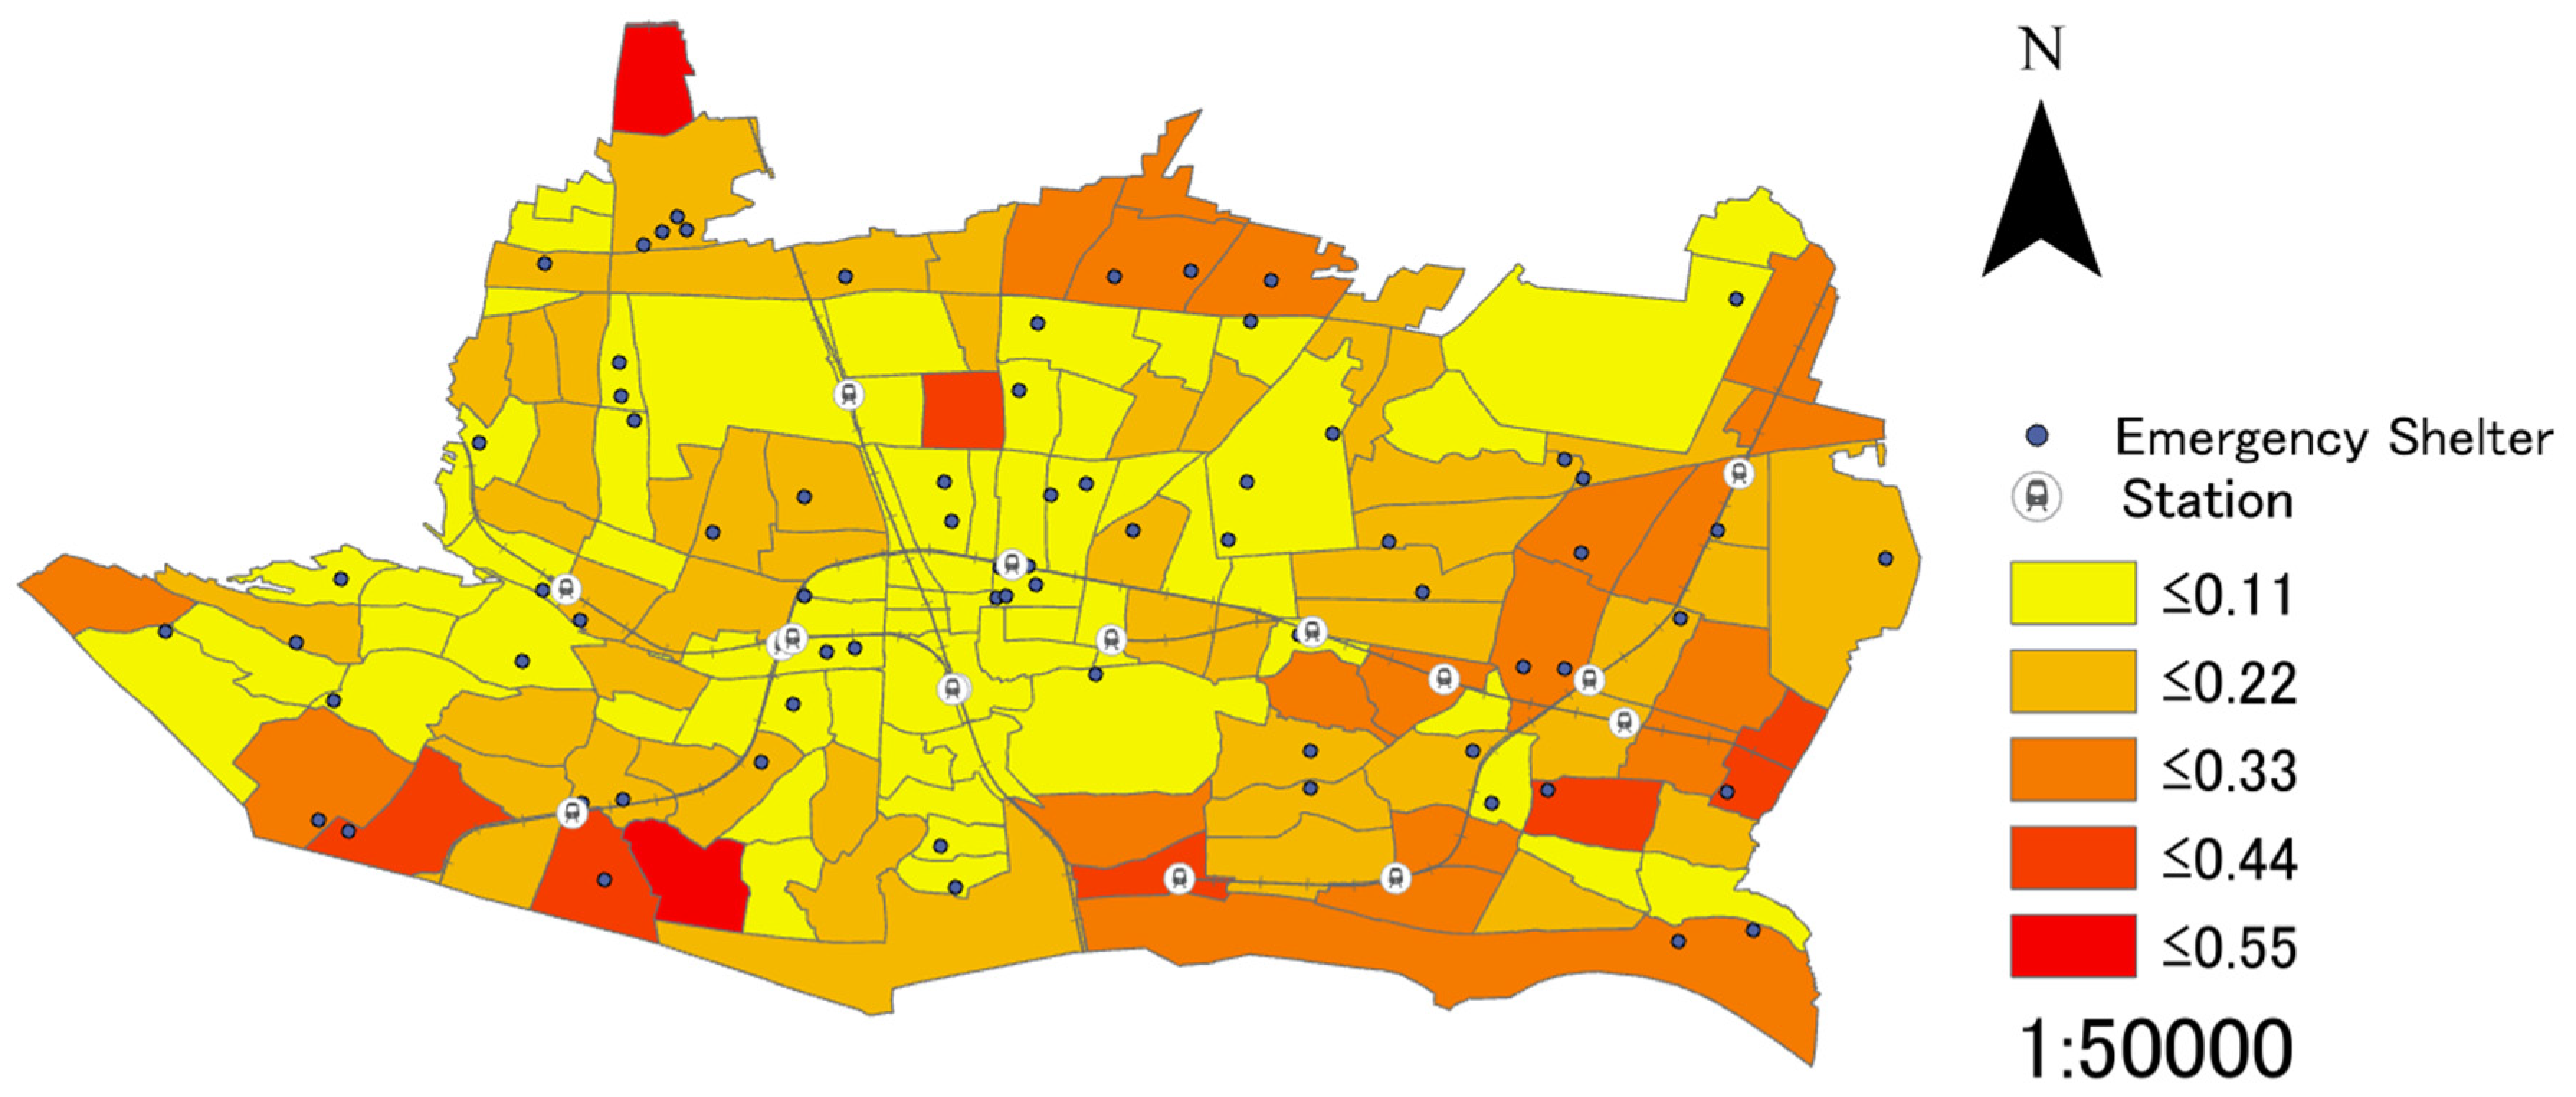
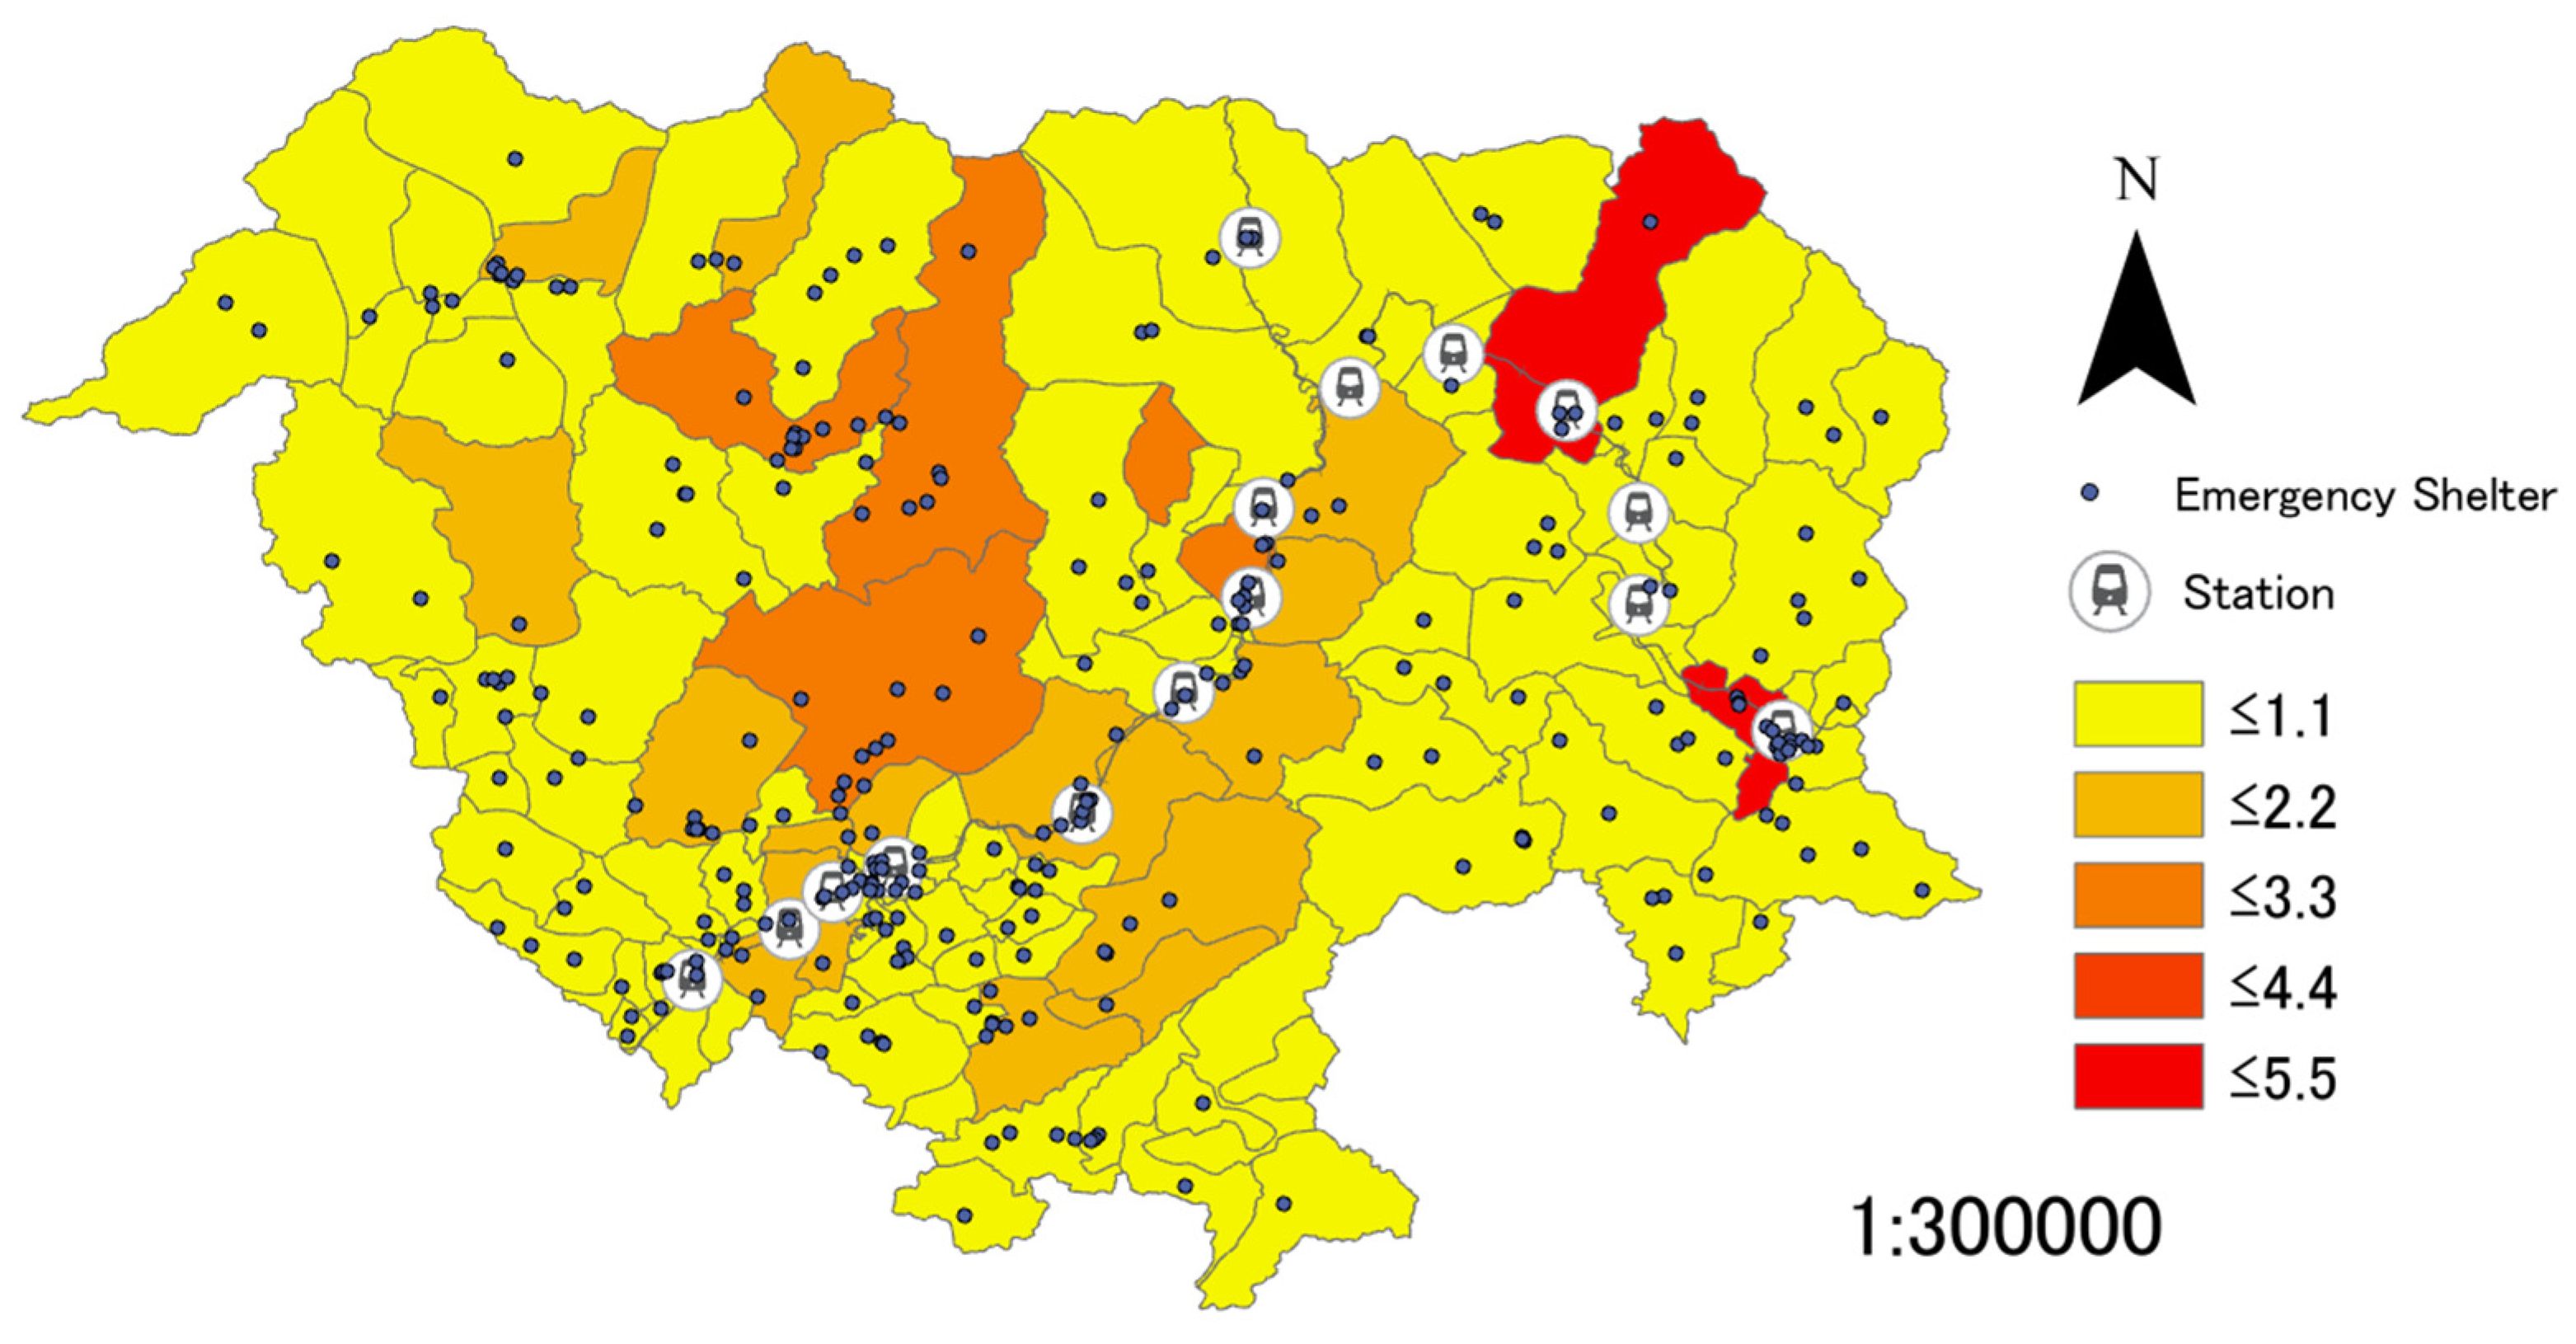
5.4. Results for Shobara City
Figure 16, Figure 17, Figure 18, Figure 19 and Figure 20 shows the results and the n value is 1 for Shobara City. From these figures, it is evident that there is a large difference between districts when not using a weighted coefficient (Figure 16), and when using the specialization coefficient of elder population as the weighted coefficients (Figure 17). In both these two cases, districts with extremely high assessment values are distributed in the entire Shobara City, and they are far from emergency shelters. However, most of districts have low assessment values when using the specialization coefficient of population density as weighted coefficients (Figure 20).
6. Discussion
As mentioned in Section 3.2.4, this section will compare the results between multiple areas (Chofu, Fuchu, Toda and Shobara Cities) as well as the results with and without the four types of weighted coefficients that were related to the regional characteristics based on Figure 1, Figure 2, Figure 3, Figure 4, Figure 5, Figure 6, Figure 7, Figure 8, Figure 9, Figure 10, Figure 11, Figure 12, Figure 13, Figure 14, Figure 15, Figure 16, Figure 17, Figure 18, Figure 19 and Figure 20 in order to verify the validity of the assessment method. Specifically, it is necessary to compare the results between multiple areas with different regional characteristics in order to verify the validity of the assessment method. Additionally, it is also necessary to compare the results with and without weighted coefficients, focusing on the increase and decrease of the assessment values for both cases. Furthermore, by verifying the assessment method, it is capable of proving the reliability of the results for the above four cities. Based on these two types of comparisons, focusing on regional characteristics, it is also possible to respectively grasp the suitability of emergency shelters allocation in the above four cities.
6.1. Comparison of the Results between Multiple Areas with Ddifferent Regional Characteristics
In this section, focusing on the maximum and minimum assessment values that are shown in Figure 1, Figure 2, Figure 3, Figure 4, Figure 5, Figure 6, Figure 7, Figure 8, Figure 9, Figure 10, Figure 11, Figure 12, Figure 13, Figure 14, Figure 15, Figure 16, Figure 17, Figure 18, Figure 19 and Figure 20, the comparison of the results between target areas will be conducted. These assessment values are based on the suitability analysis for the emergency shelters allocation in the unit of districts of each target area mentioned in Section 3.2.3.
6.1.1. Results without a Weighted Coefficient
As mentioned in Section 3.2.3, when not using a weighted coefficient, analyses are conducted based on the linear distance between each district and each emergency shelter, and the scale of such facilities. Table 4 indicates the maximum (highest results) and minimum (lowest results) assessment values without a weighted coefficient. As shown in Table 2, though Shobara City has a large number of emergency shelters, because the area is extremely large, it is difficult to evenly place emergency shelters in the entire city. Therefore, there are some districts with extremely high assessment values in Shobara City. In contrast, because the areas of Chofu, Fuchu, and Toda Cities are relatively small, and the maximum assessment values in these three cities are not so high as that in Shobara City. Additionally, regarding the minimum assessment values, as all four cities have some districts with a concentration of emergency shelters, there is no noticeable difference between the four cities.
6.1.2. Results with the Specialization Coefficient of Elderly Population as a Weighted Coefficient
Table 5 indicates the results with the specialization coefficient of elderly population as a weighted coefficient. Districts where the specialization coefficient of elderly population is 0 are not considered. Regarding Shobara City, as the maximum assessment value without a weighted coefficient is significantly higher in comparison with the other three cities, the maximum assessment value remains high, regardless of the specialization coefficient of elderly population. Additionally, regarding Chofu, Fuchu, and Toda Cities, the maximum values of the specialization coefficient of elderly population are directly proportional to the maximum assessment values. However, regarding Fuchu City, as the minimum assessment value when not using a weighted coefficient is low, and the minimum value of the specialization coefficient of elderly population is also low, the minimum assessment value is lower in comparison with the other three cities. When comparing Chofu, Fuchu, and Toda Cities, which have almost the same areas as described in Table 2, when using the specialization coefficient of elderly population as a weighted coefficient, the values are directly proportional to the assessment values in these three cities.
6.1.3. Results with the Ratio of Permanent Population as a Weighted Coefficient
Table 6 indicates the results with the ratio of permanent population as a weighted coefficient. Districts where the ratio is 0 are not considered. The maximum and minimum values of the ratio of permanent population are directly proportional to the maximum and minimum assessment values when using the ratio of permanent population as a weighted coefficient, as it is made clear in Table 6.
6.1.4. Results with the Ratio of Elderly Population as a Weighted Coefficient
Table 7 indicates the results with the ratio of elderly population as a weighted coefficient. Districts where the ratio of elderly population is 0 are not considered. In a similar manner as the previous section, the maximum and minimum values of the ratio of elderly population are directly proportional to the maximum and minimum assessment values when using the ratio of elderly population as the weighted coefficient.
6.1.5. Results with the Specialization Coefficient of Population Density as a Weighted Coefficient
Table 8 indicates the results with the specialization coefficient of population density as a weighted coefficient. Districts where the specialization coefficient of population density is 0 are not considered. The maximum values of the specialization coefficient of population density are directly proportional to the maximum assessment values in all four cities. Additionally, regarding Toda City, as the minimum value of the specialization coefficient of population density is extremely low, the minimum assessment value is also low. On the other hand, regarding Shobara City, as the minimum value of the specialization coefficient of population density is extremely high, the minimum assessment value is also high. When comparing Chofu and Fuchu Cities, as there is a small difference between each minimum value of the specialization coefficient of population density, there is likewise a small difference between each minimum assessment value.
6.1.6. Summary
This section will summarize the comparison results between multiple areas, while focusing on the maximum and minimum assessment values.
(1) Maximum assessment value
Regarding Shobara City, the maximum assessment value when not using a weighted coefficient is extremely high, and all of the values with different types of weighted coefficients are also significantly higher in comparison with the other three cities. Additionally, when comparing Chofu, Fuchu, and Toda Cities, as there is a small difference between the maximum assessment values when not using a weighted coefficient, the maximum values of weighted coefficients tend to be directly proportional to the maximum assessment values. Therefore, it is possible to verify the validity of the assessment method in the present research.
(2) Minimum assessment value
For all cities, as there is a small difference between the minimum assessment values when not using a weighted coefficient, the minimum values of weighted coefficients tend to be directly proportional to the minimum assessment values. Therefore, similar to when focusing on the maximum assessment value, it is possible to verify the validity of the assessment method in the present research.
6.2. Comparison of the Results with and without Weighted Coefficients
Based on the results of Section 5, this section will compare the results with and without the weighted coefficients, and verify the validity of the assessment method by focusing on the increase and decrease of assessment values in these two cases.
6.2.1. Comparison Concerning the Specialization Coefficient of Elderly Population
Districts with high assessment values also have high assessment values when not using a weighted coefficient, when using the specialization coefficient of the ratio of elderly population as a weighted coefficient. The same trend is seen between districts with low assessment values. Additionally, it is difficult to see any significant difference between the specialization coefficient of elderly population for each district, because the value is derived by dividing the rate of the population who are over 75 years old in each district by the same rate in the entire target area.
6.2.2. Comparison Concerning the Ratio of Permanent Population
When using the ratio of permanent population as a weighted coefficient, many districts with high assessment values also have high values, while many districts with low assessment values also have low values. When not using a weighted coefficient, many districts with high assessment values are far from any stations and city centres, while many districts with low assessment values are close to stations and the city centre. Therefore, when using the ratio of elderly population, which greatly differs between the districts as a weighted coefficient, the assessment values are reversed in the cases without a weighted coefficient and with the ratio of elderly population as the weighted coefficient.
6.2.3. Comparison Concerning the Ratio of Elderly Population
The trend is similar to that of the previous section when using the ratio of elderly population as a weighted coefficient. Specifically, many districts with high assessment values also have high values, while many districts with low assessment values also have low values. When not using a weighted coefficient, many districts with high values are far from any stations and city centres, while the districts with low assessment values are close to stations and city centres. Therefore, when using the ratio of elderly population that greatly differs between the districts as a weighted coefficient, the assessment values are reversed in the cases without a weighted coefficient and with the ratio of elderly population as a weighted coefficient.
6.2.4. Comparison Concerning the Specialization Coefficient of Population Density
When using the specialization coefficient of population density as the weighted coefficient, districts with high assessment values also have high values, while districts with low assessment values also have low values. The specialization coefficient of population density is high around stations and city centre, and it is lower as the distance from stations and city centers increases. When not using a weighted coefficient, the assessment values are high in districts that are far from any stations and city centre, while the assessment values are low in districts close to stations and city centre. Therefore, when using the specialization coefficient of population density, which greatly differs between the districts as a weighted coefficient, the assessment values are reversed in the cases without a weighted coefficient and with the ratio of elderly population as a weighted coefficient.
6.2.5. Summary
This section will summarize the comparison results with and without weighted coefficients. There is no significant difference between the assessment values with and without this weighted coefficient because there is a small difference between the specialization coefficient of elderly population in each district. However, as there is a significant difference between the other 3 weighted coefficients in each district, the weighed coefficients are directly proportional to the assessment values. In other words, when not using a weighted coefficient, districts with high assessment values have low weighted coefficient values, while districts with low assessment values have high weighted coefficient values. Therefore, the assessment values are reversed, depending on whether the other three weighted coefficients are used or not. Additionally, based on the above comparison results, it is possible to verify the validity of the assessment method in the present research.
7. Conclusions
The conclusion of the present research can be summarized in the following four points.
(1) The method in the present research modifies the p-median model that derives the best facility location and conducts a suitability analysis for the emergency shelters allocation in each district. The weighted coefficients such as the specialization coefficient of elderly population, the ratio of permanent population, the ratio of elderly population, and the specialization coefficient of population density that is related to the regional characteristics are integrated into the suitability analysis for the emergency shelters allocation in Japan, using the linear distance between each district and each emergency shelter as well as the coverage of such emergency shelters.
(2) As the quantitative data related to the above 4 types of weighted coefficients, the linear distance between each district and each emergency shelter, and the facility scale of emergency shelters are used to conduct a suitability analysis, the results are also quantitative, making it a useful indicator to analyze the suitability of emergency shelters allocation. Additionally, while there are only four types of weighted coefficients that are adopted in the present research, other regional characteristics can be adopted as weighed coefficients to expand the assessment method. Furthermore, it is possible to compare the sufficiency levels of emergency shelters between districts and point out the specific districts that are short of emergency shelters, as the suitability of emergency shelters allocation are analyzed by each district. Additionally, it is also possible to visually understand the suitability of emergency shelters allocation on a small spatial scale as the unit of districts, as the results are displayed on the digital maps of GIS.
(3) In the present research, the above four types of weighted coefficients, the linear distance between each district and each emergency shelter as well as the facility scale of emergency shelters are calculated while using open data, such as the National Census and the National Land Numerical Information. As analyses in the present study are conducted based on public information, by obtaining population data and geospatial data that are similar to the present research, analyses can be conducted while using data in other areas, as well as for the past and future. Therefore, the assessment method in the present research has a high temporal reproducibility as well as spatial reproducibility. For example, by using the “future population estimate by region in Japan” of the National Institute of Population and Social Security Research [43] as future data, the shortage or overage of emergency shelters in the future can be evaluated.
(4) The present research has the limitation of data availability. Specifically, the data that are related to emergency shelters of contiguous cities could not be used, as the necessary data concerning the facility scale of emergency shelters were not available. Therefore, the assessment values of districts that were located near the administrative boundaries between the target areas and neighboring cities could not be considered to be accurate. For this reason, it is necessary to create original data related to emergency shelters.
The following are two issues that can be considered as future research topics.
(1) Calculation of the distance between each district and each emergency shelter
In the present research, as the linear distance between each district and each emergency shelter was adopted, such a distance differs from the actual road distance. Therefore, it is possible to increase the accuracy of the results by adopting the road distance. Manrique (2013) [44] demonstrated that the road distance of narrow roads that are only passable for those on foot is 1.271 times longer than the linear distance, and the road distance of wide roads that are drivable is 1.415 times longer than the linear distance. Referring to the results, it is possible to calculate road distance based on the linear distance.
(2) Application to other facilities in the time of accidents
While the present research focused on emergency shelters, the assessment method of the present research may also be applied to the suitability analysis of temporary evacuation shelters in the time of accidents.
Author Contributions
T.A. collected and processed the data used for variables, and conducted a suitability analysis for the emergency shelters allocation. K.Y. carried out background work, and developed the framework and process of analysis. She also initially drafted the paper. T.A. and K.Y. contributed to write up and review, and approved the paper manuscript.
Funding
This research received no external funding.
Conflicts of Interest
The authors declare no conflict of interest.
References
- Susumu, Y. Magnitude and Earthquake. (In Japanese). Available online: https://www.s-yamaga.jp/nanimono/chikyu/magnitude-kazu.htm (accessed on 27 January 2019).
- Recruit Sumai Company Ltd. Dictionary of Housing Terms. (In Japanese). Available online: https://suumo.jp/yougo/h/hinanngennkaikyori/ (accessed on 27 January 2019).
- Cabinet Office. Awareness Related to the Development of Walkable Cities. (In Japanese). Available online: https://survey.gov-online.go.jp/h21/h21-aruite/2-2.html (accessed on 27 January 2019).
- Civiletti, G.; Camassi, R.; Monteiro, R. Italian Seismic Sequences: Year 2000, the Emergency Phase in Romagn. Procedia Eng. 2016, 161, 2088–2092. [Google Scholar] [CrossRef]
- Cerchiello, V.; Ceresa, P.; Monteiro, R.; Komendantova, N. Assessment of Social Vulnerability to Seismic Hazard in Nablus, Palestine. Int. J. Disaster Risk Reduct. 2018, 28, 491–506. [Google Scholar] [CrossRef]
- Contreras, D.; Kienberger, S. GIS in the Vulnerability Assessment and Recovery Process in a Community with Elderly and Disabled People after a Disaster. In Proceedings of the International Conference on Rebuilding Sustainable Communities with the Elderly and Disabled People after Disasters, Boston, MA, USA, 12–15 July 2010; p. 20. [Google Scholar]
- Awotona, A. Rebuilding Sustainable Communities with Vulnerable Populations after the Cameras Have Gone: A Worldwide Study; Cambridge Scholars Publishing: Cambridge, UK, 2012. [Google Scholar]
- Cabinet Office. Measures for People Requiring Assistance During a Disaster. (In Japanese). Available online: http://www.bousai.go.jp/taisaku/hisaisyagyousei/youengosya/ (accessed on 11 July 2019).
- Ministry of Health, Labour and Welfare. White Paper on Aging Society. (In Japanese). Available online: https://www8.cao.go.jp/kourei/whitepaper/w-2016/html/zenbun/index.html (accessed on 11 July 2019).
- Furihata, T.; Matsuoka, K. A Facility Location Analysis Considering Spatial Patterns of Distributed Users. Theory Appl. GIS 1994, 2, 91–99. (In Japanese) [Google Scholar] [CrossRef]
- Takeuchi, T.; Kondo, A. A Study about the Selection of the Place of Refuge at the Time of the Earthquake Tsunami: A Case Study in Susaki. Infrastruct. Plan. Rev. 2002, 19, 297–304. (In Japanese) [Google Scholar] [CrossRef]
- Kongsomsaksakul, S.; Yang, C.; Chen, A. Shelter Location-Allocation Model for Flood Evacuation Planning. J. East. Asia Soc. Transp. Stud. 2005, 6, 4237–4252. [Google Scholar]
- Aso, T.; Matsumoto, Y.; Morishita, K. A Study on the Optical Arrangement of Shelters Using Genetic Algorithm. Dep. Bull. Pap. Yamaguchi Univ. 2007, 58, 31–36. (In Japanese) [Google Scholar]
- Wei, X.; Okada, N.; Takeuchi, Y.; Kajitani, Y. A Diagnosis Model for Disaster Shelter Planning from the Viewpoint of Local People-Case Study of Nagata Ward in Kobe City, Hyogo Prefecture, Japan. Disaster Prev. Res. Inst. Annu. 2008, 50, 233–239. [Google Scholar]
- Ng, M.; Park, J. A Hybrid Bilevel Model for the Optimal Shelter Assignment in Emergency Evacuations. Comput. -Aided Civ. Infrastruct. Eng. 2010, 25, 547–556. [Google Scholar] [CrossRef]
- Tai, C.; Lee, Y.; Yuan, C. Urban Disaster Prevention Shelter Location and Evacuation Behavior Analysis. J. Archit. Build. Eng. 2010, 9, 215–220. [Google Scholar] [CrossRef]
- Kitajima, S. A study of Evacuation Shelter Location Using Network analysis. Ann. Jpn. Assoc. Urban Sociol. 2013, 47, 211–216. (In Japanese) [Google Scholar]
- Yu, J.; Wen, J. Multi-criteria Satisfaction Assessment of the Spatial Distribution of Urban Emergency Shelters Based on High-Precision Population Estimation. Int. J. Disaster Risk Sci. 2016, 7, 413–429. [Google Scholar] [CrossRef] [Green Version]
- Vecere, A.; Monteiro, R.; Ammann, W.J. Comparative Analysis of Existing Tools for Assessment of Post-Earthquake Short-Term Lodging Needs. Procedia Eng. 2016, 161, 2217–2221. [Google Scholar] [CrossRef] [Green Version]
- Vecere, A.; Monteiro, R.; Ammann, W.J.; Giovinazzi, S.; Santos, R.H.M. Predictive Models for Post Disaster Shelter Needs Assessment. Int. J. Disaster Risk Sci. 2017, 21, 44–62. [Google Scholar] [CrossRef]
- Trivedi, A.; Singh, A. A Hybrid Multi-Objective Decision Model for Emergency Shelter Location-Relocation Projects Using Fuzzy Analytic Hierarchy Process and Goal Programming Approach. Int. J. Proj. Manag. 2017, 35, 827–840. [Google Scholar] [CrossRef]
- Xu, W.; Zhao, X.; Ma, Y.; Li, Y.; Qin, L.; Wang, Y.; Du, J. A Multi-Objective Optimization Based Method for Evaluating Earthquake Shelter Location–Allocation. Geomat Nat. Hazards Risk 2018, 9, 662–677. [Google Scholar] [CrossRef]
- Nozaki, K.; Murakami, H. Study on Location Analysis of Tsunami Emergency Shelter and Inhabitants’ Preparedness for the Coming Nankai Trough Earthquake: A case of Aoki Area, Miyazaki City. In Proceedings of the AIJ Chugoku Chapter Architectural Research Meeting, Yamaguchi, Japan, 2–3 March 2019; pp. 959–962. (In Japanese). [Google Scholar]
- Yamada, T.; Takagi, A. A Planning Support System of Shelter Location from the Viewpoint of Resident. Infrastruct. Plan. Rev. 2004, 21, 325–334. (In Japanese) [Google Scholar] [CrossRef]
- Notsuda, M.; Kishimoto, T. A study on Allocation and Location Model of Regional Evacuation Facilities: Studies on Location Planning of Evacuation Facilities No.1. J. Archit. Plan. 2005, 70, 115–122. (In Japanese) [Google Scholar] [CrossRef]
- Nakai, S.; Kana, K.; Sakuma, Y. Research on Actual Condition of Existing Vacant Houses and Study on Possibility of Utilizing Them as “Spaces for Disaster Prevention” in the Densely Built-up Area: The Case of Tsuruhashi Area in Osaka City. J. City Plan. Inst. Jpn. 2012, 47, 1063–1068. (In Japanese) [Google Scholar]
- Ikenaga, T.; Gokon, H.; Meguro, K. Feasibility Study on Temporary Housing Supply System Using Vacant Houses: A Case Study in Wakayama Prefecture. J. Soc. Saf. Sci. 2017, 30/31, 13–23. (In Japanese) [Google Scholar]
- Asano, S.; Hirohata, D. Examination of the Guideline about the Choice of the Site Proposed for Construction on Emergency Temporary Housing for Public Lands: A Case Study in Shima-City. J. City Plan. Inst. Jpn. 2013, 48, 801–806. (In Japanese) [Google Scholar]
- Miyoshi, S.; Kana, K.; Sakuma, Y. Evaluation Framework of Project for Making Open Space by Temporary Use of Private Land in Densely Built-Up Areas: A Case of Kobe Project. J. City Plan. Inst. Jpn. 2017, 52, 293–300. (In Japanese) [Google Scholar]
- Araki, Y.; Tsuboi, S.; Hokojo, A. Setting up Patterns of Non-Designated Emergency Shelters after the Tsunami Evacuation: A Case Study in Kamaishi City after the Great East Japan Earthquake and Tsunami. J. Archit. Plan. 2017, 741, 2885–2895. (In Japanese) [Google Scholar] [CrossRef]
- Sasaki, T.; Sasaki, N.; Katsumata, H. Study on the Status of Designation of Emergency Place and/or Evacuation Shelters, and the Possibility of Buddhist Temple Utilization When Widspreaded Disasters Occur: Based on a Questionnaire Survey of Local Governments Nationwide. J. Archit. Plan. 2018, 747, 877–884. (In Japanese) [Google Scholar] [CrossRef]
- Umeki, H.; Nakamura, Y.; Fujimoto, M.; Mizumoto, T.; Suwa, H.; Arakawa, Y.; Yasumoto, K. Evacuation Center Determination Method Considering Bias of Congestion Degree on Areas. J. Inf. Process. 2019, 60, 608–616. (In Japanese) [Google Scholar]
- Kar, B.; Hodgson, M.E. A GIS Based Model to Determine Site Suitability of Emergency Evacuation Shelters. Trans. GIS 2008, 12, 227–248. [Google Scholar] [CrossRef]
- Alçada-Almeida, L.; Tralhão, L.; Santos, L.; Coutinho-Rodrigues, J. A Multiobjective Approach to Locate Emergency Shelters and Identify Evacuation Routes in Urban Areas. Geogr. Anal. 2009, 41, 9–29. [Google Scholar] [CrossRef]
- Park, S.; van de Lindt, J.W.; Gupta, R.; Cox, D. Method to Determine the Locations of Tsunami Vertical Evacuation Shelters. Nat. Hazards 2012, 63, 891–908. [Google Scholar] [CrossRef]
- Li, A.C.Y.; Nozick, L.; Xu, N.; Davidson, R. Shelter Location and Transportation Planning under Hurricane Conditions. Transp. Res. Part E Logist. Transp. Rev. 2012, 48, 715–729. [Google Scholar] [CrossRef]
- Anhorn, J.; Khazai, B. Open Space Suitability Analysis for Emergency Shelter after an Earthquake. Nat. Hazard Earth Sci. Syst. 2015, 15, 789–803. [Google Scholar] [CrossRef]
- Bayram, V.; Yaman, H. A Stochastic Programming Approach for Shelter Location and Evacuation Planning. RAIRO Oper. Res. 2018, 52, 779–805. [Google Scholar] [CrossRef]
- Xu, J.; Yina, X.; Chen, D.; An, J.; Nie, G. Multi-Criteria Location Model of Earthquake Evacuation Shelters to Aid in Urban Planning. Int. J. Disaster Risk Reduct. 2016, 20, 51–62. [Google Scholar] [CrossRef]
- Saino, T. Some Geographical Considerations on Aging of Population in Fukuoka City. Kikan Chirigaku 1992, 44, 29–36. (In Japanese) [Google Scholar] [CrossRef]
- Special Committee for Promotion of National Health Promotion Exercise (Health Japan 21) in the 21st Century, Ministry of Health, Labour and Welfare, Evaluation Sheet. (In Japanese). Available online: https://www.mhlw.go.jp/file/05-Shingikai-10601000-Daijinkanboukouseikagakuka-Kouseikagakuka/0000166296_7.pdf (accessed on 27 January 2019).
- Shigenobu, A.; Higaki, Y.; Ohtani, H. Calculation of Doorstop Make shift House Ground Product and the Rate of the Makeshift House Housing Complex Area Ratio Classified by Open Space: From the Example of the Urgent Makeshift House Housing Complex of the Great East Japan Earthquake (Miyagi Prefecture). In Proceedings of the AIJ Shikoku Chapter Architectural Research Meeting, Kami, Japan, 11 May 2013; pp. 115–116. (In Japanese). [Google Scholar]
- National Institute of Population and Social Security Research, Population Projections of Each Region for Japan. 2018 March; (In Japanese). Available online: http://www.ipss.go.jp/pp-shicyoson/j/shicyoson18/2gaiyo_hyo/gaiyo.asp (accessed on 27 January 2019).
- Manrique, R.; Luis, C. Proposal of an Evaluation Method of a Compact City Model. Ph.D. Thesis, University of Electro-Communications, Tokyo, Japan, 2014. [Google Scholar]
Figure 1.
Result for Chofu City without a weighted coefficient.

Figure 2.
Result for Chofu City with the specialization coefficient of elderly population as a weighted coefficient.
Figure 2.
Result for Chofu City with the specialization coefficient of elderly population as a weighted coefficient.

Figure 3.
Result for Chofu City with the Ratio of permanent population as a weighted coefficient.

Figure 4.
Result for Chofu City with the ratio of elderly population as a weighted coefficient.

Figure 5.
Result for Chofu City with the specialization coefficient of population density as a weighted coefficient.
Figure 5.
Result for Chofu City with the specialization coefficient of population density as a weighted coefficient.

Figure 6.
Result for Fuchu City without a weighted coefficient.

Figure 7.
Result for Fuchu City with the specialization coefficient of elderly population as a weighted coefficient.
Figure 7.
Result for Fuchu City with the specialization coefficient of elderly population as a weighted coefficient.

Figure 8.
Result for Fuchu City with the ratio of permanent population as a weighted coefficient.

Figure 9.
Result for Fuchu City with the ratio of elderly population as a weighted coefficient.

Figure 10.
Result for Fuchu City with the specialization coefficient of population density as a weighted coefficient.
Figure 10.
Result for Fuchu City with the specialization coefficient of population density as a weighted coefficient.

Figure 11.
Result for Toda City without a weighted coefficient was not used.

Figure 12.
Result for Toda City with the specialization coefficient of elderly population as a weighted coefficient.
Figure 12.
Result for Toda City with the specialization coefficient of elderly population as a weighted coefficient.

Figure 13.
Result for Toda City with the ratio of permanent population as a weighted coefficient.

Figure 14.
Result for Toda City with the ratio of elderly population as a weighted coefficient.

Figure 15.
Result for Toda City with the specialization coefficient of population density as a weighted coefficient.
Figure 15.
Result for Toda City with the specialization coefficient of population density as a weighted coefficient.

Figure 16.
Result for Shobara City without a weighted coefficient.

Figure 17.
Result for Shobara City with the specialization coefficient of elderly population as a weighted coefficient.
Figure 17.
Result for Shobara City with the specialization coefficient of elderly population as a weighted coefficient.

Figure 18.
Result for Shobara City with the ratio of permanent population as a weighted coefficient.
Figure 18.
Result for Shobara City with the ratio of permanent population as a weighted coefficient.

Figure 19.
Result for Shobara City with the ratio of elderly population as a weighted coefficient.

Figure 20.
Result for Shobara City with the specialization coefficient of population density as a weighted coefficient.
Figure 20.
Result for Shobara City with the specialization coefficient of population density as a weighted coefficient.


Table 1.
Area ratio available for temporary houses of safety evacuation areas.
| Type of Safety Evacuation Area | Area Ratio Available for Temporary Houses (%) |
|---|---|
| Open Spaces | 95.0 |
| Urban green spaces | 50.0 |
Table 2.
Outlines of target areas.
| City | Population (Persons) | Area (km2) | Aging Rate of Elderly Population (%) | Number of District | Number of Emergency Shelters |
|---|---|---|---|---|---|
| Chofu City | 230,303 | 21.6 | 8.7 | 105 | 68 |
| Fuchu City | 260,116 | 29.4 | 8.3 | 148 | 73 |
| Toda City | 35,575 | 18.2 | 5.6 | 60 | 37 |
| Shobara City | 139,616 | 1247.0 | 23.7 | 120 | 75 |
Table 3.
List of utilized data.
| Utilized Data and Sources | Utilization Method of Data |
|---|---|
| Population by age (National senses 2010) (Source: Statistics Bureau, Ministry of Internal Affairs and Communications) | Creating distribution maps for the specialization coefficient of elderly population, the ratio of permanent population, the ratio of elderly population, and the specialization coefficient of population density |
| Data related to emergency shelters (Digital national land information) (Source: National Land Policy Bureau, Ministry of Land, Infrastructure, Transport and Tourism) Information related to emergency shelters (Source: Official websites of Chofu, Fuchu, Toda and Shobara Cities) | Creating a distribution map of emergency shelters |
Table 4.
Results without a weighted coefficient.
| City | Chofu City | Fuchu City | Toda City | Shobara City |
|---|---|---|---|---|
| Maximum assessment value | 59.81633 | 53.65750 | 47.21871 | 429.94276 |
| Minimum assessment value | 2.25878 | 1.872332 | 7.614647 | 2.11606 |
Table 5.
Results with the specialization coefficient of elderly population as a weighted coefficient.
Table 5.
Results with the specialization coefficient of elderly population as a weighted coefficient.
| City | Chofu City | Fuchu City | Toda City | Shobara City |
|---|---|---|---|---|
| Maximum value of specialization coefficient of elderly population | 3.82633 | 2.02867 | 3.12336 | 2.35177 |
| Minimum value of specialization coefficient of elderly population | 0.26281 | 0.04191 | 0.14825 | 0.36911 |
| Maximum assessment value | 142.22402 | 67.88536 | 136.41473 | 448.82895 |
| Minimum assessment value | 2.24888 | 0.82389 | 2.23980 | 1.48857 |
Table 6.
Results with the ratio of permanent population as a weighted coefficient.
| City | Chofu City | Fuchu City | Toda City | Shobara City |
|---|---|---|---|---|
| Maximum value of ratio of permanent population | 0.02835 | 0.01799 | 0.05574 | 0.06203 |
| Minimum value of ratio of permanent population | 0.00042 | 0.00009 | 0.00004 | 0.00116 |
| Maximum assessment value | 0.54371 | 0.47256 | 1.00212 | 5.68238 |
| Minimum assessment value | 0.01916 | 0.00166 | 0.00037 | 0.03124 |
Table 7.
Results with the ratio of elderly population as a weighted coefficient.
| City | Chofu City | Fuchu City | Toda City | Shobara City |
|---|---|---|---|---|
| Maximum value of the ratio of elderly population | 0.04965 | 0.02430 | 0.04953 | 0.06573 |
| Minimum value of the ratio of elderly population | 0.00030 | 0.00004 | 0.00011 | 0.00153 |
| Maximum assessment value | 0.93303 | 0.54209 | 1.04558 | 5.68238 |
| Minimum assessment value | 0.01359 | 0.00075 | 0.00202 | 0.03124 |
Table 8.
Results with the specialization coefficient of population density as a weighted coefficient.
Table 8.
Results with the specialization coefficient of population density as a weighted coefficient.
| City | Chofu City | Fuchu City | Toda City | Shobara City |
|---|---|---|---|---|
| Maximum value of specialization coefficient of population density | 2.88567 | 4.87911 | 5.85714 | 107.82974 |
| Minimum value of t specialization coefficient of population density | 0.02029 | 0.02364 | 0.00113 | 0.09622 |
| Maximum assessment value | 79.00819 | 86.45790 | 123.35271 | 2,691.62524 |
| Minimum assessment value | 0.75399 | 0.44378 | 0.00932 | 3.23330 |
© 2019 by the authors. Licensee MDPI, Basel, Switzerland. This article is an open access article distributed under the terms and conditions of the Creative Commons Attribution (CC BY) license (http://creativecommons.org/licenses/by/4.0/).
Share and Cite
MDPI and ACS Style
Akamatsu, T.; Yamamoto, K. Suitability Analysis for the Emergency Shelters Allocation after an Earthquake in Japan. Geosciences 2019, 9, 336. https://doi.org/10.3390/geosciences9080336
AMA Style
Akamatsu T, Yamamoto K. Suitability Analysis for the Emergency Shelters Allocation after an Earthquake in Japan. Geosciences. 2019; 9(8):336. https://doi.org/10.3390/geosciences9080336
Chicago/Turabian StyleAkamatsu, Tetsuya, and Kayoko Yamamoto. 2019. "Suitability Analysis for the Emergency Shelters Allocation after an Earthquake in Japan" Geosciences 9, no. 8: 336. https://doi.org/10.3390/geosciences9080336
Note that from the first issue of 2016, this journal uses article numbers instead of page numbers. See further details here.