Comparison of Statistical Analysis Models for Susceptibility Assessment of Earthquake-Triggered Landslides: A Case Study from 2015 Earthquake in Lefkada Island

 ,
,  ,
,  ,
,  ,
, 

Abstract
:1. Introduction
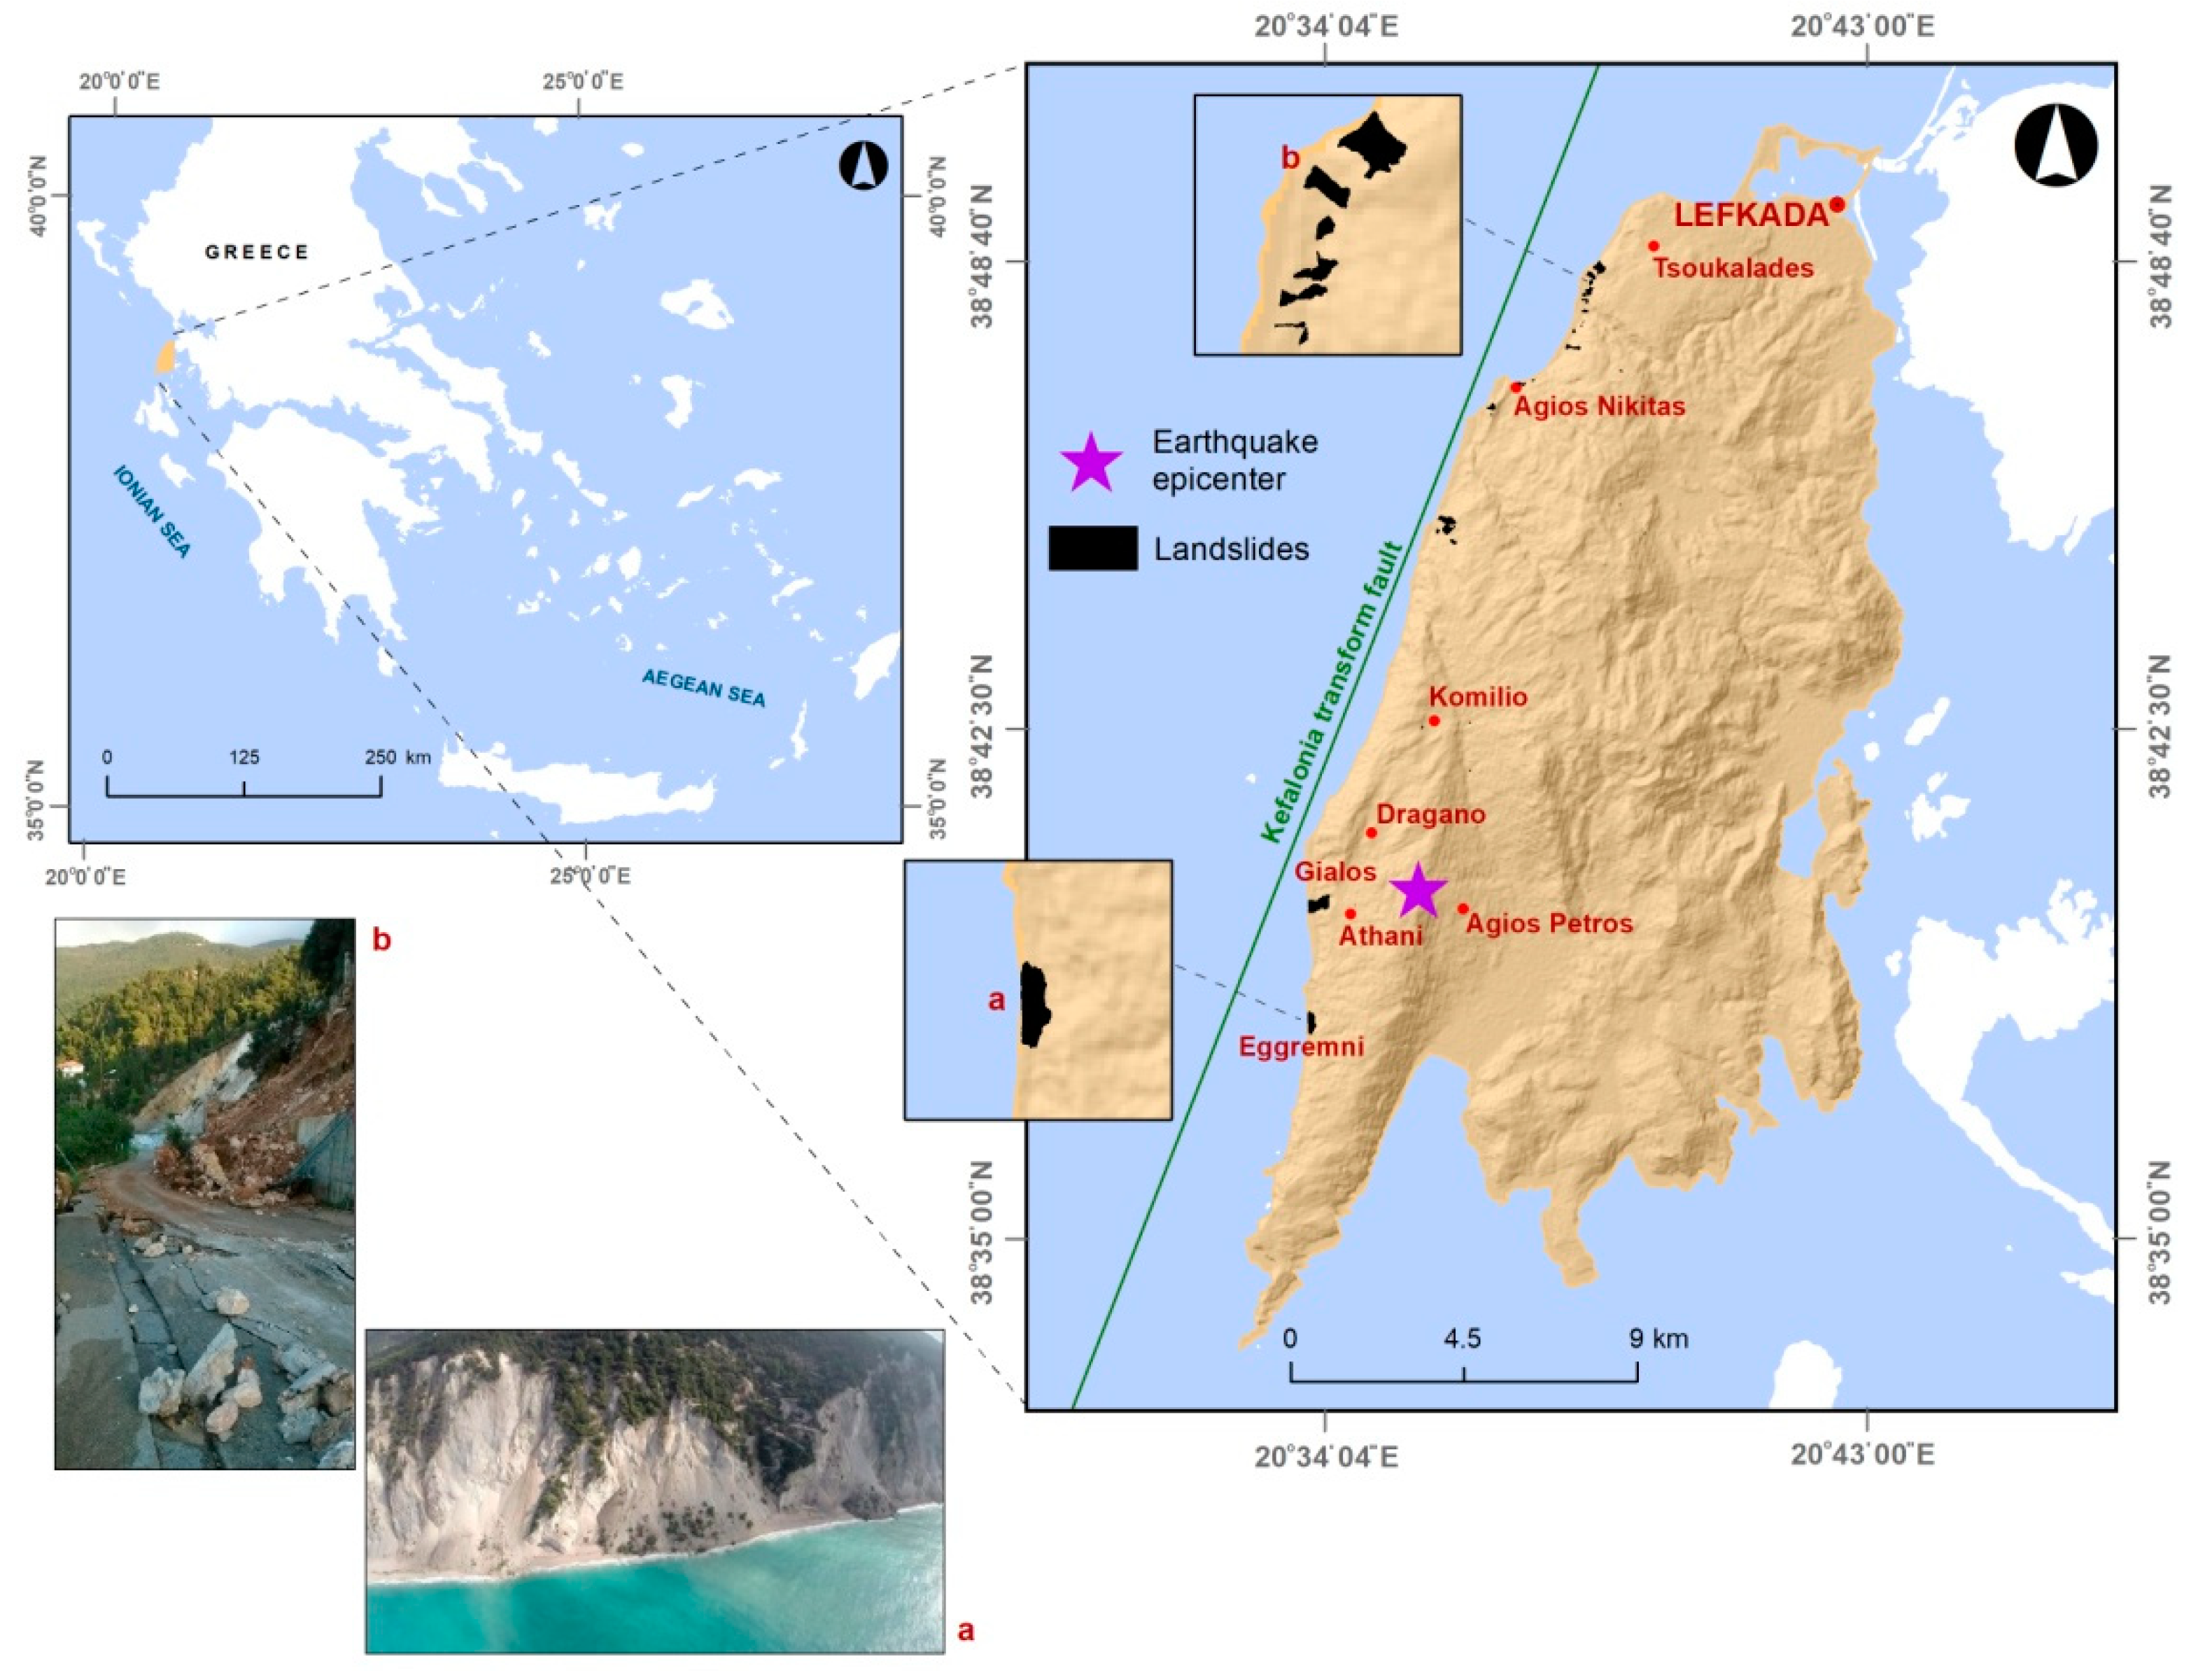
2. Study Area
3. Data
3.1. Landslide Inventory
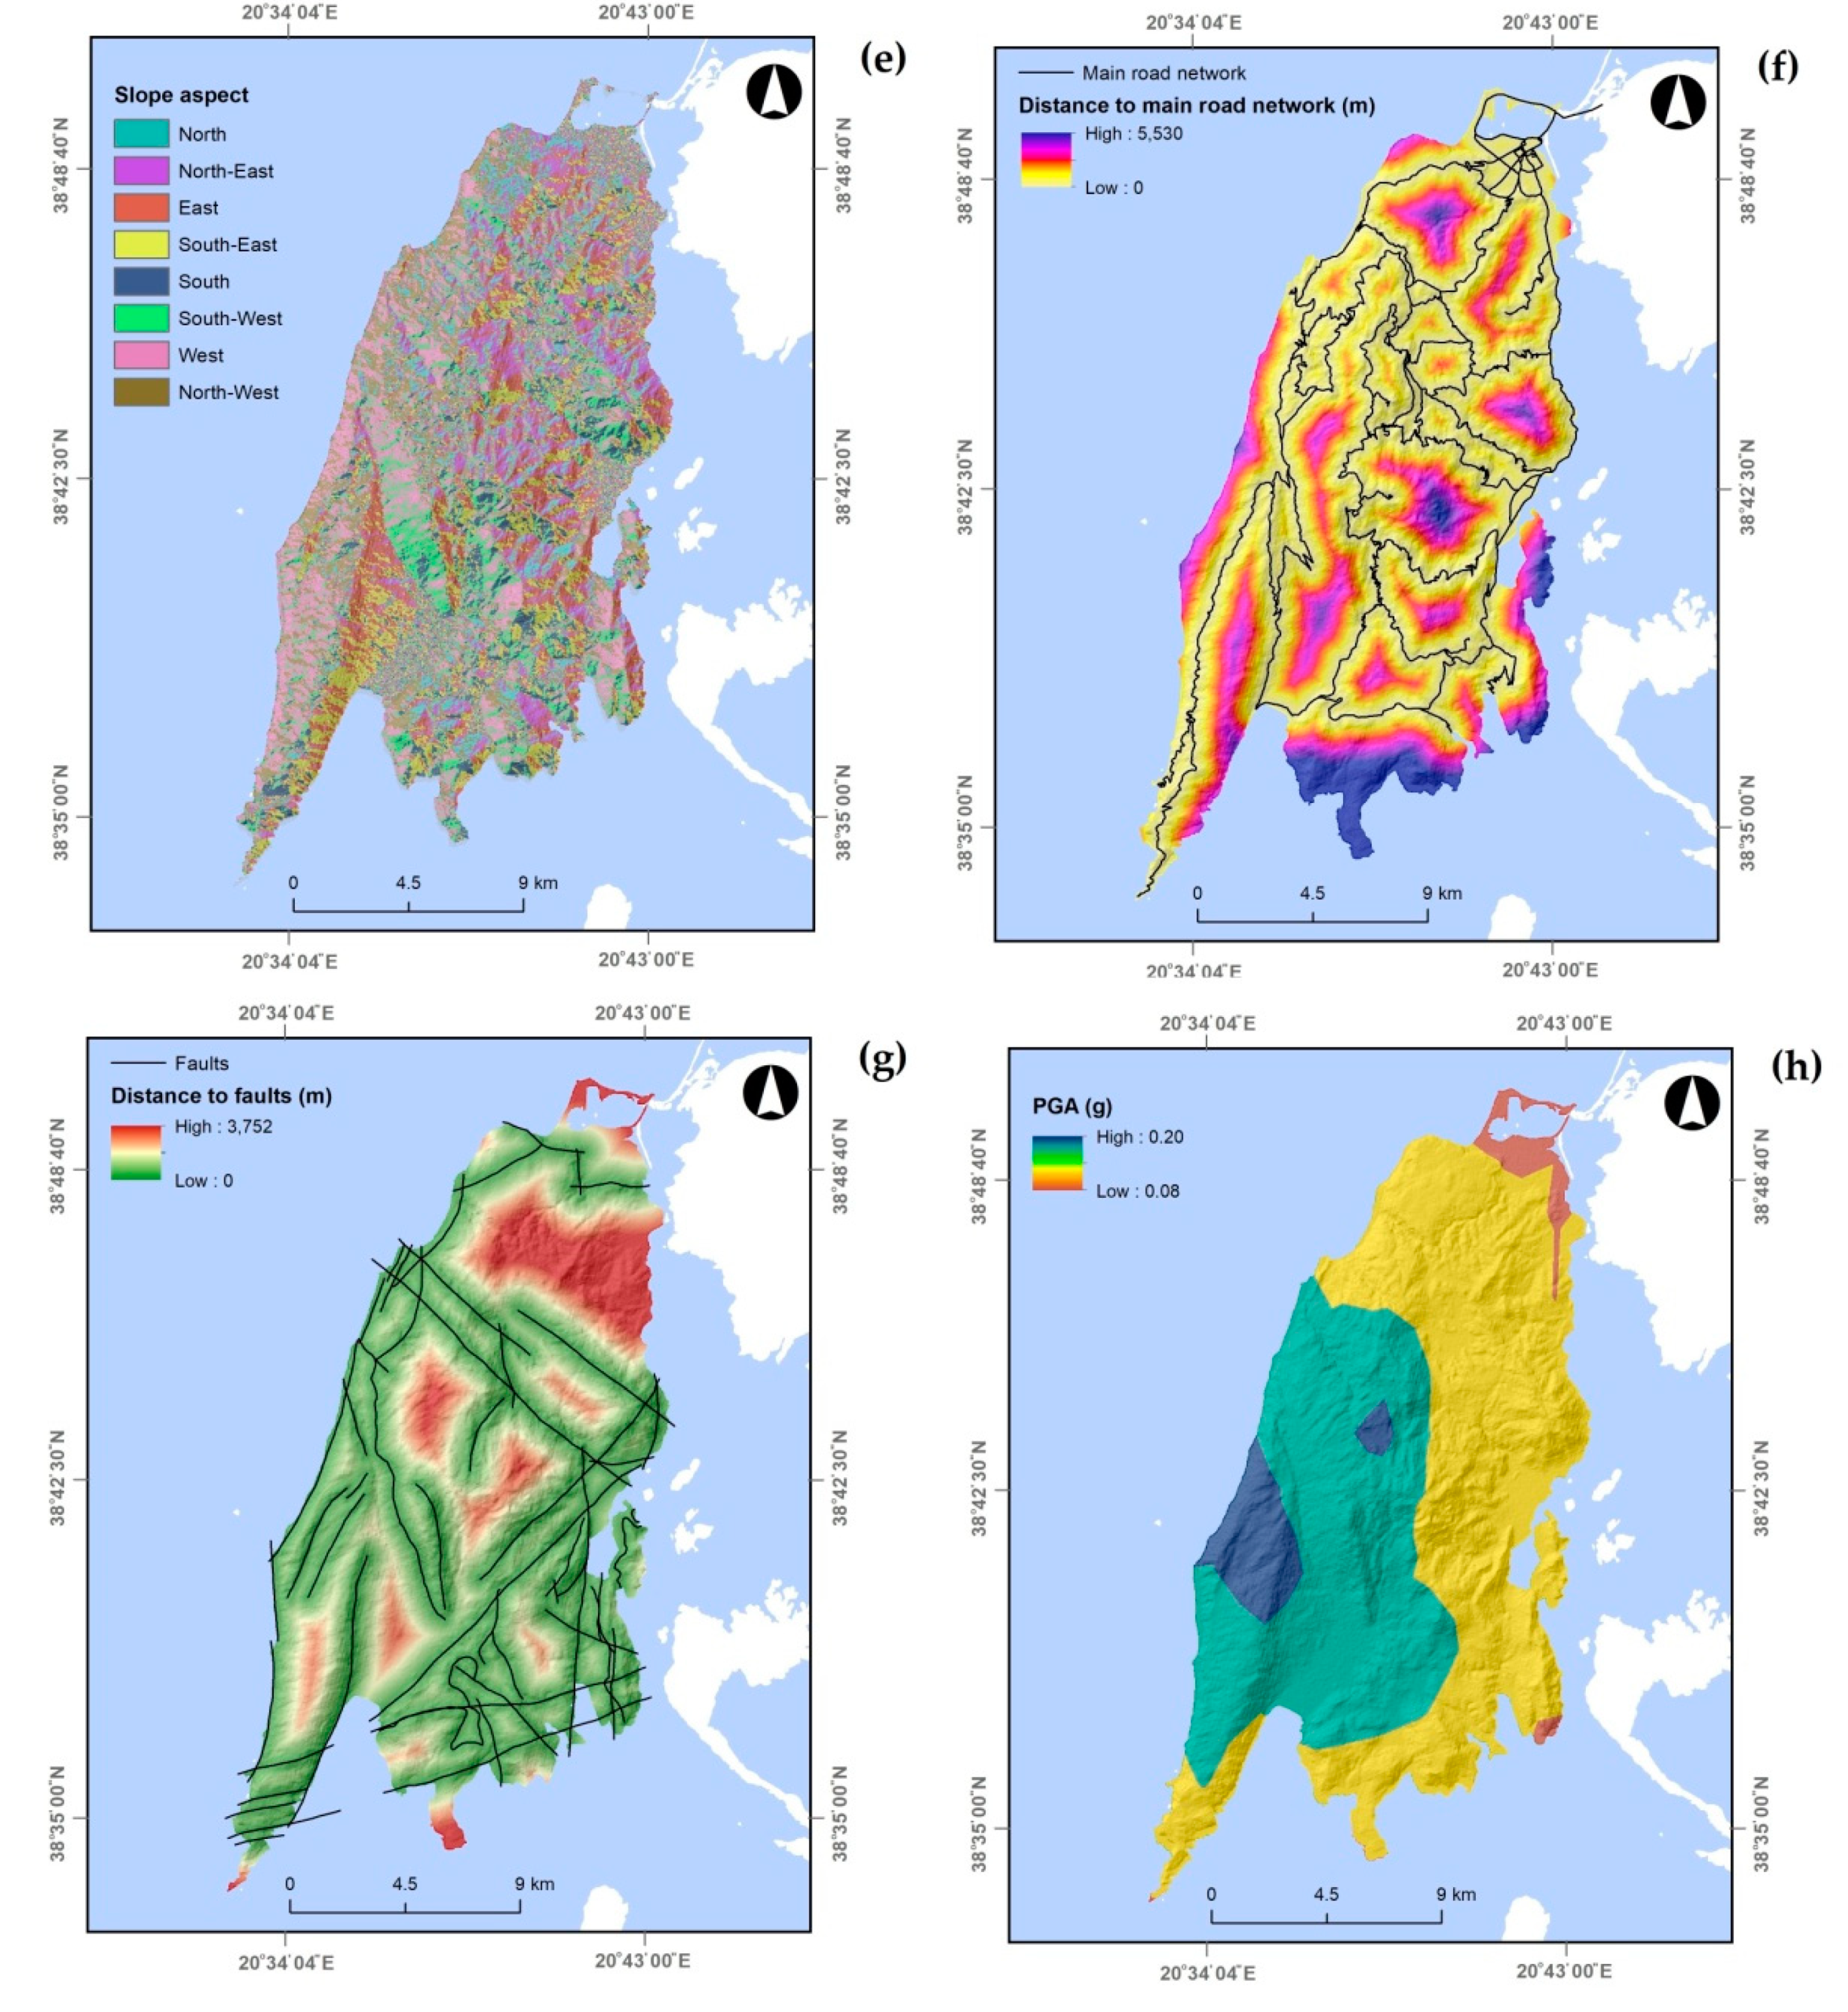
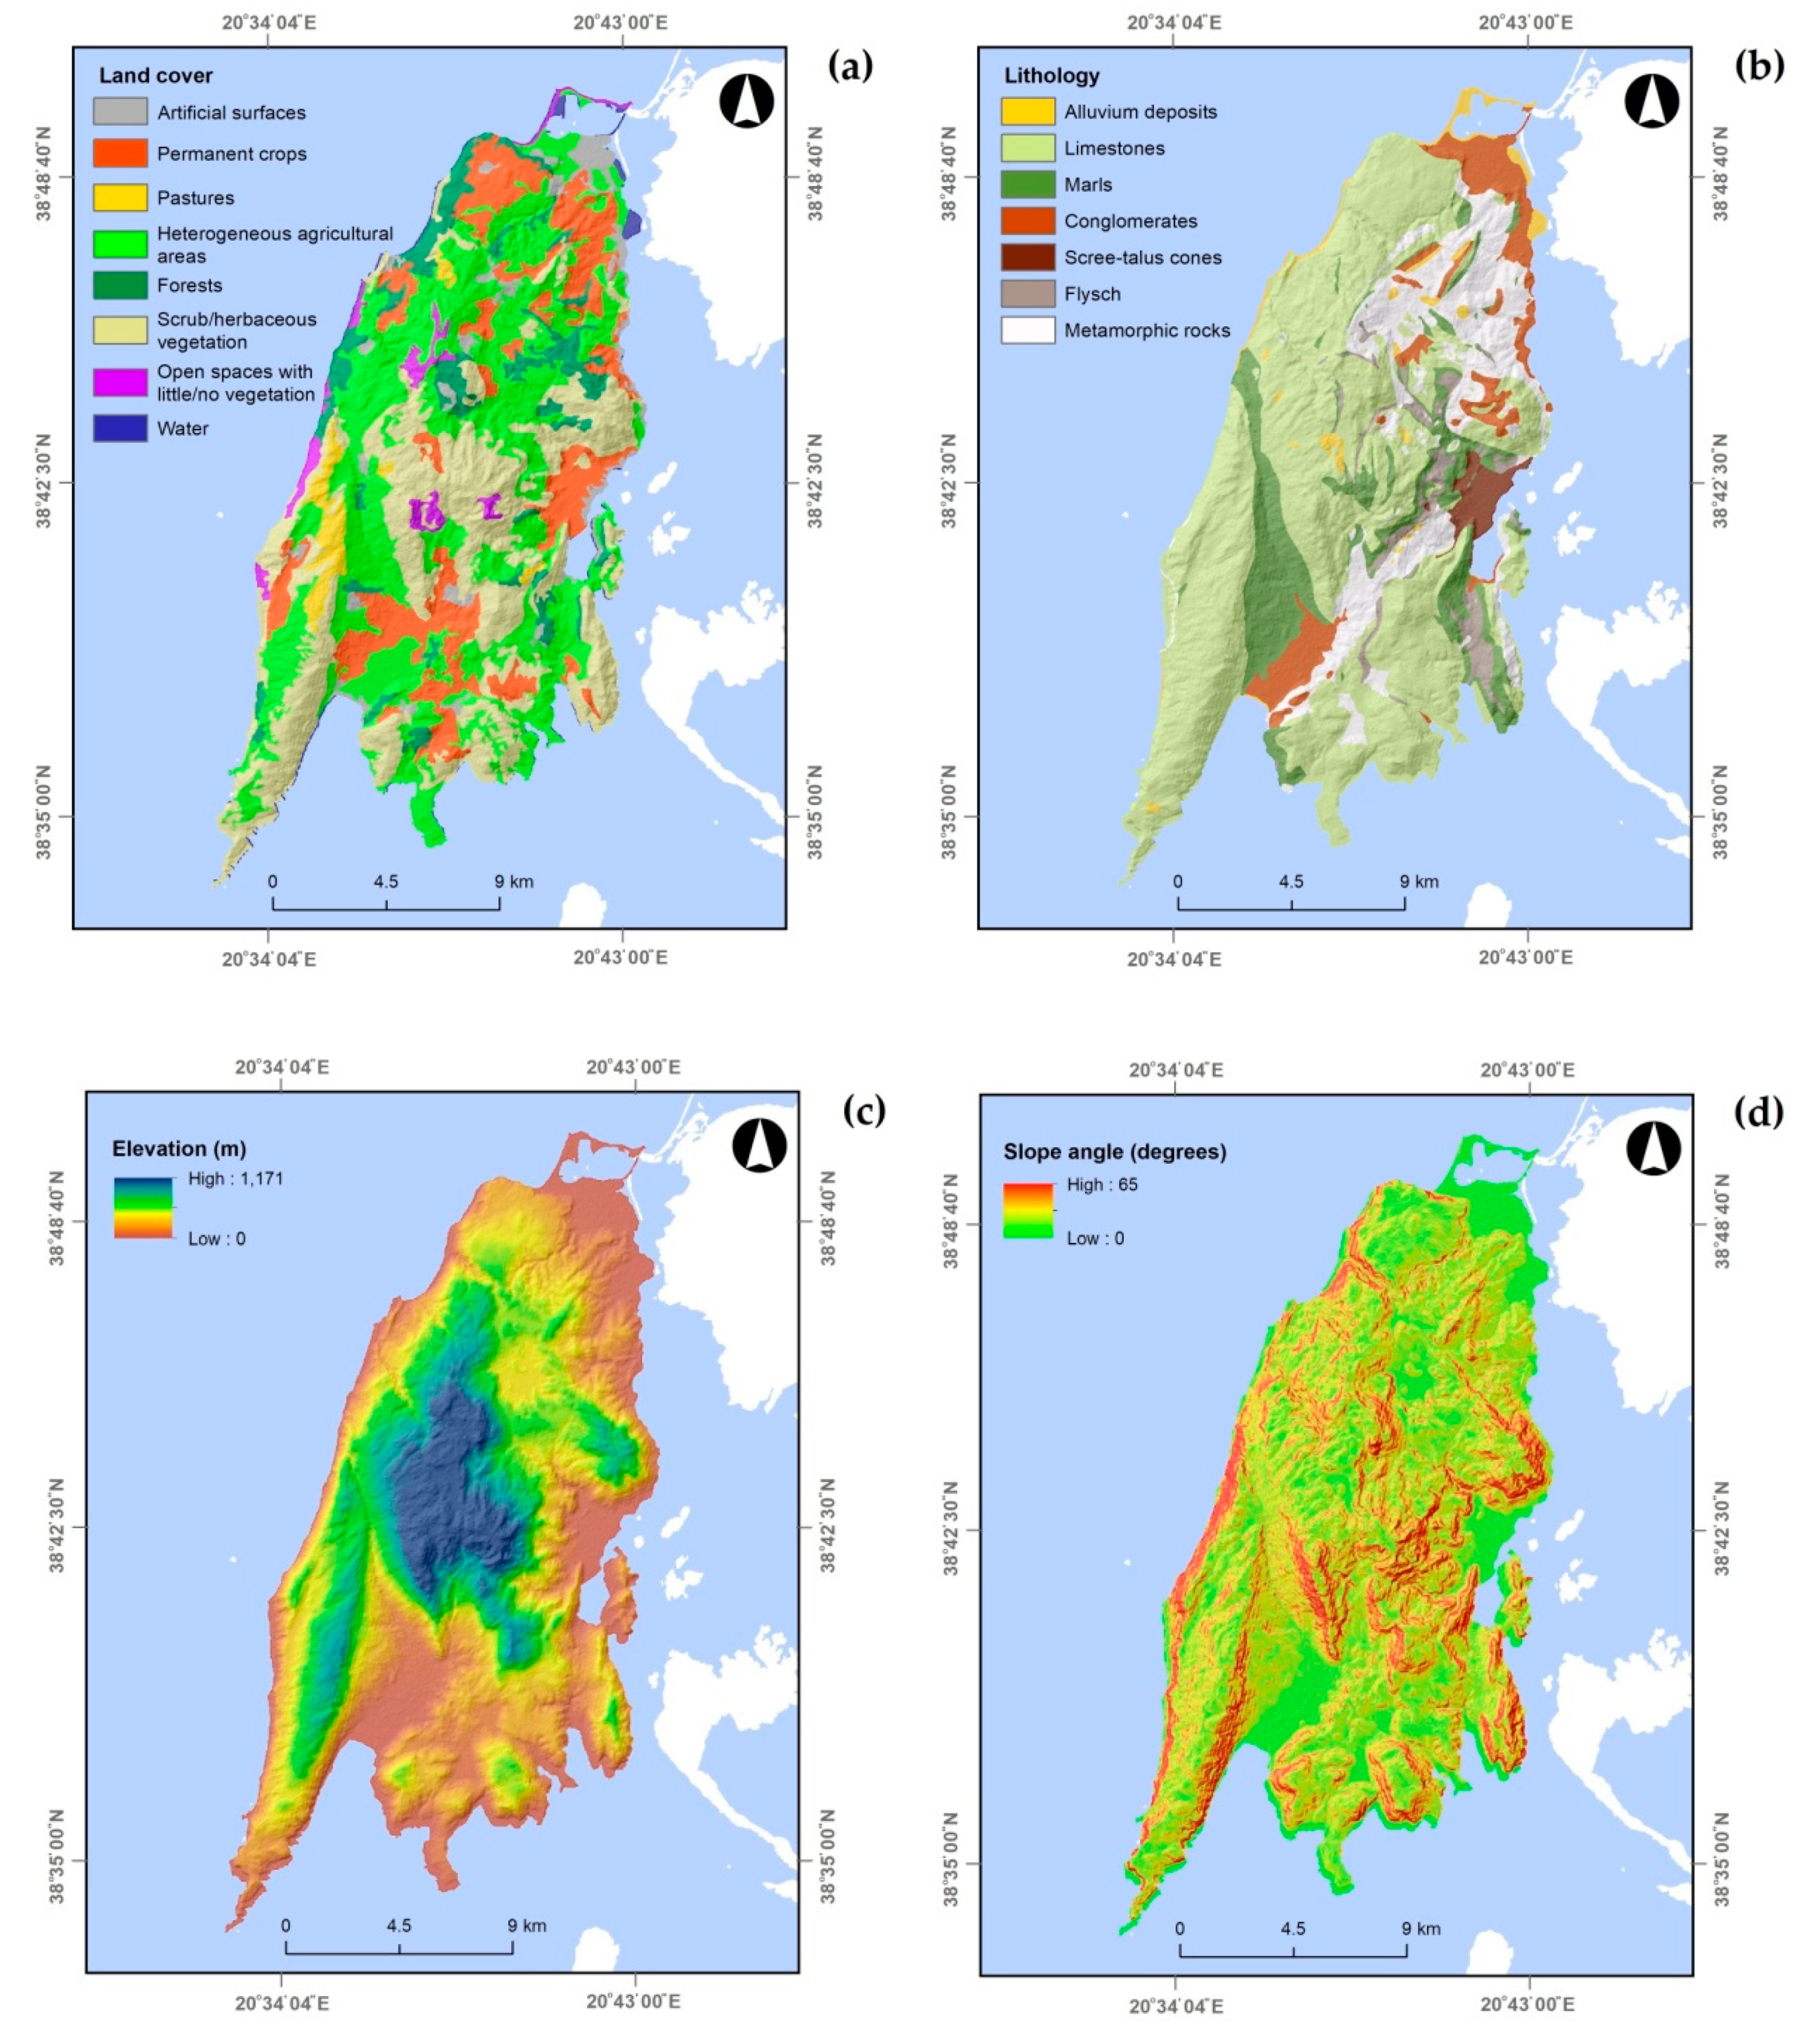
3.2. Geo-Environmental Factors
4. Methodology
4.1. Frequency Ratio (FR) Model
4.2. Logistic Regression (LR) Model
4.3. Data Processing
4.4. Implementation of Models
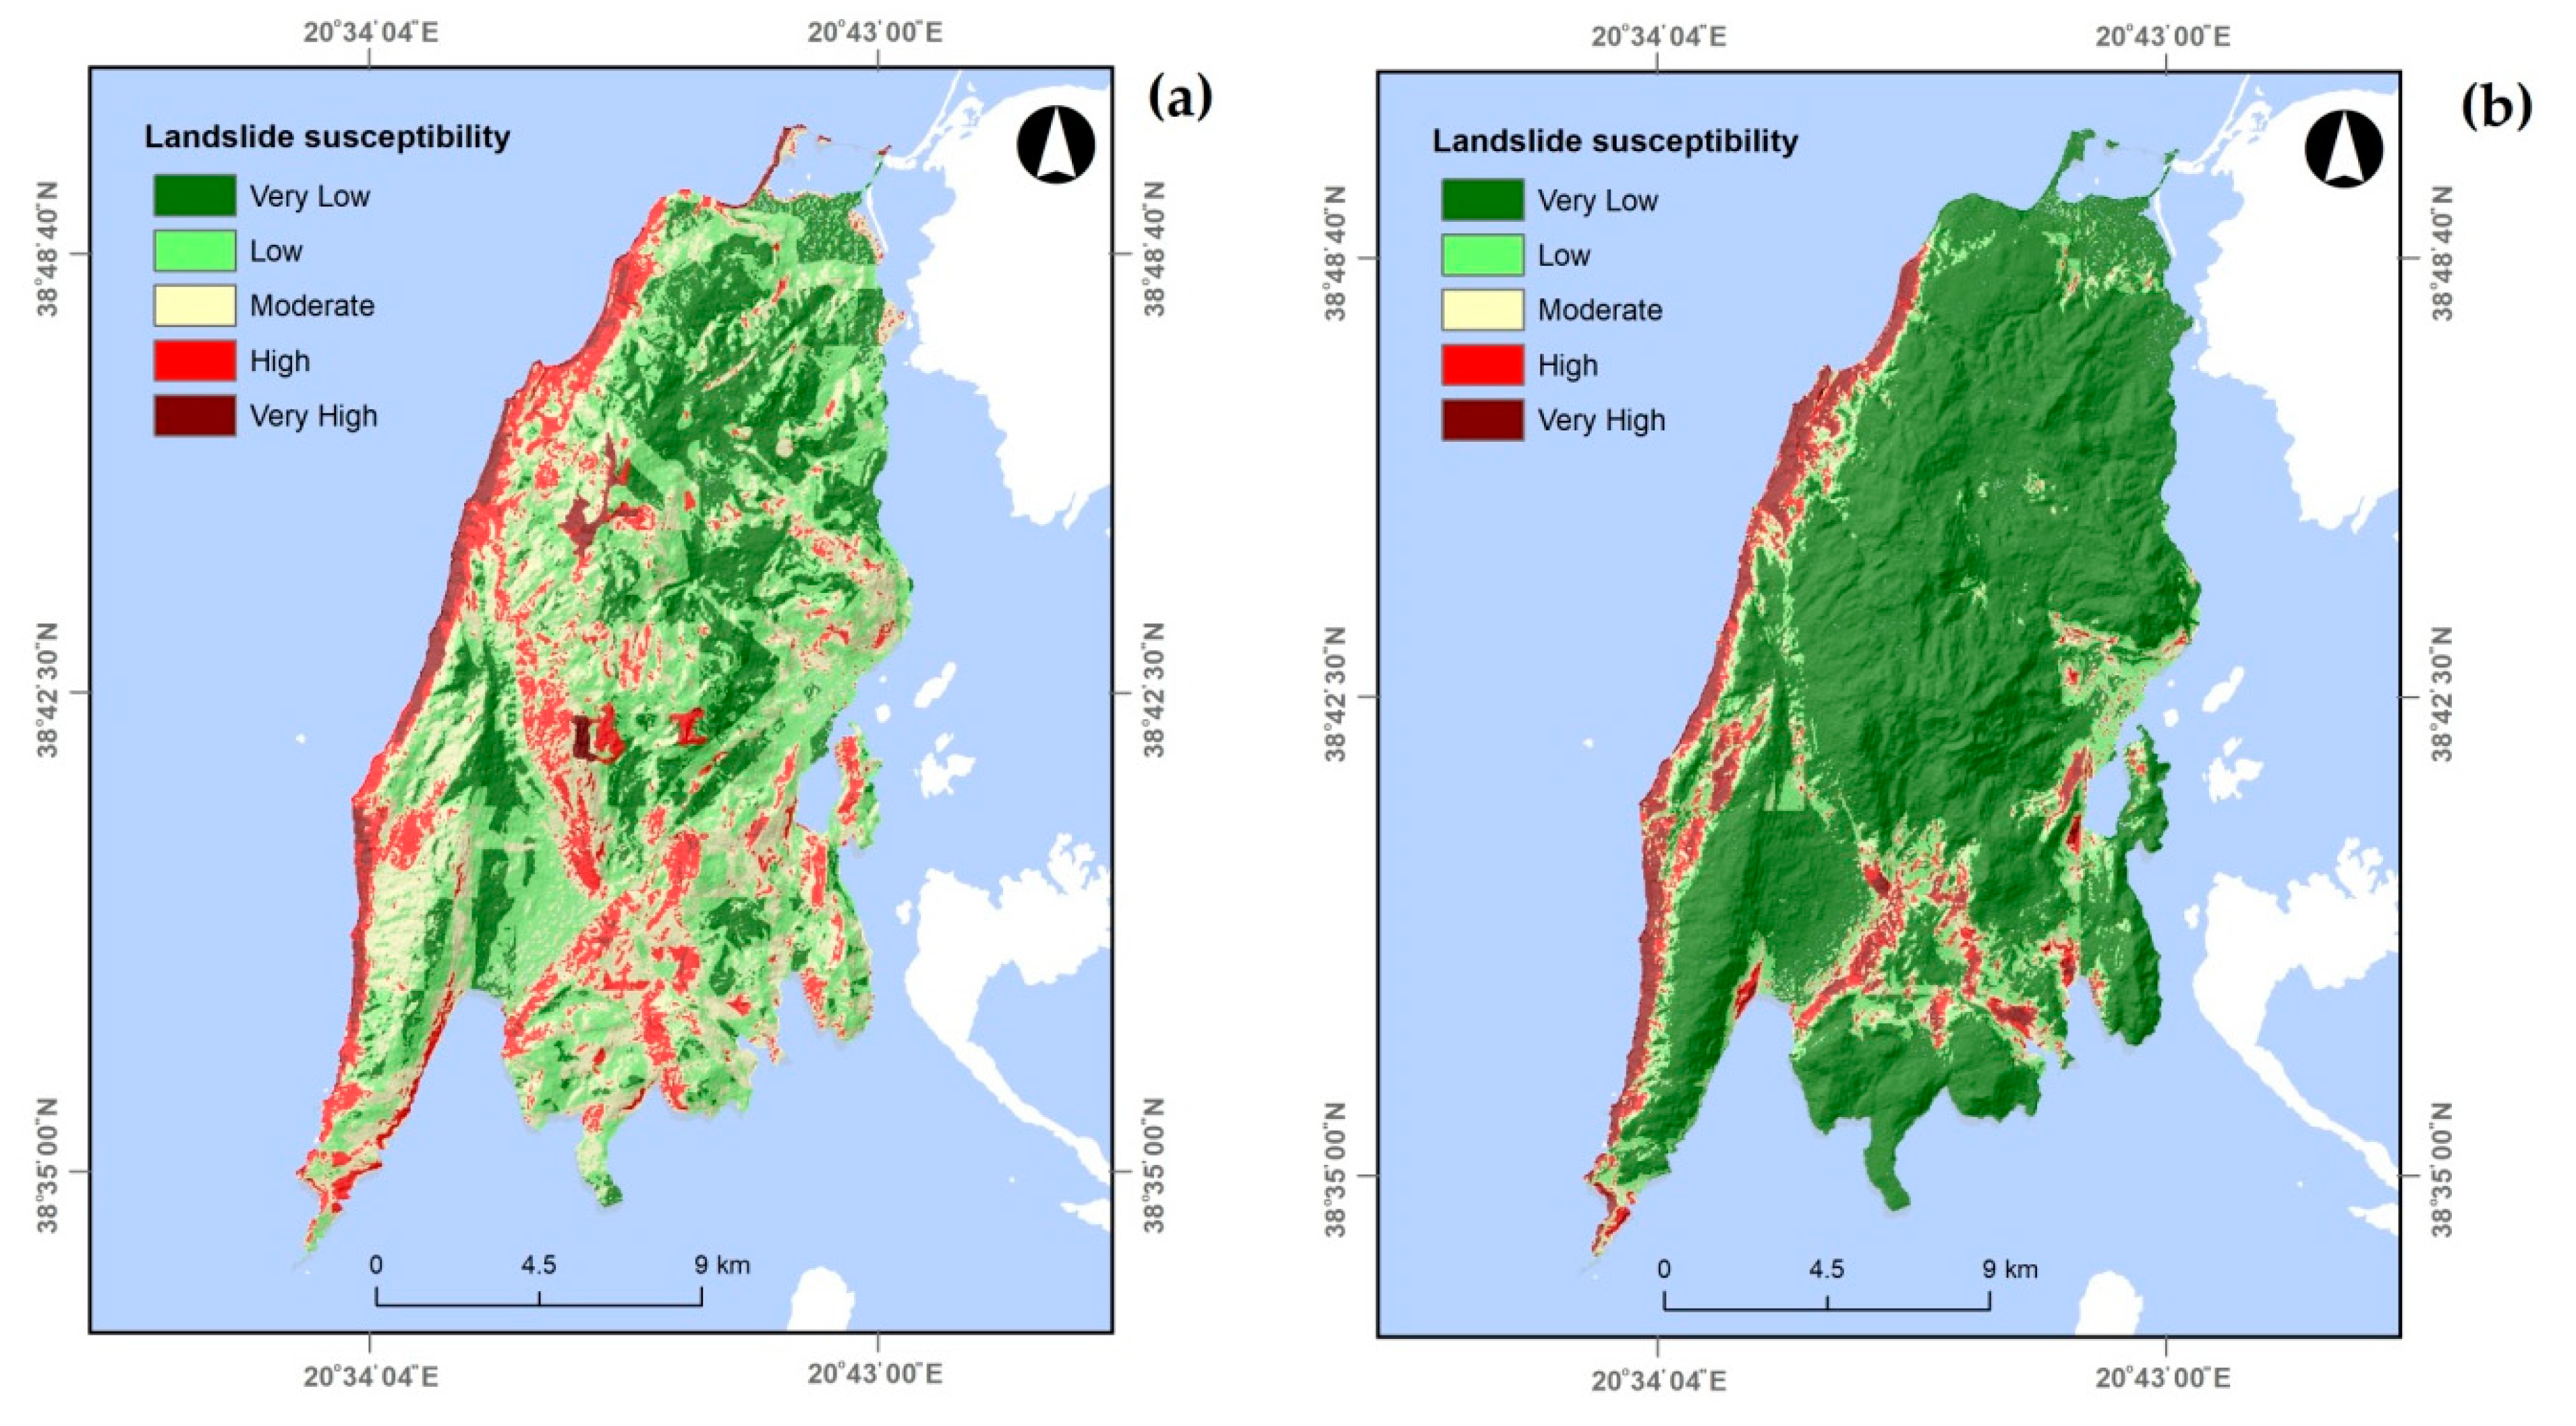
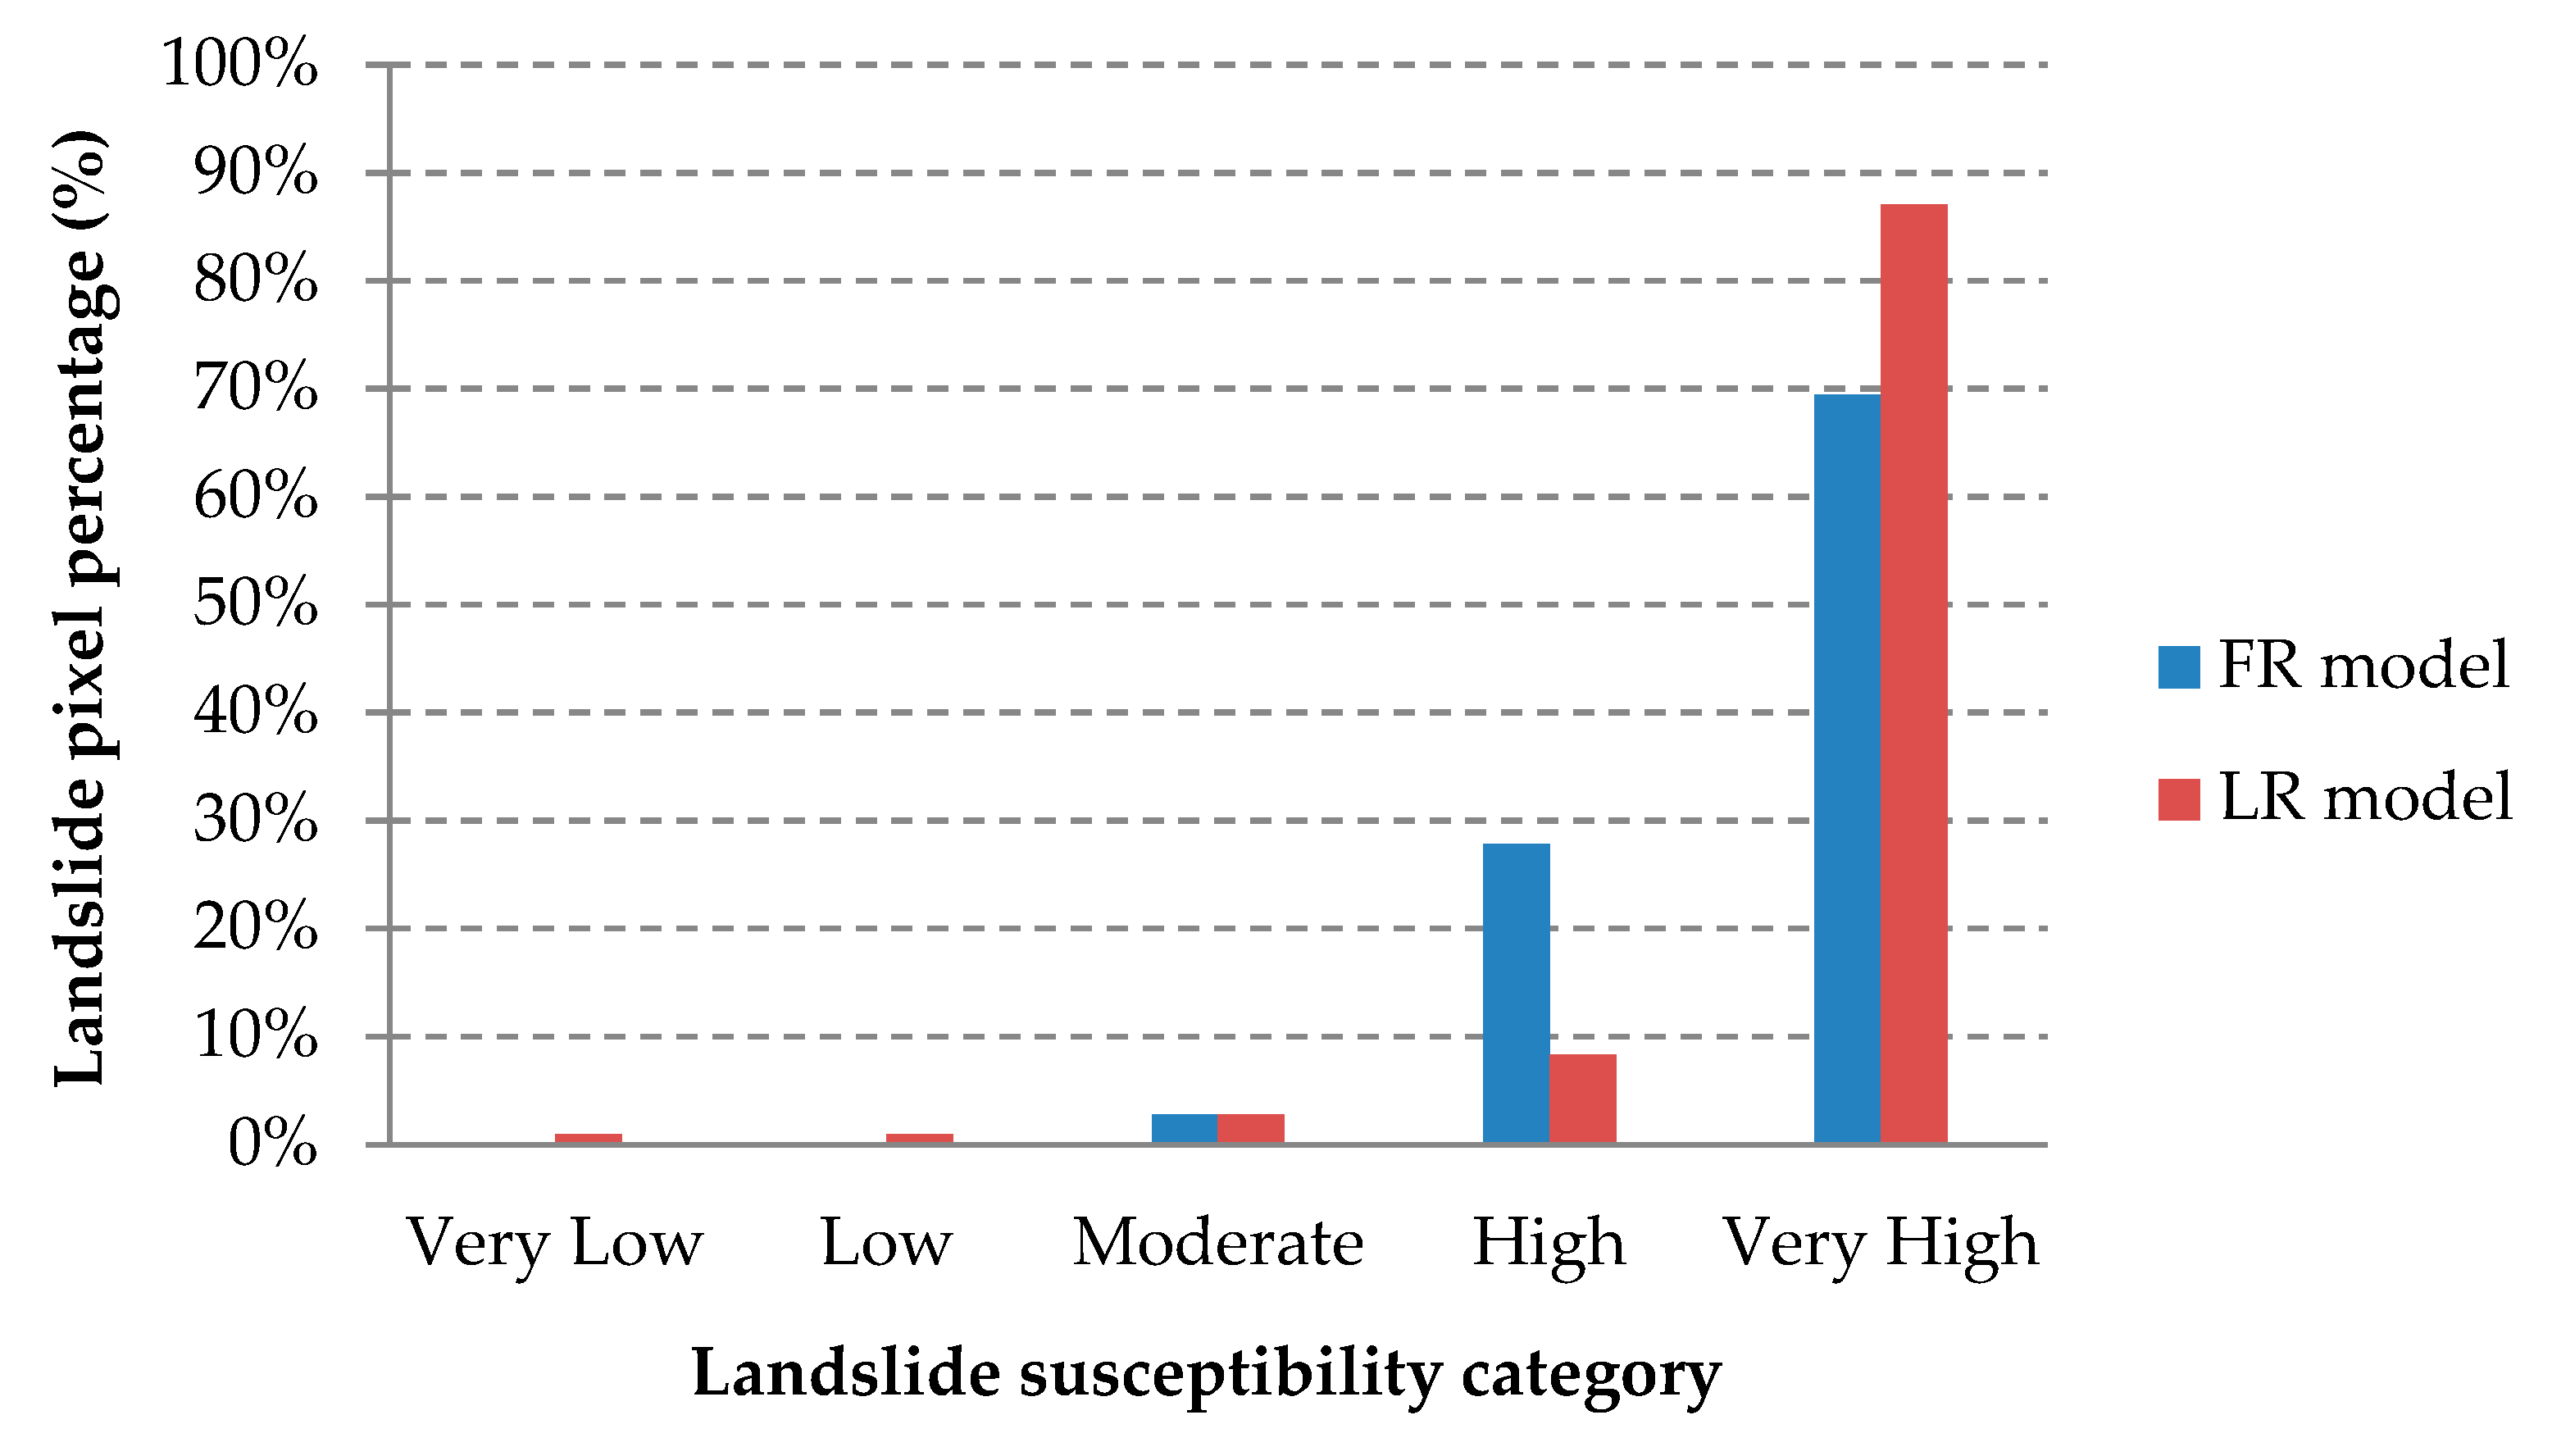
5. Results
Validation of Results
6. Discussion
7. Conclusions and Outlook
Author Contributions
Acknowledgments
Conflicts of Interest
References
- Barlow, J.; Barisin, I.; Rosser, N.; Petley, D.; Densmore, A.; Wrigh, T. Seismically-induced mass movements and volumetric fluxes resulting from the 2010 Mw = 7.2 earthquake in the Sierra Cucapah, Mexico. Geomorphology 2015, 230, 138–145. [Google Scholar] [CrossRef]
- Bai, S.; Wang, J.; Zhang, Z.; Cheng, C. Combined landslide susceptibility mapping after Wenchuan earthquake at the Zhouqu segment in the Bailongjiang Basin, China. Catena 2012, 99, 18–25. [Google Scholar] [CrossRef]
- Xu, C.; Xu, X.; Dai, F.; Saraf, A.K. Comparison of different models for susceptibility mapping of earthquake triggered landslides related with the 2008 Wenchuan earthquake in China. Comput. Geosci. 2012, 46, 317–329. [Google Scholar] [CrossRef]
- Listo, F.D.L.R.; Carvalho Vieira, B. Mapping of risk and susceptibility of shallow-landslide in the city of Sao Paulo, Brazil. Geomorphology 2012, 169–170, 30–44. [Google Scholar] [CrossRef]
- Avtar, R.; Singh, C.K.; Singh, G.; Verma, R.L.; Mukherjee, S.; Sawada, H. Landslide susceptibility zonation study using remote sensing and GIS technology in the Ken-Betwa River Link area, India. Bull. Eng. Geol. Environ. 2011, 70, 595–606. [Google Scholar] [CrossRef]
- Mandal, B.; Mandal, S. Analytical hierarchy process (AHP) based landslide susceptibility mapping of Lish river basin of eastern Darjeeling Himalaya, India. Adv. Space Res. 2018, 62, 3114–3132. [Google Scholar] [CrossRef]
- Vieira, B.C.; Fernandes, N.F.; Filho, O.A.; Martins, T.D.; Montgomery, D.R. Assessing shallow landslide hazards using the TRIGRS and SHALSTAB models, Serra do Mar, Brazil. Environ. Earth Sci. 2018, 77, 260. [Google Scholar] [CrossRef]
- Chalkias, C.; Ferentinou, M.; Polykretis, C. GIS-Based Landslide Susceptibility Mapping on the Peloponnese Peninsula, Greece. Geosciences 2014, 4, 176–190. [Google Scholar] [CrossRef] [Green Version]
- Hong, H.; Liu, J.; Tien Bui, D.; Pradhan, B.; Acharya, T.D.; Pham, B.T.; Zhu, A.-X.; Chen, W.; Ahmad, B.B. Landslide susceptibility mapping using J48 Decision Tree with AdaBoost, Bagging and Rotation Forest ensembles in the Guangchang area (China). Catena 2018, 163, 399–413. [Google Scholar] [CrossRef]
- Gorsevski, P.V.; Brown, M.K.; Panter, K.; Onasch, C.M.; Simic, A.; Snyder, J. Landslide detection and susceptibility mapping using LiDAR and an artificial neural network approach: A case study in the Cuyahoga Valley National Park, Ohio. Landslides 2016, 13, 467–484. [Google Scholar] [CrossRef]
- Youssef, A.M.; Al-Kathery, M.; Pradhan, B. Landslide susceptibility mapping at Al-Hasher Area, Jizan (Saudi Arabia) using GIS-based frequency ratio and index of entropy models. Geosci. J. 2015, 19, 113–134. [Google Scholar] [CrossRef]
- Zhao, C.; Chen, W.; Wang, Q.; Wu, Y.; Yang, B. A comparative study of statistical index and certainty factor models in landslide susceptibility mapping: A case study for the Shangzhou District, Shaanxi Province, China. Arab. J. Geosci. 2015, 8, 9079–9088. [Google Scholar] [CrossRef]
- Piacentini, D.; Devoto, S.; Mantovani, M.; Pasuto, A.; Prampolini, M.; Soldati, M. Landslide susceptibility modeling assisted by Persistent Scatterers Interferometry (PSI): An Example from the Northwestern Coast of Malta. Nat. Hazards 2015, 78, 681–697. [Google Scholar] [CrossRef]
- Basu, Τ.; Pal, S. Identification of landslide susceptibility zones in Gish River basin, West Bengal, India. Georisk 2018, 12, 14–28. [Google Scholar] [CrossRef]
- Dagdelenler, G.; Nefeslioglu, H.A.; Gokceoglu, C. Modification of seed cell sampling strategy for landslide susceptibility mapping: An application from the Eastern part of the Gallipoli Peninsula (Canakkale, Turkey). Bull. Eng. Geol. Environ. 2016, 75, 575–590. [Google Scholar] [CrossRef]
- Reichenbach, P.; Busca, C.; Mondini, A.C.; Rossi, M. The Influence of Land Use Change on Landslide Susceptibility Zonation: The Briga Catchment Test Site (Messina, Italy). Environ. Manag. 2014, 54, 1372–1384. [Google Scholar] [CrossRef] [PubMed] [Green Version]
- Soeters, R.; van Westen, C.J. Slope Instability Recognition, Analysis and Zonation. In Landslides, Investigation and Mitigation; Turner, A.K., Schuster, R.L., Eds.; National Academy Press: Washington, DC, USA, 1996; pp. 129–177. [Google Scholar]
- Baeza, C.; Corominas, J. Assessment of shallow landslide susceptibility by means of multivariate statistical techniques. Earth Surf. Process. Landf. 2001, 26, 1251–1263. [Google Scholar] [CrossRef]
- Papathanassiou, G.; Vakaniotis, S.; Ganas, A.; Grendas, N.; Kollia, E. The November 17th, 2015 Lefkada (Greece) strike-slip earthquake: Field mapping of generated failures and assessment of macroseismic intensity ESI-07. Eng. Geol. 2016, 220, 13–30. [Google Scholar] [CrossRef]
- Kazantzidou-Firtinidou, D.; Kassaras, I.; Tonna, S.; Ganas, A.; Vintzileou, E.; Chesi, C. The November 2015 Mw6.4 earthquake effects in Lefkas Island. In Proceedings of the 1st International Conference on Natural Hazards and Infrastructure, Chania, Greece, 28–30 June 2016; pp. 1–10. [Google Scholar]
- Grendas, N.; Marinos, V.; Papathanassiou, G.; Ganas, A.; Valkaniotis, S. Engineering geological mapping of earthquake-induced landslides in South Lefkada Island, Greece: Evaluation of the type and characteristics of the slope failures. Environ. Earth Sci. 2018, 77, 425. [Google Scholar] [CrossRef]
- Valkaniotis, S.; Papathanassiou, G.; Ganas, A. Mapping an earthquake-induced landslide based on UAV imagery; case study of the 2015 Okeanos landslide, Lefkada, Greece. Eng. Geol. 2018, 245, 141–152. [Google Scholar] [CrossRef]
- Papathanassiou, G.; Valkaniotis, S.; Ganas, A.; Pavlides, S. GIS-based statistical analysis of the spatial distribution of earthquake-induced landslides in the island of Lefkada, Ionian Islands, Greece. Landslides 2013, 10, 771–783. [Google Scholar] [CrossRef]
- Wang, L.-J.; Guo, M.; Sawada, K.; Lin, J.; Zhang, J. A comparative study of landslide susceptibility maps using logistic regression, frequency ratio, decision tree, weights of evidence and artificial neural network. Geosci. J. 2016, 20, 117–136. [Google Scholar] [CrossRef]
- Aditian, A.; Kubota, T.; Shinohara, Y. Comparison of GIS-based landslide susceptibility models using frequency ratio, logistic regression, and artificial neural network in a tertiary region of Ambon, Indonesia. Geomorphology 2018, 318, 101–111. [Google Scholar] [CrossRef]
- Demir, G. Landslide susceptibility mapping by using statistical analysis in the North Anatolian Fault Zone (NAFZ) on the northern part of Suşehri Town, Turkey. Nat. Hazards 2018, 92, 133–154. [Google Scholar] [CrossRef]
- Mondal, S.; Mandal, S. Landslide susceptibility and risk: A micro level study from the Balason River basin in Darjeeling Himalaya. Arab. J. Geosci. 2018, 11, 197. [Google Scholar] [CrossRef]
- Karababa, F.S.; Pomonis, A. Damage data analysis and vulnerability estimation following the August 14, 2003 Lefkada Island, Greece, Earthquake. Bull. Earthq. Eng. 2011, 9, 1015–1046. [Google Scholar] [CrossRef]
- Cruden, D.M.; Varnes, D.J. Landslide types and processes. In Landslides: Investigation and Mitigation; Turner, A.K., Schuster, R.L., Eds.; National Academy Press: Washington, DC, USA, 1996; pp. 36–75. [Google Scholar]
- Landslide Inventory Database, Laboratory of Engineering Geology, University of Patras. Available online: http://www.geoarch.gr/ (accessed on 5 September 2017).
- Ayalew, L.; Yamagishi, H. The application of GIS-based logistic regression for landslide susceptibility mapping in the Kakuda-Yahiko Mountains, Central Japan. Geomorphology 2005, 65, 15–31. [Google Scholar] [CrossRef]
- Glade, T. Landslide occurrence as a response to land use change: A review of evidence from New Zealand. Catena 2003, 51, 297–314. [Google Scholar] [CrossRef]
- Heymann, Y.; Steenmans, C.; Croisille, G.; Bossard, M. CORINE Land Cover Project: Technical Guide; European Commission, Directorate General Environment, Nuclear Safety and Civil Protection, ECSC-EEC-EAEC: Brussels, Belgium, 1994. [Google Scholar]
- Carrara, A.; Cardinali, M.; Detti, R.; Guzzetti, F.; Pasqui, V.; Reichenbach, P. GIS techniques and statistical models in evaluating landslide hazard. Earth Surf. Process. Landf. 1991, 16, 427–445. [Google Scholar] [CrossRef]
- Dai, F.C.; Lee, C.F. Landslide characteristics and slope instability modeling using GIS, Lantau Island, Hong Kong. Geomorphology 2002, 42, 213–228. [Google Scholar] [CrossRef]
- Margaris, B.; Kalogeras, I.; Papaioannou, C.; Savvaidis, A.; Theodoulidis, N. Evaluation of the national strong motion network in Greece: Deployment, data-processing and site characterization. Bull. Earthq. Eng. 2014, 12, 237–254. [Google Scholar] [CrossRef]
- Choi, J.; Oh, H.-J.; Lee, H.-J.; Lee, C.; Lee, S. Combining landslide susceptibility maps obtained from frequency ratio, logistic regression, and artificial neural network models using ASTER images and GIS. Eng. Geol. 2012, 124, 12–23. [Google Scholar] [CrossRef]
- Atkinson, P.M.; Massari, R. Generalized linear modeling of susceptibility to landsliding in the central Apennines, Italy. Comput. Geosci 1998, 24, 373–385. [Google Scholar] [CrossRef]
- Kundu, S.; Saha, A.K.; Sharma, D.C.; Pant, C.C. Remote Sensing and GIS Based Landslide Susceptibility Assessment using Binary Logistic Regression Model: A Case Study in the Ganeshganga Watershed, Himalayas. J. Indian Soc. Remote Sens. 2013, 41, 697–709. [Google Scholar] [CrossRef]
- Jenks, G.F. Optimal Data Classification for Choropleth Maps; University of Kansas: Lawrence, KS, USA, 1977. [Google Scholar]
- Pourghasemi, H.R.; Gayen, A.; Park, S.; Lee, C.-W.; Lee, S. Assessment of Landslide-Prone Areas and TheirZonation Using Logistic Regression, LogitBoost, and NaïveBayes Machine-Learning Algorithms. Sustainability 2018, 10, 3697. [Google Scholar] [CrossRef]
- Remondo, J.; González-Díez, A.; Díaz de Terán, J.R.; Cendrero, A. Landslide susceptibility models utilizing spatial data analysis techniques: A case study from the Lower Deba Valley, Guipúzcoa (Spain). Nat. Hazards 2003, 30, 267–279. [Google Scholar] [CrossRef]
- Pradhan, A.M.S.; Kim, Y.-T. GIS-based landslide susceptibility model considering effective contributing area for drainage time. Geocarto Int. 2018, 33, 810–829. [Google Scholar] [CrossRef]
- Zhou, C.; Yin, K.; Cao, Y.; Ahmed, B.; Li, Y.; Catani, F.; Pourghasemi, H.R. Landslide susceptibility modeling applying machine learning methods: A case study from Longju in the Three Gorges Reservoir area, China. Comput. Geosci. 2018, 112, 23–37. [Google Scholar] [CrossRef] [Green Version]
- Romer, C.; Ferentinou, M. Shallow landslide susceptibility assessment in a semiarid environment—A Quaternary catchment of KwaZulu-Natal, South Africa. Eng. Geol. 2016, 201, 29–44. [Google Scholar] [CrossRef]
- Fawcett, T. An introduction to ROC analysis. Pattern Recognit. Lett. 2006, 27, 861–874. [Google Scholar] [CrossRef]
- Mahdadi, F.; Boumezbeur, A.; Hadji, R.; Kanungo, D.P.; Zahri, F. GIS-based landslide susceptibility assessment using statistical models: A case study from Souk Ahras province, N-E Algeria. Arab. J. Geos. 2018, 11, 476. [Google Scholar] [CrossRef]
- Achour, Y.; Garçia, S.; Cavaleiro, V. GIS-based spatial prediction of debris flows using logistic regression and frequency ratio models for Zêzere River basin and its surrounding area, Northwest Covilhã, Portugal. Arab. J. Geos. 2018, 11, 550. [Google Scholar] [CrossRef]
- Youssef, A.M.; Pradhan, B.; Jebur, M.N.; El-Harbi, H.M. Landslide susceptibility mapping using ensemble bivariate and multivariate statistical models in Fayfa area, Saudi Arabia. Environ. Earth Sci. 2015, 73, 3745–3761. [Google Scholar] [CrossRef]


| Year | Occurrence | Total Deaths | Injured | Affected | Homeless | Total Affected | Total Damage (US$) |
|---|---|---|---|---|---|---|---|
| 1970–1979 | 45 | 7217 | 1041 | 94,019 | 3100 | 98,160 | 124,166 |
| 1980–1989 | 78 | 5647 | 4250 | 860,691 | 2,520,332 | 3,385,273 | 1,030,141 |
| 1990–1999 | 93 | 5104 | 977 | 590,027 | 1,170,860 | 1,761,864 | 1,695,190 |
| 2000–2009 | 147 | 6182 | 1276 | 1,119,597 | 193,539 | 1,314,412 | 288,107 |
| 2010–2019 | 126 | 6579 | 1304 | 2,543,562 | 84,378 | 2,629,244 | 1,633,414 |
| Factors and Their Categories | FR Model | LR Model | ||||
|---|---|---|---|---|---|---|
| Number of Total Pixels | Number of Landslide Pixels | FR Value | TOL | VIF | Coefficients | |
| Elevation (m) | 0.615 | 1.627 | −0.015 | |||
| (1) 0–134 | 96,907 | 315 | 2.78 | |||
| (2) 135–306 | 86,741 | 111 | 1.09 | |||
| (3) 307–501 | 95,228 | 4 | 0.04 | |||
| (4) 502–754 | 58,042 | 4 | 0.06 | |||
| (5) 755–1171 | 33,779 | 0 | 0 | |||
| Slope Angle (Degrees) | 0.898 | 1.113 | 0.052 | |||
| (1) 0–8 | 97,552 | 56 | 0.49 | |||
| (2) 9–16 | 100,441 | 102 | 0.87 | |||
| (3) 17–25 | 85,991 | 95 | 0.94 | |||
| (4) 26–35 | 58,647 | 93 | 1.35 | |||
| (5) 35–65 | 28,066 | 88 | 2.68 | |||
| Slope Aspect | 0.670 | 1.493 | 4.709 | |||
| (1) North | 34,034 | 9 | 0.22 | |||
| (2) North-East | 40,218 | 6 | 0.12 | |||
| (3) East | 56,505 | 0 | 0 | |||
| (4) South-East | 49,155 | 3 | 0.05 | |||
| (5) South | 34,312 | 4 | 0.10 | |||
| (6) South-West | 41,160 | 19 | 0.39 | |||
| (7) West | 60,759 | 243 | 3.35 | |||
| (8) North-West | 46,861 | 150 | 2.68 | |||
| Distance to Main Road network (m) | 0.850 | 1.177 | −0.004 | |||
| (1) 0−347 | 179,992 | 166 | 0.79 | |||
| (2) 348−846 | 111,966 | 218 | 1.66 | |||
| (3) 847−1,648 | 63,214 | 50 | 0.68 | |||
| (4) 1,649−3,231 | 12,889 | 0 | 0 | |||
| (5) 3,232−5,530 | 2611 | 0 | 0 | |||
| Distance to Faults (m) | 0.627 | 1.595 | −0.002 | |||
| (1) 0−324 | 162,088 | 425 | 2.24 | |||
| (2) 325−765 | 101,455 | 6 | 0.05 | |||
| (3) 766−1,354 | 62,190 | 1 | 0.01 | |||
| (4) 1,355−2,163 | 29,937 | 2 | 0.06 | |||
| (5) 2,164−3,752 | 15,002 | 0 | 0 | |||
| PGA (g) | 0.704 | 1.420 | 60.946 | |||
| (1) 0,08 | 10,895 | 0 | 0 | |||
| (2) 0.09–0.12 | 238,830 | 35 | 0.13 | |||
| (3) 0.13−0.16 | 98,023 | 398 | 3.47 | |||
| (4) 0.17−0.20 | 22,924 | 1 | 0.04 | |||
| Land Cover | 0.816 | 1.225 | 2.948 | |||
| (1) Artificial Surfaces | 14,182 | 9 | 0.54 | |||
| (2) Permanent Crops | 60,462 | 7 | 0.10 | |||
| (3) Pastures | 8997 | 0 | 0 | |||
| (4) Heterogeneous Agricultural Areas | 114,705 | 45 | 0.34 | |||
| (5) Forests | 48,515 | 83 | 1.46 | |||
| (6) Scrub/Herbaceous Vegetation | 107,438 | 241 | 1.92 | |||
| (7) Open Spaces with Little/No Vegetation | 12,907 | 49 | 3.24 | |||
| (8) Water | 3466 | 0 | 0 | |||
| Lithology | 0.822 | 1.216 | 2.274 | |||
| (1) Alluvium Deposits | 12,059 | 41 | 2.89 | |||
| (2) Limestones | 209,228 | 381 | 1.55 | |||
| (3) Marls | 47,455 | 6 | 0.11 | |||
| (4) Conglomerates | 25,303 | 0 | 0 | |||
| (5) Scree-Talus Cones | 6466 | 0 | 0 | |||
| (6) Flysch | 12,736 | 1 | 0.07 | |||
| (7) Metamorphic Rocks | 55,804 | 5 | 0.08 | |||
| FR | LR | ||||
|---|---|---|---|---|---|
| VL (%) | L (%) | M (%) | H (%) | VH (%) | |
| VL | 21 | 1 | – | – | – |
| L | 29 | 4 | 1 | – | – |
| M | 19 | 4 | 3 | 2 | 1 |
| H | 5 | 2 | 1 | 2 | 2 |
| VH | 1 | – | – | – | 2 |
| ROC Analysis Results | FR | LR |
|---|---|---|
| Number of Cases | 216 | 216 |
| Number Correct | 169 | 201 |
| Positive Cases Missed | 0 | 2 |
| Negative Cases Missed | 47 | 13 |
| Accuracy (%) | 78.2 | 93.1 |
| Sensitivity (%) | 100 | 98.1 |
| Specificity (%) | 56.5 | 88 |
© 2019 by the authors. Licensee MDPI, Basel, Switzerland. This article is an open access article distributed under the terms and conditions of the Creative Commons Attribution (CC BY) license (http://creativecommons.org/licenses/by/4.0/).
Share and Cite
Polykretis, C.; Kalogeropoulos, K.; Andreopoulos, P.; Faka, A.; Tsatsaris, A.; Chalkias, C. Comparison of Statistical Analysis Models for Susceptibility Assessment of Earthquake-Triggered Landslides: A Case Study from 2015 Earthquake in Lefkada Island. Geosciences 2019, 9, 350. https://doi.org/10.3390/geosciences9080350
Polykretis C, Kalogeropoulos K, Andreopoulos P, Faka A, Tsatsaris A, Chalkias C. Comparison of Statistical Analysis Models for Susceptibility Assessment of Earthquake-Triggered Landslides: A Case Study from 2015 Earthquake in Lefkada Island. Geosciences. 2019; 9(8):350. https://doi.org/10.3390/geosciences9080350
Chicago/Turabian StylePolykretis, Christos, Kleomenis Kalogeropoulos, Panagiotis Andreopoulos, Antigoni Faka, Andreas Tsatsaris, and Christos Chalkias. 2019. "Comparison of Statistical Analysis Models for Susceptibility Assessment of Earthquake-Triggered Landslides: A Case Study from 2015 Earthquake in Lefkada Island" Geosciences 9, no. 8: 350. https://doi.org/10.3390/geosciences9080350