Saharan Dust Transport during the Incipient Growth Phase of African Easterly Waves

1
Atmospheric Science Program, Department of Land, Air and Water Resources, University of California, Davis, CA 95616, USA
2
Department of Atmospheric and Environmental Sciences, University at Albany, State University of New York, Albany, NY 12222, USA
*
Author to whom correspondence should be addressed.
Geosciences 2019, 9(9), 388; https://doi.org/10.3390/geosciences9090388
Submission received: 20 July 2019
/
Revised: 28 August 2019
/
Accepted: 31 August 2019
/
Published: 5 September 2019
(This article belongs to the Special Issue Observing Atmospheric Dynamics and Dust Activity)
Abstract
:An analytical analysis is combined with numerical modeling simulations in order to expose the physical and dynamical processes that control the zonal-mean transport of Saharan mineral dust aerosols during the incipient growth phase of African easterly waves. The analytical analysis provides the theoretical basis for understanding and predicting how the waves and background flow combine to affect the zonal-mean eddy transports of dust. The analytically derived transport equations―which are valid for any wave field, irrespective of its spatial or temporal scale―predict that the eddy transports of dust are largest where the maximum in the background dust gradients coincide with a critical surface, i.e., where the Doppler-shifted frequency of the wave field vanishes. Linear simulations of the eddy dust transports are conducted using a mechanistic version of the Weather Research and Forecasting (WRF) model coupled to an interactive dust model. The simulations show that the eddy dust transports are directed down the background dust gradients and that the meridional transports of dust dominate over the vertical transports. The numerical simulations confirm the theoretical predictions. The predictions are used to explain recent statistical analyses of reanalysis data for dust-coupled African easterly waves.
1. Introduction
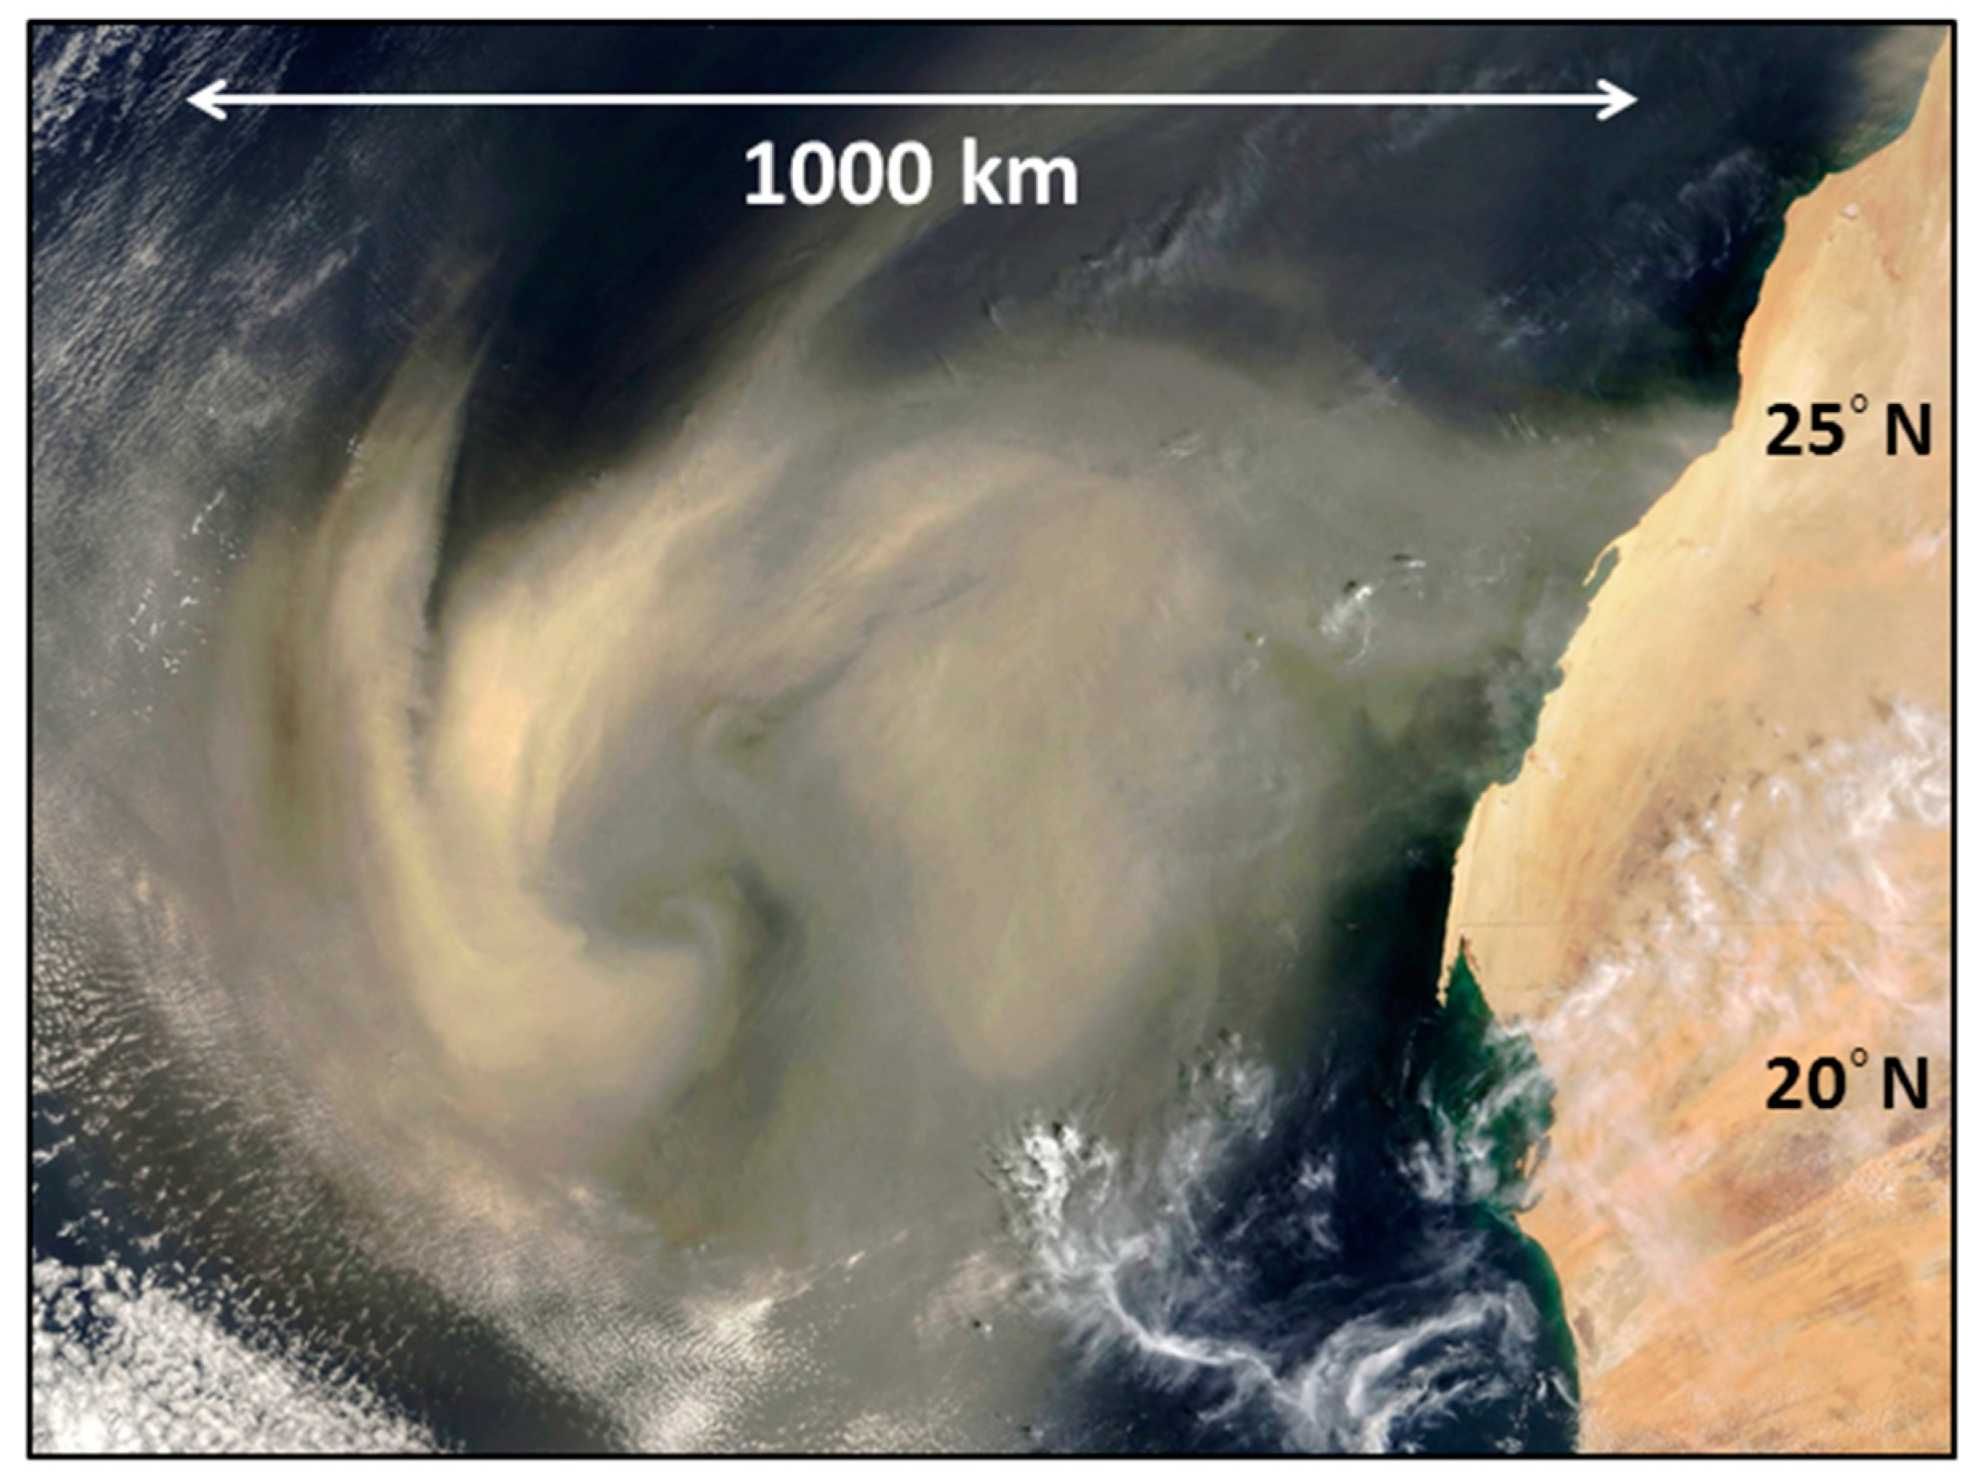
The myriad wind systems that occur over North Africa during summertime cause Saharan mineral dust aerosols to episodically erupt from the surface to form plumes that span the synoptic-scale (Figure 1) [1,2]. Once formed, the plumes absorb, emit, and scatter radiation, which affects the energy balance of the Earth-atmosphere system [3,4]. The dust-modified energy balance, in turn, affects the thermal driving of the atmospheric circulation, which includes two of the most prominent synoptic-scale circulations over North Africa: the African easterly jet (AEJ) and African easterly waves (AEWs), which together form a system that is central to the weather and climate over North Africa.
The AEJ is born of the temperature gradient produced by the hot Sahara Desert to its north and the warm, moist tropical air to its south [5,6]. Located at ~600 hPa at ~15° N, the AEJ is an important energy source for the AEWs, which have periods of ~3–5 days and wavelengths of ~2000–4000 km [7,8,9,10,11]. The AEWs that develop on the AEJ are most evident at ~600 hPa south of the AEJ and at ~850 hPa north of the AEJ [12,13].
Integral to the AEJ-AEW system are Saharan mineral dust aerosols, which are emitted from localized sources that coincide with scant vegetation and dry lakebeds (Figure 2) [14,15]. The dust plumes that subsequently form from the surface emission are comprised of a broad range of dust particle sizes, each with its own microphysical and optical properties. The microphysical properties determine how dust affects in-cloud processes [16], while the optical properties—single scattering albedo, asymmetry parameter, complex refractive index, extinction coefficient—determine how the dust modifies the scattering, absorption, and emission of radiation [17,18]. These dust-related optical properties are radiatively coupled to the circulation by the diabatic heating. Thus the interactions between the dust and the circulation form a complicated feedback loop that is continuously modulated by dust sources and sinks.
Observational, analytical, and modeling studies have shown that the structure and evolution of the AEJ-AEW system is modulated by the radiative and microphysical effects of dust. Studies of the dust-modified AEJ, for example, have utilized a wide variety of models and data sets, yet there is one overarching finding for which they agree: the dust affects the thermal field, which, via thermal wind balance, changes the strength and structure of the AEJ [19,20,21,22,23,24].
Bercos-Hickey et al. [24], for example, used the Weather Research and Forecasting (WRF) model coupled to an online dust model to examine the effects of Saharan dust on the structure, location, and energetics of the AEJ-AEW system. The WRF-dust model simulations, which were averaged over a single summer season, showed that the dust-modified heating field strengthens the AEJ, shifts it northward, upward and westward, and enhances its zonal asymmetry. They also found that the “dust-induced changes to the AEJ are manifest in the AEWs: the northern and southern tracks of the AEWs shift northward (like the AEJ); and the zonal-scale of the AEWs expands and their westward propagation increases.” In addition, the simulations showed that the dust strengthens the energetics of the AEJ-AEW system, as evidenced by the eddy kinetic energy of the AEWs, which was shown to increase by a factor of 1.5 due to the radiative-dynamical feedbacks of the system with the dust.
Several studies of dust-modified AEWs show that the dust can affect their growth and energetics [24,25,26,27,28]. Ma et al. [25], for example, used the WRF model with prescribed dust profiles and found that the dust-radiative effects reduce the static stability, producing an intensification of the modeled AEWs. The dust-induced intensification, however, occurred for most but not all of the modeled waves.
Grogan et al. [26] combined an analytical analysis with idealized WRF-dust model simulations to examine the effects of Saharan dust on the linear dynamics of AEWs. The analytical analysis showed that during the incipient growth phase of AEWs, which corresponds to their initial exponential amplification, the dust-modified generation of eddy available potential energy (APE) is largest in regions where the dust gradients are maximized and the Doppler-shifted frequency is minimized. With the analytical analysis used as an interpretive guide for the numerical simulations, Grogan et al. [26] showed that for a background flow that is supercritical with respect to the threshold for barotropic and baroclinic instability, the dust increased the growth rate of the fastest growing AEW by 13% to 90% for AOD ranging from 1.0 to 2.5.
Nathan et al. [28] developed a theoretical framework that exposed the radiative–dynamical relationships that govern the subcritical destabilization of AEWs by Saharan dust. The framework hinged on a conservation of wave activity equation, which provided an analytical expression for the dust-induced incipient growth rate of AEWs. Using the same idealized WRF-dust model as Grogan et al. [26], Nathan et al. [28] carried out linear simulations, which showed that for a subcritical AEJ and a background dust distribution consistent with observations, the dust destabilizes the AEWs, in agreement with the theoretical prediction. The growth rates that were obtained were shown to be commensurate with, and even exceed, those obtained in previous dust-free studies in which the AEWs grow on supercritical AEJs.
The AEJ-AEW system is not only affected by the diabatic heating effects of dust, as shown in the studies cited above, it is among several circulations over North Africa that play a role in the transport of dust to the Eastern Atlantic Ocean and beyond [2,30,31,32]. Jones et al. [30], for example examined the role of AEWs on Saharan dust transport. Reanalysis data datasets were used to identify AEW activity and to drive a dust transport model. Their analysis showed that “approximately 20% of the dust entrainment into the atmosphere over a broad region of North Africa is associated with easterly wave activity, suggesting that easterly waves may regulate desert dust entrainment into the atmosphere. About 10%–20% of the seasonal variability of desert dust concentrations across the North Atlantic is related to easterly waves, which suggests that easterly waves modulate the transport of desert dust.” Jones et al. [30] did not, however, identify how the structure, growth, and propagation of the AEWs controlled the dust transport.
Grogan and Thorncroft [33] examined the three-dimensional structure of dust-coupled AEWs using the Modern-Era Retrospective analysis for Research and Applications, Version 2 (MERRA-2). Using the MERRA-2 heating rates to compute the diabatic generation of eddy APE, they found that the correlation between the heating rates and the dust anomalies was consistent with the dust-induced generation of APE at mid-levels north of the AEJ axis, which is in agreement with idealized analytical studies of Grogan et al. [26] and Nathan et al. [28]. The dust anomalies reside within the northerlies west of the AEW trough in the Sahel (10–20° N) and the southerlies east of the trough in the Sahara (20–27° N). The dust anomalies remain in these regions as the wave crosses Africa, implying that the AEW circulation is a controlling factor in their transport. Their study, however, was unable to explain two important aspects of the dust transports: (i) the location of the maximum dust transports; and (ii) the spatial relationships between the maximum dust transports and the AEW structures.
These two aspects of Saharan dust transports are explained in this study. To do so, we combine a theoretical framework with numerical simulations, which together expose the physical and dynamical processes that control the zonal-mean transport of Saharan mineral dust aerosols during the incipient growth phase of AEWs. Our analysis is framed around two questions. First, how do the zonal-mean distributions of zonal wind and dust combine to affect the transports of dust by AEWs? Second, is there a region where the eddy dust transports are optimized, and, if so, what are the controlling factors?
2. Eddy Dust Transports: Theoretical Framework
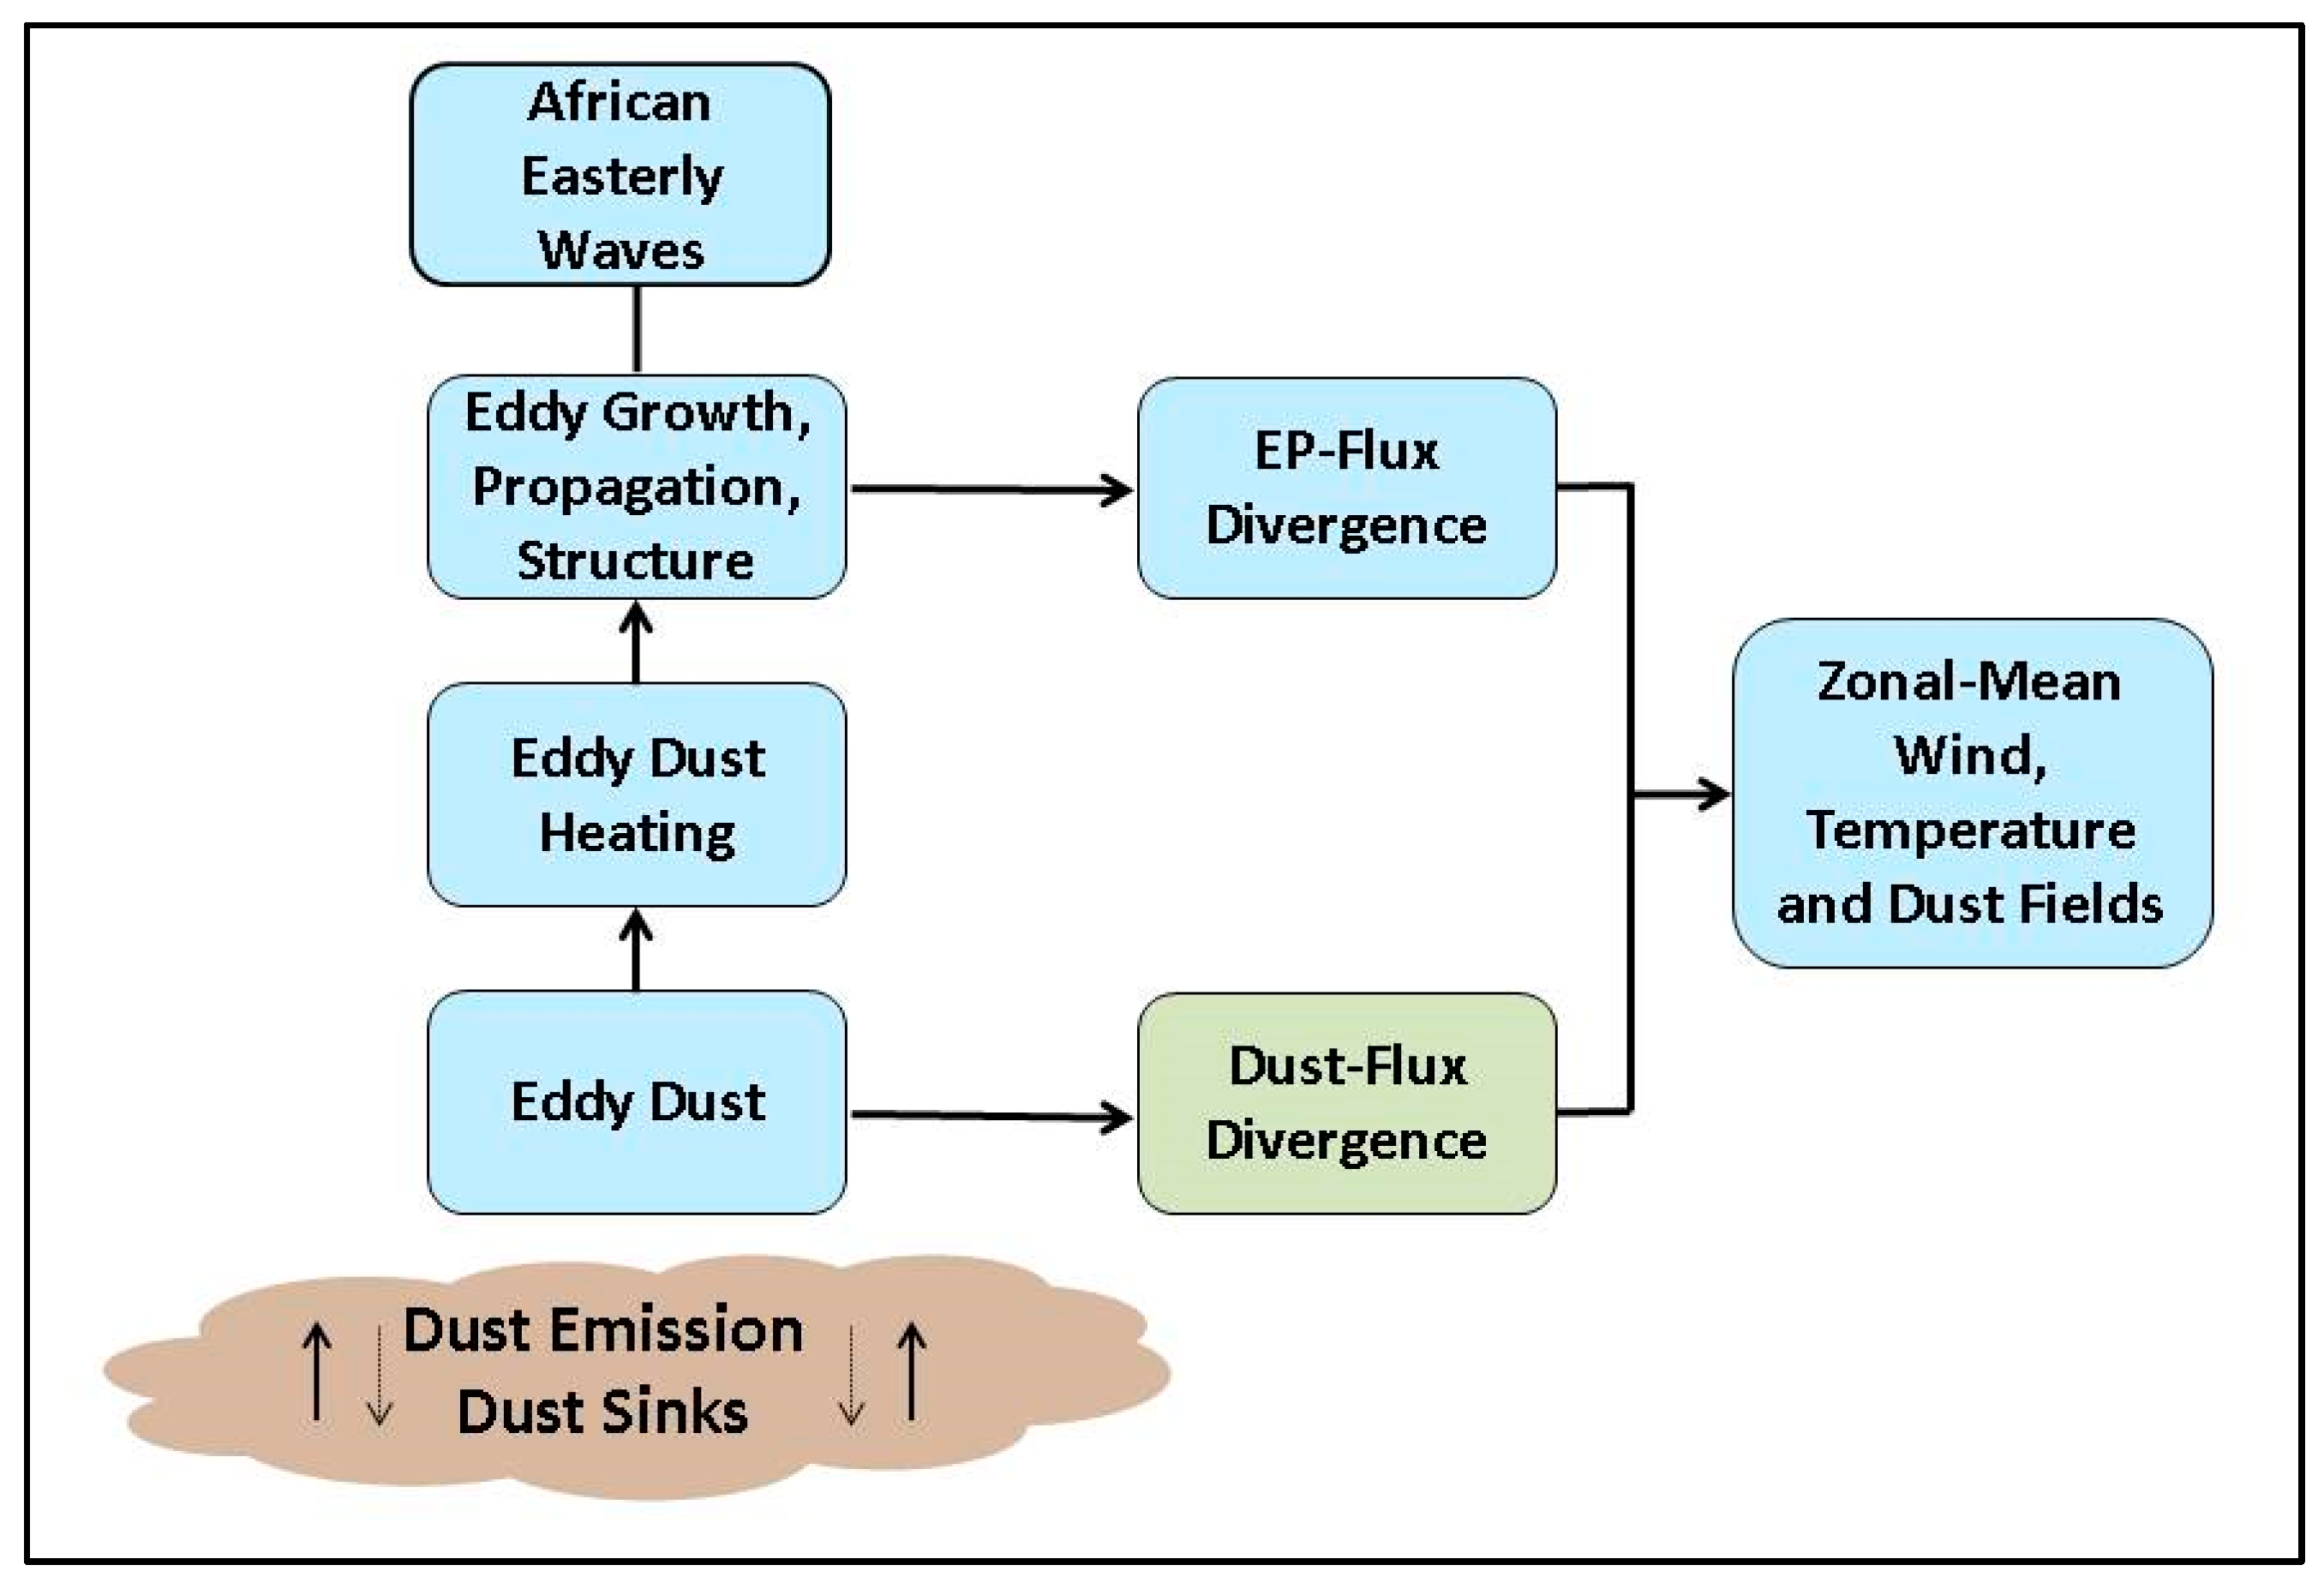
Figure 3 encapsulates the theoretical framework that is developed in this section, a framework that exposes the physical and dynamical relationships that control the zonal-mean transports of Saharan mineral dust during the incipient growth phase of AEWs. The theoretical framework pivots on the linear dynamics of dust-modified AEWs. In this framework, the dust-induced changes to the eddy heating rate changes the eddy propagation, growth, and structure, characteristics that together constitute the dust-modified AEWs. The dust-modified AEWs, in turn, alter the eddy heat and momentum fluxes, which are embodied in the Eliassen-Palm flux divergence [27], and the eddy dust fluxes, which are embodied in the dust-flux divergence. Below we derive diagnostic equations for the meridional and vertical dust transports, which can be used as a tool to predict where the dust transports are largest and to interpret the numerical results presented in Section 3.
2.1. Governing Equations
The transport analysis begins with a conservation equation for dust, which can be written in flux form as [34]:
where γ is the dust concentration; ρ is the air density; , where u, v, and w are the wind components in the zonal (x), northward (y) and vertical (z) directions, respectively; S includes the emission sources and sinks of dust as well as its sub-grid scale diffusion.
If the independent variables are partitioned into a steady, zonal-mean background state and a perturbation, then inserted into Equation (1) and zonally averaged, we obtain an equation for the Eulerian-mean dust transport [34]:
where and together constitute the zonal-mean meridional circulation, and
which represents the zonal-mean eddy transports (eddy fluxes) of dust in the meridional and vertical directions. In Equations (2) and (3) the overbar denotes a zonal average and the prime denotes a perturbation (eddy).
For the linear problem considered here, where the background flow is a steady, zonal-mean current, , the equation governing the linear dynamics of the eddy dust field can be written as [26]:
In this eddy dust equation, does not include any dust sources; for simplicity, is chosen to only represent the eddy dust depletion rate, which embodies such effects as dry deposition and gravitational settling. For our analytical analysis, which is presented in the following subsection, we model the depletion rate as:
where . In the analytical analysis D is assumed constant, though in reality D depends on the dust particle size.
2.2. Analytical Analysis
To obtain diagnostic equations for the eddy dust transports, we assume that the eddy fields have normal mode solutions of the form:
where the amplitude moduli, , , , and phases, , , , are functions of latitude and height; is the complex phase speed; is the incipient growth rate; k is the (real) zonal wavenumber; and the asterisk denotes the complex conjugate of the preceding term.
Insertion of Equations (5) and (6) into Equation (4) yields the following expression for the eddy dust field:
where
The source of the eddy dust is the second bracket in Equation (7), which is the advection of the background dust by the eddy wind in the latitude-height plane. Depending on the signs of the wind and background dust gradients, the meridional and vertical advections of mean dust by the eddies may augment or oppose each other. The first bracket in Equation (7), which is a function of the growth rate, depletion rate, and Doppler-shifted frequency, modulates the dust.
To aid in the interpretation of the transport equations and later the numerical results, we begin by examining the phase relationships between the eddy dust and wind fields for two limiting cases: (i) , which occurs in regions where the background zonal wind is relatively large (and easterly); and (ii) , which occurs in regions characterized by critical surfaces, i.e., where .
In the first limiting case, Equation (7) is approximated by
In this case, the eddy dust and wind fields are out of phase. Whether the dust leads or lags the wind will depend on the signs of the background dust gradients. For example, if , which occurs when the background easterly winds are relatively strong, the eddy dust maximum will lead the maximum northerly winds by 90° in regions where . The eddy dust maximum will lag the maximum northerly winds by 90° in regions where . Because the dust sources are at the surface, the concentration of the background dust field generally decreases with height; consequently, the dust field will lag the vertical wind field by .
In the second limiting case, which corresponds to regions in the vicinity of critical surfaces, Equation (7) is approximated by
This equation shows that the dust and wind fields are in phase when the background dust gradients are both negative, and 180° out of phase if the background gradients are both positive.
Based on the phase relationships associated with the above limiting cases, we can ascertain information about the expected dust transports. To do so, we zonally average the product of Equation (6a) and Equation (6c), and the product of Equation (6b) and Equation (6c), to obtain the following equations for the eddy dust transports:
These equations underscore the importance of the dust-wind phase relationships to the transport of dust. For limiting case (i), for which the background wind is strong, the eddy dust and wind fields are 90° out of phase, in which case the transports vanish. In contrast, for limiting case (ii), for which the Doppler-shifter frequency is small, the eddy dust and wind fields are either in phase or 180° out phase, in which case the transports are maximized.
To show how the dust transports depend on the growth rate, amplitude and phase of the waves, and the distributions of the background distributions of the zonal-mean wind and dust fields, we combine Equations (6) and (7) to obtain:
where represents the phase difference between the vertical and meridional wind components. For the two limiting cases described above, Equations (9) and (10) each show that and are either in phase () or out of phase (). To determine which phase applies, however, requires detailed numerical calculations, which we present in Section 3.
Equations (12a) and (12b) show that the dust transports depend on the momentum fluxes in both the meridional and vertical directions, which act upon the mean dust gradients. For example, Equation (12a) shows that the meridional transport of dust is due to the two terms within the large bracket. The first term is proportional to the northward transport of northerly momentum, which acts on the northward gradient of the mean dust field. The second term is proportional to the northward transport of vertical momentum, which acts on the vertical gradient of the mean dust field. Both terms are modulated by the factor, which is a function of the growth rate and Doppler-shifted frequency. A similar interpretive analysis can be applied to the vertical transport equation.
To further expose how the waves and background flow combine to affect the dust transports, we focus on the case where the dust transports are largest. As shown above, the transports are largest near critical surfaces, regions where and or 180°. In this case Equations (12a) and (12b) become:
where
Equations (13a) and (13b) show that the signs of the mean dust gradients and the phase between the meridional and vertical wind components together determine whether the two terms within the bracket augment or oppose each other, and, consequently, whether the transports are stronger or weaker. For example, in Equation (13a), the sign of the first term within the bracket is independent of the wave structure; it depends solely on the meridional gradient of the zonal-mean dust field. Thus the first term alone would produce southward transport of dust if , and northward otherwise. In contrast, the sign of the second term depends on the phase difference between the meridional and vertical wind components, and the meridional gradient of the zonal-mean dust field. For the vertical transport equation, reasoning similar to that used for the interpretation of Equation (13a) can be applied.
The results of the above analysis are confirmed numerically in the next section, and are used to aid in the interpretation of the numerical results.
3. Eddy Dust Transports: Numerical Results
In this section, we describe the WRF-dust model, the background distributions for the zonal-mean wind, temperature and dust fields that are used for the simulations, and the eddy transport results.
3.1. WRF-Dust Model
We used an idealized version of the WRF-dust model, which is comprehensively described in Grogan et al. [26] and Nathan et al. [28]. Briefly, the model is comprised of the WRF dynamical core (v3.7) that is coupled to a dust model developed by Chen et al. [21,35]. The dust model simulates the advection and sedimentation of 12-bin mixing ratios whose radii range from 0.15–5.0 µm. The dust is coupled to thermodynamics via a radiative transfer model (RTM). Other physics parameterizations, such as boundary layer physics, convection, and cloud processes, are deactivated in the model. The RTM also computes dust heating rates using dust optical properties―extinction coefficient, single scattering albedo, and asymmetry parameters―obtained from the Optical Properties of Aerosols and Clouds (OPAC) software package [36]. The model domain is a global channel projected on an equidistant cylindrical grid. In the horizontal, the resolution is 0.5° and the boundary conditions are periodic in the zonal direction and symmetric at the channel sidewalls (40° N and 10° S). In the vertical, there are 50 levels that extend from a flat surface up to 100 hPa, with no-slip conditions at the top and bottom. To reduce noise and boundary reflections, we impose a 30-min hyper diffusion on the wind fields throughout the model domain, and a Rayleigh damping on the wind and temperature fields at the model top (300–100 hPa).
For each linear simulation the transports are computed for the most unstable AEW (wavelength 3300 km), which is determined using the same methodology described in Grogan et al. [26]. The methodology is divided into three steps. First, a wave perturbation of fixed wavelength is superimposed onto the zonal-mean horizontal wind field. The initial wave amplitude of the perturbation is chosen sufficiently small (~10−4 ms−1) such that during the incipient growth phase of the perturbation it is controlled by the linear dynamics of the system, i.e., the zonally averaged wave fluxes do not produce any appreciable changes in the zonally averaged background flow. Second, the model is then integrated forward in time until the domain-averaged wave energy converges to exponential growth to an accuracy of 10−3 for at least 12 h. Third, once exponential growth is achieved, a Fast-Fourier transform algorithm is used to obtain the spatial structures for the eddy wind, temperature and dust fields, which are then scaled to produce a peak meridional wind of 5 ms−1.
3.2. Background Fields
Figure 4a shows the background distribution of the zonal-mean zonal wind and potential temperature fields. The distributions are identical to that used in Grogan et al. [26]. The wind is comprised of a zonal jet that is consistent with an observed AEJ: it is symmetric in latitude, asymmetric in height, and has a maximum easterly wind of 15 ms−1 centered at 15° N and ~650 hPa. The background potential temperature is in thermal wind balance with the zonal-mean wind.
Figure 4b shows the background distribution of the dust mixing ratio. Each of the 12 dust particle bins that constitute the dust field have the same distribution, which is symmetric in latitude and decreases with height. The field is centered at 20° N, which is near the strongest source regions observed in North Africa [14]. The vertical distribution is guided by extinction profiles obtained from measurements taken from the Cloud-Aerosol Lidar and Infrared Pathfinder Satellite Observation (CALIPSO) over North Africa during summer [37]. The concentrations of each dust bin are scaled to produce a maximum AOD of ~1.0, which is consistent with observations and yields a dust maximum mixing ratio of ~800 µg kg−1 near the surface at 20° N.
3.3. Dust Transports
Figure 5 shows the zonal-mean meridional and vertical transports of dust as a function of latitude and pressure. The meridional dust transports are equatorward between N (where ), whereas the transports are poleward between N (where ). Thus within both latitude belts, the meridional dust transports are directed down the background dust gradient (see Figure 4b). This agrees with the statistical analyses of the dust-coupled AEWs carried out by Grogan and Thorncroft [33]. The equatorward transports, which are as much as three orders of magnitude larger than the poleward transports, are maximized at ~18° N, ~775 hPa, i.e., near the critical surface. The latitude of maximum meridional transports also agrees with Grogan and Thorncroft [33]. The vertical dust transports are upward both north and south of the dust maximum, and, like the meridional transports, are down the background dust gradient and are largest at ~18° N, ~775 hPa. As predicted from the theoretical framework, the dust transports diminish with distance from the critical surface, which is seen in Figure 5 by comparing the transports at 18° N with those at 22° N.
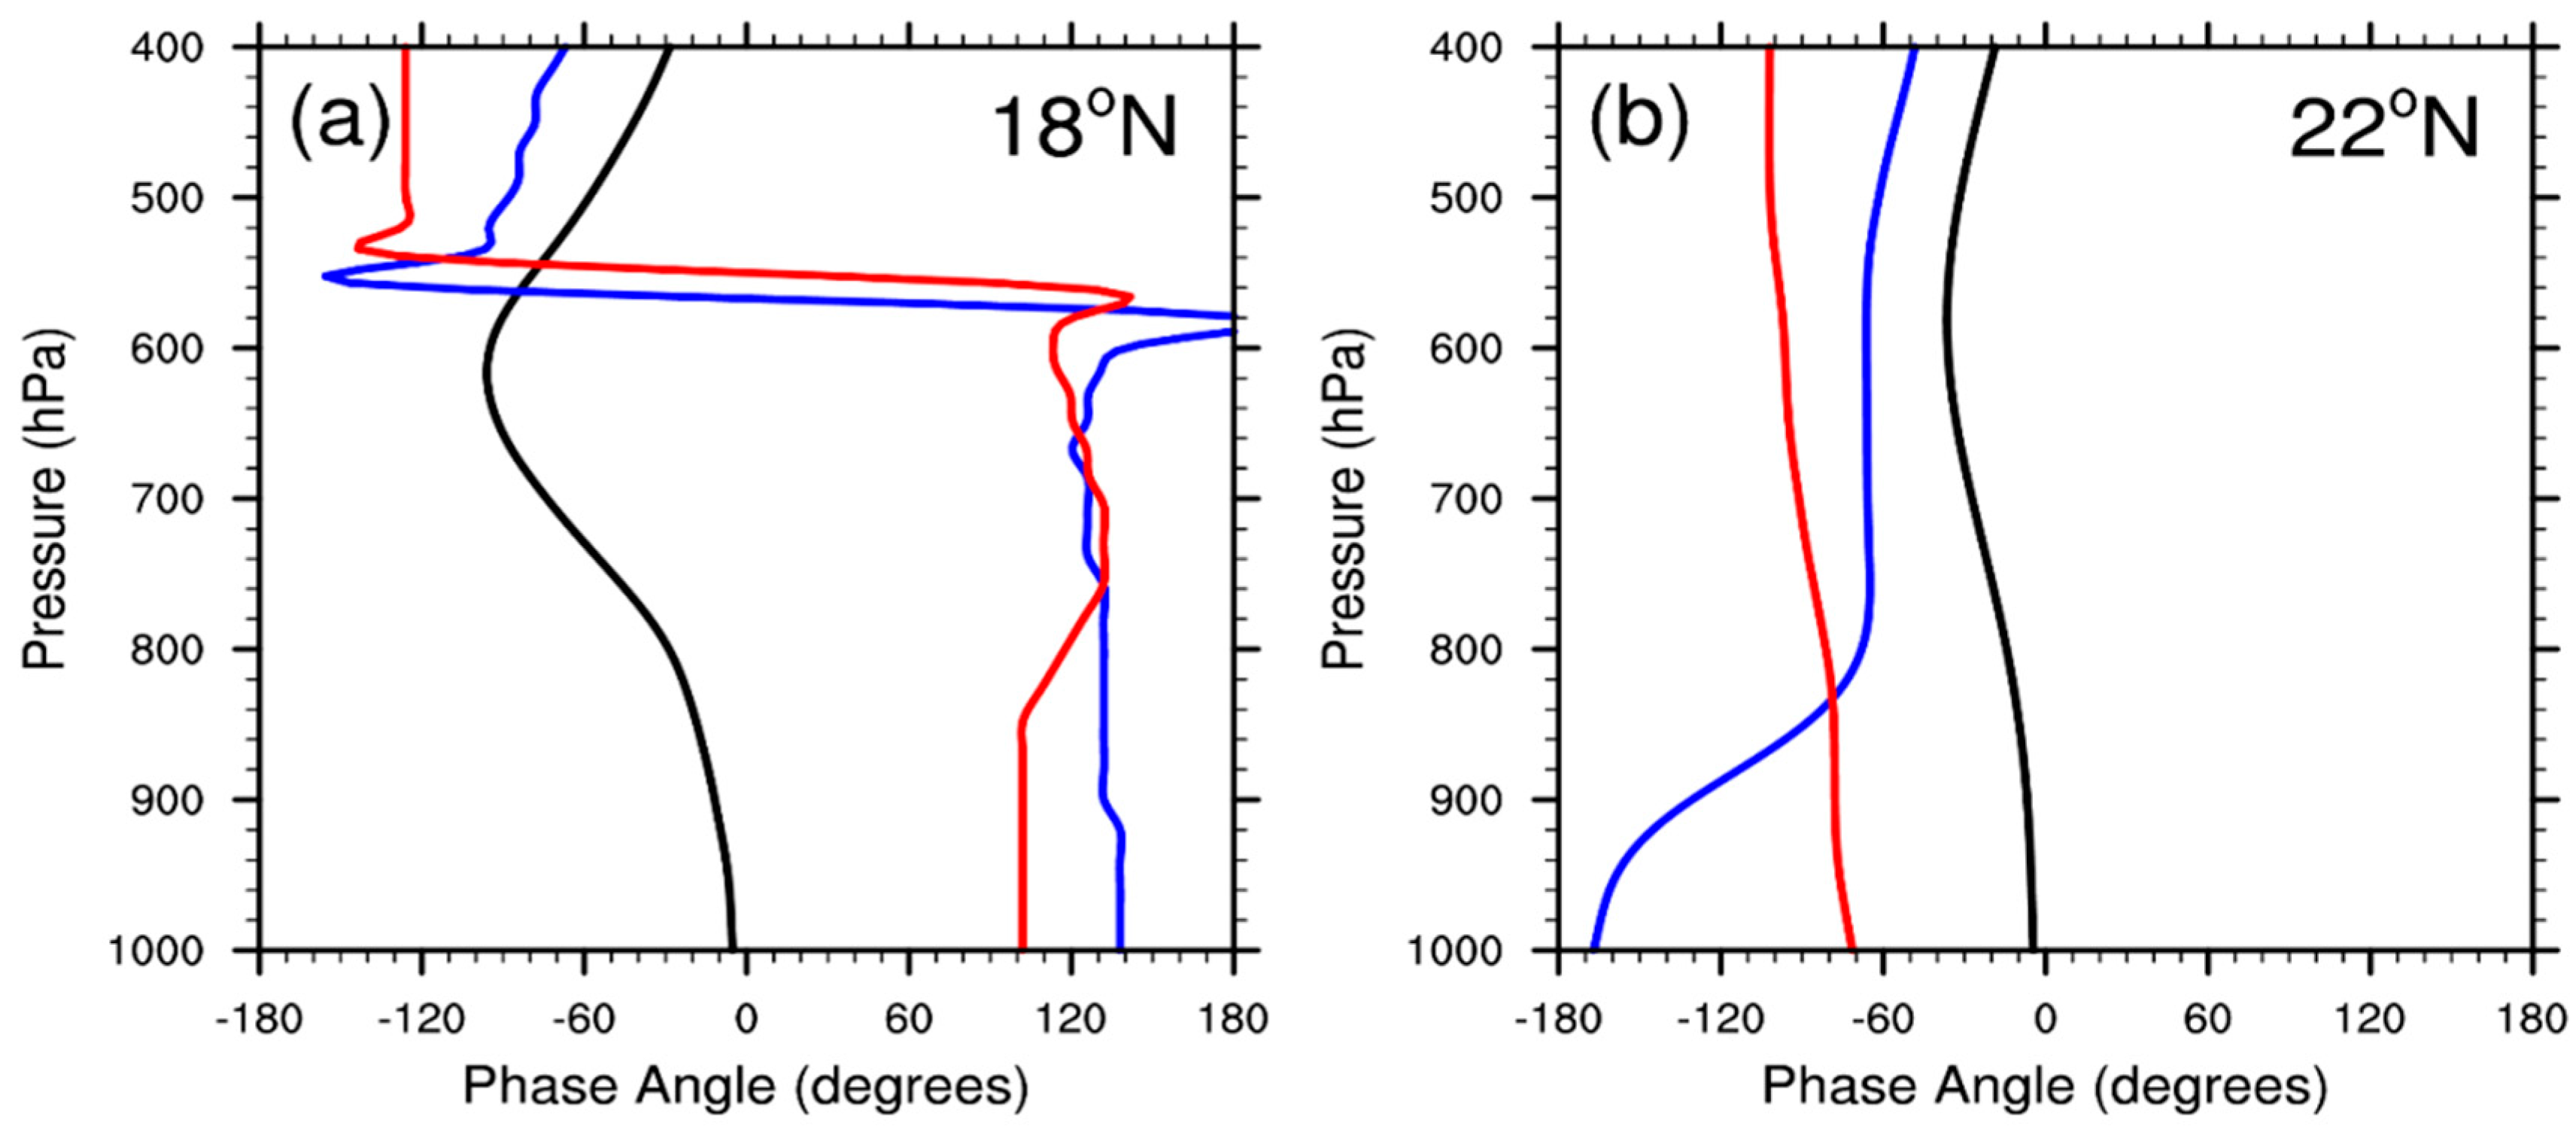
Figure 6 shows the phases for the meridional and vertical winds, and the dust mixing ratio as a function of pressure at 18° N and 22° N. At 18° N between 1000 hPa and 600 hPa, the phase of the meridional wind field, , is negative and decreases monotonically with decreasing pressure; this corresponds to an eastward tilt with height for the disturbance field, which is a characteristic signature of a developing AEW [12]. If we note that for geostrophic flow , where is the geopotential height field [38], then the largest dust transports are 90° west of the AEW trough. At 18° N between 1000 hPa and ~850 hPa, is constant, and then increases with decreasing pressure until ~775 hPa, the pressure level of the critical surface. Thus in the region where increases, the dust field tilts westward with height. The vertical structures of and as well as the location of the dust transports within the AEW circulation agree with the dust-coupled AEW structures obtained from statistical analyses of reanalysis data found by Grogan and Thorncroft [33]. The variations of and are less pronounced at 22° N due to the greater distance of the disturbance field from the critical surface.
Additional insights into the spatial distributions of the dust transports shown in Figure 5 and their connection to the phases of the wind and dust fields shown in Figure 6 can be obtained from the theoretical framework given in Section 2. Consider, for example, the region associated with the critical surface (~18° N, ~775 hPa). In this region, the meridional wind and dust fields are ~180° out of phase, which means the largest dust transports are in the northerlies of the AEW circulation (see Equation (11a)). Moreover, near the critical surface, the meridional and vertical wind fields are approximately out of phase, i.e., . We further note that the terms in Equations (13a) and (13b) that are proportional to are much larger than those that are proportional to a fact that we have confirmed with the WRF-dust model. With these approximations, the dust transport Equations (13a) and (13b) can be written as,
Thus near the critical surface (~18° N), and to a first approximation, the meridional and vertical transports of dust both depend on the meridional gradient of the background dust field, . The sign of determines the direction of the transports. For example, consistent with Figure 5, in the region N, where the meridional dust transports are southward and the vertical transports are upward.
Based on observations [12], at ~ N and ~775 hPa, the AEWs are characterized by ms−1 and ms−1, so that Equations (15a) and (15b) yield the following ratio:
which agrees with Figure 5, i.e., the meridional dust transports are about three orders of magnitude larger than the vertical transports near the critical surface. Moreover, Equation (16) shows, as expected, that the relative magnitude of the transports depends solely on the ratio of the vertical to meridional wind fields near the critical surface.
4. Discussion and Conclusions
North Africa is home to the African easterly jet (AEJ) and the birthplace of both African easterly waves (AEWs) and vast plumes of Saharan mineral dust aerosols. Together the AEJ, AEWs, and dust form a complex physical-dynamical system that is central to the weather and climate over North Africa [26,27,28], and to the global energy balance and transport of dust [1,2,3,4]. Two questions, which are of both practical and theoretical importance, have motivated this study. First, how do the zonal-mean distributions of zonal wind and dust combine to affect the transports of dust by AEWs? Second, is there a region where the eddy dust transports are optimized, and, if so, what are the controlling factors?
To answer these questions, we have combined a theoretical framework with numerical simulations to examine the zonal-mean transports of Saharan dust during the incipient growth phase of AEWs. The theoretical framework is both predictive and interpretive. The framework predicts that the dust transports in the meridional and vertical directions will be largest in regions where the background dust gradients are maximized near a critical surface. In such regions, the direction of the dust transports, which occur in the latitude-height plane, will depend on the background dust gradients and the phase between the eddy wind and dust fields.
The theoretical predictions have been confirmed with numerical simulations carried out with an idealized version of the Weather Research and Forecasting (WRF) model coupled to an interactive dust model. The WRF-dust model simulations show that for the observationally representative background wind and dust distributions that we have chosen, the meridional transports of dust dominate over the vertical transports. The simulations also show that during the incipient growth phase of AEWs, the meridional and vertical transports of dust are largest at ~18° N, a region within the Sahel where the background dust gradients are large near a critical surface. In this region, which is located between the jet axis and the maximum dust concentration, the eddy dust transports are directed down the background dust gradients, and the eddy dust and wind fields are 180° out of phase. Consequently, the dust transports are largest in the northerlies, which are 90° west of the wave trough. These findings, which were predicted by the theoretical framework, also agree with the findings of Grogan and Thorncroft [33], who carried out statistical analyses of reanalysis data to examine the structure of dust-coupled AEWs.
Observations show that Saharan dust is mostly transported westward, and can reach as far as the Caribbean Basin and northeastern South America [32]. Our findings show how the AEWs may play a role in that transport. Consider a developing AEW that interacts with a synoptic-scale plume of dust. As shown in this study, the meridional transport of the dust will be largest in the northerlies ahead of the wave trough. Thus the dust will be transported southward, eventually reaching the core of the AEJ. Once the dust is entrained into the AEJ, it will be transported westward toward the Eastern Atlantic Ocean and beyond.
Finally, it is important to note that we have focused on the eddy transports of Saharan dust during the incipient growth phase of AEWs. Questions remain, however, regarding the physical and dynamical processes that control dust transports throughout the life cycles of AEWs, which Grogan et al. [27] have described as occurring over four stages: incipient growth, a consequence of the linear instability of the AEJ; nonlinear stabilization, which occurs when the eddy heat and momentum fluxes have reduced the energy transfers from the AEJ to the waves; peak amplitude, a stage where the energy transfers have saturated; and equilibration, when the wave reaches a lower amplitude, quasi-steady regime. Throughout the AEW life cycle, the dust transports will not only be a function of the AEWs, as shown in this study, but they will also be a function of the evolving AEJ and the residual mean-meridional circulation, both of which are driven by dust-modified Eliassen-Palm fluxes. The central question then is what is the relative importance of the AEWs, AEJ, and residual mean meridional circulation to the transport of dust throughout the four stage life cycle of the AEWs? An answer to this question will shed further light on how the synoptic-scale circulation over North Africa affects the transport of Saharan dust to the Eastern Atlantic Ocean and beyond.
Author Contributions
Conceptualization, T.R.N. and D.F.P.G.; methodology, T.R.N.; software and numerical simulation, D.F.P.G. and S.-H.C.; validation, T.R.N. and D.F.P.G.; formal analysis, T.R.N.; writing—original draft preparation and writing, T.R.N.; review and editing, T.R.N., D.F.P.G. and S.-H.C.; visualization, D.F.P.G.; funding acquisition, T.R.N. and S.-H.C.
Funding
This research was funded by the National Science Foundation (NSF), grant number 1624414-0.
Acknowledgments
The authors thank Emily Bercos-Hickey and Scott Nelson for their insightful comments on the manuscript. We also acknowledge computing support from Cheyenne (doi:10.5065/D6RX99HX), which is provided by NCAR’s Computational and Information Systems Laboratory.
Conflicts of Interest
The authors declare no conflict of interest. The funders had no role in the design of the study; in the collection, analyses, or interpretation of data; in the writing of the manuscript; or in the decision to publish the results.
References
- Schepanski, K.; Tegen, I.; Macke, A. Saharan dust transport and deposition towards the tropical northern Atlantic. Atmos. Chem. Phys. 2009, 9, 1173–1189. [Google Scholar] [CrossRef] [Green Version]
- Knippertz, P.; Todd, M.C. The central west Saharan dust hot spot and its relation to African easterly waves and extratropical disturbances. J. Geophys. Res. Atmos. 2010, 115, D12117. [Google Scholar] [CrossRef]
- Miller, R.L.; Tegen, I. Climate response to soil dust aerosols. J. Clim. 1998, 11, 3247–3267. [Google Scholar] [CrossRef]
- Schepanski, K. Transport of mineral dust and its impact on climate. Geosciences 2018, 8, 151. [Google Scholar] [CrossRef]
- Thorncroft, C.D.; Blackburn, M. Maintenance of the African easterly jet. Q. J. R. Meteor. Soc. 1999, 125, 763–786. [Google Scholar] [CrossRef]
- Dezfuli, A.K.; Nicholson, S.E. A note on long-term variations of the African easterly jet. Int. J. Climatol. 2011, 31, 2049–2054. [Google Scholar] [CrossRef]
- Burpee, R.W. The origin and structure of easterly waves in the lower troposphere of North Africa. J. Atmos. Sci. 1972, 29, 77–90. [Google Scholar] [CrossRef]
- Thorncroft, C.D.; Hoskins, B.J. An idelaized study of African easterly waves. I: A linear view. Q. J. R. Meteorol Soc. 1994, 120, 953–982. [Google Scholar] [CrossRef]
- Thorncroft, C.D.; Hodges, K. African easterly wave variability and its relationship to Atlantic tropical cyclone activity. J. Clim. 2001, 14, 1166–1179. [Google Scholar] [CrossRef]
- Hsieh, J.S.; Cook, K.H. A study of the energetics of African easterly waves using a regional climate model. J. Atmos. Sci. 2007, 64, 421–440. [Google Scholar] [CrossRef]
- Ross, R.; Krishnamurti, T.N. Low-level African easterly wave activity and its relation to Atlantic tropical cyclogenesis in 2001. Mon. Weather Rev. 2007, 135, 3950–3964. [Google Scholar] [CrossRef]
- Reed, R.J.; Klinker, E.; Hollingsworth, A. The structure and characteristics of African easterly wave disturbances as determined from the ECMWF Operational Analysis/Forecast System. Meteorol. Atmos. Phys. 1988, 38, 22–33. [Google Scholar] [CrossRef]
- Pytharoulis, I.; Thorncroft, C. The low-level structure of African easterly waves in 1995. Mon. Weather Rev. 1999, 127, 2266–2280. [Google Scholar] [CrossRef]
- Engelstaedter, S.; Washington, R. Atmospheric controls on the annual cycle of North African dust. J. Geophys. Res. Atmos. 2007, 112, D03103. [Google Scholar] [CrossRef]
- Knippertz, P.; Todd, M.C. Mineral Dust aerosols over the Sahara: Meteorological controls on emission and transport and Implication for modeling. Rev. Geophys. 2012, 50, RG1007/2012. [Google Scholar]
- Nenes, A.; Murray, B.; Bougiatioti, A. Mineral dust and its microphysical interactions with clouds. In Mineral Dust: A Key Player in the Earth System; Knippertz, P., Stuut, J.-B.W., Eds.; Springer: New York, NY, USA, 2014; pp. 287–325. [Google Scholar]
- Carlson, T.N.; Benjamin, S.G. Radiative heating rates for Saharan dust. J. Atmos. Sci. 1980, 37, 193–213. [Google Scholar] [CrossRef]
- Zhu, A.; Ramanathan, V.; Li, F.; Kim, D. Dust plumes over the Pacific, Indian, and Atlantic oceans: Climatology and radiative impact. J. Geophys. Res. Atmos. 2007, 112. [Google Scholar] [CrossRef]
- Tompkins, A.M.; Cardinali, C.; Morcette, J.J.; Rodwell, M. Influence of aerosol climatology on forecasts of the African Easterly jet. Geophys. Res. Lett. 2005, 32, L10801. [Google Scholar] [CrossRef]
- Wilcox, E.M.; Lau, K.M.; Kim, K.M. A northward shift of the North Atlantic Ocean intertropical convergence zone in response to summertime Saharan dust outbreaks. Geophys. Res. Lett. 2010, 37, L04804. [Google Scholar] [CrossRef]
- Chen, S.-H.; Wang, S.-H.; Waylonis, M. Modification of Saharan air layer and environmental shear over the eastern Atlantic Ocean by dust-radiation effects. J. Geophys. Res. Atmos. 2010, 115, D21202. [Google Scholar] [CrossRef]
- Reale, O.; Lau, W.K.; Silva, A. Impact of interactive aerosol on the African easterly jet in the NASA GEOS-5 global forecasting system. Wea. Forecast. 2011, 26, 504–519. [Google Scholar] [CrossRef]
- Lavaysse, C.; Chaboureau, J.-P.; Flamant, C. Dust impact on the West African heat low in summertime. Q. J. R. Meteorol. Soc. 2011, 137, 1227–1240. [Google Scholar] [CrossRef]
- Bercos-Hickey, E.; Nathan, T.R.; Chen, S.-H. Saharan dust and the African esterly jet-African easterly wave system. Q. J. R. Meteorol. Soc. 2017, 143, 2797–2808. [Google Scholar] [CrossRef]
- Ma, P.L.; Zhang, K.; Shi, J.J.; Matsui, T.; Arking, A. Direct radiative effect of mineral dust on the development of African easterly waves. J. Appl. Met. Clim. 2012, 51, 2090–2104. [Google Scholar] [CrossRef]
- Grogan, D.F.P.; Nathan, T.R.; Chen, S.-H. Effects of Saharan dust on the linear dynamics of African Easterly Waves. J. Atmos. Sci. 2016, 73, 891–911. [Google Scholar] [CrossRef]
- Grogan, D.F.P.; Nathan, T.R.; Chen, S.-H. Saharan dust and the nonlinear evolution of the African easterly jet–African easterly wave system. J. Atmos. Sci. 2017, 74, 27–47. [Google Scholar] [CrossRef]
- Nathan, T.R.; Gorgan, D.F.P.; Chen, S.-H. Subcritical destabilization of African easterly waves by Saharan mineral dust. J. Atmos. Sci. 2017, 74, 1039–1055. [Google Scholar] [CrossRef]
- Xie, Y.; Zhang, Y.; Xiong, X.; Qu, J.J.; Che, H. Validation of MODIS aerosol optical depth product over China using CARSNET measurements. Atm. Env. 2011, 45, 5970–5978. [Google Scholar] [CrossRef]
- Jones, C.; Mahowald, N.; Luo, C. The role of eaaterly waves on African desert dust transport. J. Clim. 2003, 16, 3617–3628. [Google Scholar] [CrossRef]
- Kaufman, Y.J.; Koren, I.; Rener, L.A.; Tanre, D.; Ginoux, P.; Fan, S. Dust transport and deposition observed from the Terra-Moderate resolution imaging spectroradiometer (MODIS) spacecraft over the Atlantic Ocean. J. Geophys. Res. Atmos. 2005, 110, D10S12. [Google Scholar] [CrossRef]
- Prospero, J.M.; Lamb, P.J. African droughts and dust transport to the Caribbean: Climate change implications. Science 2003, 302, 1024–1027. [Google Scholar] [CrossRef]
- Grogan, D.F.P.; Thorncroft, C.D. The characteristics of African easterly waves coupled to Saharan mineral dust aerosols. Q. J. R. Meteorol. Soc. 2019, 145, 1130–1146. [Google Scholar] [CrossRef]
- Shao, Y. Physics and Modeling of Wind Erosion; Springer Science & Business Media: Berlin, Germany, 2008. [Google Scholar]
- Chen, S.-H.; Liu, Y.-C.; Nathan, T.R.; Davis, C.; Torn, R.; Sowa, N.; Cheng, C.-T.; Chen, J.-P. Modeling the effects of dust-radiative forcing on the movement of Hurricane Helene (2006). Q. J. R. Meteorol. Soc. 2015, 141, 2563–2570. [Google Scholar] [CrossRef]
- Hess, M.; Kopke, P.; Schult, I. Optical properties of aerosols and clouds: The software package OPAC. Bull. Am. Meteorol. Soc. 1998, 79, 831–844. [Google Scholar] [CrossRef]
- Yu, H.; Chin, M.; Winker, D.M.; Omar, A.H.; Liu, Z.; Kitaka, C.; Diehl, T. Global view of aerosol vertical distributions from CALIPSO lidar measurements and GOCART simulations: Regional and seasonal variations. J. Geophys. Res. Atmos. 2010, 115, D00H30. [Google Scholar] [CrossRef]
- Holton, J.R.; Hakim, G.J. An Inroduction to Dynamic Meterorology; Academic Press: Waltham, MA, USA, 2013. [Google Scholar]
Figure 1.
Synoptic-scale plume of Saharan dust off the West Coast of Africa on 4 September 2005. Moderate-Resolution Imaging Spectroradiometer (MODIS) satellite (visible) image, courtesy NASA.
Figure 1.
Synoptic-scale plume of Saharan dust off the West Coast of Africa on 4 September 2005. Moderate-Resolution Imaging Spectroradiometer (MODIS) satellite (visible) image, courtesy NASA.

Figure 2.
(a) Aerosol optical depth (AOD) patterns for 3 September 2005, and for (b) 4 September 2005 (bottom), which is the same day as the visible image shown in Figure 1. Also shown are the major dust source regions, termed “hot spots” by Engelstaedter and Washington [14]; three are located over West Africa, denoted by WA1, WA2 and WA3, and one is located over the Bodélé Depression in Chad, denoted by BOD. We constructed the AOD patterns by fusing data from the Moderate-Resolution Imaging Spectroradiometer (MODIS) instrument onboard the Aqua and Terra satellites. Note: Satellite-derived AOD measurements are often underestimated over deserts [29].
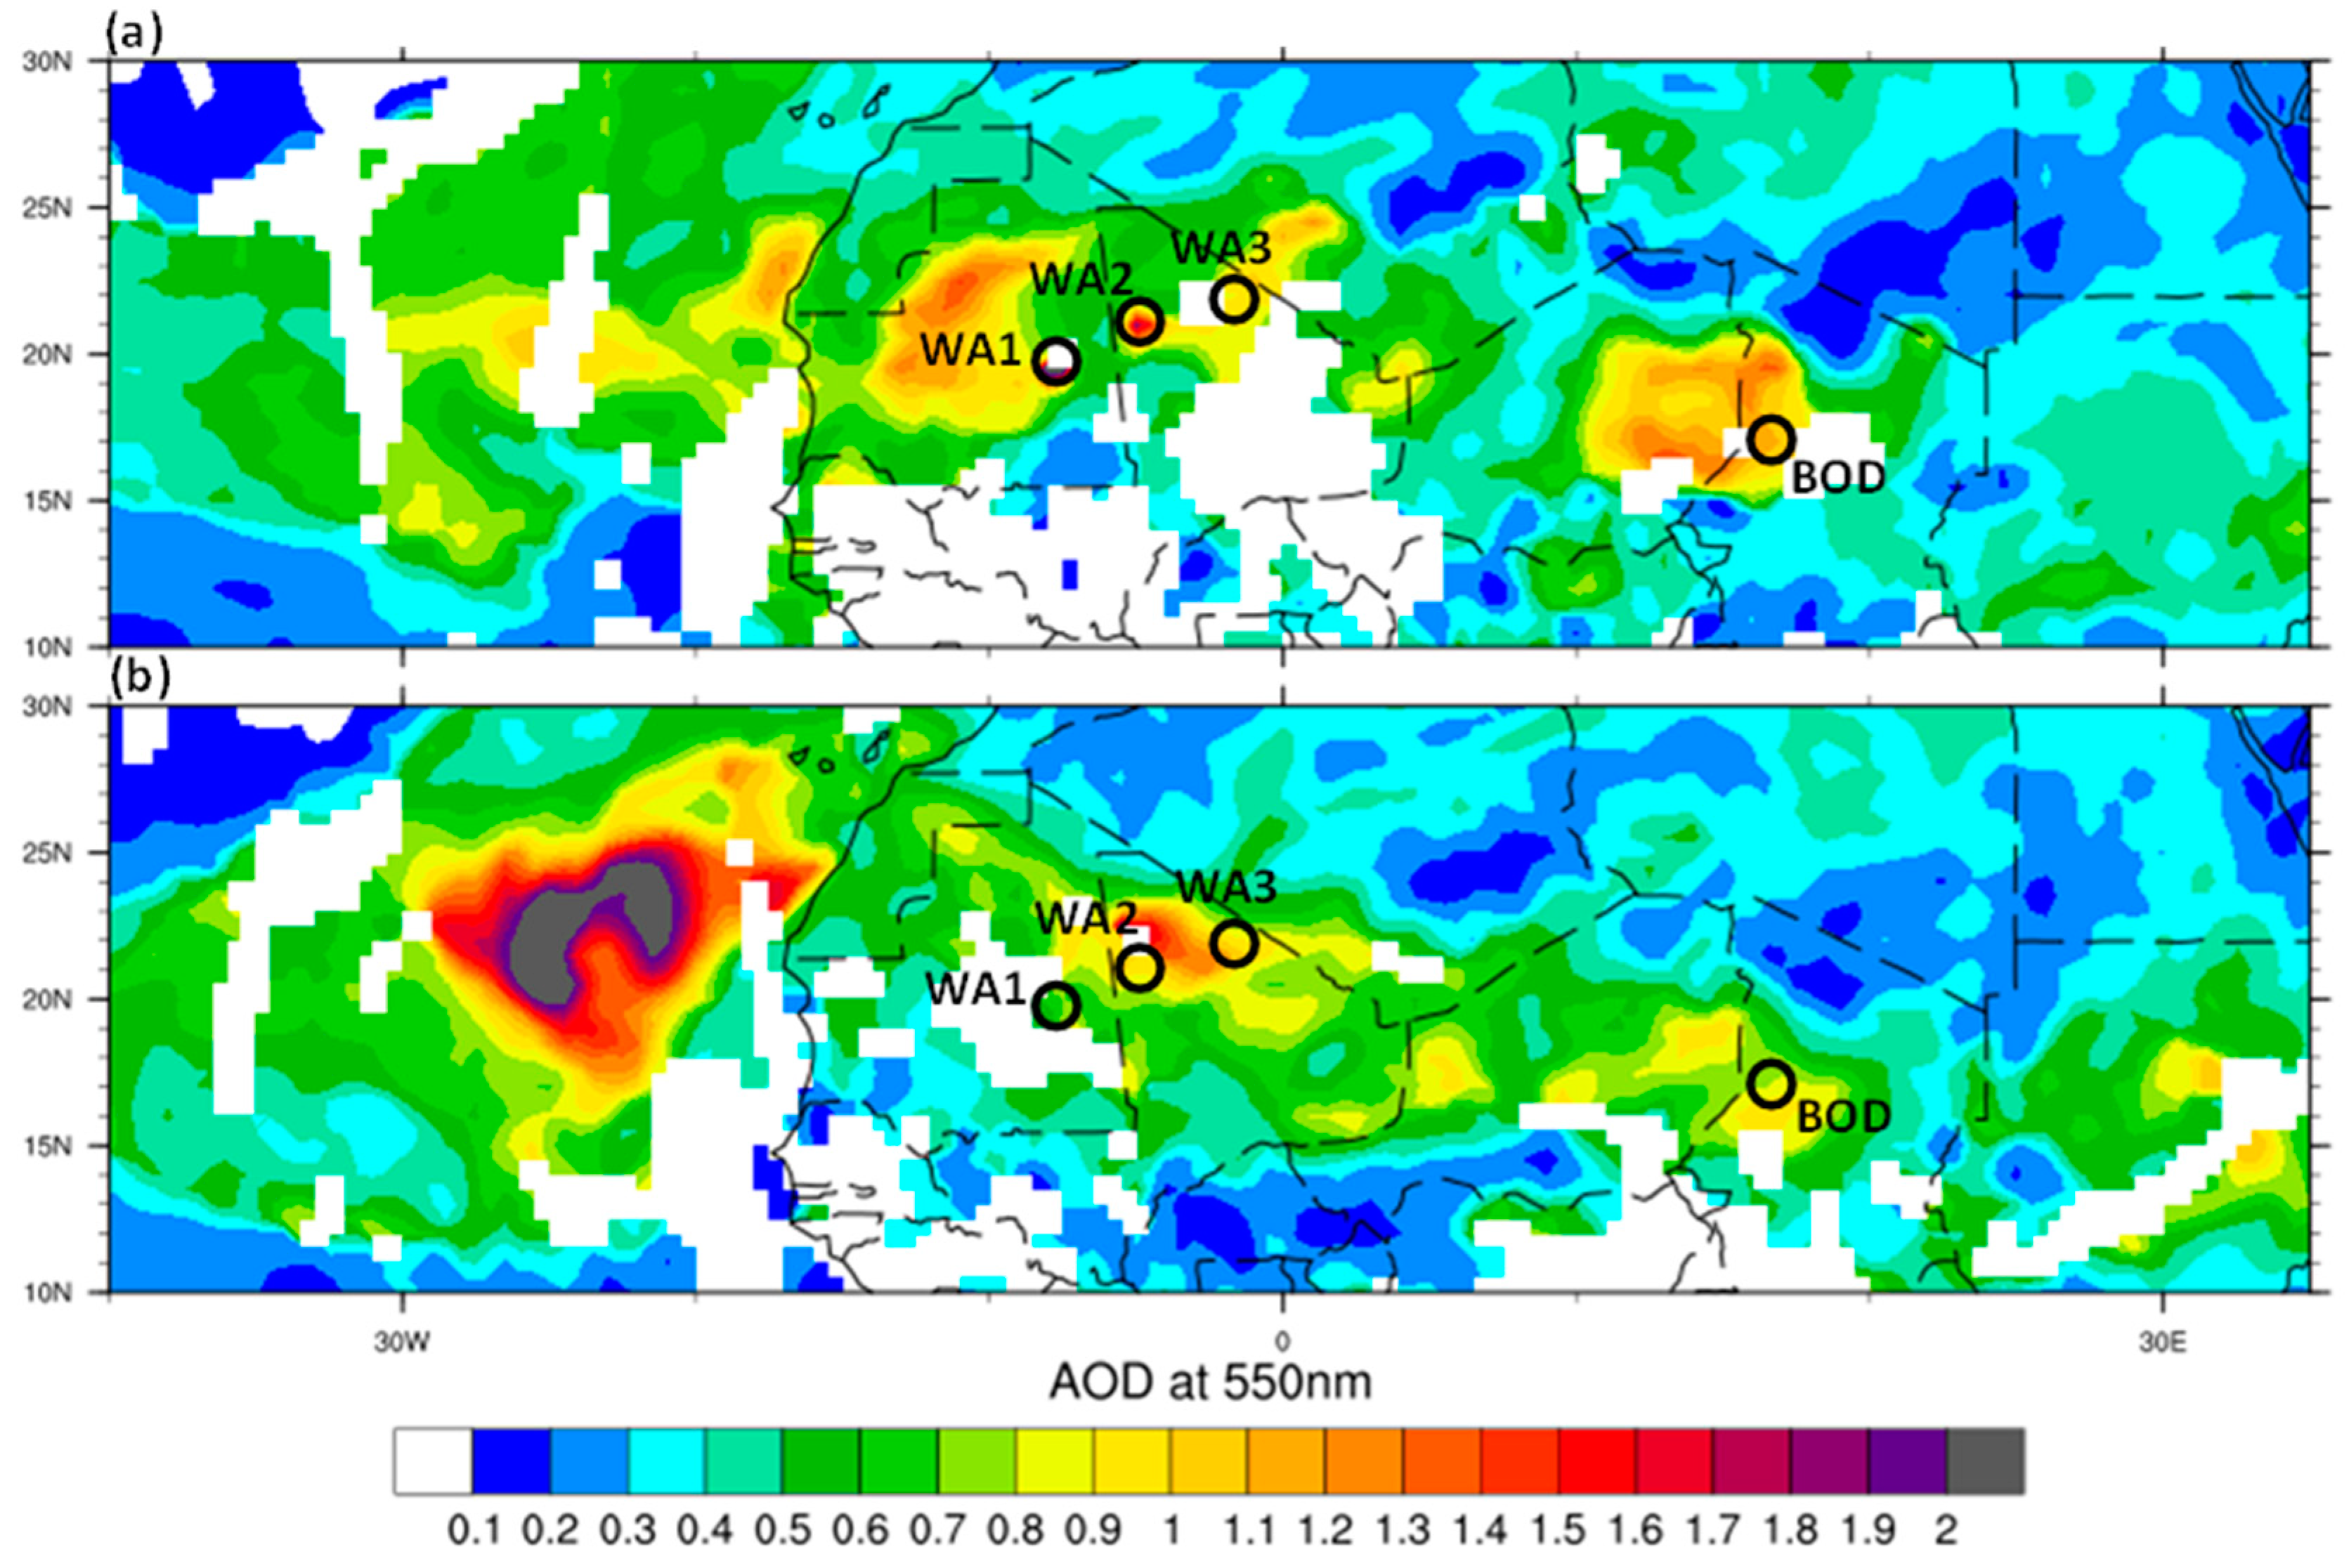
Figure 3.
Schematic of the linear dynamics of dust-modified African easterly waves (AEWs) and their corresponding Eliassen-Palm (EP) and dust flux divergences, which affect the zonal-mean wind, temperature, and dust field tendencies. The pathways that connect the linear response of the AEWs to the direct radiative effects of dust (blue boxes) have been examined by Grogan et al. [26,27] and Nathan et al. [28]. The eddy dust transports, which are contained within the dust flux divergence (green box), are the focus of this study. See text for additional details.

Figure 4.
(a) Basic state zonal wind (solid) and potential temperature (dashed). Contour interval: 2 ms−1 for the wind and 3 K for the temperature. (b) Basic state dust mixing ratio for the sum of the 12 particle sizes. Color interval: 100 µg kg−1. The African easterly jet (AEJ) core is denoted by ‘⦻’.
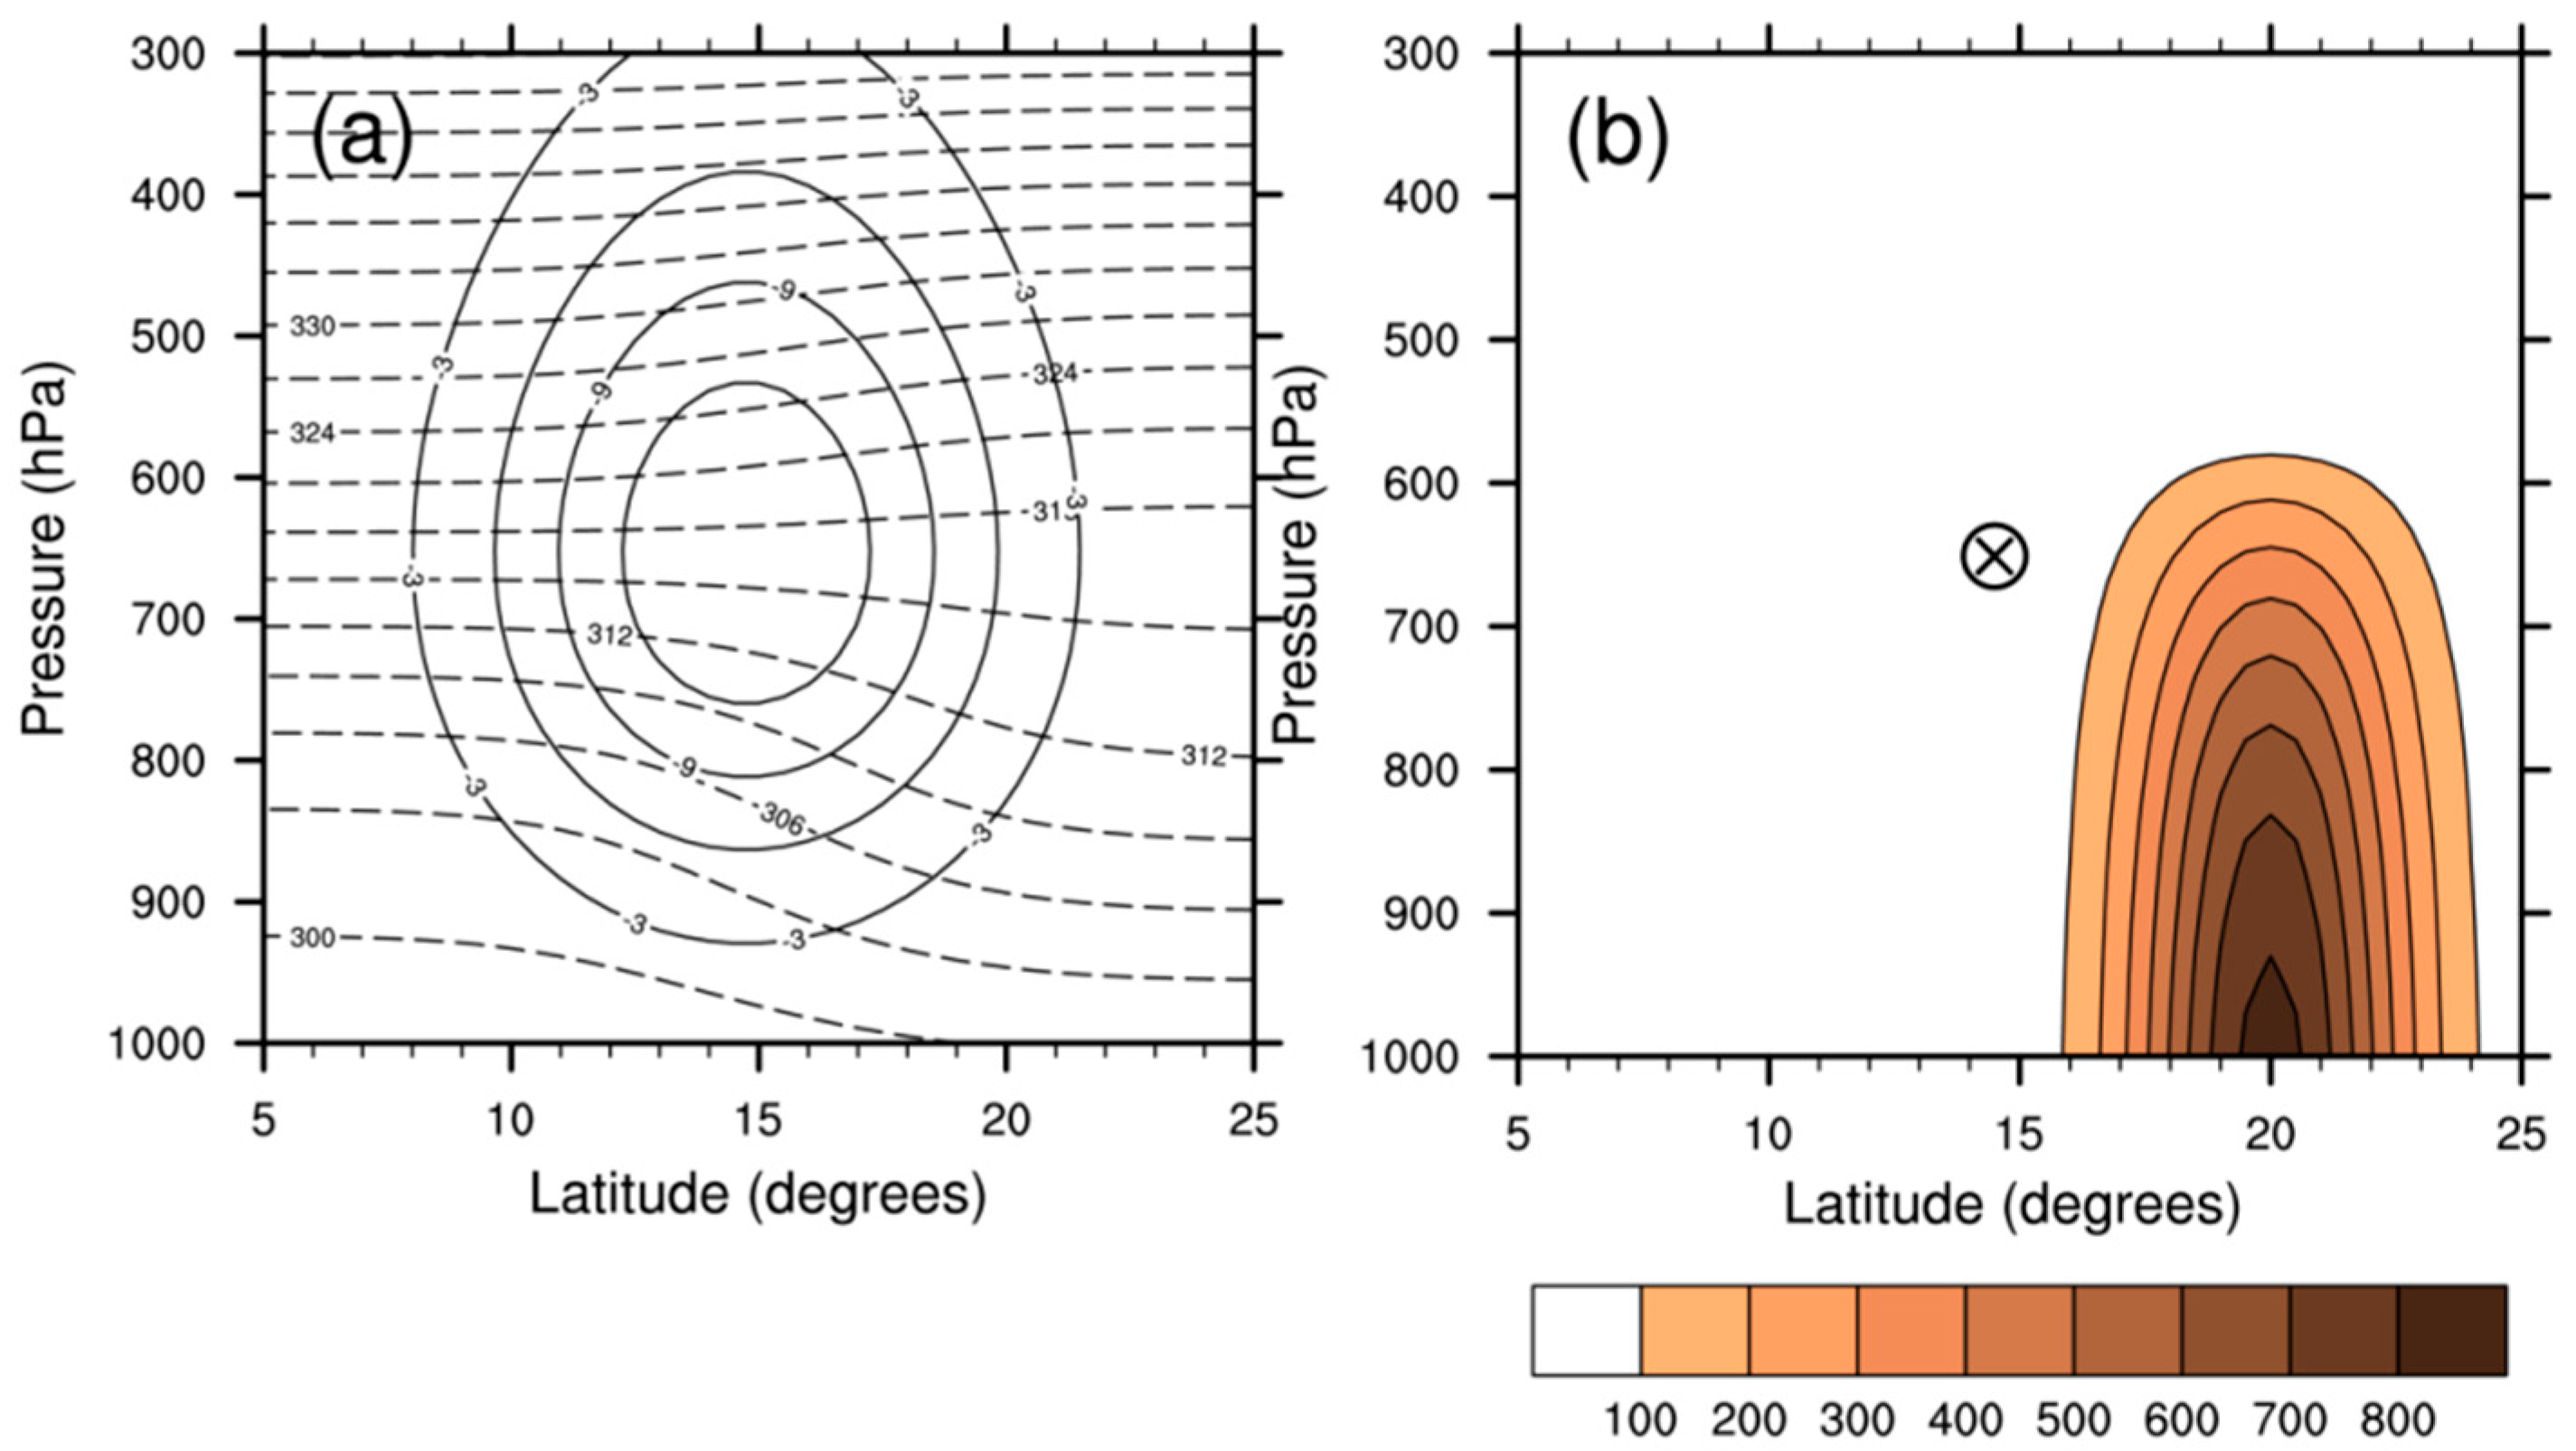
Figure 5.
Zonal-mean dust transports in the (a) meridional direction and (b) vertical direction for the most unstable AEW. The dashed and solid contours in (a) denote, respectively, equatorward and poleward transports. The solid contours in (b) denote upward transports. Contour spacing: 10−6 kg m−2 s−1. The bold contour identifies the critical surface.
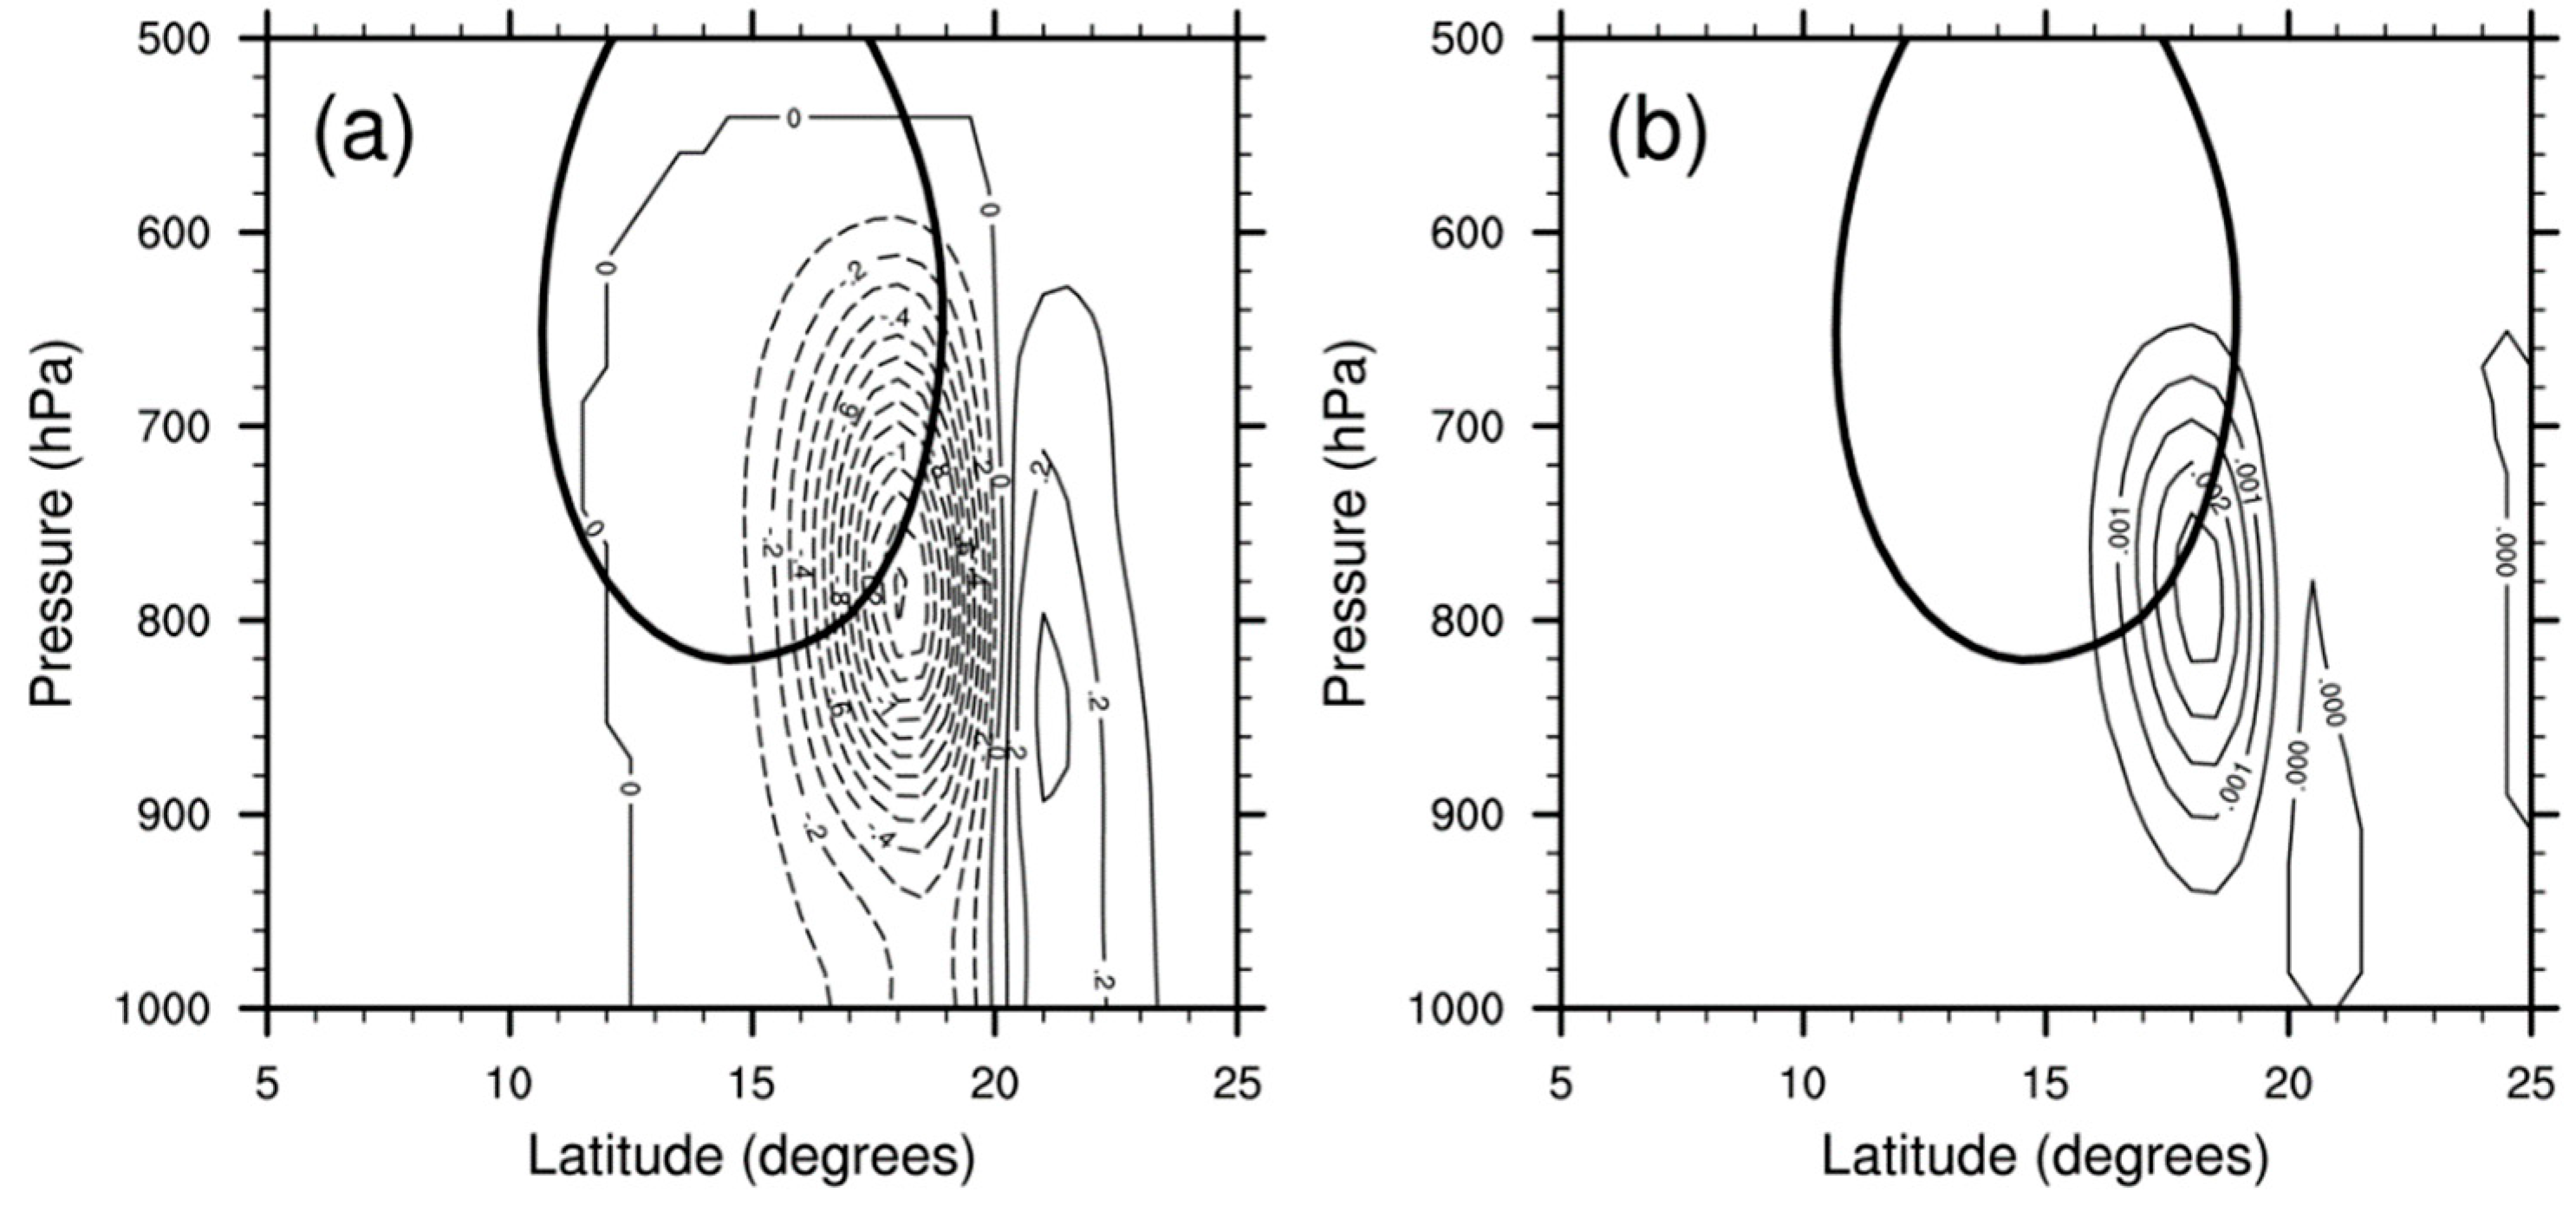
Figure 6.
Phase angles for the meridional wind (; black), vertical wind (, blue) and dust mixing ratio (; red) at (a) 18° N and (b) 22° N.
Figure 6.
Phase angles for the meridional wind (; black), vertical wind (, blue) and dust mixing ratio (; red) at (a) 18° N and (b) 22° N.
© 2019 by the authors. Licensee MDPI, Basel, Switzerland. This article is an open access article distributed under the terms and conditions of the Creative Commons Attribution (CC BY) license (http://creativecommons.org/licenses/by/4.0/).
Share and Cite
MDPI and ACS Style
Nathan, T.R.; Grogan, D.F.P.; Chen, S.-H. Saharan Dust Transport during the Incipient Growth Phase of African Easterly Waves. Geosciences 2019, 9, 388. https://doi.org/10.3390/geosciences9090388
AMA Style
Nathan TR, Grogan DFP, Chen S-H. Saharan Dust Transport during the Incipient Growth Phase of African Easterly Waves. Geosciences. 2019; 9(9):388. https://doi.org/10.3390/geosciences9090388
Chicago/Turabian StyleNathan, Terrence R., Dustin F. P. Grogan, and Shu-Hua Chen. 2019. "Saharan Dust Transport during the Incipient Growth Phase of African Easterly Waves" Geosciences 9, no. 9: 388. https://doi.org/10.3390/geosciences9090388
Note that from the first issue of 2016, this journal uses article numbers instead of page numbers. See further details here.