Cyclogenesis and Density Currents in the Middle East and the Associated Dust Activity in September 2015


1
NYUAD Institute, New York University Abu Dhabi, Abu Dhabi 999041, UAE
2
National Center for Meteorology, Abu Dhabi 999041, UAE
3
Laboratoire Interuniversitaire des Systèmes Atmosphériques (LISA), CNRS and Université Paris-Est Créteil, Université de Paris, 94010 Créteil, France
4
Research Department, Turkish State Meteorological Service, Ankara 06120, Turkey
*
Author to whom correspondence should be addressed.
Geosciences 2019, 9(9), 376; https://doi.org/10.3390/geosciences9090376
Submission received: 2 July 2019
/
Revised: 24 July 2019
/
Accepted: 26 July 2019
/
Published: 29 August 2019
(This article belongs to the Special Issue Observing Atmospheric Dynamics and Dust Activity)
Abstract
:The first 10 days of September 2015 were marked by intense dust activity over the Middle East and the Arabian Peninsula. This study examines the atmospheric conditions at the origin of the large dust storms during this period. We particularly investigate the atmospheric dynamics leading to the development of a large dry cyclone over Iraq on 31 August 2015 which in turn generated an intense dust storm that affected most of the countries around the Arabian Gulf and lasted for 5 days. We found that the cyclone developed over Northwest Iraq as a transfer to low levels of a cut-off low which had formed two days earlier at upper levels over Turkey. Large dust loads exceeding 250 tons were emitted and moved southeast in a cyclonic shape toward the Arabian sea. The second large dust storm on 6-8 September 2015 occurred over Syria and affected all the coastal countries on the eastern side of the Mediterranean Sea. It was associated with the occurrence of a series of density currents over northeast Syria emanating from deep convection over the mountainous border between Syria and Turkey. The unusual development of deep convection over this area was associated with a blocking high and interaction with orography. Both the cut-off high and the cut-off low occurred during a period characterized by a meandering polar jet and an enhanced subtropical jet causing unstable weather over mid-latitudes which in turn led to highly polluted atmosphere by natural dust in the affected countries.
1. Introduction
Mineral dust plays a key role in the Earth’s system. Despite being emitted from relatively limited areas around the globe, dust aerosols impact the climate regionally and globally by virtue of their transport over long distances and interaction with radiation and clouds during their presence in the atmosphere. Dust aerosols are also known for their contribution to the deterioration of air quality in highly populated areas which has adverse effects on human health and socio-economic factors (e.g., [1,2,3,4,5,6,7]). Dust modulates the global energy budget directly via its interactions with radiation and indirectly via its influence on clouds and precipitation formation processes (e.g., [7]). Furthermore, dust aerosols play an important role in different processes relevant for weather and climate but they remain a significant uncertainty in the estimation the Earth’s energy budget in a changing climate [8]. An essential phase in the dust cycle is the emission of dust aerosols from source areas. This process is mainly controlled by atmospheric processes which determine the time of the occurrence, its intensity, its duration, mixing, accumulation and transport. Therefore, it is crucial to identify the mechanism deriving dust emissions and transport from source regions in order to be able to represent them correctly in climate models which in turn will help to reduce the uncertainty in the estimation of the projected emissions and account accurately for dust impacts. This is particularly needed for major dust source regions such as the Middle East.
A recent study by reference [9] has found that the direct dust–climate feedback is enhanced by over an order of magnitude close to source regions where it could play an important role in shaping the future climates of these regions including the Middle East and the Arabian Peninsula (Figure 1a). [10] identified a positive Aerosol Optical Depth (AOD) trend over large parts of the Middle East during the period 2001 to 2012 and their results suggested that increasing temperature and decreasing relative humidity in the last decade have promoted soil drying, leading to increased dust emissions and AOD. According to other recent studies [11,12] an unprecedented upsurge of dust storms in West Asia, particularly west of the Iranian plateau, has been observed in the last decade. They identified the northern floodplains of Iraq as the most active dust sources in the region (see Figure 1a). Furthermore, the references [12,13] identified the eastern region of Syria and northwestern region of Iraq as an emerging dust source in the last two decades. They attributed its emergence to the extreme drought conditions in the Fertile Crescent during this period, the soil being composed from a mixture of loam and clay (e.g., [14]). They also found that dust storms in this area peak during summer.
For dust emission, numerous atmospheric processes on synoptic, regional and local scales provide the meteorological conditions throughout the year suitable for dust mobilization over areas rich in erodible material. It is the combination of sources rich in erodible material, energetic wind systems and a coupling to wind system that facilitate long-range transport [15,16,17]. Dust emissions in the Middle East during summer are mainly attributed to Shamal winds [14] and references herein); a permanent daytime surface-wind pattern associated with the formation, during the night, of a low-level jet (LLJ) typically at 500 m above ground level over desert areas as a result of the strong temperature inversion near the surface after sunset [18]. The daytime near surface winds—called Shamal—at the origin of dust emission, are associated with the downward transfer of momentum from the nocturnal low-level jet to the surface due to turbulent mixing after solar heating commences each day at sunrise [19,20]. The northwesterly winds associated with the Shamal occur as a result of the interaction of two circulating pressure centers: the low pressure cell over Iran and a semi-permanent high over northwestern Saudi Arabia and northeastern Africa [21]. This typical pattern results in strong north-to-south pressure gradients which gives birth to the Shamal-related LLJ winds. The compaction of the east–west pressure gradient along the Zagros Mountains further intensifies these winds while restricting them to the western Arabian Gulf (e.g., [22]).
Other effective mechanisms for dust emission and transport over long range distances have been highlighted over other arid areas. Of relevance to our study, two important mechanisms, namely Cyclogenesis [23,24,25] and density currents fed by evaporationally cooled air, are related to deep moist convection over deserts [26,27,28,29,30]. Both mechanisms can produce quite dramatic dust storms.
For instance, over North Africa, cyclones can generate heavy dust storms [31,32] with dust loads estimated at 8 Tg per episode (e.g., [23]). The development of these depressions, mostly to the southeast of the Atlas Mountains, is favored by the strengthening of the meridional temperature gradient over northern Africa during spring time (e.g., [23]) and they are triggered by the intrusion of an upper level trough from high-latitudes [25,33]. About 25% of the total dust emissions in spring over North Africa is due to the occurrence of Saharan cyclones (e.g., [24]). The majority of these cyclones moves eastward following the coast line of the African continent. This trajectory is mainly favored by the presence of the subtropical jet at about 7 km in altitude over Africa during this period of the year (see [23] for more details). Reference [34] conducted a study over 8 years on the dust transport over the Mediterranean region. They found that Saharan cyclones are the main atmospheric systems that cause extreme dust transport events in the Mediterranean region, especially at its eastern side. They showed that up to 20% of dust events, are related to Saharan cyclones and that when considering only extreme dust events, the contribution of Saharan cyclones reached 70%.
Despite their effective role in dust emission and transport over long distance, no attention has been given to dust activity associated with cyclogenesis in the Middle East, one of the major dust sources on a global scale (e.g., [35]) and where cyclones are a ubiquitous feature. For instance, the reference [36] have elaborated an 18-year climatology of cyclogenesis in the Mediterranean Region and identified Syria and Iraq as one of the major areas in the Middle East for cyclone formation during summer with the highest cyclone frequency found between July and September. The month of August being characterized by very frequent and persistent cyclones, lasting for more than 52 h on average. They also found that cyclogenesis events are concentrated in the lee of mountains and are being primarily determined by the topography of the region. However, they concluded that the mechanisms for the formation of cyclones in this area are still unclear.
On the other hand, in dry and hot desert environments the evaporation of precipitation is a very common phenomenon. [26,27] found that cooling by evaporation of convective precipitation in the deep and dry sub-cloud layer over desert regions can generate intense downdrafts, long-lived and extensive atmospheric density currents. The strong gusts at the leading edges of the density currents can cause dramatic dust storms [29]. For instance, over the Sahel and the Sahara, density currents generate fast moving dust walls known as haboobs with lifetimes of several hours and horizontal extensions of 10–80 km [30,37,38,39,40]. In this process, the mountains play an important role by triggering convection, by downslope acceleration of the cool air and by fostering the accumulation of fine-grained sediments along their foothills through the action of water [26]. In the Middle East, a major dust source on a global scale, this mechanism has not been studied extensively most probably because of the lack of sufficiently high resolution observational data.
In this study, we investigate, for the first time the formation of a cyclone over Iraq (Figure 1b) and deep convection generating density currents over Syria (Figure 1c) to highlight the mechanisms leading to their occurrence and their role in the observed high dust activity in September 2015 in the Middle East and surroundings areas. The paper is organized as follows: After the introduction in Section 1, the datasets used is this study are described in Section 2. The dust storm associated with the cyclone is presented in Section 3 including the synoptic situation prior to cyclogenesis (3.1), the characteristics of the cyclone (3.2), the characteristics of the dust storm (3.3) and the southward transport (3.4). The dust storm caused by density currents is analyzed in Section 4. We conclude with a short discussion in Section 5.
2. Data
2.1. Reanalysis Data
To investigate the atmospheric dynamics that triggered the cyclone formation, we use the European Center for Medium Weather Forecast (ECMWF) ERA 5 reanalyses [41] for their higher temporal and spatial resolution (hourly at approximately 31 km with 137 levels to 0.01 hPa). ERA5 also has a more recent model and data assimilation system. The 6-hourly datasets of near-surface dust concentration (in µgm-3) and Aerosol Optical Depth (AOD) were obtained from the Modern-Era Retrospective Analysis for Research and Applications-2 (MERRA-2) reanalysis database at spatial resolution of 0.5 × 0.625° and at 72 hybrid-eta levels from surface to 0.01 hPa [42]. MERRA-2 reanalysis has been increasingly available for studying dust events and their interrelation with meteorology over the globe [43,44].
2.2. Space-Borne Observations
Observations at high spatio-temporal resolution from the Spinning Enhanced Visible and Infrared Imager (SEVIRI) on board the Meteosat Second Generation (MSG-SEVIRI) geostationary satellite are used in this study in order to qualitatively characterize the dust activity over Iraq associated with the cyclone and the transport towards the Arabian Gulf, as well as the dust storm produced by the density currents over Syria. The horizontal distribution of dust is described using the SEVIRI images computed from a combination of three infrared channels, namely channel 10 (12 μm), channel 9 (10.8 μm) and channel 7 (8.7 μm). MSG-SEVIRI is located geostationary at 0 °W over the equator and provides images of the Middle East on a 15-min temporal resolution. False-color images are created using an algorithm developed by EUMETSAT which colors red the difference between the 12.0 and 10.8 μm channels, green the difference between the 10.8 and 8.7 μm channels and blue the 10.8 μm channel (e.g., [45,46]). On these composite images, dust appears pink or magenta and cloud appear orange or brown. Dry land looks from pale blue (daytime) to pale green (nighttime). Thick, high-level clouds have red-brown tones and thin high-level clouds appear very dark (nearly black). Note that the dust effect on brightness temperature differences depends on its altitude (e.g., [47]) suggesting that these composite images may favor the dust which is elevated so that its radiating temperature differs significantly from the ground.
To observe the three-dimensional (3D) distribution of desert dust plumes (vertical and horizontal) we use the newly-developed retrieval: AEROIASI [48] version 2. This approach uses IASI hyperspectral observations [49]; provided by AERIS/ESPRI data center https://iasi.aeris-data.fr) to provide a 3D map of dust distribution for each overpass of IASI, both over land and ocean. AEROIASI gives also mean and top altitudes of dust layers together with the associated Aerosol Optical Depth (AOD) at 10 µm. Detailed information on the AEROIASI retrieval of dust distribution can be found in [48].
Furthermore, information about the vertical distribution of dust during the cyclone event is provided from particle extinction coefficient profiles at 532 nm derived from CALIOP measurements of attenuated backscatter profiles (or reflectivity profiles at 532 nm). They are obtained from our own calculation (using level 1B version 3.30 data) as that by [50] with a vertical resolution of 60 m and a horizontal resolution of roughly 12 km. We expect the uncertainty on the extinction coefficient and on the AOD to be on the order of 30% (and may be greater for AOD greater than 2), accounting for an uncertainty of 20% on both the backscatter-to-extinction ratio and the multiple scattering coefficients. It is worth noting that all the instruments/platforms are part of the A-Train except for MSG. The A-train orbit overpasses the Middle East twice a day, once during the daytime (between 1230 and 1430 UTC, Universal Coordinated Time) and once during the night-time (between 0030 and 0230 UTC) and has a revisit time period of the same orbit of 16 days [51]. The data is available through the ICARE Web portal (http://www.icare.univ-lille1.fr).
Finally, the orography map was produced using the ETOPO1 Global Relief Model data (doi:10.7289/V5C8276M) available from the National Center for Environmental Information (NCEI) of the National Oceanic and Atmospheric Administration (NOAA).
3. Dust Storm Associated with Cyclogenesis on 31 August–3 September 2015
3.1. The synoptic Situation Prior to Cyclogenesis
Figure 2a,b shows respectively the geopotential height (GPH) at 250 hPa and 500 hPa on 30 August 2015. A closed upper-level low known as a cut-off low is seen in the upper levels of the atmosphere over southern Turkey centered at 35E—36N associated with GPH of 10500 gpm at 250 hPa (Figure 2a) and about 5650 gpm at 500 hPa. The cut-off low was characterized by a cold core associated with temperatures 5 °C below the surrounding environment (Figure 2b).
A cut-off low is a cold low in the middle and upper troposphere developed over the subtropics and mid-latitudes from a deep trough in the westerlies [52,53,54,55]. During the formation of a cut-off low, air of polar origin is cut off from the main subpolar belt of low pressure and cold air, the normal track of depressions. It usually begins as a trough in the upper-air flow, becomes a closed circulation with a cold core nearly stationary for days and then extends down to the surface during the last stage of its life cycle (e.g., [25,33,56]). A cut-off low is an unstable baroclinic system that slopes to the west with height and is usually associated with very unstable weather in the atmosphere below it [33].
On 30 August 2015, there was no signature of a low-pressure system at low levels in the atmosphere (Figure 2e). A wavy polar jet with core wind speeds exceeding 30 m/s was seen to reach as far south as 48N (Figure 2c). The subtropical jet with core winds exceeding 20 m/s stands out clearly around 30N (Figure 2c). The cut-off low was associated with high values of potential vorticity (PV) at 300 hPa exceeding 3 PVU (Figure 2d). Also, high values of PV are seen to be associated with the meandering polar jet (50–55 N) and the subtropical jet around 30N (Figure 2d).
At low levels, strong temperature gradient at 925 hPa is seen over western Iraq enhanced by sea-breeze effects during night (Figure 2f). The upper level cut-off low moved eastward following the main westerly flow in the upper atmosphere. It reached western Iraq on 31 August where orographic blocking by the Anti-Taurus Mountains in southeast Turkey (Figure 1a) and steep temperature gradient at the surface (Figure 2f) favored the extension of the low from upper levels to the surface. The cut-off low stretched toward lower levels first on 31 August at 1000 UTC (Figure 3a) within a region of strong low-level baroclinicity centered at 43E and 36N (Figure 2f) initiating surface cyclogenesis.
Three conditions were reunited in the synoptic circulation leading to cyclogenesis over Iraq: The cut-off low which in its final stage played the role of disturbance at upper level, orographic blocking which mainly defined the location of cyclogenesis and strong temperature gradient at the surface which increased instability at low levels.
This is similar to what previous studies have shown for other regions. For instance, over North Africa it has been shown that a meandering polar jet can lead to a highly mobile subtropical jet (e.g., [57,58]) which in the presence of a mountainous barrier and an upper-level disturbance, such as a trough or a cut-off low as we have seen here, can trigger a surface cyclone south to the mountains [25]. A cut-off low has been also identified as a main feature contributing to cyclogenesis at the surface near the Brazilian coast (e.g., [59]). Here we show that this mechanism can also operate over arid areas that is, the Middle East with the difference that the cyclone we obtained here is dry and no precipitation was associated with it. Furthermore, other studies have shown that this type of interaction between large-scale features can be reinforced by dust radiative feedbacks over arid areas triggering intense cyclogenesis that can overcome the lack of moisture (e.g., [60]).
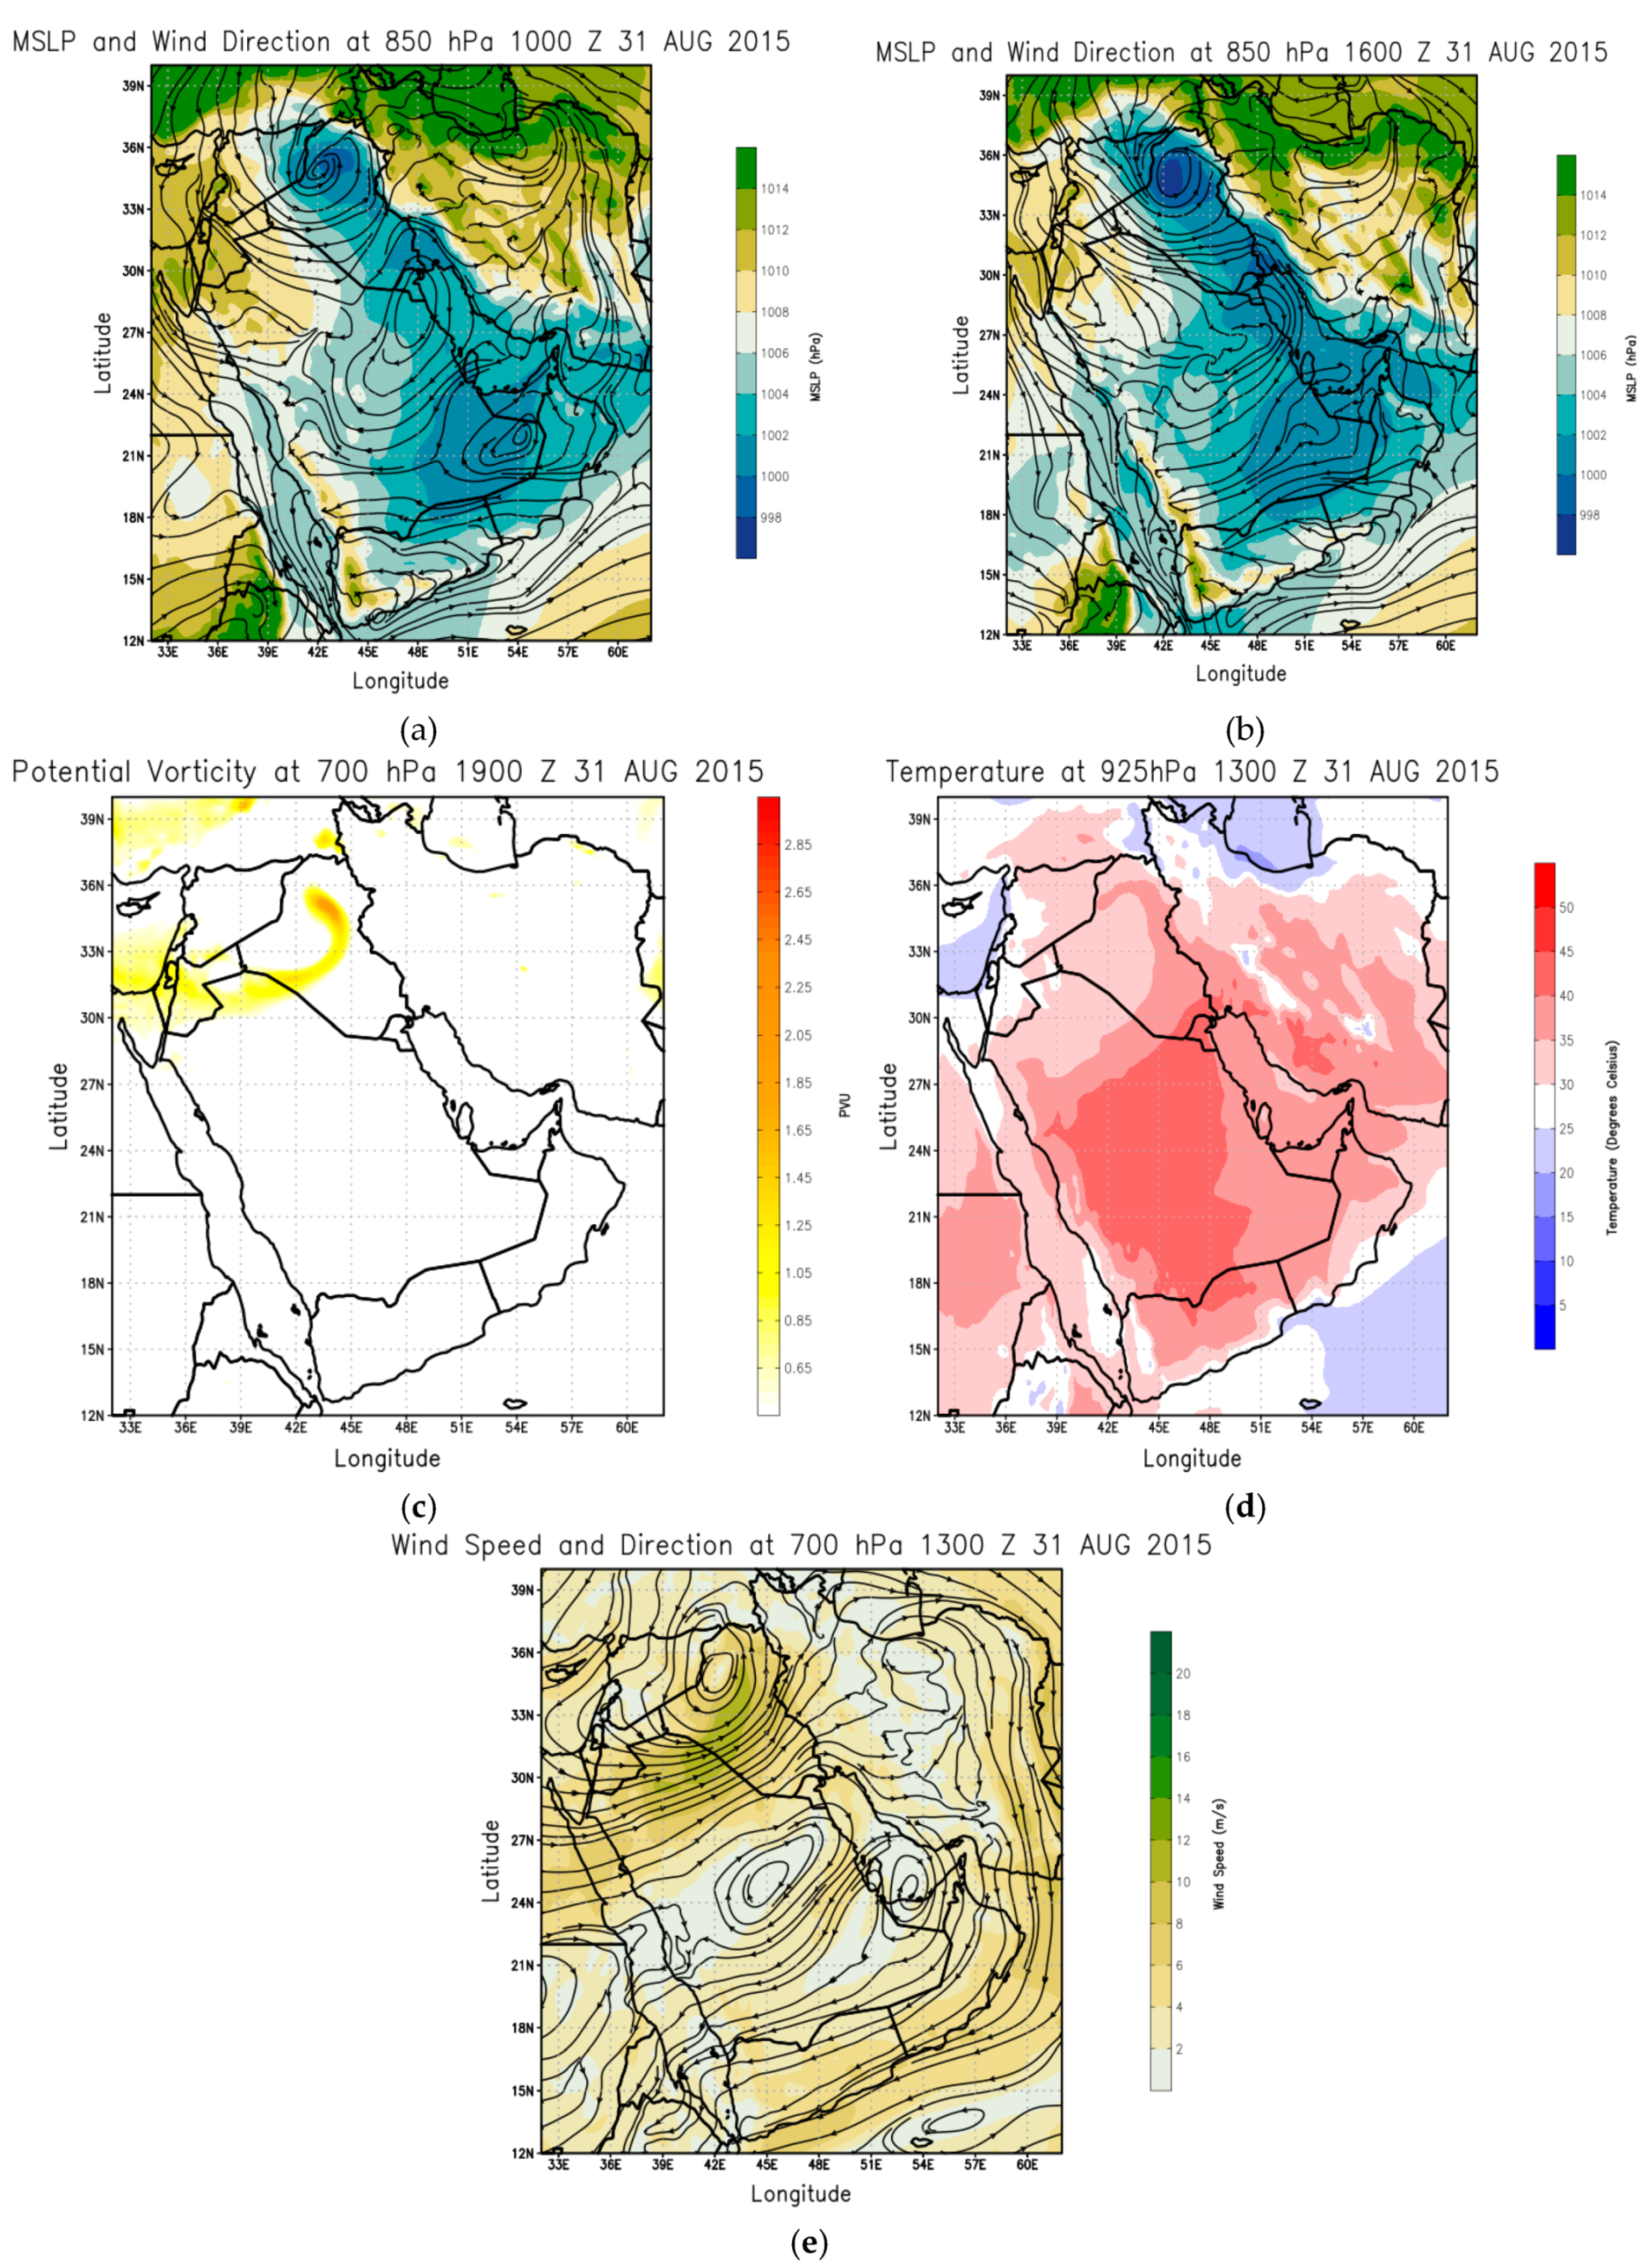
3.2. Characteristics of the Cyclone
The cyclone formed on 31 August 2015 at 1000 UTC over northwestern Iraq. It was centered at 42E and 35N (Figure 3a) and was characterized by a surface pressure anomaly of about 6 hPa at its center with respect to the environment (Figure 3a). The center of low pressure associated with the cyclone deepened with time and covered larger area (Figure 3b). In the afternoon of 31 August, the surface pressure anomaly at its center reached 9 hPa (Figure 3b). In the PV field at 700 hPa the developing cyclone was typified by comma-shaped high PV values exceeding 2 PVU on 31 August at 1900UTC (Figure 3c). During the formation and the intensification stages the cyclone was characterized by a warm front east of the low associated with surface temperatures of 45 °C (Figure 3d). The strongest winds around the cyclone center are seen in the regions of strong temperature gradient at the cold front (5 °C, Figure 3d) and they reached 16 m/s (Figure 3e). Calm winds (2 m/s and less) were seen at the center of the cyclone (Figure 3d). After remaining stationary for one day and half over northwestern Iraq, the cyclone started to migrate slowly over a confined region eastward and then southward (not shown) guided by the main northwesterly flow present in general at low levels over Iraq due to channeling effect by the surrounding mountains namely the Zagros Mountains in west Iran and the Najd plateau in central Saudi Arabia (Figure 1a). The dry cyclone dissipated over the Arabian Gulf on 3 September 2015.
3.3. Characteristics of the Dust Storm Generated by the Cyclone
In Iraq, deserts occupy approximately 40% of its total surface and they cover mainly the western and southern parts of the country. Dust sources are set in a vast alluvial plain located in the Mesopotamian Plain that extends southward from 100 km north of Baghdad to the Arabian Gulf covering approximately 130,000 km2 (e.g., [14]). The seasonal drying of the numerous lakes and marshes maximize the dust erosion from these alluvial deposits during summer. The cyclone formed over this area at the end of the summer (as we detailed in the previous section) and its associated strong near-surface winds generated a massive dust cyclone that was visible in pink and purple colors in the MSG SEVIRI satellite imagery during the whole cyclone lifetime. A thick dust cloud in comma shape can be seen developing over Iraq on 31 August 2015 at 1900UTC (Figure 4a) and it almost doubled in size by 01 September 2015 at 0200UTC (Figure 4b). The cyclone was a dry one and no cloud band was associated with it (Figure 4a,b). The MSG SEVIRI Aerosol Optical Depth (AOD) at 550 nm associated with the dust cloud exceeded 3 on 1 September around noon time (not shown) in agreement with the AOD at 532 nm derived from CALIPSO observations shown in Figure 4e. The estimated dust mass column density derived from MERRA2 re-analyses reached 2 g per m2 on 31 August (Figure 4c) and increased to 3 g per m2 the following day (Figure 4d). CALIPSO observations crossing over the cyclone on 31 August 2015 shows the interesting structure of the dust cyclone with a clear center around 35 N and two thick dust layers to the north and to the south of it (Figure 4e). On the vertical, the dust layer in the southern sector of the cyclone (i.e., between 29N and 34 N) was between the surface and 1km in altitude, whereas the dust layer to the north of the cyclone center seen around at 36 N in Figure 4e extended from the surface and up to 3km in altitude. This structure infers the strong convergence and updraft in the warm sector of the cyclone found usually to the northeast of its center (e.g., [23]).
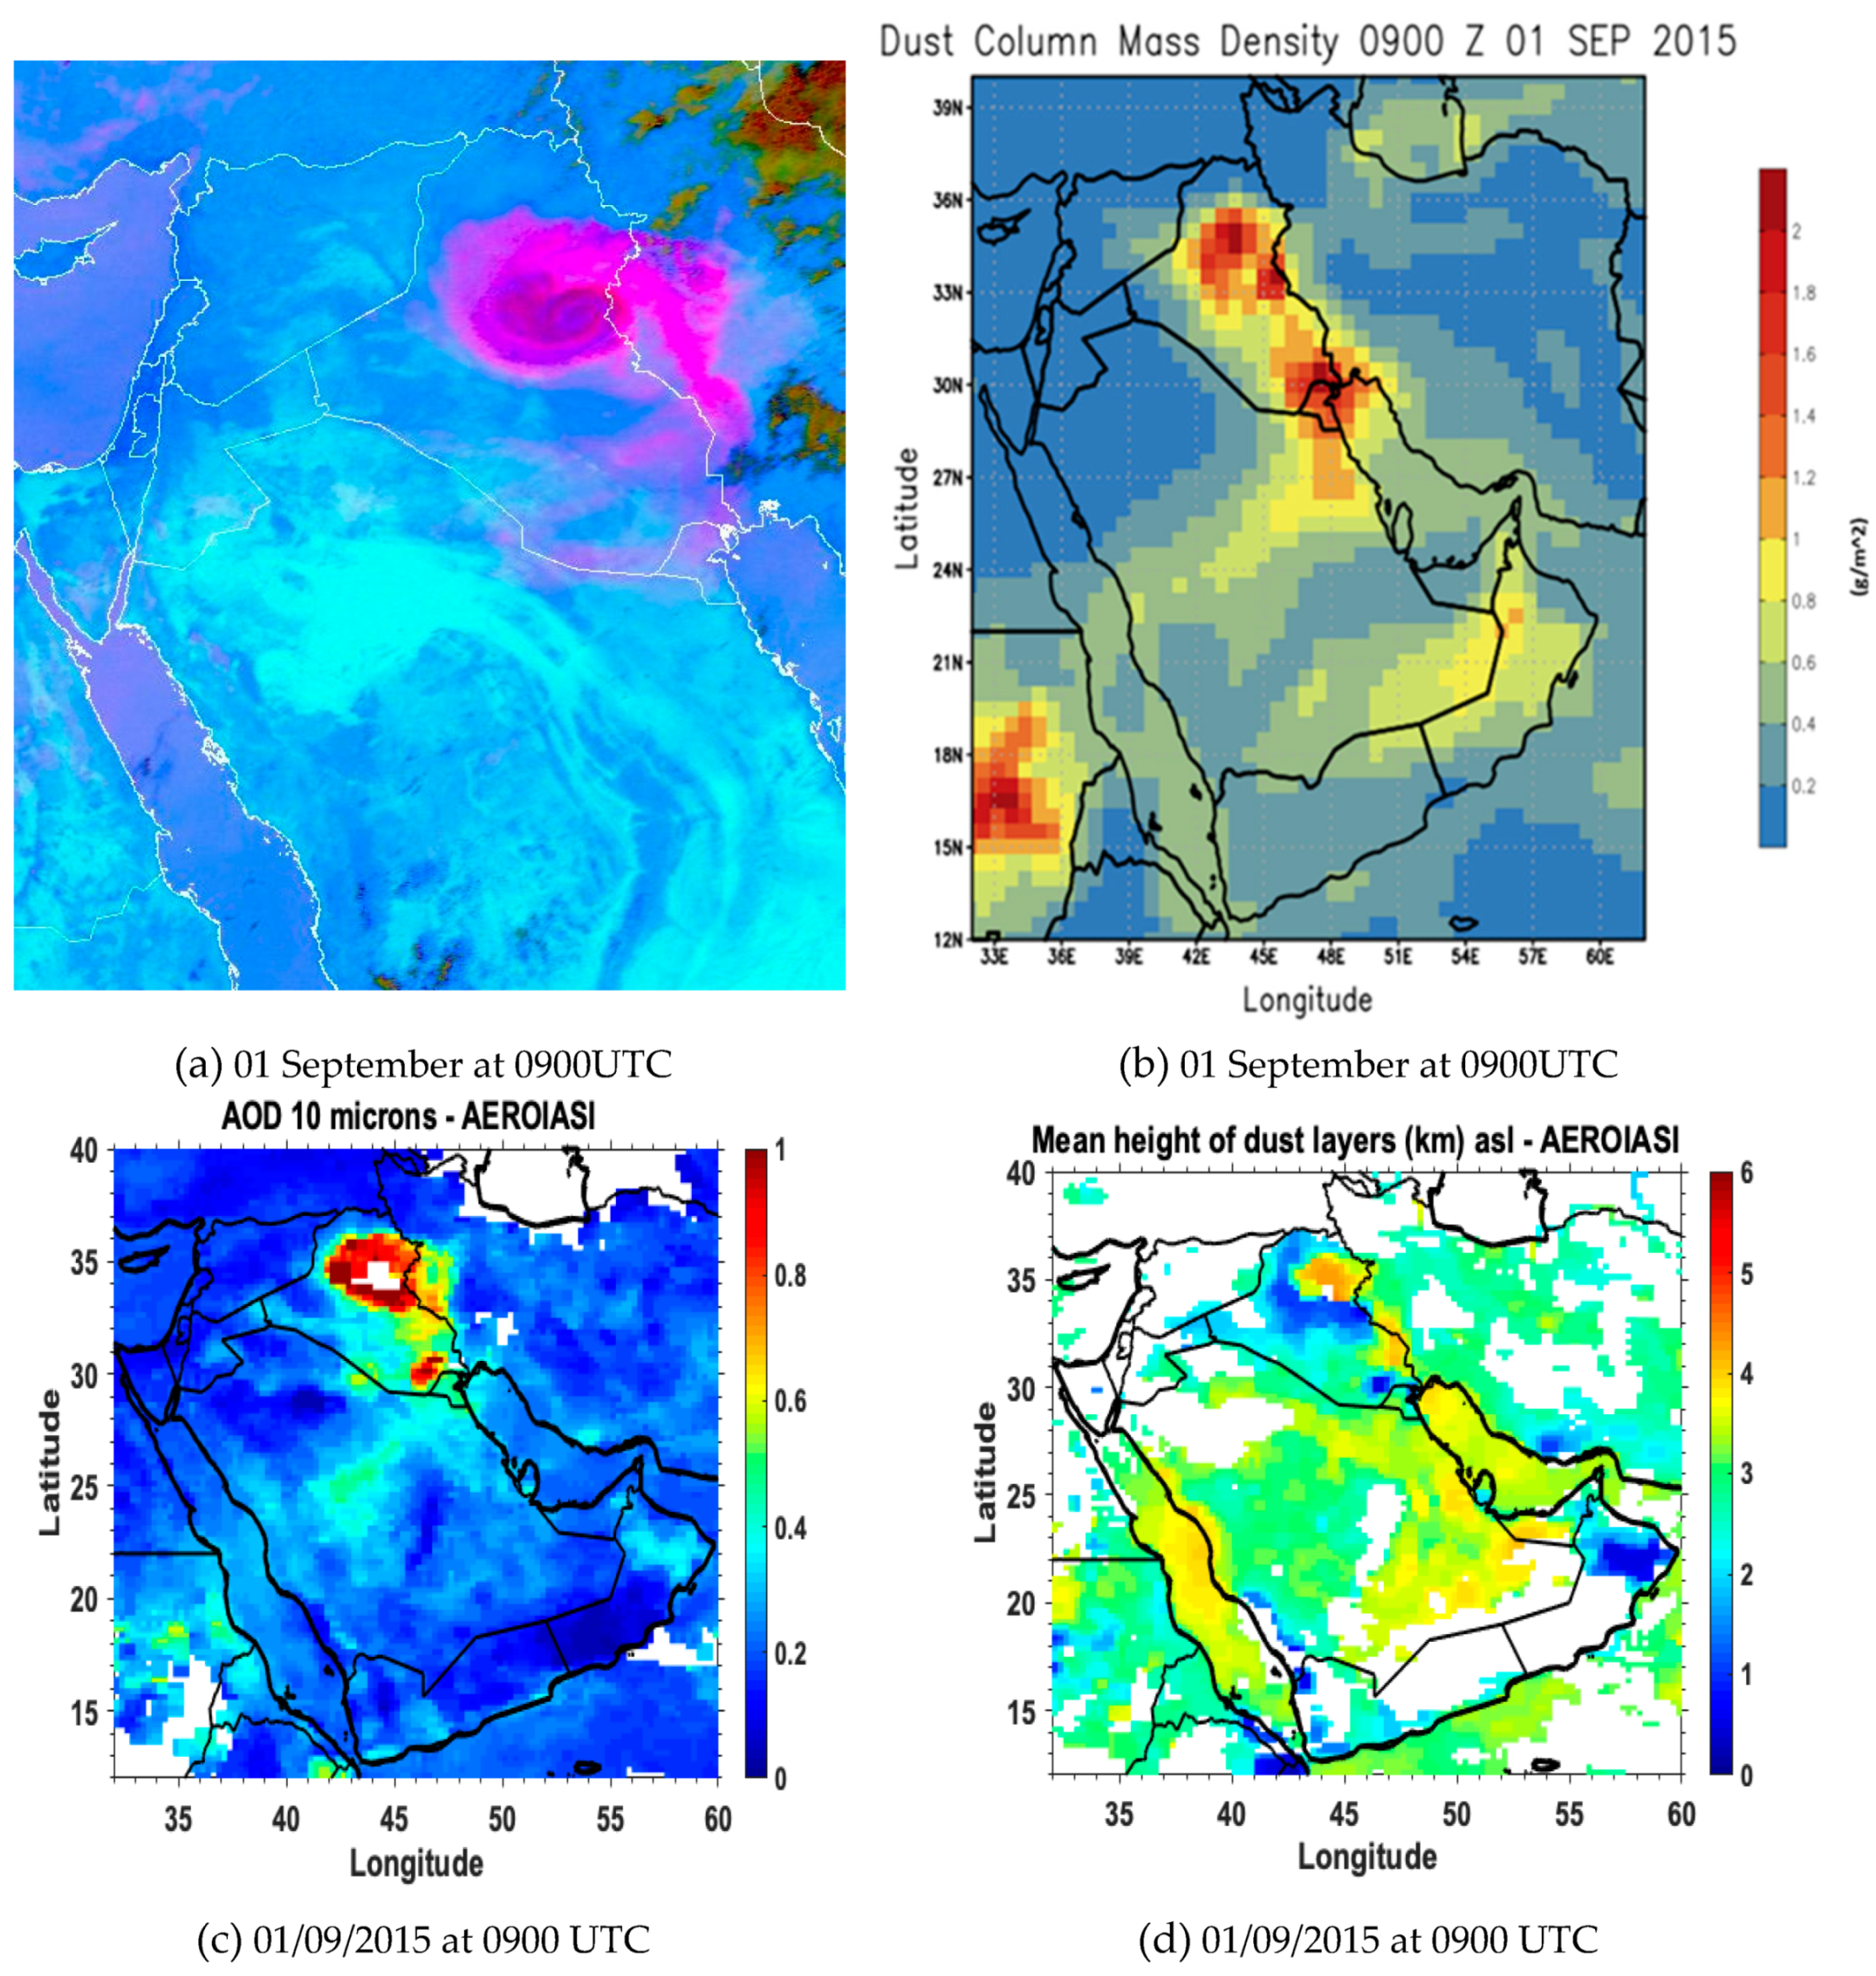
During the daytime on 1 September 2015 the cyclone intensified and additional dust emissions occurred as the cyclone span over central Iraq (Figure 5a). Dust column mass density exceeded 2 g per m2 on 01 September at 0900UTC (Figure 5b) and most of the country was affected by the storm as well as parts of western Iran (Figure 5a). AODs derived from AEROIASI satellite product at 10 microns associated the dust cloud with AOD value of 1 (Figure 5c). The difference with the previous products which observed AOD values of 3 is mainly explained by the difference in the wavelengths. The mean height of dust layers and the full 3D distribution of dust, both derived from AEROIASI, are shown in Figure 5d–e. A curl-like shape of the dust cyclone is clearly observed for the first time in 3D, as depicted by the iso-surface of 0.1 km−1 of dust extinction at 10 µm (Figure 5e). The cyclone has a tilted structure with height, where higher dust layers (up to 4 km and 6 km of respectively mean and top altitudes) are seen in the warm northeastern sector of the cyclone (Figure 5d) and lower dust layers (from the surface and up to 2 km of altitude and up to 1 km in mean altitude) in the western and southern sectors of the cyclone associated with the cold front (Figure 5d). Cyclogenesis has been recognized over other regions as an effective mechanism for intense dust emissions and rapid injection into high altitudes (e.g., [23,25]) making the dust available for long range transport. This was also confirmed in the case under scrutiny.
3.4. Transport Towards the Arabian Gulf
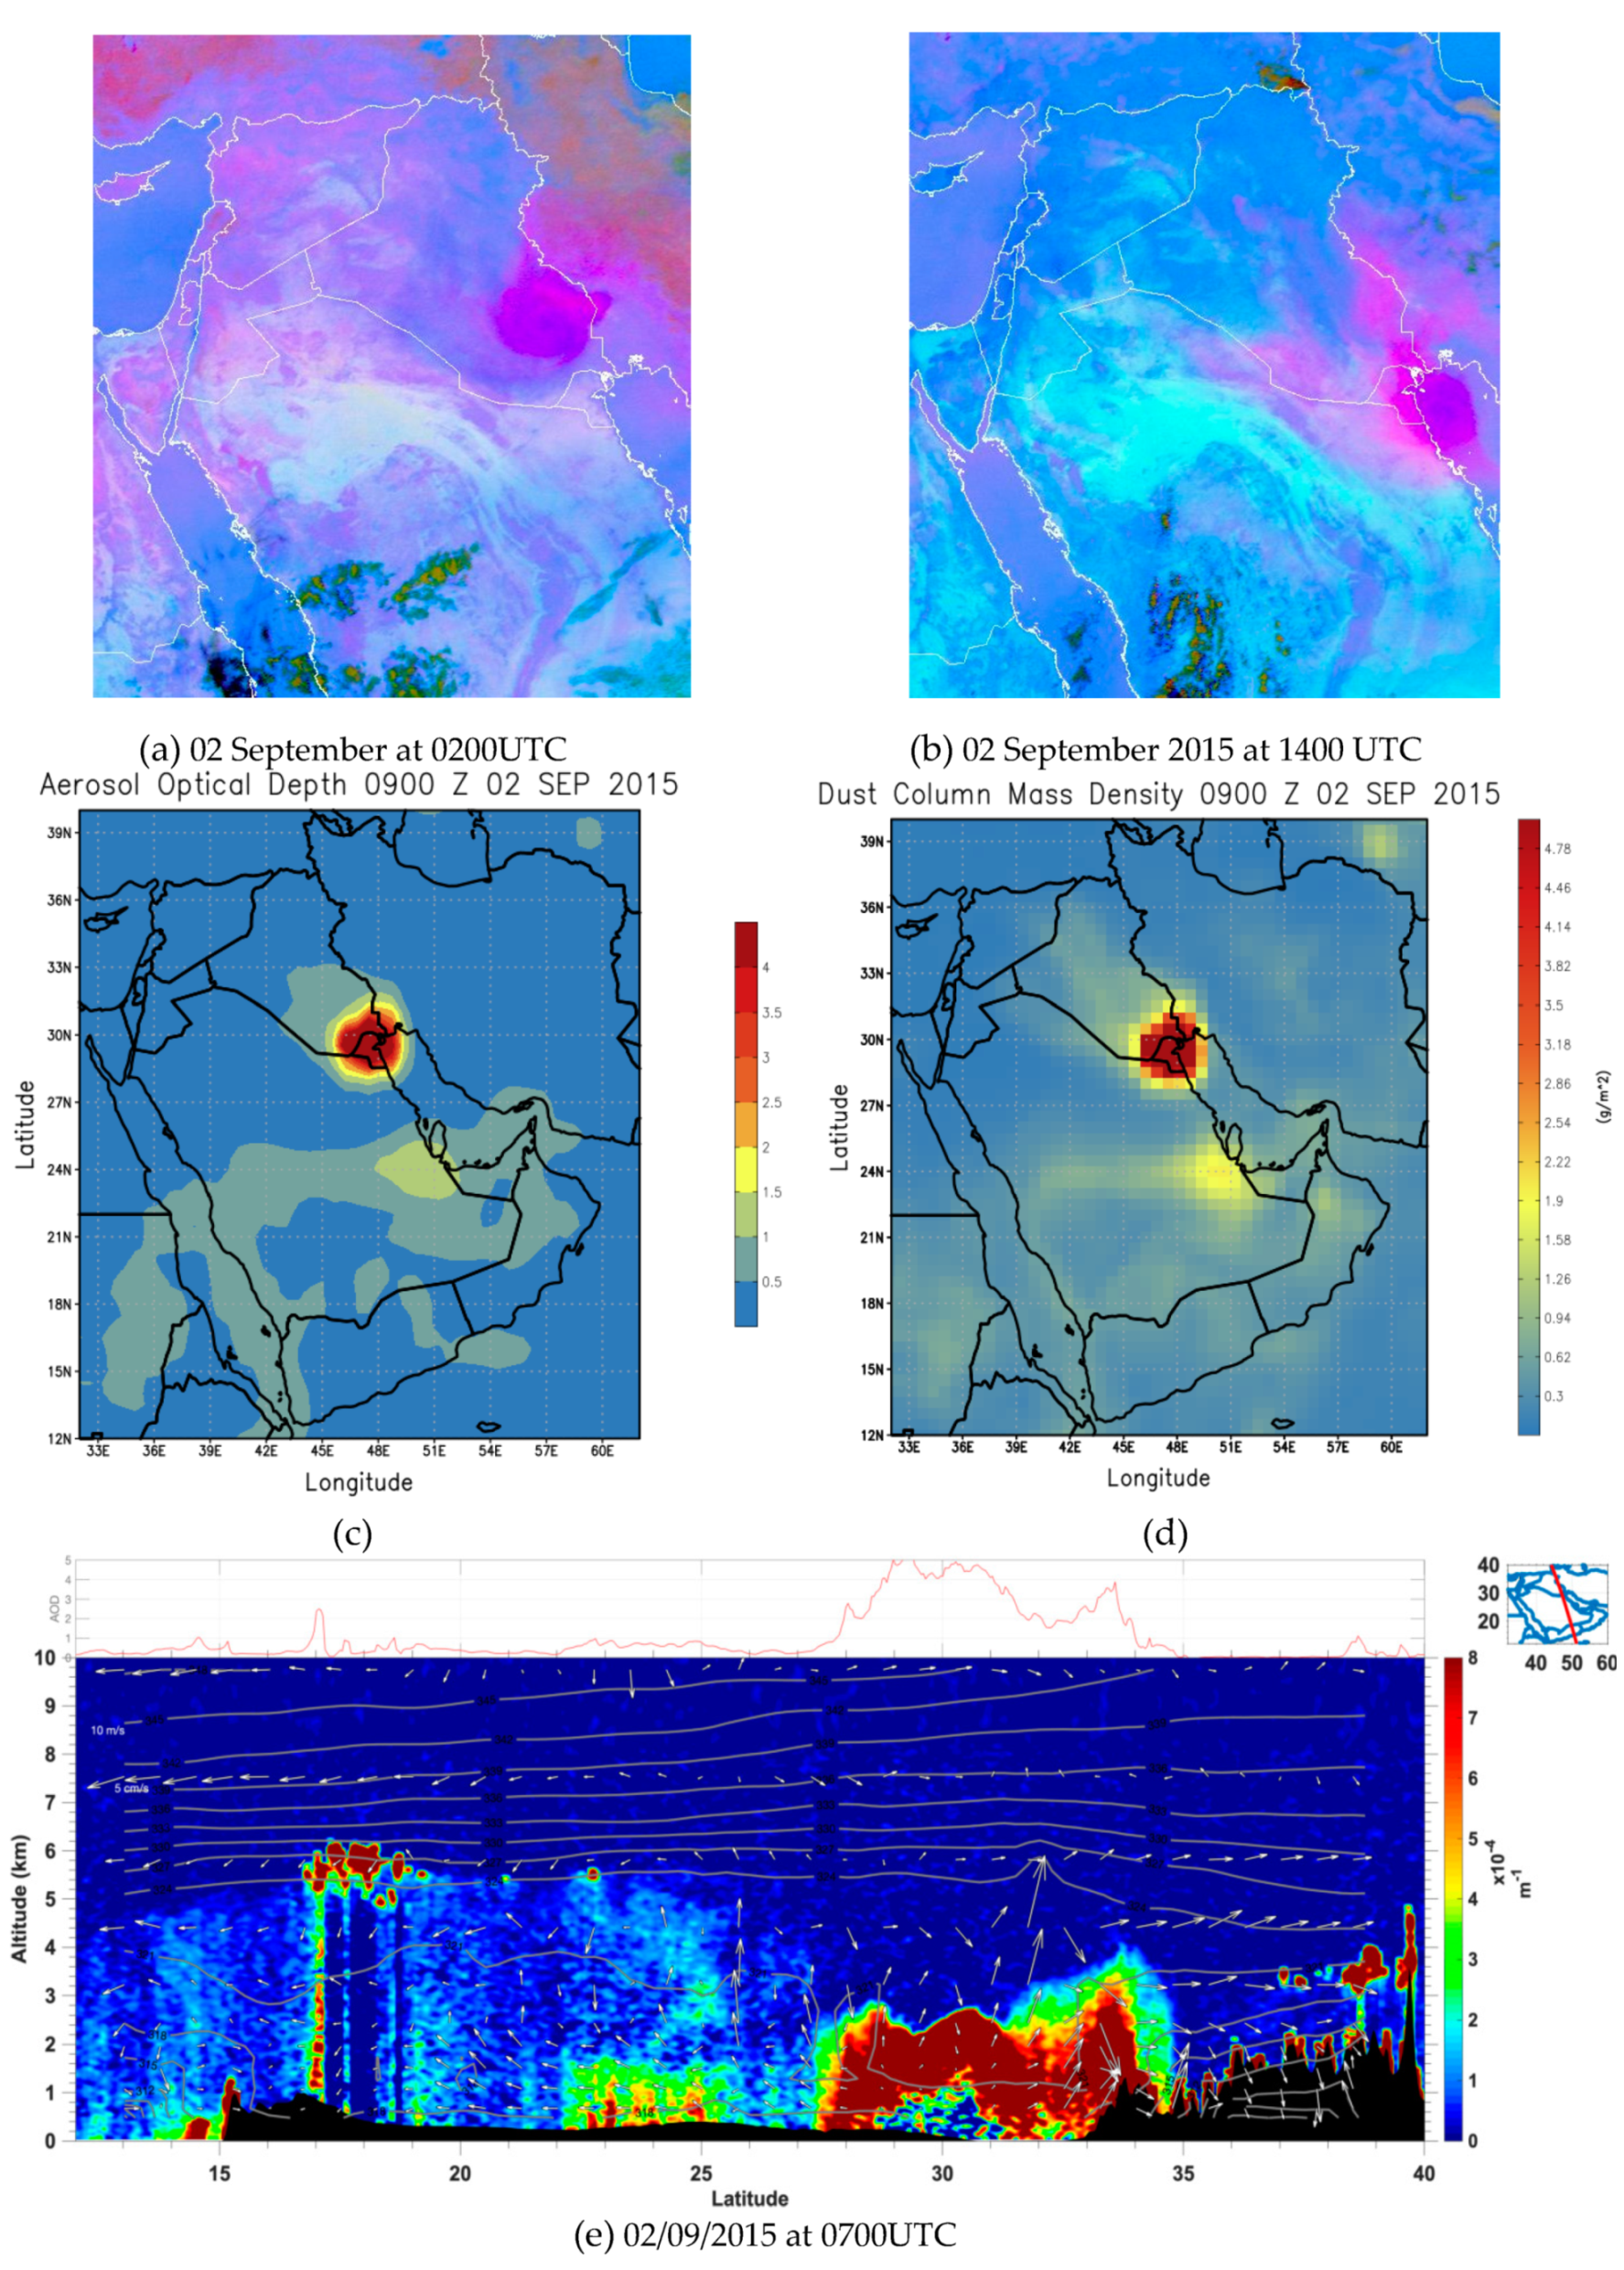
The cyclone started its migration southward spanning over southern Iraq (Figure 6a), a major dust source area (e.g., [14]). Strong cyclonic winds continued to cause intense dust emissions where AOD exceeded 4 (Figure 6c) and dust column mass density exceeded 5 g per m2 (Figure 6d). The cyclone exited land on 2 September 2015 at 1400 UTC (Figure 6b) transporting heavy dust loads estimated at 250 tons toward the Arabian Gulf and the surrounding countries. CALIPSO satellite crossed over the dust cyclone as it was leaving Iraq by the south on 2 September at 0900UTC (Figure 6e). A well-mixed and thick layer of dust associated with the highest values of backscatter reflectivity in Figure 6e was seen to stretch from the surface and up to 3 km in altitude and to blanket all the areas between 28N and 33N (Figure 6e). The dust layer was associated with extremely high values of AODs at 532 nm up to 5 (Figure 6e). The blue spots near the surface around 30N associated with low reflectivity values were most probably the result of the complete attenuation of the CALIOP signal by the thick layer of dust above them where AODs values were the highest (Figure 6e).
Worth mentioning that the absorption and multiple scattering of radiation by the airborne dust may significantly amplify the heating of the boundary layer creating a deep mixed layer. Attempts to quantify the heating rates of the lower atmosphere due to dust during Saharan storms for instance lead to values between 10 °C day−1 [61] and 6 °C day−1 [62]. In the Sahara and other desert regions, the role dust plays in the radiative processes of the lower troposphere seems to overcome the lack of moisture and release of latent heat, leading to unexpectedly strong cyclogenesis over these regions [63].
4. Dust Storm Associated with Density Currents on 6–8 September 2015
An intense dust storm affected the Eastern Mediterranean on 6–8 September 2015 and was the subject of many recent studies among them [64,65,66,67] where the dust activity was analyzed from different perspectives and using a panoply of observational data together with modelling studies. These studies highlighted the exceptional character of this event first by its occurrence and second by its intensity.
The reference [64] wrongly attributed the dust storm on 6–8 September 2015 to the dust emitted by the cyclone we investigated in the previous section. They argued that the storm near the coastal areas of the Middle East was associated with a cyclone and ‘Shamal’ winds that were immediately followed by an unusual wind reversal at low levels that spread dust west to the Mediterranean Coast. Our study shows that the dust emitted by the cyclone was transported south toward the Arabian Gulf and the Arabian Sea and did not affect any of the areas to the west of Iraq and that the event on 6–8 September is completely dissociated from the dust storm caused by the cyclone.
Figure 7 shows the MSG-SEVIRI satellite images for the event on 6–8 September 2015. The first dust plume appeared over northeast Syria on the morning of 6 September 2015 as a result of a density current and evaporation cooling associated with the development of convection over this area (Figure 7a). The cold air accelerates downhill and spreads sideways associated with strong turbulent winds that uplift dust. The resulting sharp outflow boundaries can be seen in satellite in Figure 7a. The second density current occurred on 6 September 2015 at 1800UTC and generated an arc-shaped dust wall that propagated westward (Figure 7b). Additional dust uplift occurred as strong downdrafts continued to emanate from the convective system (Figure 7c) aided by the daytime heating at the surface which enhance convective activity and by the formation of cold pools from the evaporation of precipitation over deserts (e.g., [26]).
During the night on 7 September 2015 the density currents loaded with dust and water vapor (seen in purple colors in Figure 7c) propagated fast westward and reached central Syria at 0100 UTC (Figure 7c). The dynamics of density currents over deserts (including their propagation speed, the associated turbulent mixing near the surface, their vertical and horizontal extent, horizontal and vertical wind shear) were documented in details in previous studies based on high resolution observational Lidar and radar data (e.g., [28,39] and on modelling studies [29]. These studies found that dust is effectively generated due to the development of near surface vortices and increased turbulence mixing along the frontal line. Recirculation of the elevated particles inside the density current head results in the formation of a moving “dust wall.”
The arc-shaped dust wall reached roughly 120 km in width encompassing Syria and parts of southern Turkey and western Iraq (Figure 7d). On the vertical the dust was confined in the density current layer and reached 1.5 km in altitude whereas the dust layer emitted from the density current in the morning hours was mixed up during the day and reached 4 km in altitude according to CALIPSO satellite observation acquired on 6 September 2015 at 2300UTC along a track crossing over Syria (Figure 7e). Complete attenuation of the Lidar signal was observed during this event inferring the exceptionally dense dust layers which were associated with AOD values of 4 (Figure 7e).
During the day on 7 September 2015, the dust emitted and transported westward at low levels within the density current during night, started to be mixed up throughout the boundary layer due to convective mixing after the sun started to warm up the surface (Figure 8a). It appeared as a homogenous layer loaded with dust between the surface and 3 km in altitude (Figure 8c). By the end of the day on 7 September the heavy dust cloud was seen to cover southern Syria, Lebanon, Cyprus, northeast Jordan and southwest Iraq (Figure 8a). It then spread and continued to migrate westward during the following days (Figure 8b) causing extreme dust conditions in Lebanon, Israel and the coastal areas of the East of the Mediterranean Sea (e.g., [67]). The dust storm remained over the coastal areas for almost 2 days (Figure 8b) where blocking ridge over central Mediterranean prevented prompt evacuation of the dust westward (not shown). Such blocking situation resulted in record-breaking dust loads over Cyprus for instance with aerosol optical depth exceeding 5.0 at 550 nm (e.g., [66]) causing severe air pollution in many cities around the Eastern Mediterranean.
Our results confirm those by [66] where the role of the density currents in generating extreme dust conditions during this event was demonstrated. However, the conditions behind the occurrence of deep convection during this event were remain unclear. Expanding on the results by [66], we investigate the atmospheric dynamics at upper level, leading to the formation of deep convection over northeast Syria. The occurrence of deep convection is the key process during this event because it is at the origin of both: the series of density currents and to the cold pools from evaporation cooling, which are the two mechanisms causing the intense dust storm on 6–8 September 2015.
Mountains are known for their critical role in making clouds (e.g., [68]). Deep convective clouds are generated when a combination of large- and small-scale effects occurs. Whereas larger-scale processes control whether or not convective clouds will be able to form, the role of the mountain circulations (i.e., smaller-scale) is in the initiation or triggering of these clouds at a given place and time. Thus, mountains play an important role in the temporal and spatial distribution of convection (e.g., [69]).
According to [68] (Figure 9 and references inhere), there are three major kinds of lifting which can operate simultaneously and lead to deep convection initiation: direct orographic forced lifting, convergence of thermally forced circulations and aerodynamic or obstacle effects. In arid mountainous regions, such as the Middle East, warm season convection is generally triggered by convergence and updrafts produced by thermally forced, daytime upslope circulations (e.g., [68]). In September 2015 case, obstacle effects including upstream blocking, upward motion caused by the turbulent wake and convergent flow downstream of the mountain range seem to be the most prominent triggers for convection that was favored by suitable large-scale conditions.
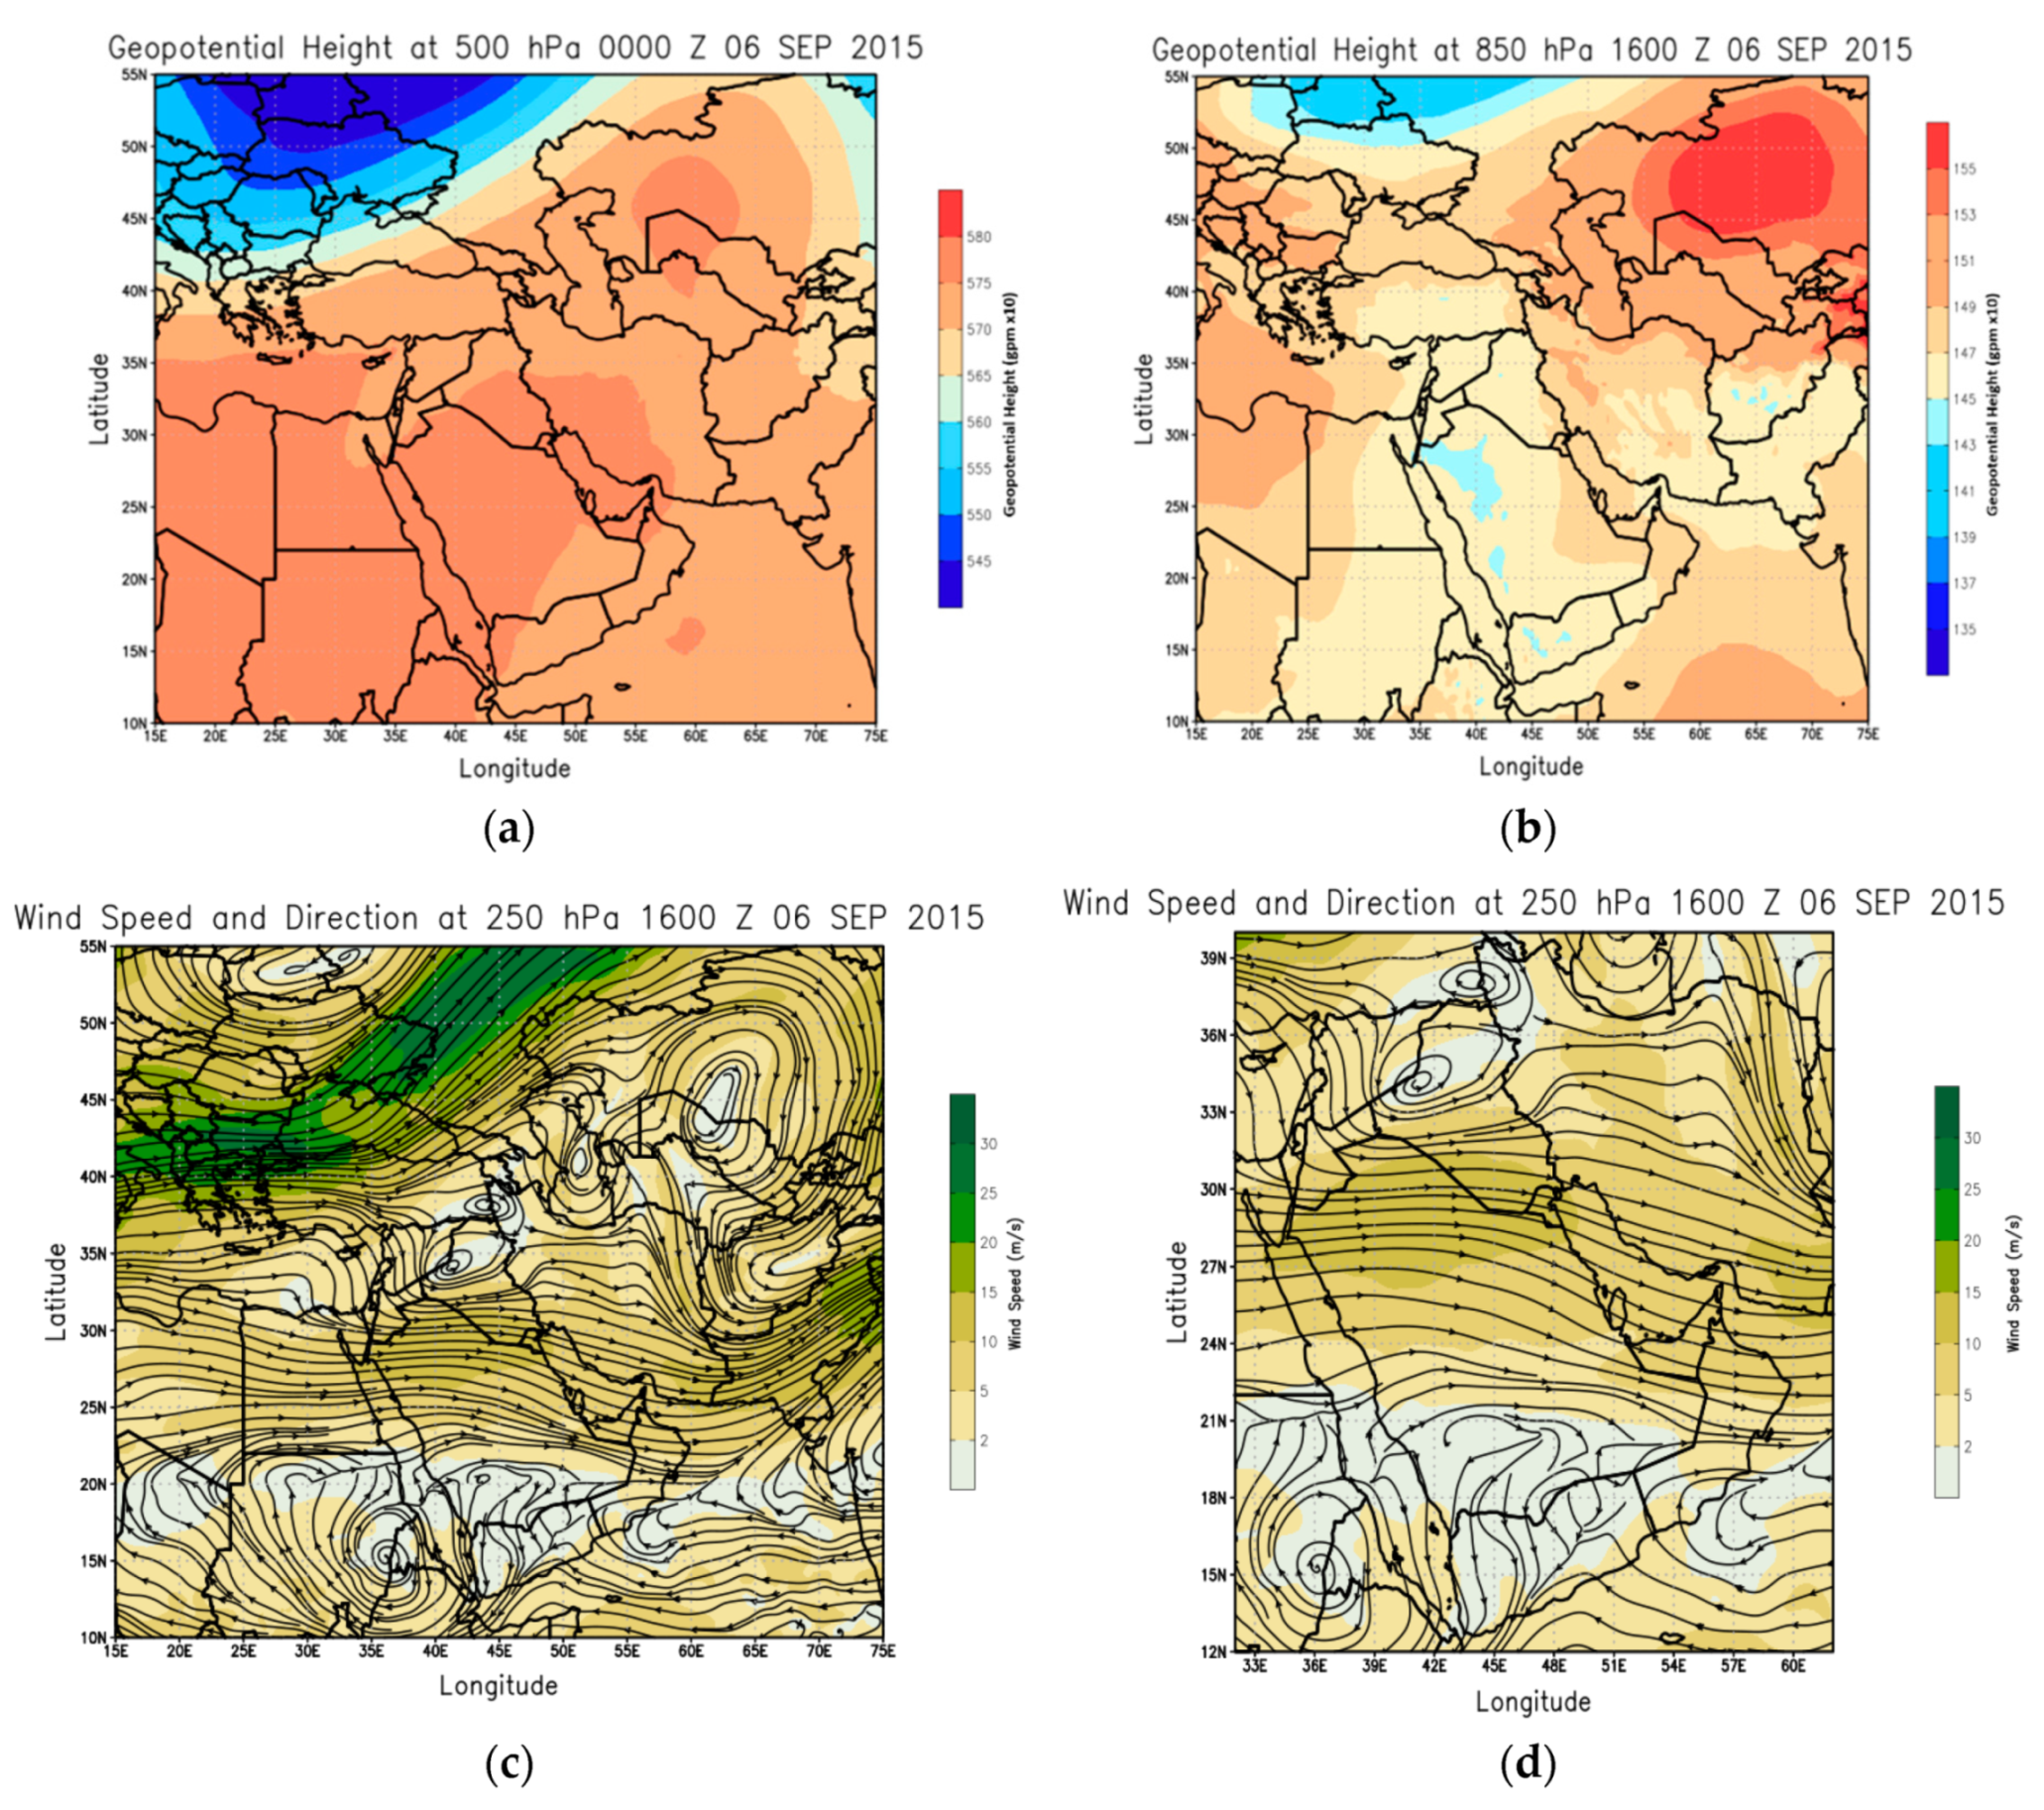
On 6 September at 0000UTC, a cut-off high was depicted over Kazakhstan in the geopotential field at 500 hPa (Figure 9a) and later during the day at 850 hPa (Figure 9b). A cut-off high is a warm high that has grown out of a ridge and become displaced out of the basic westerly current and lies poleward of this current. It effectively “blocks” the movement of the stream across its latitudes (e.g., [70,71]). In a cut-off high situation, the convective activity and related precipitation are usually shunted around the periphery of the high-pressure area which in our case coincides with southeastern Turkey (Figure 9a).
The blocking situation lasted for three days and resulted in a prolonged highly deflected jet stream towards Turkey where the flow at 250 hPa was westerly and almost perpendicular to the main axis of the mountains in southern and eastern Turkey (Figure 9c). At lower levels (i.e., 600 hPa and 700 hPa) the main flow towards these mountains was westerly to southwesterly (not shown). These mountains exerted an obstacle effect on the flow which led to the initiation of deep convection on the other side (Figure 9c). The obstacle effect of the mountains is more clearly seen in Figure 9d where the westerly flow is seen to split in two branches around the mountains creating confluence and convergent flow in their wake. After initiation, the northwesterly winds associated with the upper flow pushed the convection south towards the deserts areas in Iraq and Iran ( Figure 7; Figure 8). Over these arid areas, there is a large potential for evaporational cooling and generation of new cold downdrafts which in turn enhance dust mobilization (e.g., [26]).
The blocking situation helped to sustain the convection for longer time which ultimately generated a series of density currents and cold pools causing intense individual dust walls. These dust walls then merged and accumulated over the Eastern side of the Mediterranean as discussed earlier. On 8 September 2015 cut-off high dissipated (not shown) ending the blocking situation and ceasing convection over southern Turkey. No new dust emissions were observed only transport and accumulation over the Eastern Mediterranean basin (Figure 8b).
5. Discussion and Conclusions
This study examines the atmospheric conditions at the origin of the large dust storms which occurred during the first 10 days of September 2015 in the Middle East. We particularly investigate for the first time the atmospheric dynamics leading to the development of a dry cyclone over Iraq in 31 August 2015 and documented the dust storm associated with it. Using a combination of high resolution satellite observations and re-analyses data we found that a cut-off low developed over Tukey stemming from the main westerly trough systems of cold air and became displaced equatorward of the main polar jet stream on 30 August 2015. The following day, the cut-off low in the upper levels of the atmosphere initiated cyclogenesis over Iraq after it deepened and extended to the surface due to interaction with orography and baroclinic instability at the surface enhanced by sea-breeze effects during night. The cyclone lifetime was about 3 days and contrary to most Saharan cyclones, it was dry and no cloud band or precipitations were associated with it.
The extreme heat during summer over the arid area where the cyclone was initiated favored its deepening and intensification as it evolved from West to East over Iraq. Major dust sources being along the path of the cyclone, large amount of dust was emitted and moved in a cyclonic shape across the entire country to finally exit it from the south on 2 September toward the Arabian Gulf and the Arabian sea. The thick dust layer reached 4 km in altitude and was associated with Aerosol Optical Depth above 3 and dust load exceeding 250 tons.
During the formation and intensification phases, the dry cyclone had a tilted structure with height where higher dust layers (up to 4 km) were seen in the warm northeastern sector of the cyclone and lower dust layers (up to 1 km in altitude) in the western and southern sectors of the cyclone where the cold front of the cyclone is usually found. The unique observation for the first time of this structure, previously suggested by theoretical studies (e.g., [72]), was made possible by the newly developed AEROIASI retrieval [48] which offers a 3D view of dust distribution by combining the measurements from two satellites CALIPSO and IASI.
Studies on the climatology of cyclogenesis in the Middle East have shown that the occurrence of these features in the Middle East is frequent especially during summer (e.g., [36]), however a long term study on the frequency of cyclones producing dust storms is still needed. Furthermore, dust aerosol heating rates in the lower atmosphere over desert regions in the Middle East and their effect on the intensification of cyclogenesis through interaction with radiation is suggested for future work.
A second intense dust event in the Middle East in September 2015 was also analyzed in this paper where convectively generated density currents and cold pools generated major dust storms. The observed convection and density currents were favored by upper-level specific conditions associated with a cut-off high and a meandering polar jet. The blocking high caused a prolonged deflection of the polar jet towards Turkey where interaction with orography triggered a sustained deep convection which lasted till the dissipation of the cut-off high. As a result, a series of density currents occurred over the desert areas creating large moving dust walls affecting all the countries on the Eastern side of the Mediterranean Sea.
The mountains in arid areas support the generation of the density currents and related dust emissions in many ways. They help trigger deep convection in the presence of an upper-level disturbance, accelerate the flow along downslope and at the mountains foothills sediment accumulate during the wet season by rain action and then they dry during summer becoming rich areas for dust mobilization.
Previous studies have concluded that convectively generated density currents over deserts contribute greatly to dust activity (e.g., [26]) but their accurate representation in climate models remains unachieved mainly because it requires convective permitting schemes at high resolution. The ability of state-of-the art numerical models to realistically simulate convective systems and their density currents over the Middle East as well as their associated dust activity need to be investigated in future studies.
In this study, we have addressed the atmospheric dynamics at regional scale leading to two intense dust storms in the Middle East in September 2015. The meandering polar jet stream was identified as the main driver for the anomalous synoptic conditions observed during the two events which resulted in a cut-off low (trough) in the first case and in a cut-off high (ridge) in the second case. Both situations created unstable weather and severe dust storms. Our result echo those of previous studies to confirm the key role of the changes in the polar jet circulations in creating extreme weather conditions in mid-latitudes and subtropics ([25,73]). Changes in the polar jet being linked to the Arctic amplification [74], a clear manifestation of climate change [75].
Author Contributions
For research articles with several authors, a short paragraph specifying their individual contributions must be provided. The following statements should be used “conceptualization, D.F.; methodology, D.F.; software, N.A.; validation, all co-authors; formal analysis, D.F., N.A. and J.C.; investigation, D.F.; data curation, N.A. and C.C.; writing—original draft preparation, D.F.; writing—review and editing, D.F.; visualization, A.G.I. and C.D.; supervision, D.F.”
Funding
This research received no external funding.
Acknowledgments
The European Centre for Medium-Range Weather Forecasts (ECMWF) is acknowledged for making the meteorological re-analyses available from their data server. MERRA-2 data are developed by the GMAO with support from the NASA Modeling, Analysis and Prediction program. We acknowledge the use of imagery from the NASA Worldview application (https://worldview.earthdata.nasa.gov), part of the NASA Earth Observing System Data and Information System (EOSDIS). EUMETSAT is acknowledge for the MSG-SEVIRI observations. We acknowledge the financial support of the Centre National des Etudes Spatiales (CNES, the French Space Agency) through the project “IASI-TOSCA” (Terre, Océan, Surfaces continentals, Atmosphère) and the Programme National de Télédétection Spatiale (PNTS, http://www.insu.cnrs.fr/actions-sur-projets/pnts-programme-national-de-teledetection-spatiale, grant PNTS-2013-05, project “SYNAEROZON”). IASI is a joint mission of EUMETSAT and CNES. We acknowledge the support by the data center AERIS (https://www.aeris-data.fr, ESPRI and ICARE) and IPSL mesocentre (https://mesocentre.ipsl.fr) for providing IASI and CALIPSO level 1 data and as well as meteorological reanalysis. This research was supported by the NYU Abu Dhabi Research Institute (Grant 1204 and Grant 1102) in the UAE.
Conflicts of Interest
The authors declare no conflict of interest.
References
- Ramanathan, V.; Terborgh, J.; Lopez, L.; Núñez, P.; Rao, M.; Shahabuddin, G.; Orihuela, G.; Riveros, M.; Ascanio, R.; Adler, G.H.; et al. Aerosols, Climate, and the Hydrological Cycle. Science 2001, 294, 2119–2124. [Google Scholar] [CrossRef] [PubMed] [Green Version]
- Nastos, P.; Kampanis, N.; Giaouzaki, K.; Matzarakis, A.P. Environmental impacts on human health during a Saharan dust episode at Crete Island, Greece. Meteorol. Z. 2011, 20, 517–529. [Google Scholar] [CrossRef]
- Mahowald, N.; Albani, S.; Kok, J.F.; Engelstaeder, S.; Scanza, R.; Ward, D.S.; Flanner, M.G. The size distribution of desert dust aerosols and its impact on the Earth system. Aeolian Res. 2014, 15, 53–71. [Google Scholar] [CrossRef] [Green Version]
- Goudie, A.S. Desert dust and human health disorders. Environ. Int. 2014, 63, 101–113. [Google Scholar] [CrossRef] [PubMed]
- Behrooz, R.D.; Esmaili-Sari, A.; Bahramifar, N.; Kaskaoutis, D.; Saeb, K.; Rajaei, F. Trace-element concentrations and water-soluble ions in size-segregated dust-borne and soil samples in Sistan, southeast Iran. Aeolian Res. 2017, 25, 87–105. [Google Scholar] [CrossRef]
- Middleton, N. Desert Dust, in Arid Zone Geomorphology: Process, Form and Change in Drylands; John Wiley: Hoboken, NJ, USA, 1997. [Google Scholar]
- Schepanski, K. Transport of Mineral Dust and Its Impact on Climate. Geosciences 2018, 8, 151. [Google Scholar] [CrossRef]
- Boucher, O.; Randall, D.; Artaxo, P.; Bretherton, C.; Feingold, G.; Foster, P.; Kerminen, V.M.; Kondo, Y.; Liao, H.; Lohmann, U.; et al. Clouds and Aerosols. Available online: https://www.ipcc.ch/site/assets/uploads/2018/02/WG1AR5_Chapter07_FINAL-1.pdf. (accessed on 2 July 2019).
- Kok, J.F.; Ward, D.S.; Mahowald, N.M.; Evan, A.T. Global and regional importance of the direct dust-climate feedback. Nat. Commun. 2018, 9, 241. [Google Scholar] [CrossRef]
- Klingmüller, K.; Pozzer, A.; Metzger, S.; Stenchikov, G.L.; Lelieveld, J. Aerosol optical depth trend over the Middle East. Atmos. Chem. Phys. 2016, 16, 5063–5073. [Google Scholar] [CrossRef] [Green Version]
- Boloorani, A.D.; Nabavi, S.O.; Bahrami, H.A.; Mirzapour, F.; Kavosi, M.; Abasi, E.; Azizi, R. Investigation of dust storms entering Western Iran using remotely sensed data and synoptic analysis. J. Environ. Heal. Sci. Eng. 2014, 12, 181. [Google Scholar] [CrossRef]
- Nabavi, S.O.; Haimberger, L.; Samimi, C. Climatology of dust distribution over West Asia from homogenized remote sensing data. Aeolian Res. 2016, 21, 93–107. [Google Scholar] [CrossRef] [Green Version]
- Nabavi, S.O.; Haimberger, L.; Samimi, C. Sensitivity of WRF-chem predictions to dust source function specification in West Asia. Aeolian Res. 2017, 24, 115–131. [Google Scholar] [CrossRef]
- Bou Karam Francis, D.; Flamant, C.; Chaboureau, J.-P.; Banks, J.; Cuesta, J.; Brindley, H.; Oolman, L. Dust emission and transport over Iraq associated with the summer Shamal winds. Aeolian Res. 2017, 24, 15–31. [Google Scholar] [CrossRef]
- Hastenrath, S. Climate Dynamics of the Tropics; Kluwer Academic: Dordrecht, The Netherlands, 1991. [Google Scholar]
- Warner, T. Desert Meteorology; Cambridge Univ. Press: Cambridge, UK, 2004. [Google Scholar]
- Barkan, J.; Alpert, P. Synoptic analysis of a rare event of Saharan dust reaching the Arctic region. Weather 2010, 65, 208–211. [Google Scholar] [CrossRef]
- Membery, D. A gravity-wave haboob? Weather 1985, 40, 214–221. [Google Scholar] [CrossRef]
- Giannakopoulou, E.M.; Toumi, R. The Persian Gulf summertime low-level jet over sloping terrain. Q. J. R. Meteorol. Soc. 2012, 138, 145–157. [Google Scholar] [CrossRef]
- Todd, M.C.; Bou Karam, D.; Cavazos, C.; Bouet, C.; Heinold, B.; Baldasano, J.M.; Cautenet, G.; Koren, I.; Perez, C.; Solmon, F.; et al. Quantifying uncertainty in estimates of mineral dust flux: An intercomparison of model performance over the Bodélé Depression, northern Chad. J. Geophys. Res. Space Phys. 2008, 113, D24. [Google Scholar] [CrossRef]
- Ali, A.H. Wind Regime of the Arabian Gulf, in The Gulf War and the Environment; Gordon and Breach: New York, NY, USA, 1994. [Google Scholar]
- Rao, P.G.; Al-Sulaiti, M.; Al-Mulla, A.H. Winter Shamals in Qatar, Arabian Gulf. Weather 2001, 56, 444–451. [Google Scholar] [CrossRef]
- Bou Karam, D.; Flamant, C.; Cuesta, J.; Pelon, J.; Williams, E. Dust emission and transport associated with a Saharan depression: February 2007 case. J. Geophys. Res. Space Phys. 2010, 115, D4. [Google Scholar] [CrossRef]
- Fiedler, S.; Schepanski, K.; Heinold, B.; Knippertz, P.; Tegen, I. How important are atmospheric depressions and mobile cyclones for emitting mineral dust aerosol in North Africa? Atmos. Chem. Phys. 2014, 14, 8983–9000. [Google Scholar] [CrossRef] [Green Version]
- Francis, D.; Eayrs, C.; Chaboureau, J.-P.; Mote, T.; Holland, D.M. Polar Jet Associated Circulation Triggered a Saharan Cyclone and Derived the Poleward Transport of the African Dust Generated by the Cyclone. J. Geophys. Res. Atmos. 2018, 123, 11899–11917. [Google Scholar] [CrossRef]
- Knippertz, P.; Deutscher, C.; Kandler, K.; Muller, T.; Schulz, O.; Schu¨tz, L. Dust mobilization due to density currents in the Atlas region: Observations from the SAMUM 2006 field campaign. J. Geophys. Res. 2007, 112, D21109. [Google Scholar] [CrossRef]
- Knippertz, P.; Trentmann, J.; Seifert, A. High-resolution simulations of convective cold pools over the northwestern Sahara. J. Geophys. Res. Space Phys. 2009, 114, D8. [Google Scholar] [CrossRef]
- Flamant, C.; Chaboureau, J.-P.; Parker, D.J.; Taylor, C.M.; Cammas, J.-P.; Bock, O.; Timouk, F.; Pelon, J.; Taylor, C. Airborne observations of the impact of a convective system on the planetary boundary layer thermodynamics and aerosol distribution in the inter-tropical discontinuity region of the West African Monsoon. Q. J. R. Meteorol. Soc. 2007, 133, 1175–1189. [Google Scholar] [CrossRef]
- Solomos, S.; Kallos, G.; Mavromatidis, E.; Kushta, J. Density currents as a desert dust mobilization mechanis. Atmos. Chem. Phys. 2012, 12, 11199–11211. [Google Scholar] [CrossRef]
- Bou Karam, D.; Williams, E.; Janiga, M.; Flamant, C.; Cuesta, J.; Auby, A.; Thorncroft, C.; McGraw-Herdeg, M.; McGraw-Herdeg, M. Synoptic-scale dust emissions over the Sahara Desert initiated by a moist convective cold pool in early August 2006. Q. J. R. Meteorol. Soc. 2014, 140, 2591–2607. [Google Scholar] [CrossRef]
- Westphal, D.L.; Toon, O.B.; Carlson, T.N. A Case Study of Mobilization and Transport of Saharan Dust. J. Atmospheric Sci. 1988, 45, 2145–2175. [Google Scholar] [CrossRef] [Green Version]
- Schepanski, K.; Tegen, I.; Todd, M.C.; Heinold, B.; Bonisch, G.; Laurent, B.; Macke, A. Meteorological processes forcing Saharan dust emission inferred from MSG-SEVIRI observations of subdaily dust source activation and numerical models. J. Geophys. Res. Space Phys. 2009, 114, 10201. [Google Scholar] [CrossRef]
- Nieto, R.; Sprenger, M.; Wernli, H.; Trigo, R.M.; Gimenoa, L. Identification and Climatology of Cut-off Lows near the Tropopause. Trends Dir. Climate Res. 2008, 1146, 256–290. [Google Scholar] [CrossRef]
- Flaounas, E.; Kotroni, V.; Lagouvardos, K.; Kazadzis, S.; Gkikas, A.; Hatzianastassiou, N. Cyclone contribution to dust transport over the Mediterranean region. Atmospheric Sci. Lett. 2015, 16, 473–478. [Google Scholar] [CrossRef] [Green Version]
- Prospero, J.M.; Nicholson, S.E.; Ginoux, P.; Torres, O.; Gill, T.E. Environmental characterization of global sources of atmospheric soil dust identified with the NIMBUS 7 Total Ozone Mapping Spectrometer (TOMS) absorbing aerosol product. Rev. Geophys. 2002, 40, 1002. [Google Scholar] [CrossRef]
- Trigo, I.F.; Davies, T.D.; Bigg, G.R. Objective Climatology of Cyclones in the Mediterranean Region. J. Clim. 1999, 12, 1685–1696. [Google Scholar] [CrossRef] [Green Version]
- Sutton, L. Haboobs. Meteorol. Soc. 1925, 51, 25–30. [Google Scholar] [CrossRef]
- Lawson, T. Haboob structure at Khartoum. Weather 1971, 26, 105–112. [Google Scholar] [CrossRef]
- Bou Karam, D.; Flamant, C.; Knippertz, P.; Reitebuch, O.; Pelon, J.; Chong, M.; Dabas, A. Dust emissions over the Sahel associated with the West African Monsoon inter-tropical discontinuity region: A representative case study. Q. J. R. Meteorol. Soc. 2008, 134, 621–634. [Google Scholar] [CrossRef]
- Bou Karam, D.; Flamant, C.; Tulet, P.; Todd, M.C.; Pelon, J.; Williams, E. Dry cyclogenesis and dust mobilization in the intertropical discontinuity of the West African Monsoon: A case study. J. Geophys. Res. Space Phys. 2009, 114, D5. [Google Scholar] [CrossRef]
- Hersbach, H.; Dee, D. ERA-5 Reanalysis is in Production; Spring: Berlin, Germany, 2016. [Google Scholar]
- Gelaro, R.; McCarty, W.; Suárez, M.J.; Todling, R.; Molod, A.; Takacs, L.; Randles, C.A.; Darmenov, A.; Bosilovich, M.G.; Reichle, R.; et al. MERRA-2 Overview: The Modern-Era Retrospective Analysis for Research and Applications, Version 2 (MERRA-2). J. Climate 2017, 30, 5419–5454. [Google Scholar] [CrossRef]
- Kaskaoutis, D.G.; Rashki, A.; Dumka, U.C.; Mofidi, A.; Kambezidis, H.D.; Psiloglou, B.E.; Karagiannis, D.; Petrinoli, K.; Gavriil, A. Atmospheric dynamics associated with exceptionally dusty conditions 2 over the eastern Mediterranean and Greece in March 2018. Atmos. Res. 2019, 218, 269–284. [Google Scholar] [CrossRef]
- Rashki, A.; Kaskaoutis, D.; Mofidi, A.; Minvielle, F.; Chiapello, I.; Legrand, M.; Dumka, U.; Francois, P. Effects of Monsoon, Shamal and Levar winds on dust accumulation over the Arabian Sea during summer—The July 2016 case. Aeolian Res. 2019, 36, 27–44. [Google Scholar] [CrossRef]
- Schepanski, K.; Tegen, I.; Laurent, B.; Heinold, B.; Macke, A. A new Saharan dust source activation frequency map derived from MSG-SEVIRI IR-channels. Geophys. Res. Lett. 2007, 34, 18803. [Google Scholar] [CrossRef]
- Banks, J.R.; Schepanski, K.; Heinold, B.; Hünerbein, A.; Brindley, H.E. The influence of dust optical properties on the colour of simulated MSG-SEVIRI Desert Dust imagery. Atmos. Chem. Phys. Discuss. 2018, 18, 9681–9703. [Google Scholar] [CrossRef]
- Pierangelo, C. Longwave Passive Remote Sensing; Springer Science & Business Media: Berlin, Germany, 2013. [Google Scholar]
- Cuesta, J.; Eremenko, M.; Flamant, C.; Dufour, G.; Laurent, B.; Bergametti, G.; Höpfner, M.; Orphal, J.; Zhou, D. Three-dimensional distribution of a major desert dust outbreak over East Asia in March 2008 derived from IASI satellite observations. J. Geophys. Res. Atmos. 2015, 120, 7099–7127. [Google Scholar] [CrossRef] [Green Version]
- Clerbaux, C.; Boynard, A.; Clarisse, L.; George, M.; Hadji-Lazaro, J.; Herbin, H.; Hurtmans, D.; Pommier, M.; Razavi, A.; Coheur, P.F.; et al. Monitoring of atmospheric composition using the thermal infrared IASI/MetOp sounder. Atmos. Chem. Phys. 2009, 9, 6041–6054. [Google Scholar] [CrossRef] [Green Version]
- Cuesta, J.; Marsham, J.H.; Parker, D.J.; Flamant, C. Dynamical mechanisms controlling the vertical redistribution of dust and the thermodynamic structure of the West Saharan atmospheric boundary layer during summer. Atmos. Sci. Lett. 2009, 10, 34–42. [Google Scholar] [CrossRef]
- Stephens, G.L.; Vane, D.G.; Boain, R.J.; Mace, G.G.; Sassen, K.; Wang, Z.; Illingworth, A.J.; O’Connor, E.J.; Rossow, W.B.; Durden, S.L.; et al. The CloudSat mission and the A-Train. Bull. Am. Meteorol. Soc. 2012, 83, 1771–1790. [Google Scholar] [CrossRef]
- Palmén, E.; Newton, C.W. Atmospheric Circulation Systems: Their Structure and Physical Interpretation; Academic Press: New York, NY, USA, 1969. [Google Scholar]
- Winkler, R.; Zwatz-Meise, V. Manual of Synoptic Satellite Meteorology. 2001. Available online: http://www.zamg.ac.at/docu/Manual/SatManu/main.htm (accessed on 2 July 2019).
- Nieto, R.; Gimeno, L.; de la Torre, L.; Ribera, P.; Gallego, D.; Garcı’a-Herrera, R.; Garcı’a, J.A.; Nun˜ez, M.; Redan˜o, A.; Lorente, J. Climatological features of Cut-off low systems in the Northern Hemisphere. J. Climate 2005, 18, 3085–3103. [Google Scholar] [CrossRef]
- Favre, A.; Hewitson, B.; Lennard, C.; Cerezo-Mota, R.; Tadross, M. Cut-off Lows in the South Africa region and their contribution to precipitation. Clim. Dyn. 2012, 41, 2331–2351. [Google Scholar] [CrossRef]
- Gimeno, L.; Trigo, R.M.; Ribera, P.; Garcia, J.A. Editorial: Special issue on cut-off low systems (COL). Meteorol. Atmos. Phys. 2007, 96, 1–2. [Google Scholar] [CrossRef]
- Tantawy, A.H.I. The Role of the Jet Stream in the Formation of Desert Depressions in the Middle East; WMO Tech: Geneva, Switzerland, 1964. [Google Scholar]
- Thorncroft, C.D.; Flocas, H.A. A Case Study of Saharan Cyclogenesis. Mon. Weather. Rev. 1997, 125, 1147–1165. [Google Scholar] [CrossRef]
- Reboita, M.S.; Porfírio Da Rocha, R.; Martins de Oliveira, D. Key Features and Adverse Weather of the Named Subtropical Cyclones over the Southwestern South Atlantic Ocean. Atmosphere 2019, 10, 6. [Google Scholar] [CrossRef]
- Trigo, I.F.; Bigg, G.R.; Davies, T.D. Climatology of Cyclogenesis Mechanisms in the Mediterranean. Mon. Weather. Rev. 2002, 130, 549–569. [Google Scholar] [CrossRef]
- Carlson, T.N.; Benjamin, S.G. Radiative heating for Saharan dust. J. Atmos. Sci. 1980, 37, 193–213. [Google Scholar] [CrossRef]
- Alpert, P.; Kaufman, Y.J.; Shay-El, Y.; Tanré, D.; Da Silva, A.; Schubert, S.; Joseph, J.H. Quantification of dust-forced heating of the lower troposphere. Nature 1998, 395, 367–370. [Google Scholar] [CrossRef]
- Chen, S.-J.; Kuo, Y.-H.; Ming, W.; Ying, H. The Effect of Dust Radiative Heating on Low-Level Frontogenesis. J. Atmos. Sci. 1995, 52, 1414–1420. [Google Scholar] [CrossRef] [Green Version]
- Parolari, A.J.; Li, D.; Bou-Zeid, E.; Katul, G.G.; Assouline, S. Climate, not conflict, explains extreme Middle East dust storm, Environ. Res. Lett. 2016, 11, 114013. [Google Scholar] [CrossRef]
- Mamouri, R.-E.; Ansmann, A.; Nisantzi, A.; Solomos, S.; Kallos, G.; Hadjimitsis, D.G. Extreme dust storm over the eastern Mediterranean in September 2015: Satellite, lidar and surface observations in the Cyprus region. Atmos. Chem. Phys. 2016, 16, 13711–13724. [Google Scholar] [CrossRef]
- Solomos, S.; Ansmann, A.; Mamouri, R.-E.; Binietoglou, I.; Patlakas, P.; Marinou, E.; Amiridis, V. Remote sensing and modelling analysis of the extreme dust storm hitting the Middle East and eastern Mediterranean in September 2015. Atmos. Chem. Phys. 2017, 17, 4063–4079. [Google Scholar] [CrossRef] [Green Version]
- Uzan, L.; Egert, S.; Alpert, P. New insights into the vertical structure of the September 2015 dust storm employing eight ceilometers and auxiliary measurements over Israel. Atmospheric Chem. Phys. Discuss. 2018, 18, 3203–3221. [Google Scholar] [CrossRef] [Green Version]
- Banta, R.M. The Role of Mountain Flows in Making Clouds; American Meteorological Society: Boston, MA, USA, 1990. [Google Scholar]
- Cotton, W.R.; Anthes, R.A. Storms and Cloud Dynamics; Academic Press: San Diego, CA, USA, 1989; p. 883. [Google Scholar]
- Croci-Maspoli, M.; Schwierz, C.; Davies, H.C. A Multifaceted Climatology of Atmospheric Blocking and Its Recent Linear Trend. J. Clim. 2007, 20, 633–649. [Google Scholar] [CrossRef]
- Tyrlis, E.; Tymvios, F.S.; Giannakopoulos, C.; Lelieveld, J. The role of blocking in the summer 2014 collapse of Etesians over the eastern Mediterranean. J. Geophys. Res. Atmos. 2015, 120, 6777–6792. [Google Scholar] [CrossRef]
- Liu, M.; Westphal, D.L.; Wang, S.; Shimizu, A.; Sugimoto, N.; Zhou, J.; Chen, Y. A high-resolution numerical study of the Asian dust storms of April 2001. J. Geophys. Res. Space Phys. 2003, 108, 8653. [Google Scholar] [CrossRef]
- Francis, J.A.; Vavrus, S.J. Evidence linking Arctic amplification to extreme weather in mid-latitudes. Geophys. Res. Lett. 2012, 39, 6. [Google Scholar] [CrossRef]
- Francis, J.; Skific, N. Evidence linking rapid Arctic warming to mid-latitude weather patterns. Philos. Trans. R. Soc. A Math. Phys. Eng. 2015, 373, 20140170. [Google Scholar] [CrossRef] [PubMed]
- Serreze, M.C.; Francis, J.A. The Arctic Amplification Debate. Clim. Chang. 2006, 76, 241. [Google Scholar] [CrossRef]
Figure 1.
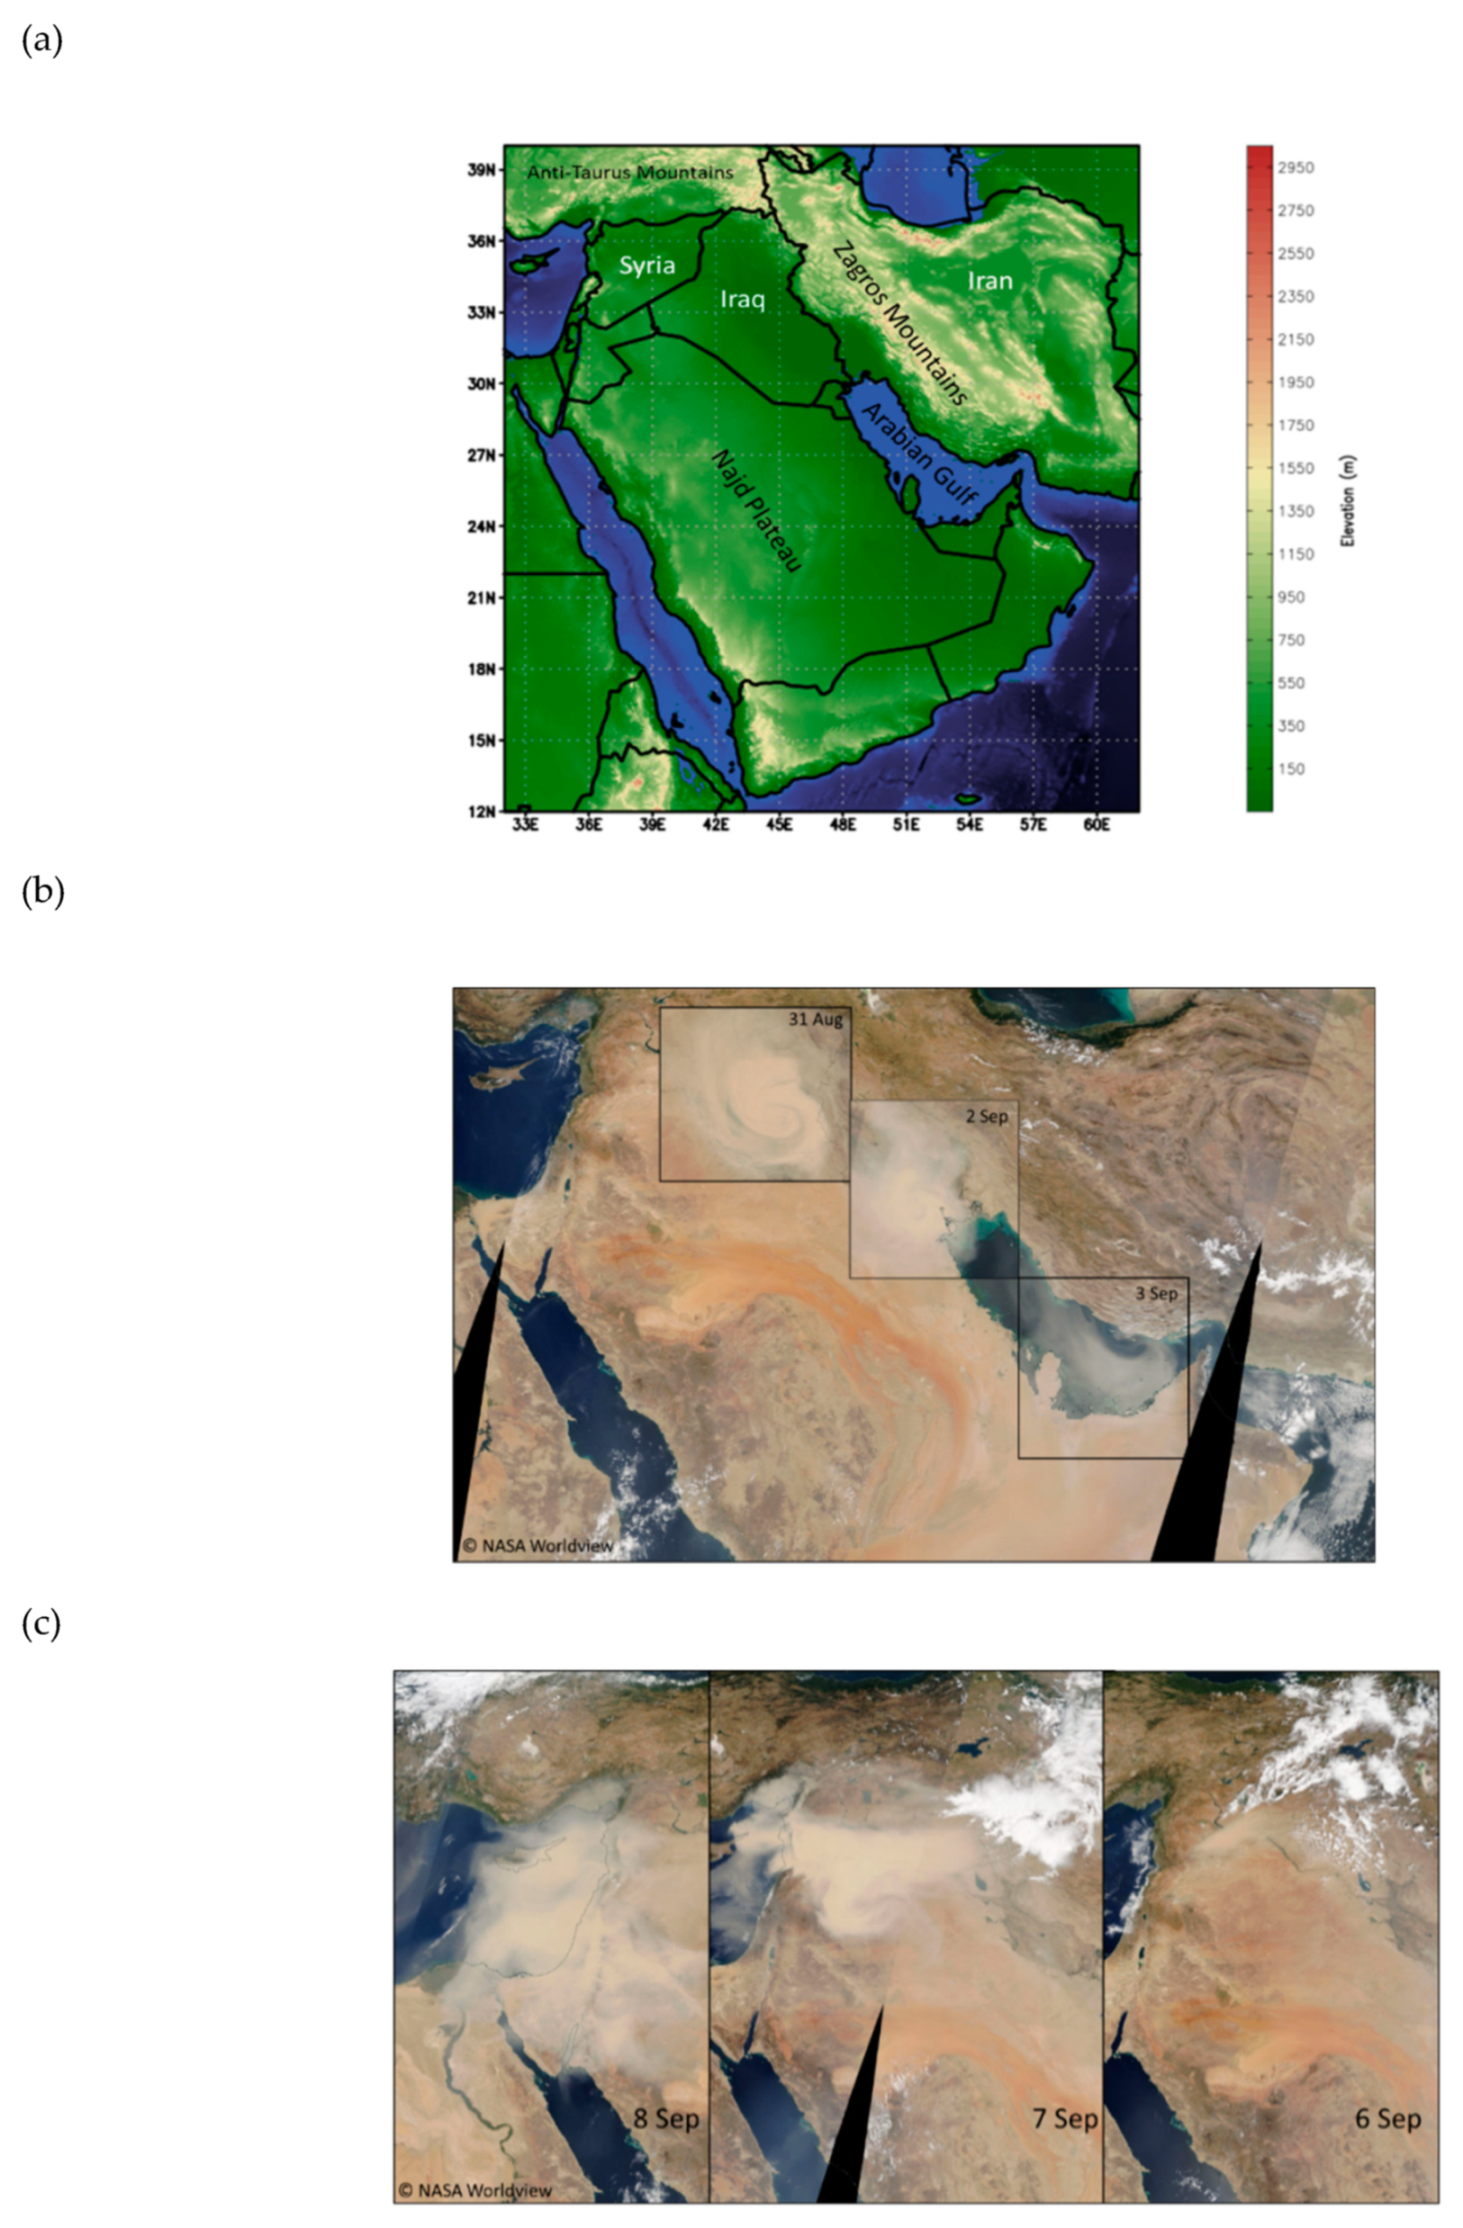
(a) Orography map derived from the Earth TOPOgraphy 1 (ETOPO1)database over the study area showing the mountains to the North and East of Iraq and the plains over Iraq and Syria which constitute rich dust source areas where deflatable materials accumulate at the mountains foothills under the action of rain and drainage during winter and drying during summer (b) MODIS satellite images showing the development of the dry cyclone over Iraq on 31 August 2015, its migration East then South on 2 September and its decay over the Arabian Gulf on 3 September. (c) MODIS satellite images showing the initiation of the dust storm on 6 September 2015 by a density current emanating from the convective clouds seen in white colors over North Syria. The dust storm expanded and intensified on 7 September when a series of density currents occurred from deep convective clouds. The dust cloud then moved westward on 8 September and remained stagnant over the eastern side of the Mediterranean Sea for 2 days. Images credit: NASA Worldview.
Figure 1.
(a) Orography map derived from the Earth TOPOgraphy 1 (ETOPO1)database over the study area showing the mountains to the North and East of Iraq and the plains over Iraq and Syria which constitute rich dust source areas where deflatable materials accumulate at the mountains foothills under the action of rain and drainage during winter and drying during summer (b) MODIS satellite images showing the development of the dry cyclone over Iraq on 31 August 2015, its migration East then South on 2 September and its decay over the Arabian Gulf on 3 September. (c) MODIS satellite images showing the initiation of the dust storm on 6 September 2015 by a density current emanating from the convective clouds seen in white colors over North Syria. The dust storm expanded and intensified on 7 September when a series of density currents occurred from deep convective clouds. The dust cloud then moved westward on 8 September and remained stagnant over the eastern side of the Mediterranean Sea for 2 days. Images credit: NASA Worldview.

Figure 2.
ECMWF ERA5 re-analyses on 30 August 2015 of: Geopotential height at 0400UTC at 250 hPa (a) and at 500 hPa (b), wind speed (colors) and wind direction (streamlines) at 300 hPa at 0600UTC (c), potential vorticity at 300 hPa at 0400UTC (d), mean sea level pressure (colors) and wind direction at 850 hPa at 0600UTC (e). (f) Temperature at 925 hPa on 31 August 2015 at 0400UTC. White contours on (b) are isocontours of ERA5 temperature at 500 hPa every 5 °C.

Figure 3.
ECMWF ERA5 re-analyses on 31 August 2015 of: (a) Mean sea level pressure (colors) and wind direction at 850 hPa at 1000UTC and at 1600UTC (b). (c) Potential vorticity at 700 hPa at 1900UTC. (d) Temperature at 925 hPa at 1300UTC. (e) Wind speed (colors) and wind direction (streamlines) at 700 hPa at 1300UTC.

Figure 4.
SEVIRI-derived false color images showing dust (pink/purple), clouds (brown/red) and differences in surface emissivity retrieved in absence of dust or clouds (light blue/blue) on: (a) 31 August 2015 at 1900 UTC and (b) 01 September at 0200UTC. Dust mass column density derived from MERRA2 re-analyses on (c) 31 August 2015 at 1900 UTC and (d) 01 September at 0200UTC. (e) CALIPSO observations on 31 August 2015 at 0800UTC of particle extinction coefficient at 532 nm on which are superimposed the wind direction and vertical velocities in vectors and the isentropes derived from ECMWF ERA5 re-anlayses along CALIPSO track. The upper panel shows the AODs derived from CALIPSO at 532 nm along its path on 31 August 2015. The panel in the upper-right corner shows in red the path of CALIPSO over the study area on 31 August 2015 at 0800UTC.

Figure 5.
(a) SEVIRI-derived false color images showing dust (pink/purple), clouds (brown/red) and differences in surface emissivity retrieved in absence of dust or clouds (light blue/blue) on 01 September at 0900UTC. (b) Dust column mass density derived from MERRA2 re-analyses on 01 September at 0900UTC. On 01 September 2015 at 0900 UTC AEROIASI-derived observations of dust: (c) Aerosol optical depth at 10 µm, (d) mean height of dust layers in km and (e) 3D distribution of dust depicted by iso-surface of 0.1 km−1 dust extinction coefficient at 10 µm, with ECMWF ERA5 reanalysis of potential temperature and winds at 925 hPa.


Figure 6.
SEVIRI-derived false color images showing dust (pink/purple), clouds (brown/red) and differences in surface emissivity retrieved in absence of dust or clouds (light blue/blue) on 02 September at 0200UTC (a) and 02 September 2015 at 1400 UTC (b). (c) Aerosol optical depth and (d) dust column mass density derived from MERRA2 re-analyses on 02 September at 0900UTC. (e) CALIPSO observations on 2 September 2015 at 0700UTC of particle extinction coefficient at 532 nm on which are superimposed the wind direction and vertical velocities in vectors and the isentropes derived from ECMWF ERA5 re-analyses along CALIPSO track. The upper panel shows the AODs derived from CALIPSO at 532 nm along its path on 2 September 2015. The panel in the upper-right corner shows in red the path of CALIPSO over the study area on 2 September 2015.

Figure 7.
SEVIRI-derived false color images showing dust (pink/purple), clouds (brown/red) and differences in surface emissivity retrieved in absence of dust or clouds (light blue/blue) on 06 September 2015 at 0800UTC (a), 06 September 2015 at 1800UTC (b), 07 September 2015 at 0100 UTC (c), 07 September 2015 at 1345 UTC (d). (e) CALIPSO observations on 6 September 2015 at 2300UTC of particle extinction coefficient at 532 nm on which are superimposed the wind direction and vertical velocities in vectors and the isentropes derived from ECMWF ERA5 re-analyses along CALIPSO track. The upper panel shows the AODs derived from CALIPSO at 532 nm along its path on 6 September 2015. The panel in the upper-right corner shows in red the path of CALIPSO over the study area on 6 September 2015.

Figure 8.
SEVIRI-derived false color images showing dust (pink/purple), clouds (brown/red) and differences in surface emissivity retrieved in absence of dust or clouds (light blue/blue) on 07 September 2015 at 1800 UTC (a) and 08 September 2015 at 1200 UTC (b). (c) CALIPSO observations on 7 September 2015 at 1000UTC of particle extinction coefficient at 532 nm on which are superimposed the wind direction and vertical velocities in vectors and the isentropes derived from ECMWF ERA5 re-analyses along CALIPSO track. The upper panel shows the AODs derived from CALIPSO at 532 nm along its path on 7 September 2015. The panel in the upper-right corner shows in red the path of CALIPSO over the study area on 7 September 2015.

Figure 9.
ECMWF ERA5 re-analyses of: (a) Geopotential height on 6 September 2015 at 0000UTC at 500 hPa. (b) Geopotential height on 6 September 2015 at 1600UTC at 850 hPa. (c) Wind speed (colors) and wind direction (streamlines) at 250 hPa on 6 September 2015 at 1600UTC (c), (d) same as (c) but zoomed over the area of interest.

© 2019 by the authors. Licensee MDPI, Basel, Switzerland. This article is an open access article distributed under the terms and conditions of the Creative Commons Attribution (CC BY) license (http://creativecommons.org/licenses/by/4.0/).
Share and Cite
MDPI and ACS Style
Francis, D.; Alshamsi, N.; Cuesta, J.; Gokcen Isik, A.; Dundar, C. Cyclogenesis and Density Currents in the Middle East and the Associated Dust Activity in September 2015. Geosciences 2019, 9, 376. https://doi.org/10.3390/geosciences9090376
AMA Style
Francis D, Alshamsi N, Cuesta J, Gokcen Isik A, Dundar C. Cyclogenesis and Density Currents in the Middle East and the Associated Dust Activity in September 2015. Geosciences. 2019; 9(9):376. https://doi.org/10.3390/geosciences9090376
Chicago/Turabian StyleFrancis, Diana, Noor Alshamsi, Juan Cuesta, Ayse Gokcen Isik, and Cihan Dundar. 2019. "Cyclogenesis and Density Currents in the Middle East and the Associated Dust Activity in September 2015" Geosciences 9, no. 9: 376. https://doi.org/10.3390/geosciences9090376
Note that from the first issue of 2016, this journal uses article numbers instead of page numbers. See further details here.