The Effects of Visual Cues, Blindfolding, Synesthetic Experience, and Musical Training on Pure-Tone Frequency Discrimination

Abstract
1. Introduction
2. Materials and Methods
2.1. Participants
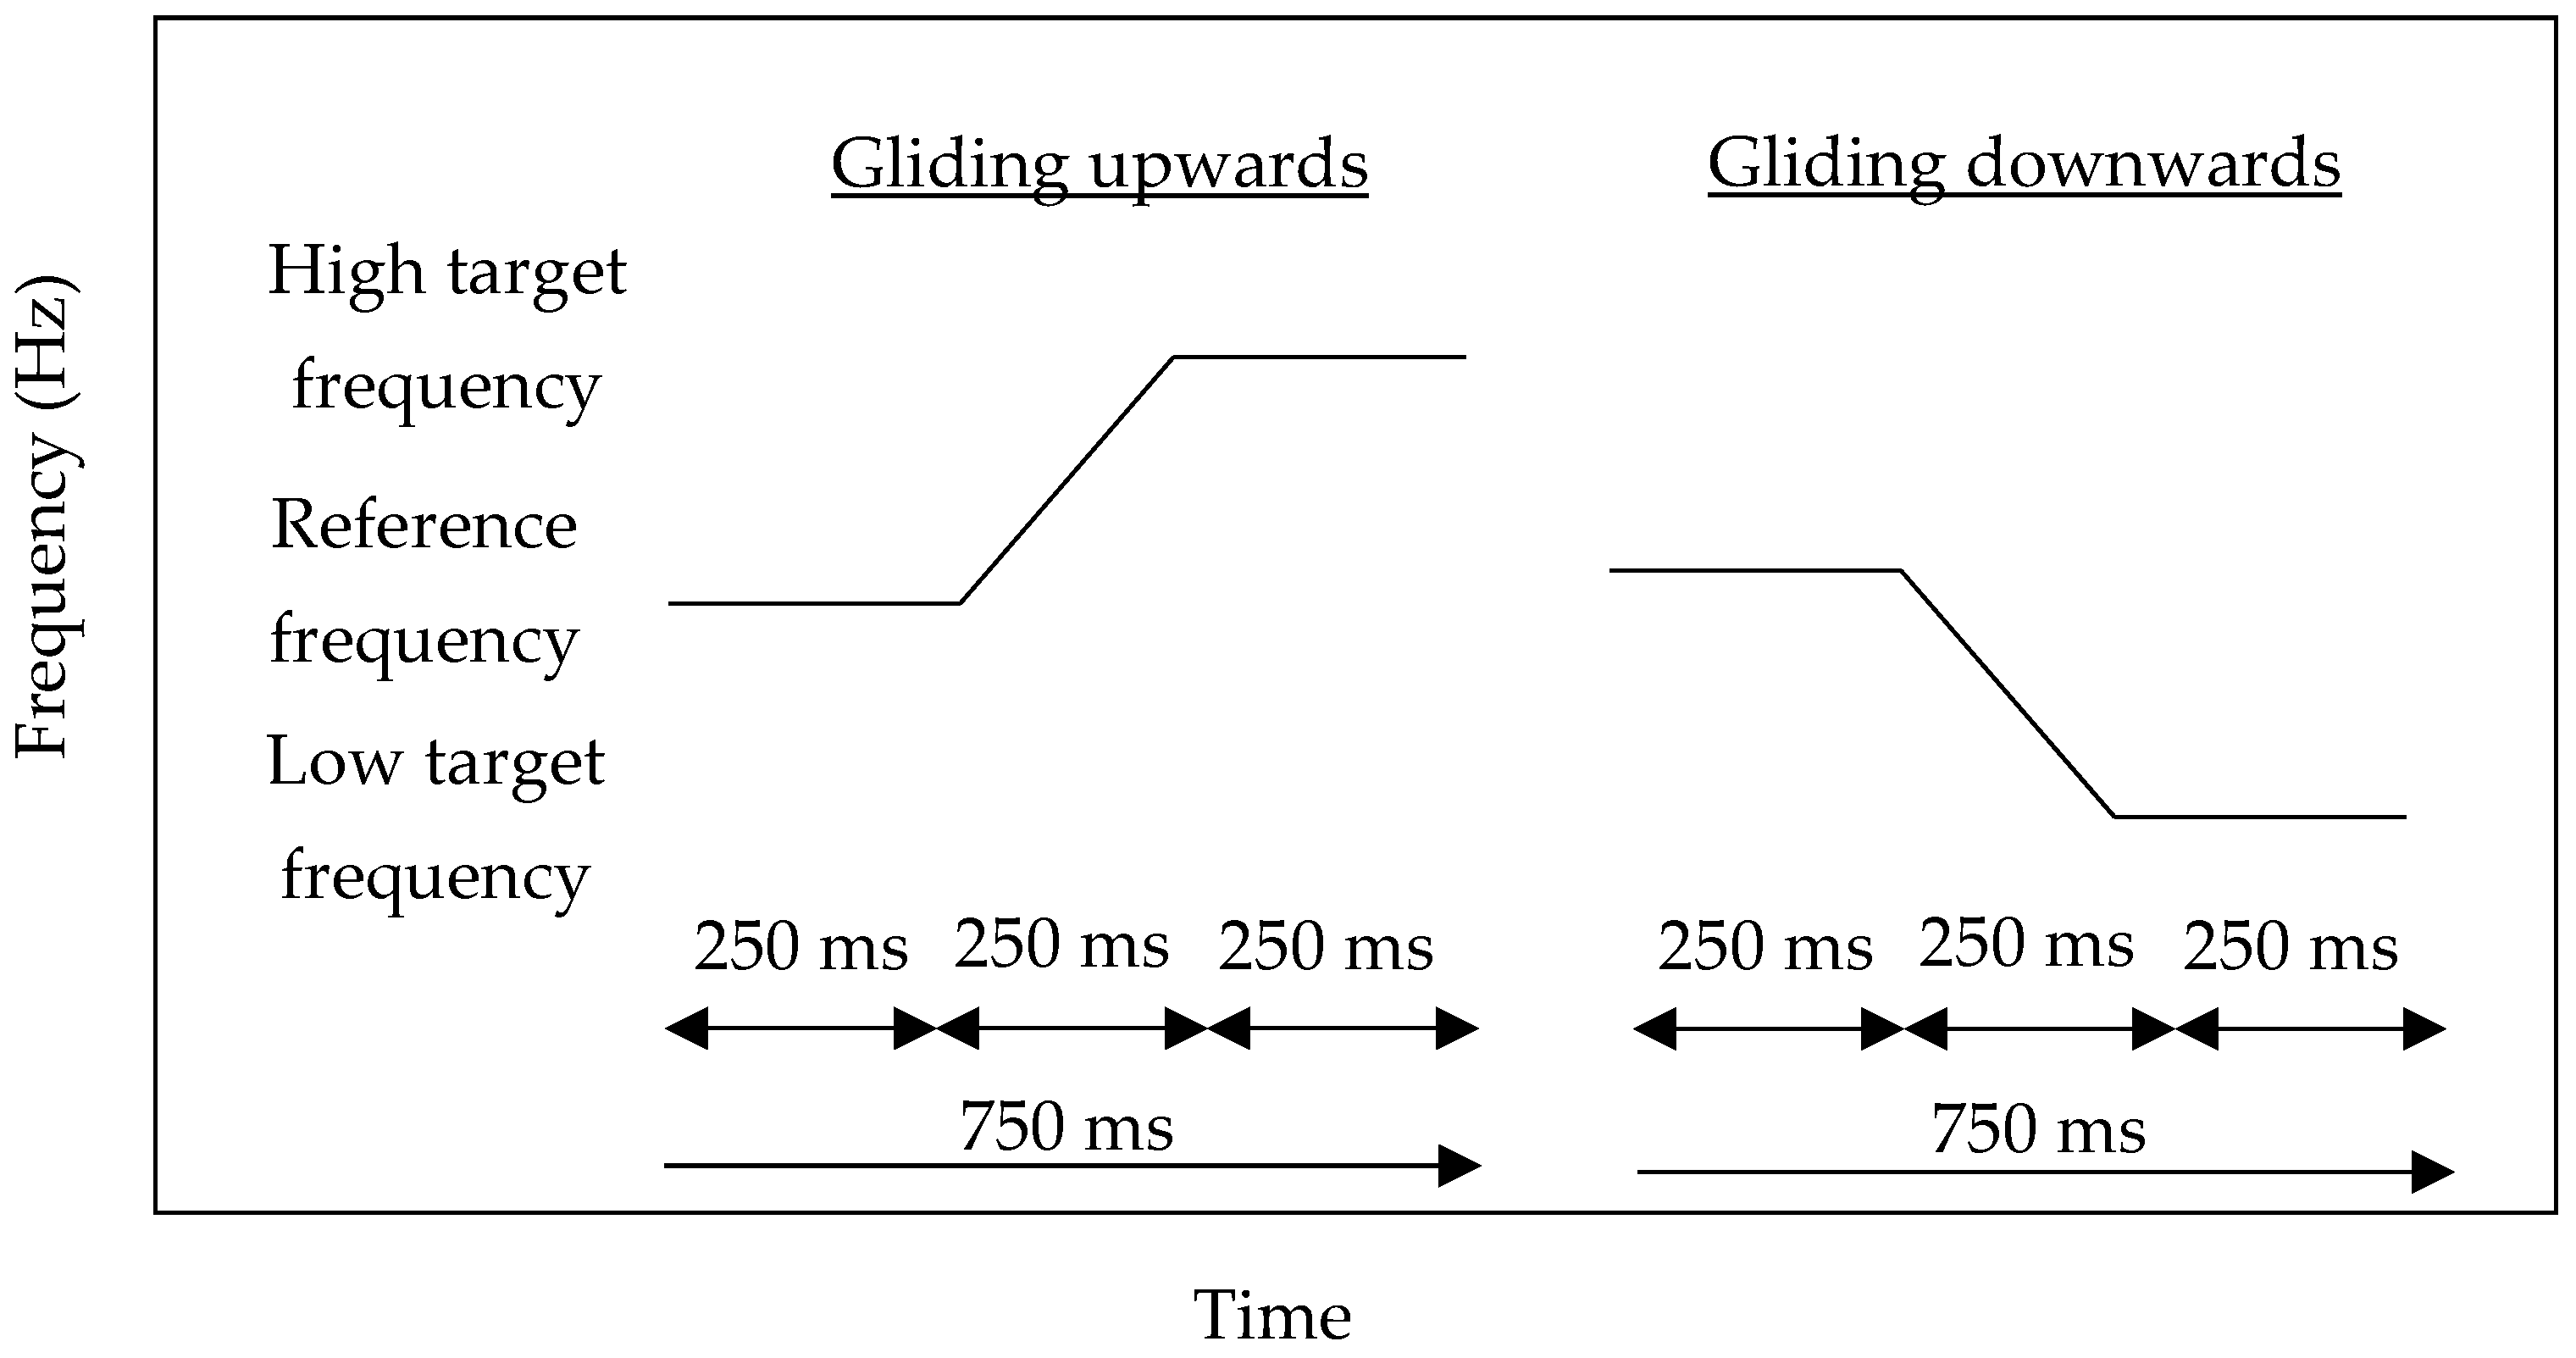
2.2. Materials
2.3. Procedures
3. Results
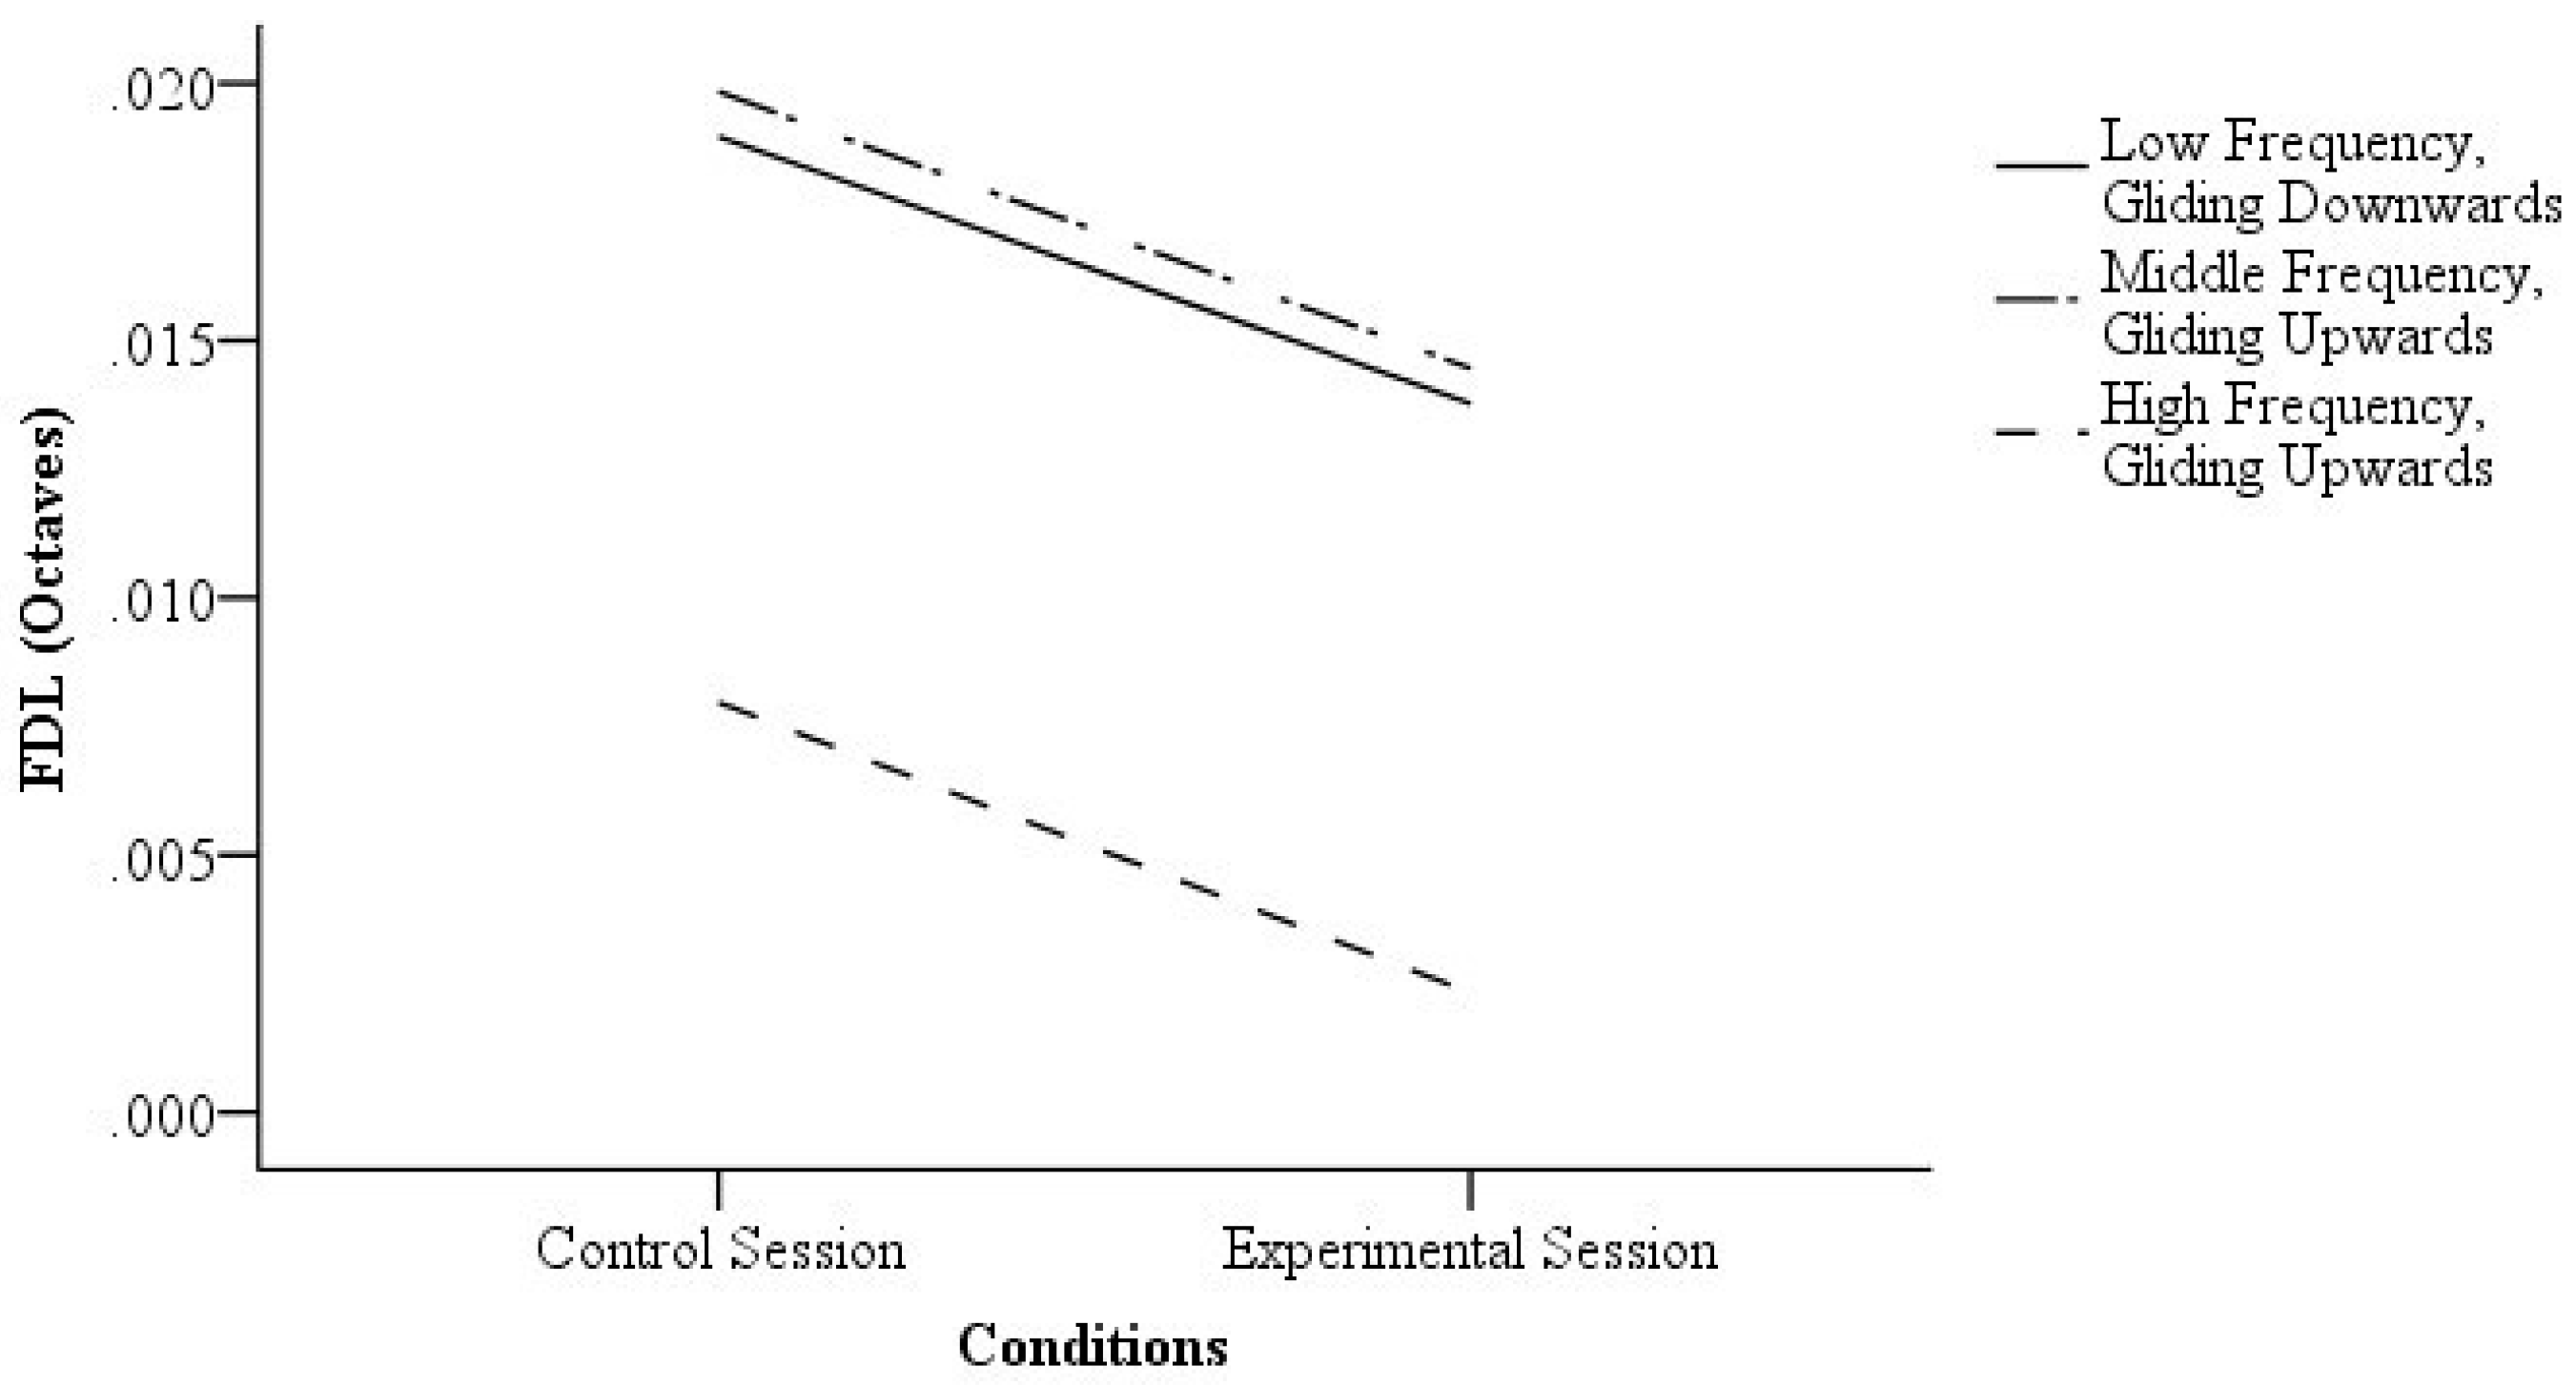
3.1. Visual Cues and FDL
3.2. Blindfolding and FDL
3.3. Experience of Visual Synesthesia in Auditory Perception
3.4. Musical Training
4. Discussion
4.1. Visual Cues and FDL
4.2. Blindfolding and FDL
4.3. Synesthetic Experience and FDL
4.4. Musical Training and FDL
4.5. Limitations and Future Studies
5. Conclusions
Author Contributions
Acknowledgments
Conflicts of Interest
References
- Xu, Q.; Gong, Q. Frequency difference beyond behavioral limen reflected by frequency following response of human auditory Brainstem. Biomed. Eng. Online 2014, 13, 114. [Google Scholar] [CrossRef] [PubMed]
- Formby, C. Differential sensitivity to tonal frequency and to the rate of amplitude modulation of broadband noise by normally hearing listeners. J. Acoust. Soc. Am. 1985, 78, 70–77. [Google Scholar] [CrossRef] [PubMed]
- Nelson, D.A.; Stanton, M.E.; Freyman, R.L. A general equation describing frequency discrimination as a function of frequency and sensation level. J. Acoust. Soc. Am. 1983, 73, 2117–2123. [Google Scholar] [CrossRef] [PubMed]
- Micheyl, C.; Xiao, L.; Oxenham, A.J. Characterizing the dependence of pure-tone frequency difference limens on frequency, duration, and level. Hear. Res. 2012, 292, 1–13. [Google Scholar] [CrossRef] [PubMed]
- Freyman, R.L.; Nelson, D.A. Frequency discrimination as a function of tonal duration and excitation-pattern slopes in normal and hearing-impaired listeners. J. Acoust. Soc. Am. 1986, 79, 1034–1044. [Google Scholar] [CrossRef] [PubMed]
- Wier, C.C.; Jesteadt, W.; Green, D.M. Frequency discrimination as a function of frequency and sensation level. J. Acoust. Soc. Am. 1977, 61, 178–184. [Google Scholar] [CrossRef] [PubMed]
- Dai, H.; Micheyl, C. Psychometric functions for pure-tone frequency discrimination. J. Acoust. Soc. Am. 2011, 130, 263–272. [Google Scholar] [CrossRef]
- Harris, J.D. Pitch discrimination. J. Acoust. Soc. Am. 1952, 24, 750–755. [Google Scholar] [CrossRef]
- Hartmann, W.M.; Rakerd, B.; Packard, T.N. On measuring the frequency-difference limen for short tones. Percept. Psychophys. 1985, 38, 199–207. [Google Scholar] [CrossRef]
- Moore, B.C.J. Frequency difference limens for short-duration tones. J. Acoust. Soc. Am. 1973, 54, 610–619. [Google Scholar] [CrossRef]
- Wier, C.C.; Jesteadt, W.; Green, D.M. A comparison of method-of-adjustment and forced-choice procedures in frequency discrimination. Percept. Psychophys. 1976, 19, 75–79. [Google Scholar] [CrossRef]
- Lyzenga, J.; Carlyon, R.P.; Moore, B.C.J. The effects of real and illusory glides on pure-tone frequency discrimination. J. Acoust. Soc. Am. 2004, 116, 491–501. [Google Scholar] [CrossRef] [PubMed]
- Demany, L.; Pressnitzer, D.; Semal, C. Tuning properties of the auditory frequency-shift detectors. J. Acoust. Soc. Am. 2009, 126, 1342–1348. [Google Scholar] [CrossRef] [PubMed]
- Gottfried, T.L.; Riester, D. Relation of pitch glide perception and Mandarin tone identification. J. Acoust. Soc. Am. 2000, 108, 2604. [Google Scholar] [CrossRef]
- Baharloo, S.; Johnston, P.A.; Service, S.K.; Gitschier, J.; Freimer, N.B. Absolute Pitch: An Approach for Identification of Genetic and Nongenetic Components. Am. J. Hum. Genet. 1998, 62, 224–231. [Google Scholar] [CrossRef]
- Bulkin, D.A.; Groh, J.M. Seeing sounds: Visual and auditory interactions in the brain. Curr. Opin. Neurobiol. 2006, 16, 415–419. [Google Scholar] [CrossRef]
- Hirata, Y.; Kelly, S.D. Effects of lips and hands on auditory learning of second-language speech sounds. J. Speech Lang. Hear. Res. 2010, 53, 298–310. [Google Scholar] [CrossRef]
- Wickens, C.D. Multiple resources and performance prediction. Theor. Issues Ergon. Sci. 2002, 3, 159–177. [Google Scholar] [CrossRef]
- Marks, L.E. On cross-modal similarity: Auditory-visual interactions in speeded discrimination. J. Exp. Psychol. Hum. Percept. Perform. 1987, 13, 384–394. [Google Scholar] [CrossRef]
- Ben-Artzi, E.; Marks, L.E. Visual-auditory interaction in speeded classification: Role of stimulus difference. Percept. Psychophys. 1995, 57, 1151–1162. [Google Scholar] [CrossRef]
- Busse, L.; Roberts, K.C.; Crist, R.E.; Weissman, D.H.; Woldorff, M.G. The spread of attention across modalities and space in a multisensory object. Proc. Natl. Acad. Sci. USA 2005, 102, 18751–18756. [Google Scholar] [CrossRef] [PubMed]
- Stroop, J.R. Studies of interference in serial verbal reactions. J. Exp. Psychol. 1935, 18, 643–662. [Google Scholar] [CrossRef]
- Abadi, R.V.; Murphy, J.S. Phenomenology of the sound-induced flash illusion. Exp. Brain Res. 2014, 232, 2207–2220. [Google Scholar] [CrossRef] [PubMed]
- Alais, D.; Burr, D. The ventriloquist effect results from near-optimal bimodal integration. Curr. Biol. 2004, 14, 257–262. [Google Scholar] [CrossRef] [PubMed]
- Mcgurk, H.; Macdonald, J. Hearing lips and seeing voices. Nature 1976, 264, 746–748. [Google Scholar] [CrossRef] [PubMed]
- Kahneman, D. Attention and Effort; Prentice-Hall: Englewood Cliffs, NJ, USA, 1973; ISBN 978-0130505187. [Google Scholar]
- Taylor, M.M.; Lindsay, P.H.; Forbes, S.M. Quantification of shared capacity processing in auditory and visual discrimination. Acta Psychol. 1967, 27, 223–229. [Google Scholar] [CrossRef]
- Ciaramitaro, V.M.; Chow, H.M.; Eglington, L.G. Cross-modal attention influences auditory contrast sensitivity: Decreasing visual load improves auditory thresholds for amplitude- and frequency-modulated sounds. J. Vis. 2017, 17, 20. [Google Scholar] [CrossRef] [PubMed]
- Bonnel, A.M.; Hafter, E.R. Divided attention between simultaneous auditory and visual signals. Percept. Psychophys. 1998, 60, 179–190. [Google Scholar] [CrossRef]
- Wahn, B.; König, P. Audition and vision share spatial attentional resources, yet attentional load does not disrupt audiovisual integration. Front. Psychol. 2015, 6. [Google Scholar] [CrossRef]
- Gherri, E.; Eimer, M. Active listening impairs visual perception and selectivity: An ERP study of auditory dual-task costs on visual attention. J. Cogn. Neurosci. 2011, 23, 832–844. [Google Scholar] [CrossRef]
- Razon, S.; Basevitch, I.; Land, W.; Thompson, B.; Tenenbaum, G. Perception of exertion and attention allocation as a function of visual and auditory conditions. Psychol. Sport Exerc. 2009, 10, 636–643. [Google Scholar] [CrossRef]
- Cowan, N.; Barron, A. Cross-modal, auditory-visual Stroop interference and possible implications for speech memory. Percept. Psychophys. 1987, 41, 393–401. [Google Scholar] [CrossRef] [PubMed]
- Gaab, N.; Schulze, K.; Ozdemir, E.; Schlaug, G. Neural correlates of absolute pitch differ between blind and sighted musicians. Neuroreport 2006, 17, 1853–1857. [Google Scholar] [CrossRef] [PubMed]
- Hamilton, R.H.; Pascual-Leone, A.; Schlaug, G. Absolute pitch in blind musicians. Neuroreport 2004, 15, 803–806. [Google Scholar] [CrossRef] [PubMed]
- Landry, S.P.; Shiller, D.M.; Champoux, F. Short-term visual deprivation improves the perception of harmonicity. J. Exp. Psychol. Hum. Percept. Perform. 2013, 39, 1503–1507. [Google Scholar] [CrossRef] [PubMed]
- Petrus, E.; Isaiah, A.; Jones, A.P.; Li, D.; Wang, H.; Lee, H.K.; Kanold, P.O. Crossmodal induction of thalamocortical potentiation leads to enhanced information processing in the auditory cortex. Neuron 2014, 81, 664–673. [Google Scholar] [CrossRef] [PubMed]
- Meng, X.; Kao, J.P.; Lee, H.K.; Kanold, P.O. Visual deprivation causes refinement of intracortical circuits in the auditory cortex. Cell Rep. 2015, 12, 955–964. [Google Scholar] [CrossRef]
- Williams, P. Visual Project Management, 1st ed.; Lulu Com: Morrisville, NC, USA, 2015; ISBN 978-1312827165. [Google Scholar]
- Eagleman, D.M.; Kagan, A.D.; Nelson, S.S.; Sagaram, D.; Sarma, A.K. A standardized test battery for the study of synesthesia. J. Neurosci. Methods 2007, 159, 139–145. [Google Scholar] [CrossRef]
- Lehman, R.S. A multivariate model of synesthesia. Multivariate Behav. Res. 1972, 7, 403–439. [Google Scholar] [CrossRef]
- Sagiv, N.; Ward, J. Crossmodal interactions: Lessons from synesthesia. Prog. Brain Res. 2006, 259–271. [Google Scholar] [CrossRef]
- Hubbard, E.M.; Arman, A.C.; Ramachandran, V.S.; Boynton, G.M. Individual differences among grapheme-color synesthetes: Brain-behavior correlations. Neuron 2005, 45, 975–985. [Google Scholar] [CrossRef] [PubMed]
- Neufeld, J.; Sinke, C.; Zedler, M.; Dillo, W.; Emrich, H.M.; Bleich, S.; Szycik, G.R. Disinhibited feedback as a cause of synesthesia: Evidence from a functional connectivity study on auditory-visual synesthetes. Neuropsychologia 2012, 50, 1471–1477. [Google Scholar] [CrossRef] [PubMed]
- Barnett, K.J.; Newell, F.N. Synaesthesia is associated with enhanced, self-rated visual imagery. Conscious. Cogn. 2008, 17, 1032–1039. [Google Scholar] [CrossRef] [PubMed]
- Bor, D.; Rothen, N.; Schwartzman, D.J.; Clayton, S.; Seth, A.K. Adults can be trained to acquire synesthetic experiences. Sci. Rep. 2014, 4. [Google Scholar] [CrossRef] [PubMed]
- Neufeld, J.; Sinke, C.; Dillo, W.; Emrich, H.M.; Szycik, G.R.; Dima, D.; Bleich, S.; Zedler, M. The neural correlates of coloured music: A functional MRI investigation of auditory–visual synaesthesia. Neuropsychologia 2012, 50, 85–89. [Google Scholar] [CrossRef] [PubMed]
- Saenz, M.; Koch, C. The sound of change: Visually-induced auditory synesthesia. Curr. Biol. 2008, 18, R650–R651. [Google Scholar] [CrossRef]
- Kishon-Rabin, L.; Amir, O.; Vexler, Y.; Zaltz, Y. Pitch discrimination: Are professional musicians better than non-musicians? J. Basic Clin. Physiol. Pharmacol. 2001, 12. [Google Scholar] [CrossRef]
- Nikjeh, D.A.; Lister, J.J.; Frisch, S.A. Hearing of note: An electrophysiologic and psychoacoustic comparison of pitch discrimination between vocal and instrumental musicians. Psychophysiology 2008, 45, 994–1007. [Google Scholar] [CrossRef]
- Micheyl, C.; Delhommeau, K.; Perrot, X.; Oxenham, A.J. Influence of musical and psychoacoustical training on pitch discrimination. Hear. Res. 2006, 219, 36–47. [Google Scholar] [CrossRef]
- Tervaniemi, M.; Just, V.; Koelsch, S.; Widmann, A.; Schröger, E. Pitch discrimination accuracy in musicians vs nonmusicians: An event-related potential and behavioral study. Exp. Brain Res. 2004, 161, 1–10. [Google Scholar] [CrossRef]
- Barrett, K.C.; Ashley, R.; Strait, D.L.; Kraus, N. Art and science: How musical training shapes the brain. Front. Psychol. 2013, 4, 713. [Google Scholar] [CrossRef] [PubMed]
- Demany, L.; Carlyon, R.P.; Semal, C. Continuous versus discrete frequency changes: Different detection mechanisms? J. Acoust. Soc. Am. 2009, 125, 1082–1090. [Google Scholar] [CrossRef] [PubMed]
- Note Names, MIDI Numbers and Frequencies. 2017. Available online: http://newt.phys.unsw.edu.au/jw/notes.html (accessed on 17 August 2018).
- Geringer, J.M. Tuning preferences in recorded orchestral music. J. Res. Music Educ. 1976, 24, 169–176. [Google Scholar] [CrossRef]
- Lutman, M.E. Frequency Discrimination Test. 2004. Available online: http://resource.isvr.soton.ac.uk/audiology/Software/FD_test.htm (accessed on 17 August 2018).
- Ingard, K. Notes on Acoustics; Infinity Science Press: Hingham, MA, USA; Plymouth, UK, 2008; p. 3. ISBN 9781934015087. [Google Scholar]
- Alais, D.; Morrone, C.; Burr, D. Separate attentional resources for vision and audition. Proc. R. Soc. B 2006, 273, 1339–1345. [Google Scholar] [CrossRef] [PubMed]
- Luo, H.; Boemio, A.; Gordon, M.; Poeppel, D. The perception of FM sweeps by Chinese and English listeners. Hear. Res. 2007, 224, 75–83. [Google Scholar] [CrossRef] [PubMed]
- Dooley, G.J.; Moore, B.C. Detection of linear frequency glides as a function of frequency and duration. J. Acoust. Soc. Am. 1988, 84, 2045–2057. [Google Scholar] [CrossRef]
- Lewald, J. More accurate sound localization induced by short-term light deprivation. Neuropsychologia 2007, 45, 1215–1222. [Google Scholar] [CrossRef]
- Banissy, M.J.; Walsh, V.; Ward, J. Enhanced sensory perception in synaesthesia. Exp. Brain Res. 2009, 196, 565–571. [Google Scholar] [CrossRef]
- Bianchi, F.; Santurette, S.; Wendt, D.; Dau, T. Pitch discrimination in musicians and non-musicians: Effects of harmonic resolvability and processing effort. J. Assoc. Res. Otolaryngol. 2015, 17, 69–79. [Google Scholar] [CrossRef]
- Schellenberg, E.G.; Moreno, S. Music lessons, pitch processing, and g. Psychol. Music 2009, 38, 209–221. [Google Scholar] [CrossRef]
- Dixon, M.J.; Smilek, D.; Merikle, P.M. Not all synaesthetes are created equal: Projector versus associator synaesthetes. Cogn. Affect. Behav. Neurosci. 2004, 4, 335–343. [Google Scholar] [CrossRef] [PubMed]
- Herholz, S.C.; Zatorre, R.J. Musical training as a framework for brain plasticity: Behavior, function, and structure. Neuron 2012, 76, 486–502. [Google Scholar] [CrossRef] [PubMed]
- Wong, Y.K.; Gauthier, I. Music-reading expertise alters visual spatial resolution for musical notation. Psychon. Bull. Rev. 2012, 19, 594–600. [Google Scholar] [CrossRef] [PubMed]


| Reference Frequency (Hz) | High Initial Target Frequency (Hz) | Low Initial Target Frequency (Hz) |
|---|---|---|
| 110 | 116.54 | 103.83 |
| 440 | 466.16 | 415.3 |
| 1760 | 1864.66 | 1661.22 |
| FDL | N | Mdn (Octaves) | Range (Octaves) | Z | p | r | |
|---|---|---|---|---|---|---|---|
| Low frequency, gliding downwards | Control session | 39 | 0.019 | 0.12 | −3.10 | 0.00 | 0.50 |
| Experimental session | 0.014 | 0.09 | |||||
| Low frequency, gliding upwards | Control session | 32 | 0.034 | 0.28 | −0.84 | 0.40 | 0.15 |
| Experimental session | 0.014 | 0.48 | |||||
| Middle frequency, gliding downwards | Control session | 35 | 0.019 | 0.05 | −0.69 | 0.49 | 0.12 |
| Experimental session | 0.014 | 0.09 | |||||
| Middle frequency, gliding upwards | Control session | 35 | 0.020 | 0.05 | −2.15 | 0.03 | 0.36 |
| Experimental session | 0.014 | 0.04 | |||||
| High frequency, gliding downwards | Control session | 32 | 0.017 | 0.05 | −0.36 | 0.72 | 0.06 |
| Experimental session | 0.014 | 0.03 | |||||
| High frequency, gliding upwards | Control session | 32 | 0.006 | 0.02 | −4.10 | 0.00 | 0.72 |
| Experimental session | 0.002 | 0.01 | |||||
| FDL | N | Mdn (Octaves) | Range (Octaves) | Z | p | r | |
|---|---|---|---|---|---|---|---|
| Low frequency, gliding downwards | Control session | 42 | 0.019 | 0.12 | −1.53 | 0.13 | 0.24 |
| Experimental session | 0.019 | 0.12 | |||||
| Low frequency, gliding upwards | Control session | 39 | 0.020 | 0.28 | −0.20 | 0.84 | 0.03 |
| Experimental session | 0.020 | 0.28 | |||||
| Middle frequency, gliding downwards | Control session | 38 | 0.019 | 0.05 | −0.02 | 0.99 | 0.00 |
| Experimental session | 0.019 | 0.05 | |||||
| Middle frequency, gliding upwards | Control session | 38 | 0.008 | 0.05 | −0.42 | 0.68 | 0.07 |
| Experimental session | 0.008 | 0.05 | |||||
| High frequency, gliding downwards | Control session | 33 | 0.008 | 0.05 | −0.64 | 0.53 | 0.11 |
| Experimental session | 0.008 | 0.05 | |||||
| High frequency, gliding upwards | Control session | 40 | 0.008 | 0.02 | −0.11 | 0.91 | 0.02 |
| Experimental session | 0.006 | 0.02 | |||||
| FDL | Visual Association | N | Mdn (Octaves) | Range (Octaves) | Z | U | p | r | |
|---|---|---|---|---|---|---|---|---|---|
| Low frequency, gliding downwards | Control session | Presence | 8 | 0.033 | 0.12 | −0.83 | 240.50 | 0.41 | 0.09 |
| Absence | 73 | 0.019 | 0.12 | ||||||
| Experimental session | Presence | 8 | 0.016 | 0.09 | −0.33 | 271.00 | 0.74 | 0.04 | |
| Absence | 73 | 0.014 | 0.12 | ||||||
| Low frequency, gliding upwards | Control session | Presence | 8 | 0.020 | 0.28 | −1.39 | 191.00 | 0.17 | 0.16 |
| Absence | 68 | 0.049 | 0.28 | ||||||
| Experimental session | Presence | 7 | 0.014 | 0.09 | −1.13 | 168.50 | 0.26 | 0.13 | |
| Absence | 65 | 0.020 | 0.48 | ||||||
| Middle frequency, gliding downwards | Control session | Presence | 7 | 0.019 | 0.01 | −0.46 | 211.00 | 0.64 | 0.05 |
| Absence | 67 | 0.019 | 0.05 | ||||||
| Experimental session | Presence | 7 | 0.011 | 0.03 | −0.65 | 241.00 | 0.52 | 0.07 | |
| Absence | 70 | 0.014 | 0.09 | ||||||
| Middle frequency, gliding upwards | Control session | Presence | 7 | 0.008 | 0.02 | −1.01 | 188.00 | 0.31 | 0.12 |
| Absence | 69 | 0.020 | 0.05 | ||||||
| Experimental session | Presence | 7 | 0.008 | 0.03 | −0.14 | 234.00 | 0.89 | 0.02 | |
| Absence | 69 | 0.008 | 0.05 | ||||||
| High frequency, gliding downwards | Control session | Presence | 7 | 0.008 | 0.05 | −0.71 | 186.00 | 0.48 | 0.08 |
| Absence | 63 | 0.019 | 0.05 | ||||||
| Experimental session | Presence | 8 | 0.007 | 0.09 | −1.50 | 162.50 | 0.13 | 0.18 | |
| Absence | 60 | 0.014 | 0.09 | ||||||
| High frequency, gliding upwards | Control session | Presence | 7 | 0.008 | 0.02 | −0.83 | 202.50 | 0.41 | 0.09 |
| Absence | 71 | 0.008 | 0.02 | ||||||
| Experimental session | Presence | 7 | 0.003 | 0.01 | −0.16 | 226.00 | 0.87 | 0.02 | |
| Absence | 67 | 0.003 | 0.02 | ||||||
| FDL | Musical Training | N | Mdn (Octaves) | Range (Octaves) | Z | U | p | r | ||
|---|---|---|---|---|---|---|---|---|---|---|
| Low frequency, gliding downwards | Control session | Yes | 50 | 0.019 | 0.12 | −1.19 | 655.00 | 0.24 | 0.13 | |
| No | 31 | 0.019 | 0.12 | |||||||
| Experimental session | Yes | 50 | 0.019 | 0.09 | −1.35 | 637.00 | 0.18 | 0.15 | ||
| No | 31 | 0.005 | 0.12 | |||||||
| Low frequency, gliding upwards | Control session | Yes | 48 | 0.020 | 0.28 | −3.21 | 377.50 | 0.00 | 0.37 | |
| No | 28 | 0.049 | 0.28 | |||||||
| Experimental session | Yes | 47 | 0.014 | 0.48 | −3.44 | 298.00 | 0.00 | 0.41 | ||
| No | 25 | 0.049 | 0.48 | |||||||
| Middle frequency, gliding downwards | Control session | Yes | 47 | 0.019 | 0.04 | −0.17 | 620.00 | 0.86 | 0.02 | |
| No | 27 | 0.019 | 0.05 | |||||||
| Experimental session | Yes | 49 | 0.014 | 0.09 | −2.07 | 512.00 | 0.04 | 0.23 | ||
| No | 29 | 0.019 | 0.09 | |||||||
| Middle frequency, gliding upwards | Control session | Yes | 49 | 0.008 | 0.05 | −1.73 | 510.00 | 0.08 | 0.20 | |
| No | 27 | 0.020 | 0.05 | |||||||
| Experimental session | Yes | 49 | 0.008 | 0.05 | −2.93 | 394.00 | 0.00 | 0.33 | ||
| No | 29 | 0.014 | 0.05 | |||||||
| High frequency, gliding downwards | Control session | Yes | 47 | 0.008 | 0.05 | −2.55 | 347.00 | 0.01 | 0.30 | |
| No | 23 | 0.019 | 0.04 | |||||||
| Experimental session | Yes | 46 | 0.014 | 0.09 | −2.87 | 290.00 | 0.00 | 0.35 | ||
| No | 22 | 0.019 | 0.09 | |||||||
| High frequency, gliding upwards | Control session | Yes | 48 | 0.008 | 0.02 | −0.24 | 697.00 | 0.81 | 0.03 | |
| No | 30 | 0.008 | 0.02 | |||||||
| Experimental session | Yes | 47 | 0.003 | 0.01 | −0.84 | 560.00 | 0.40 | 0.10 | ||
| No | 27 | 0.003 | 0.02 | |||||||
© 2018 by the authors. Licensee MDPI, Basel, Switzerland. This article is an open access article distributed under the terms and conditions of the Creative Commons Attribution (CC BY) license (http://creativecommons.org/licenses/by/4.0/).
Share and Cite
Tse, C.K.; Yu, C.K.-C. The Effects of Visual Cues, Blindfolding, Synesthetic Experience, and Musical Training on Pure-Tone Frequency Discrimination. Behav. Sci. 2019, 9, 2. https://doi.org/10.3390/bs9010002
Tse CK, Yu CK-C. The Effects of Visual Cues, Blindfolding, Synesthetic Experience, and Musical Training on Pure-Tone Frequency Discrimination. Behavioral Sciences. 2019; 9(1):2. https://doi.org/10.3390/bs9010002
Chicago/Turabian StyleTse, Cho Kwan, and Calvin Kai-Ching Yu. 2019. "The Effects of Visual Cues, Blindfolding, Synesthetic Experience, and Musical Training on Pure-Tone Frequency Discrimination" Behavioral Sciences 9, no. 1: 2. https://doi.org/10.3390/bs9010002
APA StyleTse, C. K., & Yu, C. K.-C. (2019). The Effects of Visual Cues, Blindfolding, Synesthetic Experience, and Musical Training on Pure-Tone Frequency Discrimination. Behavioral Sciences, 9(1), 2. https://doi.org/10.3390/bs9010002