Article

Zeolite and Winery Waste as Innovative By-Product for Vineyard Soil Management

1
National Research Council-Research Institute on Terrestrial Ecosystems (CNR-IRET), Via Moruzzi 1, 56124 Pisa, Italy
2
Department of Agriculture, Food, Environment and Forestry Sciences and Technologies (DAGRI), University of Florence, Viale delle Dee 30, 50019 Sesto Fiorentino, Italy
3
Soil Science Unit, Department of Chemical Engineering, Agriculture and Food Technology, University of Girona, Campus Montilivi, C/Aurélia Capmany, 61, 17003 Girona, Spain
*
Authors to whom correspondence should be addressed.
Environments 2024, 11(2), 29; https://doi.org/10.3390/environments11020029
Submission received: 28 December 2023 / Revised: 26 January 2024 / Accepted: 30 January 2024 / Published: 2 February 2024

Abstract

:
In semiarid environments, vine cultivation is a land use with a high impact with regard to soil erosion, loss of organic matter and biodiversity, contamination, and compaction. In addition, the wine supply chain produces a considerable quantity of organic waste, which remains as residues in the ecosystem. Within this context, we developed a sustainable vine management system to improve the efficient use of fertilisers by applying a by-product derived from the composting of winery wastes and zeolite. We evaluated the effects of the zeolite-based compost on the chemical, physical, and biochemical soil properties of a productive vineyard. Four treatments were set up and monitored for about two years. These were as follows: (1) Commercial compost (COM); (2) Zeolite (Z); (3) 30% zeolite and 70% winery waste compost (30 ZEO); (4) 10% zeolite and 90% winery waste compost (10 ZEO). The results demonstrated that the ZEO treatments could be considered a win–win solution able to improve soil water content, nutrient retention, carbon sequestration, and biochemical activity while also recycling wastes. In particular, 10 ZEO seems to be the amendment that best combines an improvement in soil biochemical properties with gradual and constant nutrient availability, thus satisfying, without exceeding, soil and plant needs.

1. Introduction

Climate change, which has been taking place for several years, has reduced the water availability of Italian and European soils, thus altering the phenological phases of many crops. For grapevine, for example, there is an advance of 6–8 days for each degree of temperature increase during the growing season. In 2022, severe drought and extreme heat posed new threats to wine production. A Global Drought Observatory report indicated that almost two-thirds of the European territory was in a drought situation or on alert due to heat waves and deficient rainfall [1]. In fact, 2022 marked the worst drought in the last 500 years. The increase in anomalous grape harvests, with short and intense rainfall concentrated only in a few days a year, is also causing an increase in erosive phenomena, especially in the hillside vineyards with rows aligned down the maximum slope gradient [2].
Several studies have reported that European-wide vineyards tend to lose more soil than the proposed upper limit of the tolerable soil erosion rate of 1.4 t ha−1 year−1 [3]. In addition, agronomic practices in vineyard soils, such as tillage, weed control via herbicides, and using mineral fertilizers at the expense of organic ones, has resulted in soil structure degradation and organic matter loss [4]. The decrease in organic matter, especially in intensive monocultures such as viticulture, is becoming a consolidated problem in the majority of Italian vineyards. At the European level, about 90% of soils have a low (0–2%) or medium (2–6%) organic carbon content. The lowest values of organic carbon are found above all in the soils of southern Europe, where 74% of the territory has less than 2% of organic carbon at a depth of 0–30 cm.
Tillage destroys soil structure, mixes surface horizons with a homogeneous distribution of organic matter in the worked layer and alters soil temperature. A loss in SOC of about 2.3 t ha−1 year has been estimated in the 0–17 cm horizon in the first five years of a vineyard’s soil cultivation [5], while a decline in SOC of 15.7 t h−1 year has been measured in a mountain vineyard [6]. Additionally, using inorganic fertiliser as a significant soil nutrient replacement resulted in negative environmental repercussions, such as soil acidification and waterbody contamination [7]. In cases of soil acidification an inorganic liming treatment could be considered.
As reported by the International Organization of Vine and Wine (IOVW), Italy is the top wine producer, producing around 50 million hl during the 2021 campaign [8]. For this reason, an efficient management of vineyards in Italy is of paramount importance.
As is well known, the wine production process involves generating significant amounts of organic waste (stalks and grape pomace). Pomace represents about 18–25% of the grape mass that becomes a by-product during wine pressing and fermentation [9]. Similarly, stalks that make up the lignocellulosic skeleton of grapes are obtained after the destemming process and represent between 3 and 6% of the grapes [10].
Separation and exploitation of these by-products are critical imperatives of sustainability. Such organic wastes represent a resource rather than an annoying cost to manage. In Italy, some estimates indicate a potential availability of about 2.4 million tons of wine-making by-products; on average, three-quarters are unused.
The European Commission launched a public consultation on organic farming in 2020 in order to foresee 25% of land under organic cultivation by 2030. The commission budgeted EUR 40 million in 2021 to support organic farming, guarantee sustainable soil management, and promote the use of organic products so as to accomplish this goal, which is included in the European Green Deal. Many studies have been conducted in several countries to assess the potential of compost application in fertility restoration. These include various sources of organic residues such as cattle manure and cowpea haulm, animal manure, kitchen and kraal manure, cherry residue, cattle manure and sugarcane bagasse, and pig manure.
Recycling winery wastes as compost in agriculture can have several benefits. These comprise the conservation of limited and non-renewable rock phosphate utilized as chemical P fertilizer, improvement in soil nutrient content, structure stabilization of soil, reduction in soil erosion, and mitigation of climate change due to reduced GHG emissions from waste decomposition in open dumps. Furthermore, adding zeolite has proved to be an effective strategy to conserve nitrogen and mitigate gaseous emissions during composting of organic agricultural wastes [11].
Zeolites are crystalline, hydrated aluminosilicates that can swap their constituent elements and lose and acquire water reversibly without experiencing a significant structural change [12].
Previous studies have demonstrated that a 1–30% zeolite dosage during composting of various organic wastes, including winery wastes, enabled higher retention of nutrients, stimulation of enzymatic activity, and humification of organic matter to control composting (100% wastes) [13,14]. In addition, in zeolite-based composts a decrease in electrical conductivity and an increase in germination index were observed, thus indicating the improvement in the agronomic quality of the compost [15,16].
When added to soil, zeolite can operate as a long-lasting, nutrient-conserving amendment, minimising nutrient leaching and improving water usage efficiency while also promoting crop development [17,18]. Natural zeolites are particularly capable of absorbing NH4+ from solutions in a variety of environments and releasing it under proper conditions. They exhibited a remarkable selectivity for cations with low ionic potential, such as K+ and NH4+ [18]. It is important to note that the effectiveness of zeolites in nutrient retention can vary based on factors such as zeolite type, particle size, application rate, and soil conditions.
Within this framework, we started from the results of previous studies aimed at separately evaluating the effectiveness of zeolite and compost application in the improvement of agricultural soil quality. The objective of the present research was to examine the influence of the application of an innovative compost based on zeolite and winery wastes on vineyard soil quality and fertility in comparison with a commercial compost. At the same time, compost production, starting from wine processing waste, offers a solution to the problem of waste management by closing the company’s production cycle.

2. Material and Methods

In spring 2019, the following treatments were applied in triplicate to a productive vineyard (Vitis vinifera L., Sangiovese cultivar): (1) Commercial compost (COM) at the rate 20 t ha−1 (6.6 t C ha−1); (2) Zeolite (Z) at the rate 10 t ha−1; (3) Compost based on 10% zeolite and 90% winery waste (10 ZEO) at the rate 30 t ha−1 (8.7 t C ha−1); (4) Compost based on 30% zeolite and 70% winery waste (30 ZEO) at the rate 30 t ha−1 (7.8 t C ha−1); (5) Control soil (C). The zeolite composts were obtained as described by Doni et al. [19].
The experimentation was set up in San Miniato (Pisa, Tuscany) in central Italy. The climate is typically Mediterranean and semiarid, with a mean annual precipitation of 859 mm and a mean annual temperature of 14.3 °C. The soil classification is Calcixerept [20] with a sandy clay loam texture (51.1% sand, 28.3% clay, and 20.6% silt) (USDA classification), an organic matter (OM) content of 1.8% (±0.2), a high level of carbonate (bivalve shells were widespread), and a slightly alkaline pH.
In this productive vineyard, the vine spacing is 2 m between rows and 0.8 m between plants. Before the beginning of the vegetative growth of the vine (March 2019), the vineyard was divided into fifteen sub-plots of about 0.15 ha each (8 m × 20 m), where the treatments were applied in triplicate (four treatments repeated three times). The sub-plots were chosen and considered to be independent true replicates, and a 2 m wide strip between them was considered to reduce any edge effect. The experimental site had a completely randomized block design, as shown in Figure 1.
The management system of the vineyard was characterized by commercial compost fertilization at a rate of 80 t/ha every three years. The selected vineyard received its last fertilization using commercial compost in winter 2016.
A manure spreader was used to distribute the compost-based treatments (COM, 30 ZEO, and 10 ZEO) over the entire soil surface. At the same time, zeolite with a granulometry of 1.0–2.5 mm was uniformly distributed through a centrifugal spreader capable of performing variable rates. All treatments were buried via harrowing to a depth of 30 cm.
The X-ray diffractometry (XRD) analysis of zeolite showed that it was almost 85% clinoptilolite, and the remainder comprised stilbite and heulandite. Table 1 reports the zeolite main characteristics. Table 2 shows the different compost characteristics.
Immediately after treatment application (Spring 2019, T0) and after the grape harvesting in 2019 (six months after treatments application, October 2019, T1), 2020 (18 months after treatments application, October 2020, T2), and 2021 (30 months after treatments application, October 2021, T3), three composite soil samples were taken from each sub-plot between vine rows at the 0–30 cm layer. Each soil sample was a composite of three sub-samples collected in a homogenous area. The three sub-samples were mixed, homogenized, and sieved (2 mm); a part of each of the composite soil samples was stored at four °C for inorganic N quantification, and another part was air-dried for the other analyses. The chemical and biochemical results are the average of the nine soil samples (3 composite soil samples × 3 replicates) for each treatment (9 soil samples × 5 treatments) for each sampling time (45 × 4 sampling campaigns) for a total of 180 soil samples.

2.1. Chemical Parameters

Electrical conductivity (EC) and pH were determined in water extracts using selective electrodes Conmet 2 (Hanna Instruments, Woonsocket, Rhode Island, USA) and pH electrode InLab routine pro (Sevenmulti, Mettler Toledo, Greifensee, Switzerland). Total Organic Carbon (TOC) and total nitrogen (TN) were measured via dry combustion using FlashSmart Elemental Analyzer (Thermo Fisher Scientific, Waltham, MA, USA) according to the manufacturer’s instructions. Total phosphorus (TP) and potassium (TK) were extracted via nitric-perchloric acid digestion (HNO3:HClO4, 5:2) in a microwave Ethos 1 (Milestone srl, Bergamo, Italy). Available phosphorus (AP) was extracted using the Olsen method [21]. TP and AP were measured using the method reported by Murphy and Riley (1962) using the Spectophotometer-Unicam UV 500 (Thermo Fisher Scientific, Waltham, MA, USA). Available potassium (AK) was extracted using ammonium acetate solution [22]. TK and AK were determined using 5900 ICP-OES (Agilent, Santa Clara, CA, USA). Sodium pyrophosphate (0.1 M, pH 11) at 60 °C for 24 h under shaking at 200 oscillation min−1 was used to extract Total Humic Carbon (THC). The THC extract was separated into humic (HA) and fulvic (FA) acids via the addition of H2SO4; the extract was kept overnight at 4 °C and then the flocculent (HA) and the supernatant (FA) were centrifuged. THC and FA were determined according to the method proposed by Jakubus and Spychalski [23] in which KMnO4 oxidized carbon. The HA was calculated by subtracting FA from THC. The Cation Exchange Capacity (CEC) of the soils was determined via the Sumner and Miller method [24] using barium chloride (pH 8.1).

2.2. Biochemical Parameters

Total β-glucosidase (Glu), phosphatase (Pho), arylsulphatase (AS), and butyrate esterase (BE) activities were tested via the method of Marx et al. [25] and Vepsäläinen et al. [26] using 4-mthylumbelliferyl β-glucosidase, 4-methylumbelliferyl phosphate, 4-methylumbelliferyl sulphate, and 4-methylumbelliferyl butyrate, respectively, as substrates. Fluorescence (excitation 360 nm; emission 450 nm) of the product 4-Methylumbelliferone was measured using an Infinite F200 pro plate reader fluorimeter (Tecan, Männedorf, Zürich, Switzerland) after 0, 30, 60, 120, and 180 min of incubation at 30 °C.

2.3. Physical Parameters

According to the manufacturer’s instructions, the wet stability of aggregates (WSA) was measured at plot level on aggregates extracted from the air-dry sieved soil (Eijkelkamp, Soil & Water, Giesbeek, The Netherlands). Briefly, 4 g of 1–2 mm air-dry aggregates were transferred to a sieve with 250 µm openings and rewetted using a vaporizer. The sieve was moved up and down for 3 min (34 cycles min−1; stroke length 13 mm) in aluminum cans filled with 100 mL of water. The wet stability of aggregates was calculated as the stable soil aggregate fraction remaining on the sieve (after oven-drying at 105 °C for 24 h).
A pressure plate was used to determine field capacity and wilting point at a pF of 2.54 and 4.2, respectively. Available water (AW) was calculated as the difference between these two features [27].

2.4. Statistical Analysis

Prism 10.1 for macOS (GraphPad Inc., Dotmatics, Boston, MA, USA) was used for the statistical analysis. Analysis of variance was used to reveal differences between treatments and sampling times (one-way ANOVA). Fisher’s test, which calculates the least significant differences at p < 0.05, was used to compare the means. Furthermore, potential patterns or clusters between treatments and physical–chemical and biochemical soil parameters were determined using principal component analysis (PCA). All raw data were log-transformed before being normalized, thereby reducing data heterogeneity. The PCs were only to be interpreted when component loadings greater than 0.60 were present.

3. Results

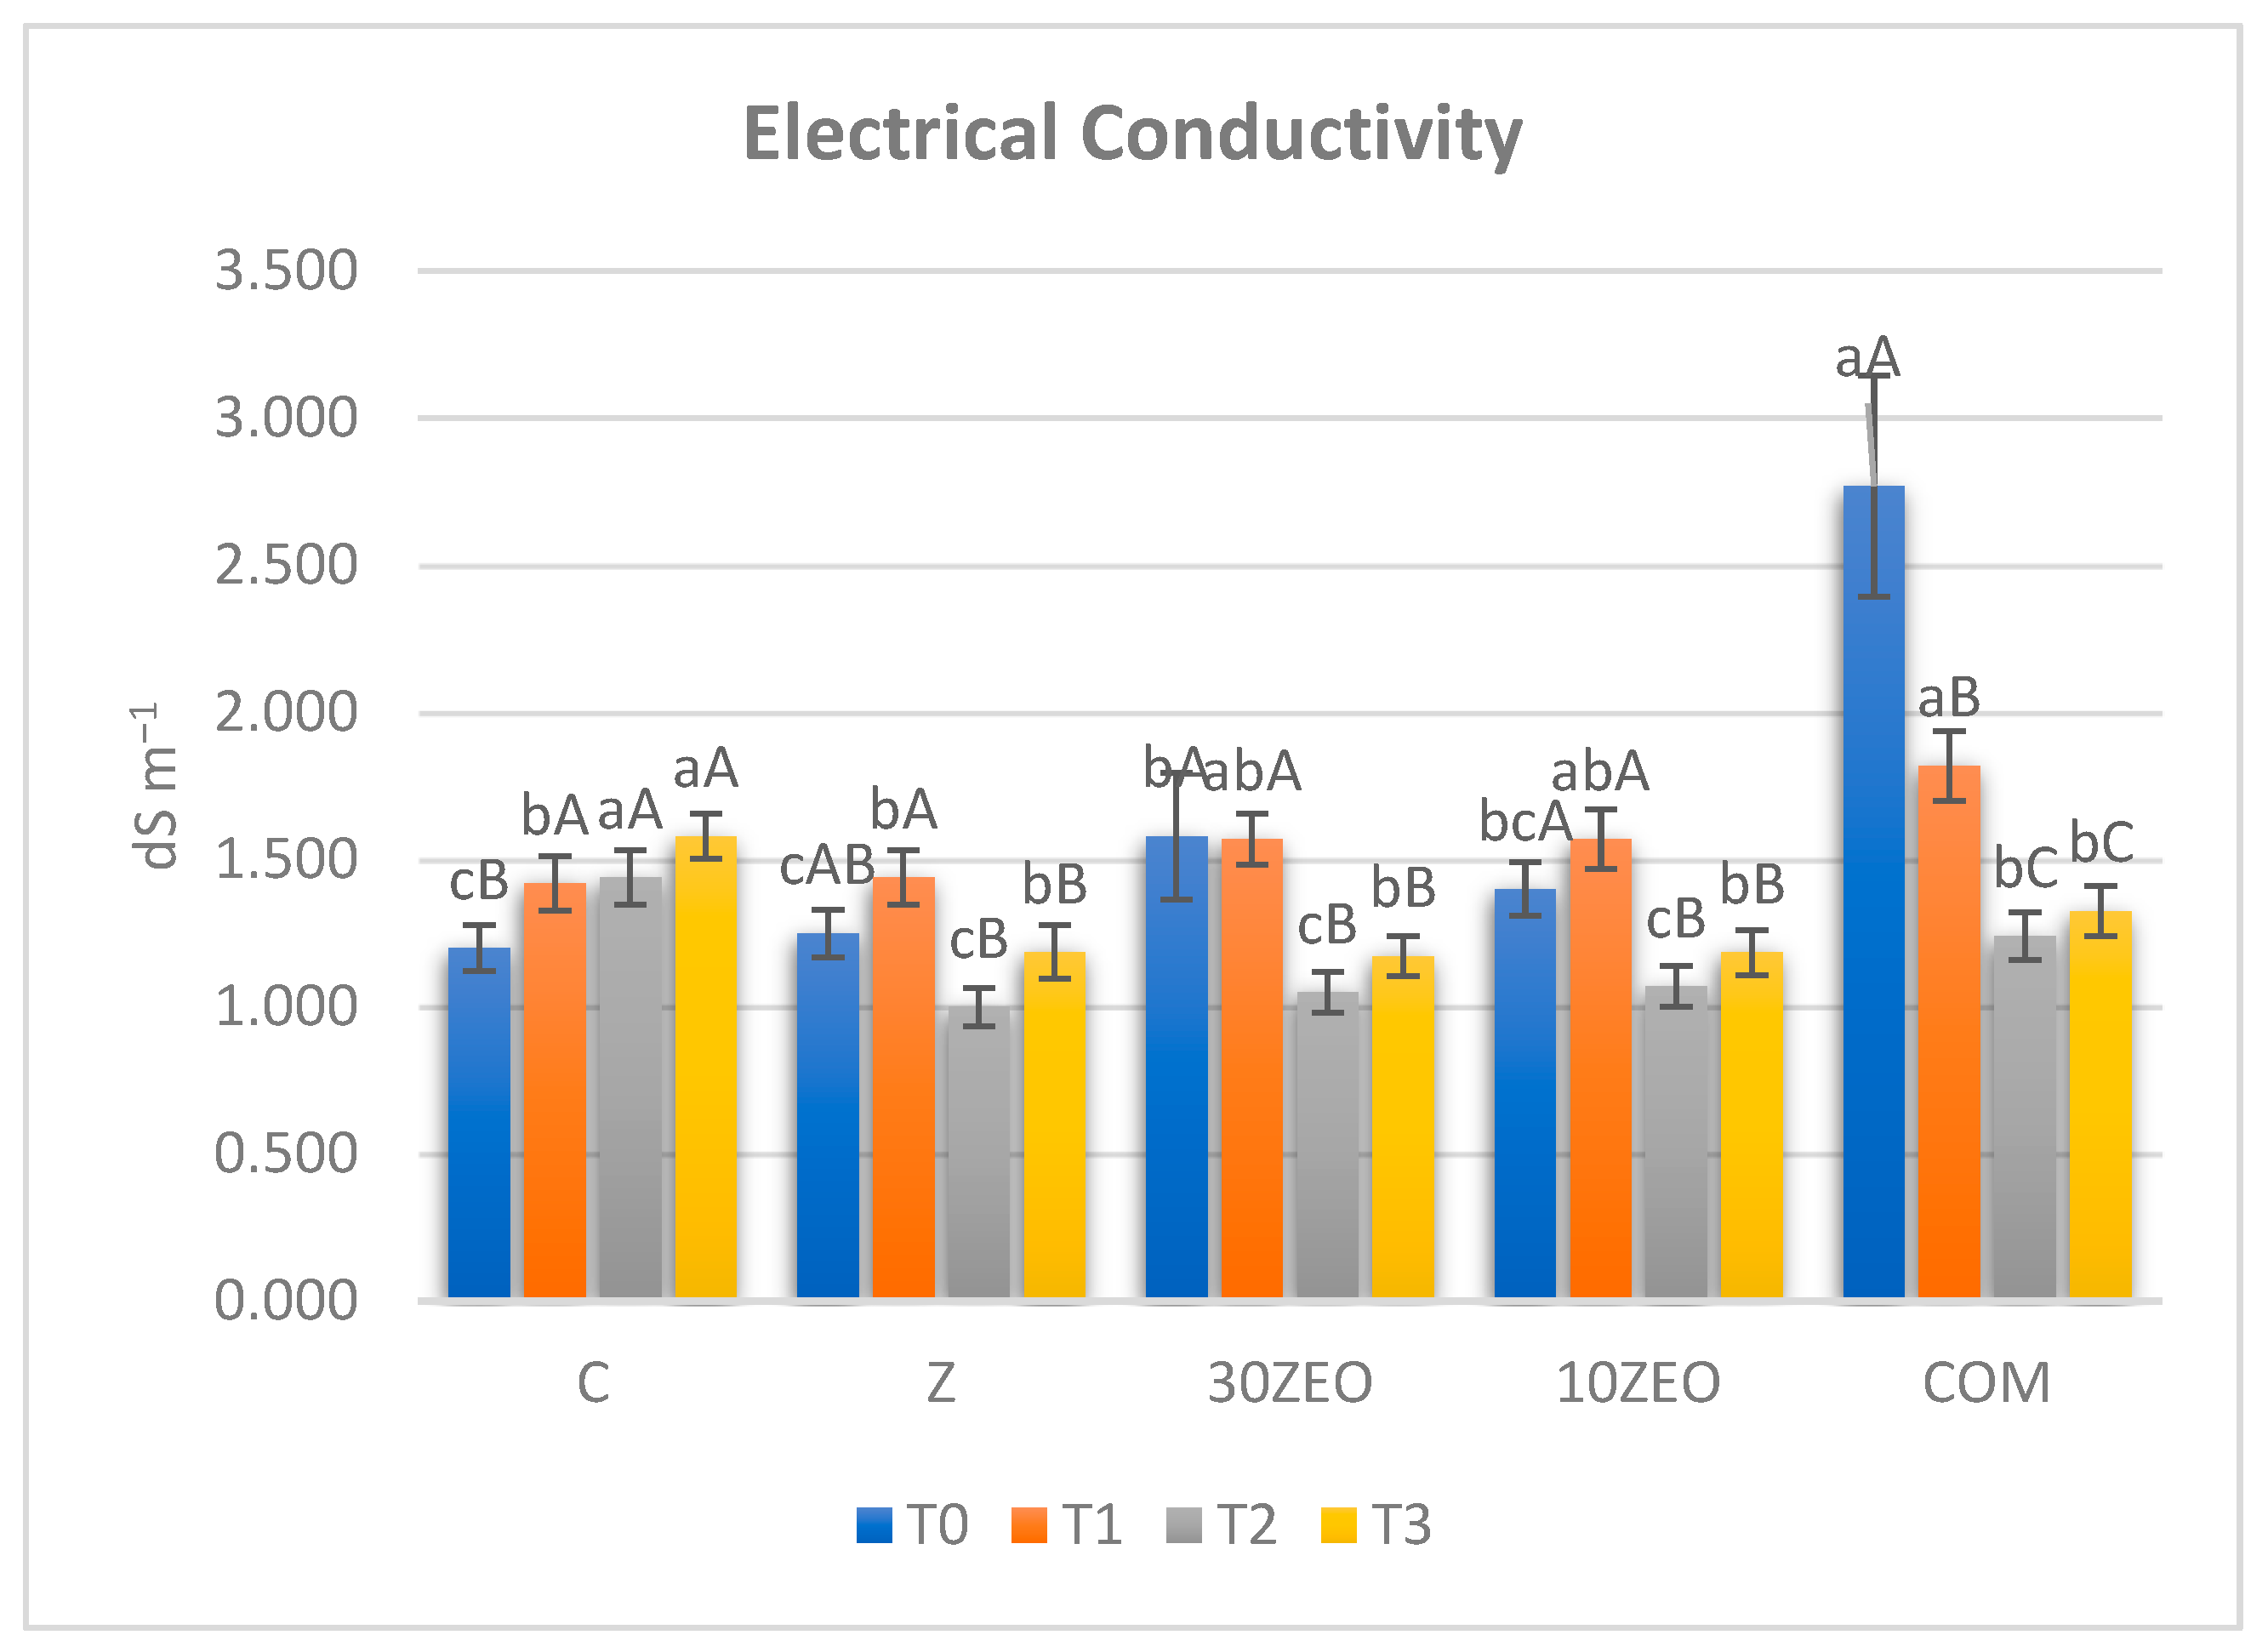
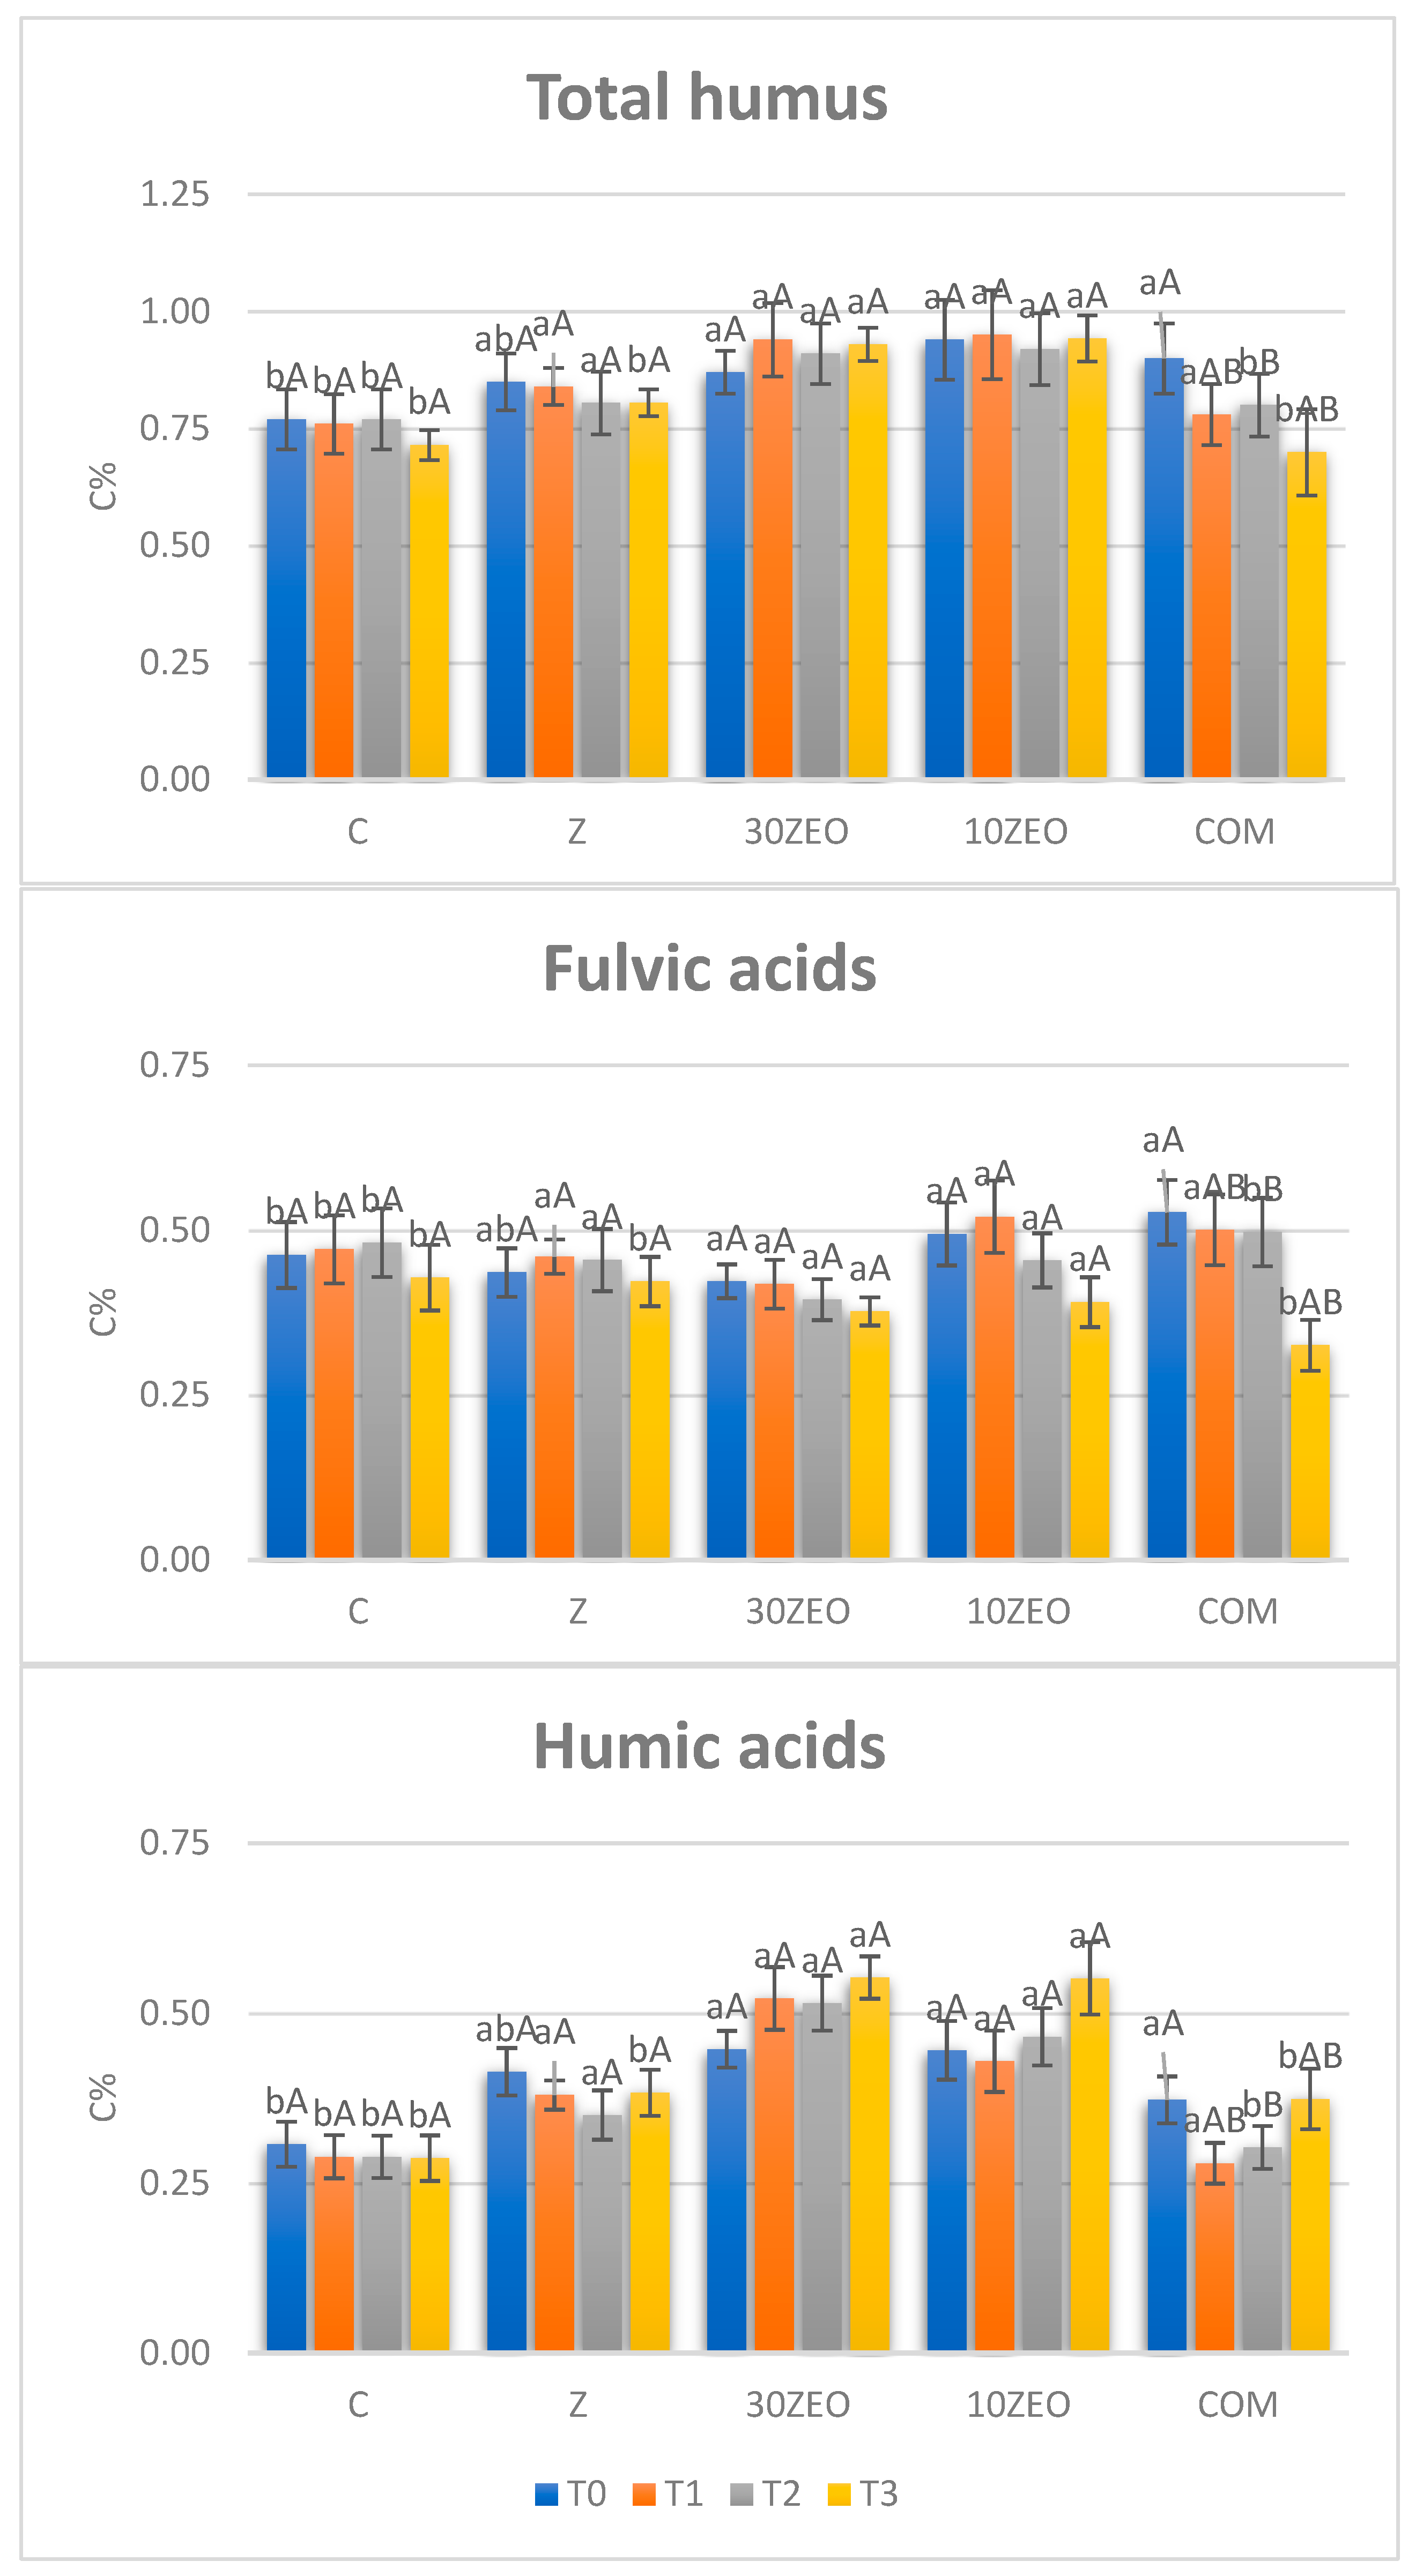
3.1. Chemical Parameters

The chemical properties of the soils treated using zeolite-based compost (ZEO treatments) compared to the control soil (C treatment) are reported in Table 3. The treatments did not influence the pH of the vineyard soil, and a slight increase in this parameter was observed in all soil samples over time. The CEC of the amended soils, especially 10 ZEO, was significantly higher at each sampling time than that of the unamended vineyard soil (C treatment).
All compost-based treatments (COM, 10 ZEO, and 30 ZEO), particularly COM, enhanced soil electrical conductivity (EC) in comparison with the C soil at the initial sampling time (T0), whereas the Z treatment maintained it. This parameter showed a reduction over time in all treated soils, while it increased in the untreated control (C) soil (Figure 2).
Both 10 ZEO and 30 ZEO resulted in an increase in soil organic carbon content (TOC) compared to the C soil at each sampling time, and this increase was more pronounced in 10 ZEO at the final sampling (T3). As expected, an increase in TOC in the COM treatment compared to the C soil was also measured at T0 sampling time. However, during the T3 sampling campaign, there was no significant difference in the TOC between the COM treatment and the C soil (Figure 3).
In a similar way, soil nitrogen (TN) was significantly affected by the treatments. An increase in this parameter in the Z and ZEO treatments, especially 10 ZEO, in comparison with the C soil was observed at the final sampling (T3) (10%, 47%, and 18% more TN than the C soil in Z, 10 ZEO, and 30 ZEO, respectively) (Figure 3). However, the TN content in the COM-treated soil decreased over time, and a significantly higher value was found in this treatment compared to the C soil only at the initial sampling time (T0).
Generally, the content of TP and TK, two of the essential plant nutrients, was higher in all the compost-treated soils (COM, 10 ZEO, and 30 ZEO), especially in 10 ZEO, compared with the C soil (Table 3). At the same time, the treatments containing zeolite (10 ZEO, 30 ZEO, and Z) decreased the available phosphorus (AP) and potassium (AK) compared to the COM treatment at T3 sampling, thus indicating the increase in soil retention ability of these elements.
Both 10 ZEO and 30 ZEO treatments significantly increased total humus (TH) compared to the control soil at each sampling time. In contrast, significantly higher values of this parameter in the COM treatment were observed only at the T0 sampling. In the COM treatment there was a decreasing trend, especially in fulvic acids, while the ZEO treatments maintained total humus over time and increased their humic acid fraction (Figure 4).

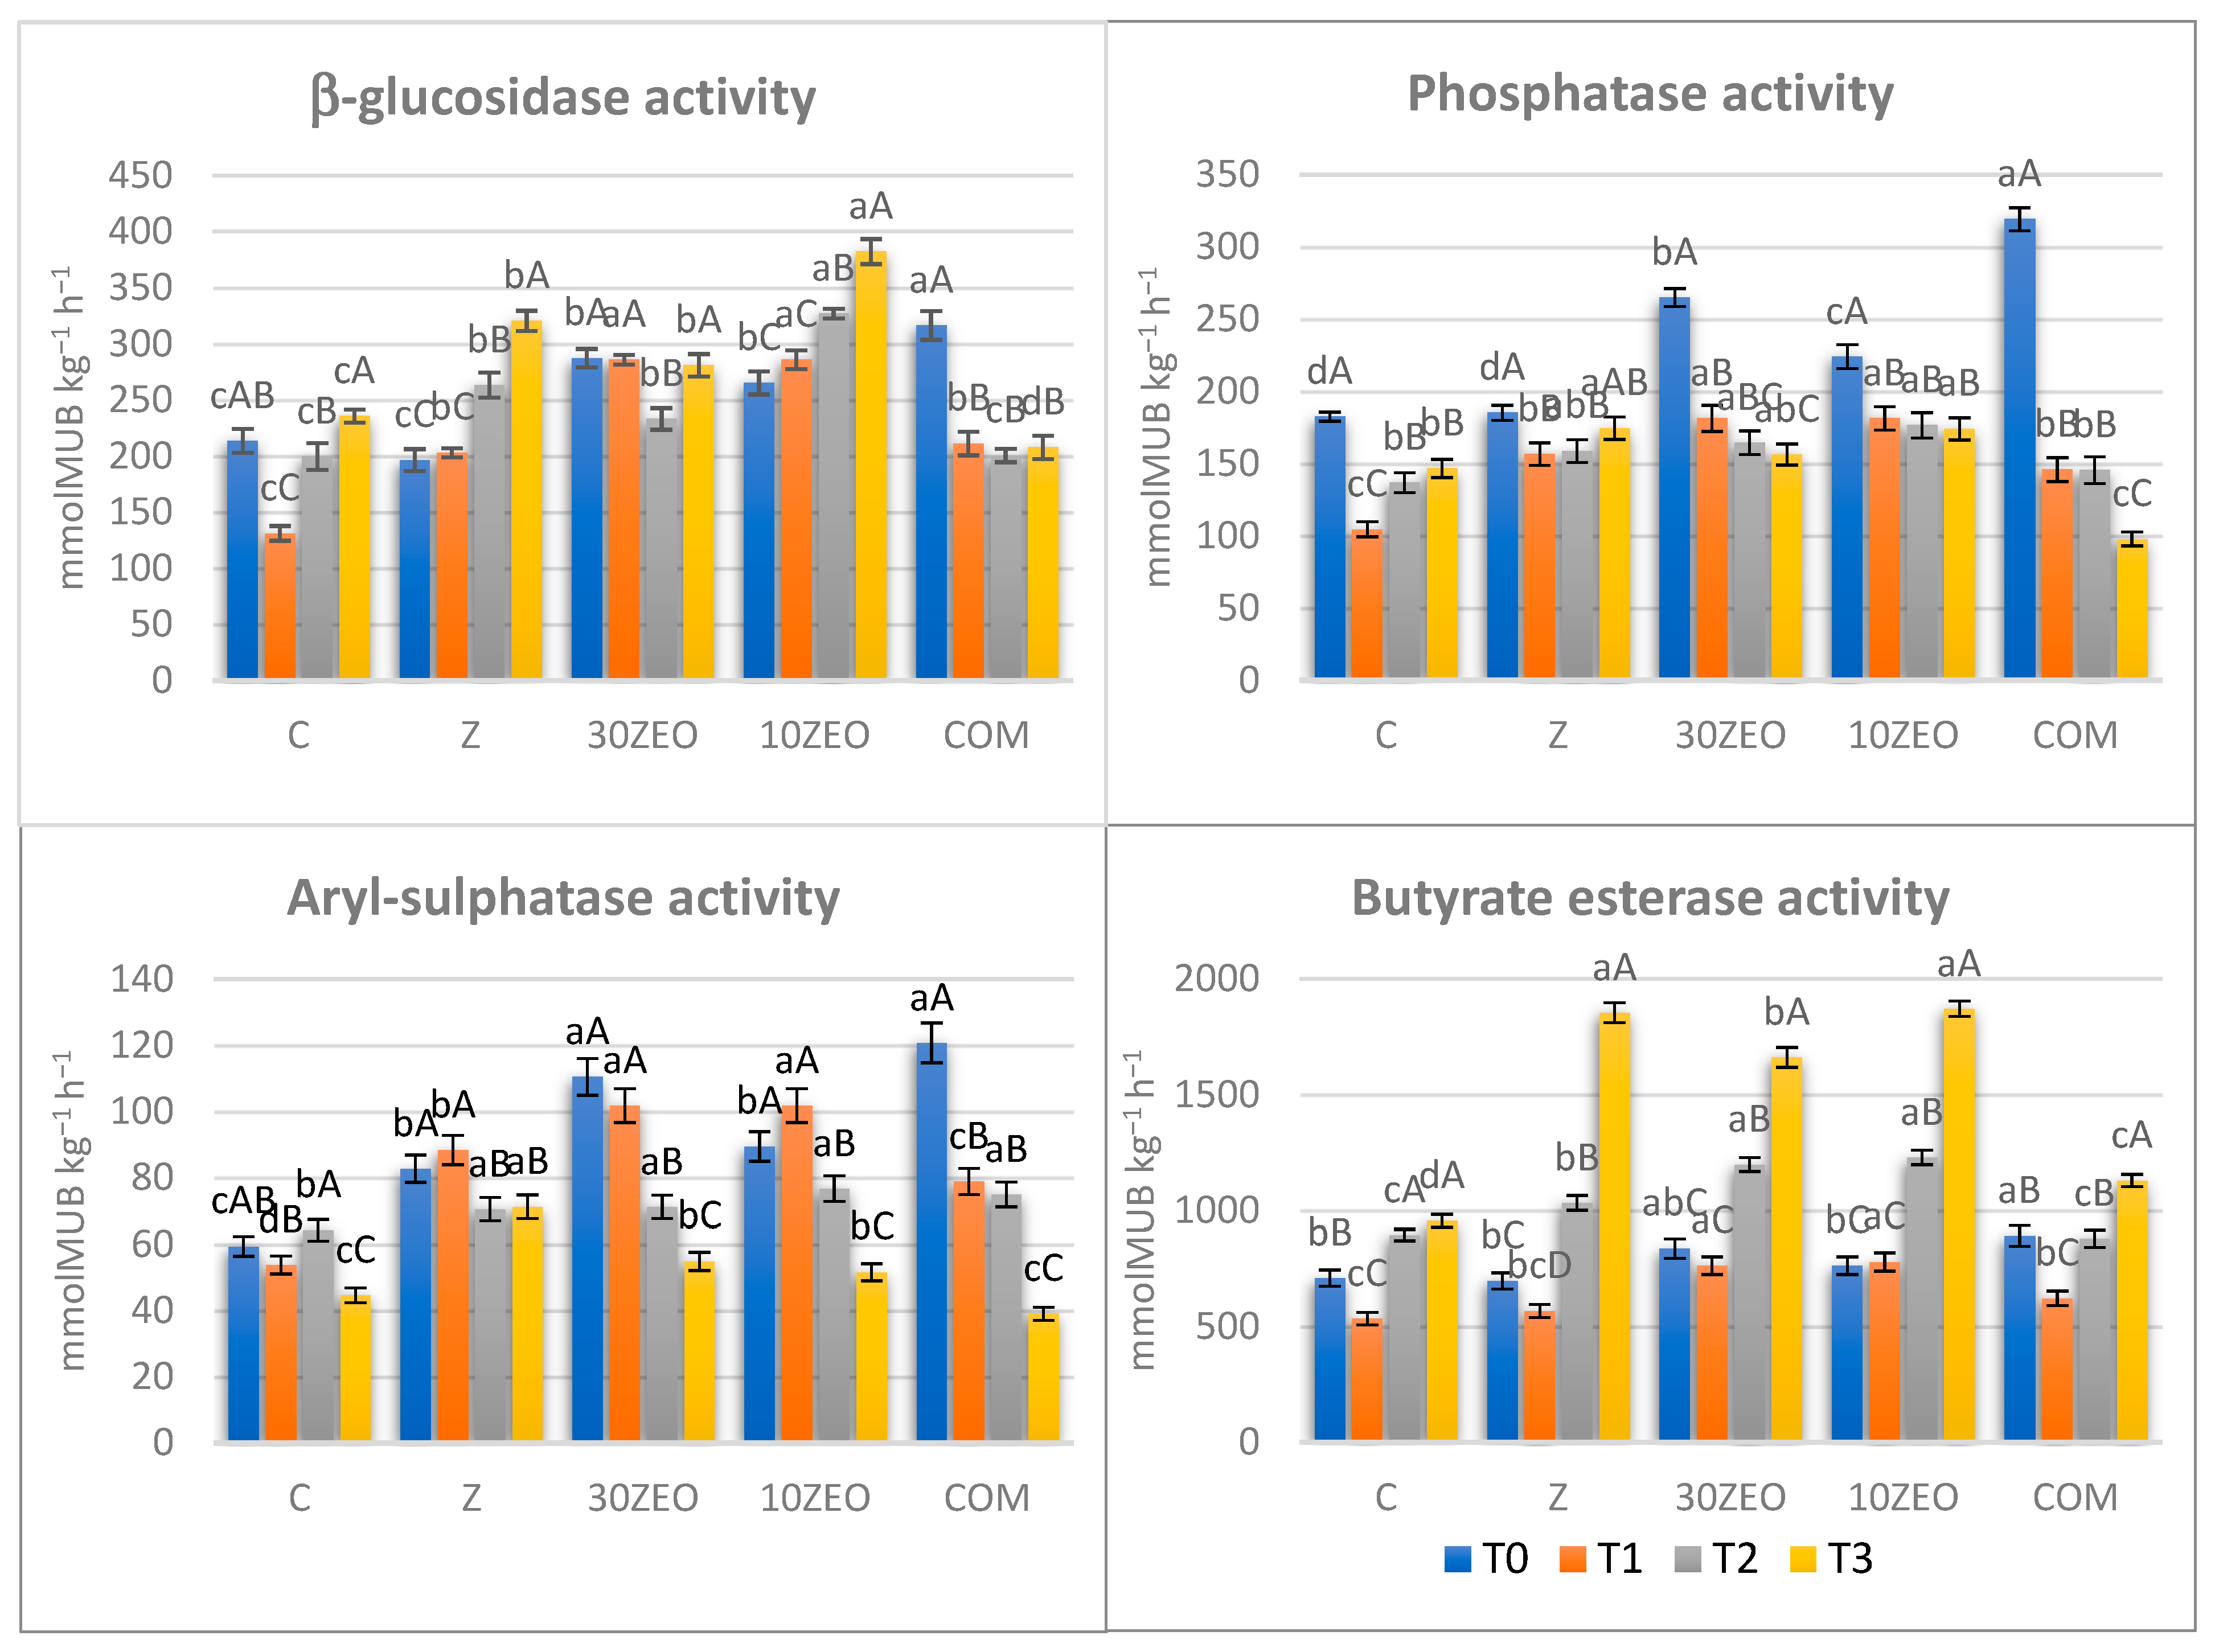
3.2. Biochemical Parameters

Butyrate esterase and hydrolytic soil enzyme activities were determined at each sampling time (Figure 5).
10 ZEO, 30 ZEO, and Z treatments resulted in higher values of butyrate esterase activity (BE) at harvest time in the second year (T3). These treatments increased this activity by 74%, 96% and 94%, respectively, compared to the C soil. At the same sampling time, this activity increased by about 20% in the COM treatment.
The treatments influenced the activity of b-glucosidase (Glu). At the initial sampling time (T0), we observed a higher Glu activity in the COM treatment than in the other treatments (an increase of 48% compared to the C soil). In comparison, this treatment showed a lower activity in the second year of the study (T3) (11% lower than the C soil).
A similar trend was also shown by phosphatase (Pho) and aryl-sulphatase (AS) activities, which, at T3, were lower in the COM treatment than in the C soil (reductions of 33 and 13%, respectively). Both Pho and AS showed a decreasing trend in all treatments. However, higher values regarding the C soil were observed at each sampling time in all zeolite-based treatments (10 ZEO, 30 ZEO, and Z), especially in the Z treatment (increase of 18% Pho and 58% AS compared to the C soil).

3.3. Physical Parameters

The soil available water (AW) values were about 13.5% in the C soil at each sampling time (Table 4). With the ZEO treatments, both 10 ZEO and 30 ZEO, an increase in AW of about 1% was measured at the different sampling times (T0, T1, T2, and T3).
A greater wet aggregate stability (WAS) was noticed in ZEO with respect to the C and COM soils. In general, the 10 ZEO and 30 ZEO had intermediate values. All treatment effects were maintained over time (Table 4).

4. Discussion

The rise in electrical conductivity (EC) after the COM treatment is of concern because it can cause adverse effects on vine performance and grape composition [28]. However, Vitis vinifera L. (cv. Cabernet Sauvignon) is a crop considered moderately sensitive to salt [29], with a soil saturation extract threshold of EC at 25 °C of 2.6 dS m–1 for Vitis vinifera L. (cv. Sultana) [30].
However, the drop in EC observed in the ZEO and Z treatments has already been reported in a composting process using 5% and 10% zeolite [31] and in a study on the effects of soil additives, such as zeolites, on soil properties [32,33]. The high Cation Exchange Capacity (CEC) and molecular sieve structure of zeolite can enable ions to be exchanged within the environment, thereby lowering the EC of the soil [33].
Similarly, TOC showed different behavior in the ZEO and COM treatments, with an increase over time in ZEO and an increase immediately after treatment, followed by a decrease in COM. This trend indicates a priming effect on short-term SOC mineralization in the COM treatment, which modifies the microbial breakdown of SOC in response to carbon inputs.
Our study agrees with the results of previous studies where the compost treatment greatly stimulated bacteria to degrade organic carbon from the compost [34], and this is regarded as an essential part of the global carbon cycle, which may have a negative impact on the ability of soils to sequester carbon [35,36]. However, the soil can retain the added carbon in ZEO treatments, making zeolite a suitable material for carbon capture. It is reported that the interaction between minerals and organic matter can determine the preservation of organic carbon by limiting decomposer organisms from accessing organic materials [37,38]. In our specific case, composted organic matter can be protected by zeolite and can last longer in forms resistant to degradation (humic acids, for example). It is commonly known that the substantial specific surface area and CEC of zeolites enables them to absorb more organic carbon and have a high stabilizing capability [33,39,40]. According to our findings, adding natural zeolite to the soil in combination with organic matter, such as plant leftovers, enhanced carbon sequestration by increasing the soil’s organic carbon content [41,42].
An assessment of the impact of the various treatments on the humification and mineralization processes of SOM were obtained by measuring the concentrations of total humus and its humic (HAs) and fulvic (FAs) acid fractions. A decrease in total humus was observed in the C, Z, and COM treatments over time, and in these treatments the content of FAs was generally higher than HAs, indicating a low humification rate [43].
In accordance with our results, a short-term study conducted in pots with poor sandy soil amended with zeolite and planted with Lolium multiflorum also discovered a decrease in humic compounds [44]. This drop was attributed to the ability of zeolite to improve the microbiological soil conditions by increasing nutrient and water retention, which altered the delicate balance between C sequestration and decomposition in soil. In addition, several studies have indicated that SOM turnover is either lowered in nutrient-deficient soils or increased after adding mineral fertilizers [45,46]. These considerations implied that while the ZEO treatments promoted the establishment of humification processes, as seen by the more pronounced increase in Has compared to FAs and the increase in total humus, the COM treatment might accelerate the microbial mineralization of TOC.
An upward trend in total N accompanied the increase in TOC and humic compounds in the ZEO-treated soils. In the COM treatment, ammonium is released during the mineralization of organic materials and is quickly transformed into nitrate, which is readily leached [47]. However, in ZEO treatments, there may be a significant amount of nitrogen from the added organic matter captured as ammonium by the zeolite [48]. Similarly, in the Z treatment, the increase in total N can be explained by the fact that the inorganic N can be released from soil organic N pools through physical and chemical interactions within the soil matrix and captured by zeolite up until plant absorption [49].
Zeolites have massive canals that can absorb cations like ammonium, but bacteria, especially nitrifying bacteria, cannot enter the zeolite canals [50]. As a result, ammonium, present in organic fertilisers or soil, can be selectively absorbed into zeolite, becoming unavailable to nitrify bacteria present in well-aerated sandy soils [8]. Additionally, ZEO treatments appear to prevent the volatilization of nitrogen (N) from soil because the zeolite absorbs N before releasing it. In this way, zeolite-based compost fertiliser can function as a slow-release fertiliser to provide N to the vine progressively.
Similarly, retention of other nutrients, such as P and K, could be equally crucial for the next season’s plant growth. The Z and ZEO treatments showed a statistically significant increase in total K and a decrease in available K in comparison to the C and COM treatments. The adsorption of this cation is typical of clinoptilolite [51], the main component of the zeolite used in this study.
The trend of total P was comparable to that of total K. It may be attributable to the high nonspecific sorption of P, such as the electrostatic attraction of the negatively charged phosphate ions to the co-adsorbed cations (Na+, Ca2+, K+, and Mg2+) on natural zeolite [52]. Even if this process can be pH-dependent (the higher the pH, the lower the retention), a favorable electrostatic attraction mechanism in the P sorption by zeolite has been also proposed in the pH range 3–10 [53] and in the range of pH 4–8 [54]. However, other authors reported that electrostatic forces are high in acidic conditions when the binding sites are protonated, while a typical adsorption reaction that proceeds chemical interaction involving ligand exchange dominates at an alkaline pH [55].
In agreement with our results, although negative charges make PO43− adsorption onto zeolite mineral lattices unfavorable, an increase in soil P content with increasing zeolite doses has previously been described [56,57,58]. Zeolites can also interact with phosphate ions through the filter effect of their three-dimensional structure. Clinoptilolite, the zeolite we used, shows a three-dimensional structure with the dimension of pores and channels compatible with many ionic substances.
All the treatments with organic matter and zeolite significantly increased the soil CEC. According to several studies, zeolite plays a pivotal role in improving the soil’s physical structure. Further, through the modification of CEC, it can decrease nitrogen leaching, increase water retention capacity, and extend the persistence of nutrients in the root zone [59,60].
The beneficial effect of both ZEO treatments in improving the physical properties of vineyard soils was mainly due to the synergic effect of zeolite and organic matter. On the one hand, it is recognised that zeolite can reduce bulk density and enhance overall porosity, increasing soil’s available water content [61]. On the other hand, the general positive effect of organic matter application in improving soil physical properties is recognized [62]. Notably, the improvement of physical properties in ZEO treatments is maintained during this time.
Improving the chemical–physical soil properties in zeolite-treated soils influenced the microbial biomass activity. From the perspective of soil quality, the change in microbial activity in soil is relevant since it carries out many critical functions in the soil ecosystem [63]. Microorganisms are fundamental in biogeochemical cycles and are essential to soil functions, such as soil organic matter decomposition and nutrient cycling, and, thus, provide crucial ecosystem services.
Butyrate esterase activity (BE), which has been used to evaluate overall soil microbial activity [64], increased in all treatments, especially in the presence of zeolite (10 ZEO, 30 ZEO, and Z), with respect to the C soil. This was due to the microbial biomass incorporated into the added compost and the positive influence of zeolite in improving the microenvironment for soil microbial activity. In addition, due to its porous structure, zeolite can provide physical protection and stabilize soil enzymes [65]. As expected, the COM treatment also enhanced the microbiological and biochemical soil conditions since the amount and activity of the soil microbial biomass are directly correlated with the C input [66,67]. The higher C content in the compost treatments (10 ZEO, 30 ZEO, and COM) increased microbial growth, which stimulated the utilization and assimilation of nutrients (i.e., N and P) via enzyme production [68]. The ability of soils to hydrolyse low molecular weight carbohydrates, represented by the β-glucosidase enzyme [69]; organic P compounds, represented by the phosphatase enzyme [70]; and organic S compounds, represented by the aryl-sulphatase activity [71], was monitored. These soil hydrolytic enzyme activities increased in all the treatments at T0 sampling time in comparison with the control soil. However, the rise in enzymatic activities, especially in COM treatment, did not persist over time. At T2, they diminished, most likely due to the reduction in their substrates probably following mineralization or humification processes of the organic substances contributed by the compost [72].

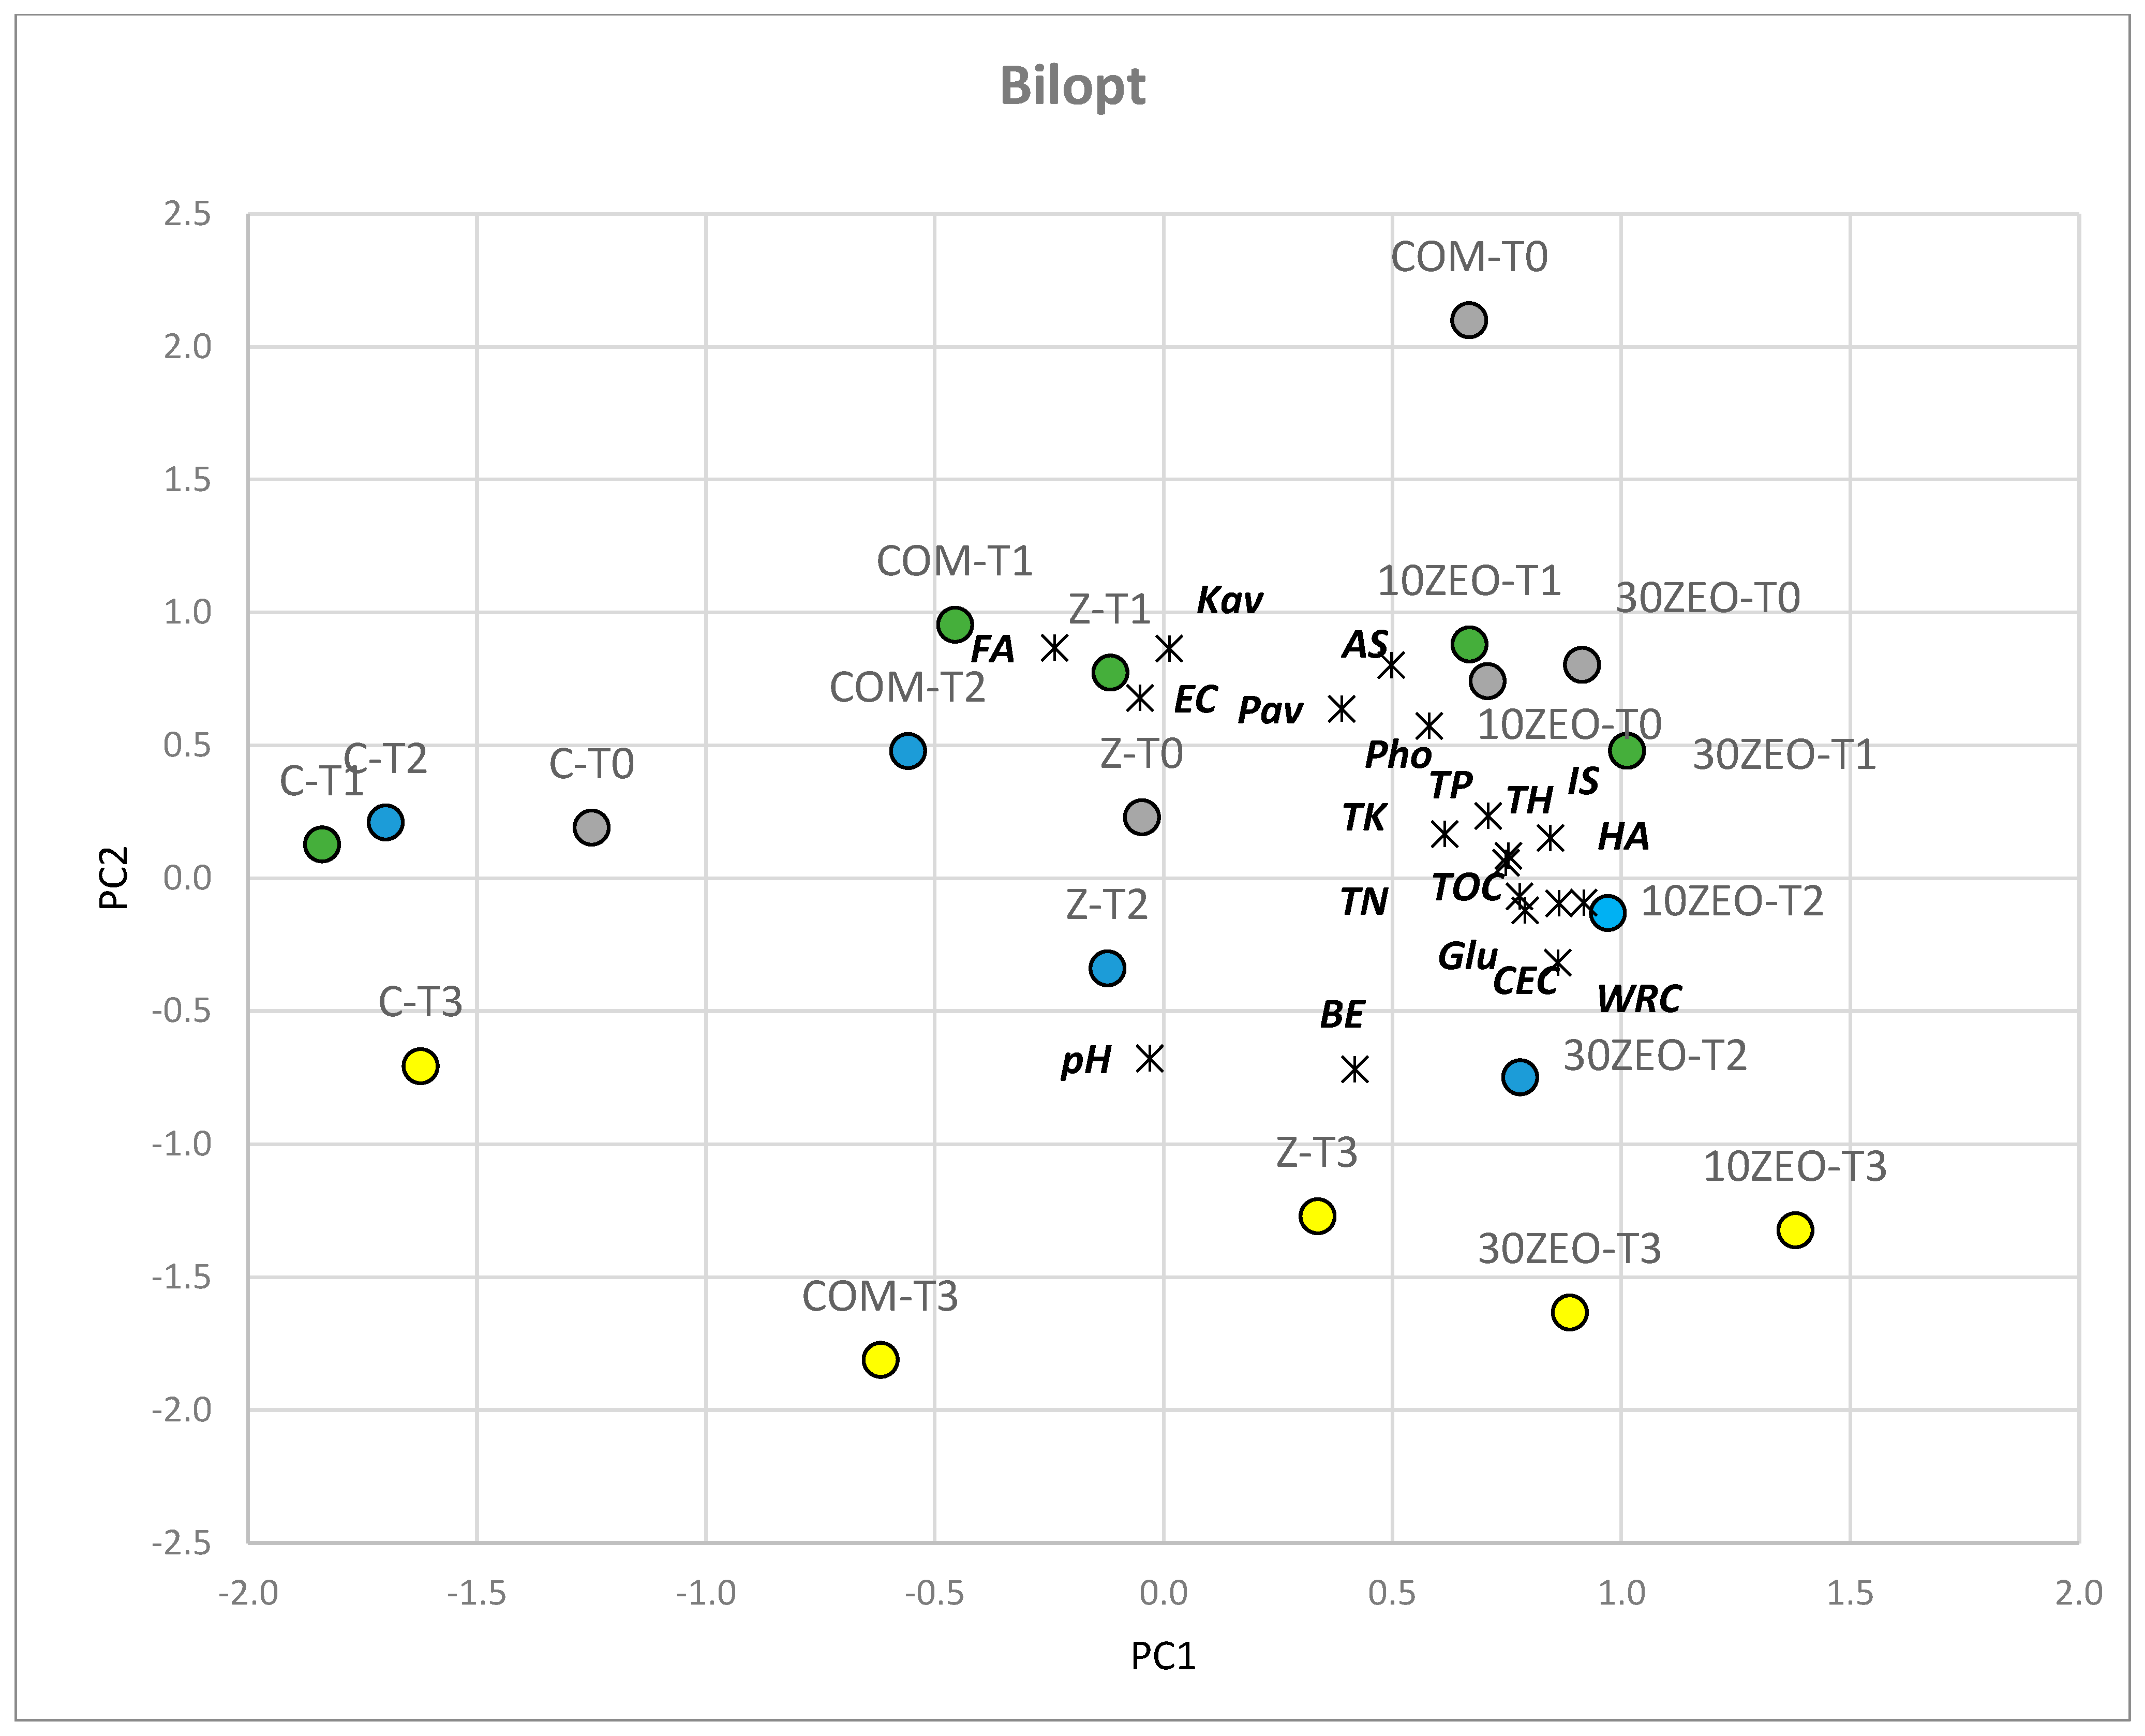
Principal Component Analysis (PCA)

The relationships between soil treatments, sampling times, and chemical–physical and biochemical soil properties were investigated using PCA analysis (Figure 6, Table 5). Two principal components were extracted. The PCs were rotated using the varimax approach, reducing the dataset dimension to two components; these explain 65.66% of the data variation, with PC1 explaining 40.57% and PC2 explaining 25.07% of the total variance. The indicators with factor loadings greater than 0.6 are CEC, TOC, TN, TP, TK TH, HA, GLU, WAS, and AW in PC1 and EC, pH, Kav, Pav, FA, BE, and AS in PC 2.
At each sampling time, ZEO-treated soils showed a shift towards positive values of the PC1 to the control soil. This principal component separated the ZEO treatments (positive values of PC1) from the COM and C treatments (negative values of PC1). This pattern indicates that there is a strong correlation between the ZEO treatments, in particular 10 ZEO, and the trend of the carbon biogeochemical cycle towards humification. This is shown by the positive correlation between the organic carbon content (TOC), even in the stabile form (HAs), and the C-linked activity (GLU) on the PC1. The positive correlation between soil water retention capacity (WRC) and Glu on this PC also confirmed the dominant role of soil moisture in biological functions [73]. This pattern additionally highlighted how the treatments, especially ZEO, can retain nutrients N, P, and K by raising CEC (parameters with significant positive factor loadings on the PC1).
The second PC (PC2) separated the sampling time of each treatment. For each soil sampling treatment, the initial time (T0) is shifted towards positive values of the PC2 with respect to the final time (T3). The T0 and T3 of the COM treatment are more distant on this PC, indicating the lower capacity of this treatment in modifying the chemical–physical properties of the treated soils.

5. Conclusions

The grapevine is one of the most economically valuable crops in the world, and viticulture is moving towards more environmentally friendly production methods.
In this study, we assessed the impact of different organic soil amendments on selected soil physical–chemical and biochemical properties of the Sangiovese cultivar (Vitis vinifera L.). The results reported here offer new information regarding the impact of a new zeolite-based compost amendment on soil health in a perennial crop, such as vine. The research demonstrated that this new compost, especially at the lower concentration of zeolite 10 ZEO, could effectively be used to improve available water content, nutrient retention, carbon sequestration, and biological activity.
Comparing zeolite-based compost (ZEO treatments) with commercial compost (COM treatment), the higher mineralization rate in COM could lead to excess N in the soil. On the one hand, the increased N availability can stimulate plant growth, a positive feature for building vine structure; on the other hand, it can reduce the yield and quality of the grapes. Similarly, the higher total and lower available nutrients in ZEO-treated soils imply that phosphorus and potassium are released slowly over time, contributing to sustaining plant vigor.
In particular, 10 ZEO is the amendment that better combines an improvement in soil biochemical properties with gradual and constant nutrient availability, thus satisfying soil and plant needs without exceeding nutrient availability.
Based on these preliminary results, a positive long-term effect of ZEO treatments on improving vineyard soil quality and fertility should be expected. In addition, this management system, based on recycling a by-product of the wine supply chain, enables the closure of the production cycle of waste material in agricultural environments.

Author Contributions

Conceptualization, S.D.; methodology, E.P.; validation, S.D., E.P. and C.M.; formal analysis, S.D., F.V. and D.M.; investigation, S.D., D.M., E.C. and M.G.; resources, G.M., G.B.M. and M.G.; data curation, S.D., D.M., E.C., F.V., C.M. and M.G.; writing—original draft preparation, S.D. and E.P.; writing—review and editing S.D., C.M., F.V. and E.P.; visualization E.P.; supervision, S.D.; project administration, S.D., G.M. and G.B.M.; funding acquisition, G.M. All authors have read and agreed to the published version of the manuscript.

Funding

The study was carried out within the framework of the LIFE EU project LIFE ZeoWine LIFE17 ENV/IT/000427 “ZEOlite and WINEry waste as an innovative product for wine production”. The LIFE ZeoWine Project is co-funded with the contribution of the European Commission, under the LIFE Programme—Environment & Resources efficiency—Grant Agreement n. LIFE17 ENV/IT/000427.

Data Availability Statement

The raw data supporting the conclusions of this article will be made available by the authors on request.

Acknowledgments

The authors gratefully acknowledge the technical assistance of Irene Rosellini and Manuele Scatena for sample collection, preparation, and analyses.

Conflicts of Interest

The authors declare no conflicts of interest. The funders had no role in the design of the study; in the collection, analyses, or interpretation of data; in the writing of the manuscript; or in the decision to publish the results.

References

  1. Toreti, A.; Bavera, D.; Acosta Navarro, J.; Cammalleri, C.; de Jager, A.; Di Ciollo, C.; Hrast Essenfelder, A.; Maetens, W.; Magni, D.; Masante, D.; et al. Drought in Europe August 2022; Publications Office of the European Union: Luxembourg, 2022. [Google Scholar] [CrossRef]
  2. Salomé, C.; Coll, P.; Lardo, E.; Metay, A.; Villenave, C.; Marsden, C.; Blanchart, E.; Hinsinger, P.; Le Cadre, E. The soil quality concept as a framework to assess management practices in vulnerable agroecosystems: A case study in Mediterranean vineyards. Ecol. Indic. 2016, 61, 456–465. [Google Scholar] [CrossRef]
  3. Verheijen, F.G.A.; Jones, R.J.A.; Rickson, R.J.; Smith, C.J. Tolerable versus actual soil erosion rates in. Europe Earth Sci. Rev. 2009, 94, 23–38. [Google Scholar] [CrossRef]
  4. Marinari, S.; Masciandaro, G.; Ceccanti, B.; Grego, S. Influence of organic and mineral fertilisers on soil biological and physical properties. Bioresour. Technol. 2000, 72, 9–17. [Google Scholar] [CrossRef]
  5. Liu, X.; Liu, J.; Xing, B.; Herbert, S.J.; Meng, K.; Han, X.; Zhang, X. Effects of Long-Term Continuous Cropping, Tillage, and Fertilization on Soil Organic Carbon and Nitrogen of Black Soils in China. Commun. Soil Sci. Plant Anal. 2005, 36, 1229–1239. [Google Scholar] [CrossRef]
  6. Biddoccu, M.; Zecca, O.; Audisio, C.; Godone, F.; Barmaz, A.; Cavallo, E. Assessment of long-term soil erosion in a mountain vineyard, Aosta Valley (NW Italy). Land Degrad. Dev. 2018, 29, 617–629. [Google Scholar] [CrossRef]
  7. Kabasiita, J.K.; Opolot, E.; Malinga, G.M. Quality and Fertility Assessments of Municipal Solid Waste Compost Produced from Cleaner Development Mechanism Compost Projects: A Case Study from Uganda. Agriculture 2022, 12, 582. [Google Scholar] [CrossRef]
  8. OIV State of the World Vine and Wine Sector 2021. 2022. Available online: https://www.oiv.int/public/medias/8778/eng-state-of-the-world-vine-and-wine-sector-april-2022-v6.pdf (accessed on 3 June 2022).
  9. Chowdhary, P.; Gupta, A.; Gnansounou, E.; Pandey, A.; Chatuverdi, P. Current trends and possibilities for explotation of grape pomace as a potential source for value addition. Environ. Pollut. 2021, 278, 116796. [Google Scholar] [CrossRef]
  10. Garcia-Perez, J.V.; Blasco, M.; Carcel, J.A.; Clemente, G.; Mulet, A. Drying Kinetics of Grape Stalk. In Defect and Diffusion Forum; Trans Tech Publications Ltd.: Baech, Switzerland, 2006; Volume 258–260, pp. 225–230. [Google Scholar]
  11. Zhou, G.; Qiu, X.; Chen, L.; Zhang, C.; Ma, D.; Zhang, J. Succession of organics metabolic function of bacterial community in response to addition of earthworm casts and zeolite in maize straw composting. Bioresour. Technol. 2019, 280, 229–239. [Google Scholar] [CrossRef]
  12. Gholamhoseini, M.; Aghaalikhani, M.; Dolatabadian, A.; Joghan, A.K.; Zakikhani, H. Decreasing N leaching and increasing canola forage yield in a sandy soil by application of natural zeolite. Agron. J. 2012, 104, 1467–1475. [Google Scholar] [CrossRef]
  13. Soudejani, H.T.; Kazemian, H.; Inglezakis, V.J.; Zorpas, A.A. Application of zeolites in organic waste composting: A review. Biocatal. Agric. Biotechnol. 2019, 22, 101396. [Google Scholar] [CrossRef]
  14. Manu, M.K.; Wang, C.; Li, D.; Varjani, S.; Wong, J.W.C. Impact of zeolite amendment on composting of food waste digestate. J. Clean. Prod. 2022, 371, 133408. [Google Scholar] [CrossRef]
  15. Joghan, A.K.; Ghalavand, A.; Aghaalikhani, M.; Gholamhoseini, M.; Dolatabadian, A. Comparison among different integrated nutrition management for soil micro and macro elements after winter Wheat harvesting and yield. Not. Sci. Biol. 2010, 2, 107–111. [Google Scholar] [CrossRef]
  16. Gholamhoseini, M.; Ghalavand, A.; Khodaei-Joghan, A.; Dolatabadian, A.; Zakikhani, H.; Farmanbar, E. Zeolite-amended cattle manure effects on sunflower yield, seed quality, water use efficiency and nutrient leaching. Soil Tillage Res. 2013, 126, 193–202. [Google Scholar] [CrossRef]
  17. Mardini, B.; Shibusawa, S.; Kojima, Y.; Hosaka, S. Effect of natural zeolite (clinoptilolite) on ammonia emissions of leftover food- rice hulls composting at the initial stage of the thermophilic process. J. Agric. Meteorol. 2016, 72, 12–19. [Google Scholar] [CrossRef]
  18. Campisi, T.; Abbondanzi, F.; Faccini, B.; Di Giuseppe, D.; Malferrari, D.; Coltorti, M.; Laurora, A.; Passaglia, E. Ammonium-charged zeolitite effects on crop growth and nutrient leaching: Greenhouse experiments on maize (Zea mays). Catena 2016, 140, 66–76. [Google Scholar] [CrossRef]
  19. Doni, S.; Peruzzi, E.; Manzi, D.; Masini, C.M.; Mattii, G.B.; Macci, C.; Masciandaro, G. Co-composting winery waste and zeolite: A sustainable valorisation example. J. Mater. Cycles Waste Manag. 2023. [Google Scholar] [CrossRef]
  20. Soil Survey Staff. Keys to Soil Taxonomy, 12th ed.; Natural Resources Conservation Service, United States Department of Agriculture: Washington, DC, USA, 2014.
  21. Olsen, S.R.; Sommers, L.E. Phosphorus. In Methods of Soil Analysis: Part 2. Chemical and Microbiological Properties, 2nd ed.; Page, A.L., Ed.; ASA and SSSA: Madison, WI, USA, 1982; pp. 403–430. [Google Scholar]
  22. Helmke, P.A.; Sparks, D.L. Lithium, sodium, potassium, rubidium, and cesium. Methods Soil Anal. Part 3 Chem. Methods 1996, 5, 551–574. [Google Scholar]
  23. Jakubus, M.; Spychasky, W. Evaluation of agricultural value of composts prepared from municipal biowastes in different conditions of composting process. Agronomy 2022, 12, 1438. [Google Scholar] [CrossRef]
  24. Sumner, M.E.; Miller, W.P. Cation exchange capacity, and exchange coefficients. In Methods of Soil Analysis. Part 2: Chemical Properties, 3rd ed.; Sparks, D.L., Ed.; ASA, SSSA, CSSA: Madison, WI, USA, 1996. [Google Scholar]
  25. Marx, M.C.; Wood, M.; Jarvis, S.C. A microplate fluorimetric assay for the study of enzyme diversity in soils. Soil Biol. Biochem. 2001, 33, 1633–1640. [Google Scholar] [CrossRef]
  26. Vepsäläinen, M.; Kukkonen, S.; Vestberg, M.; Sirviö, H.; Niemi, R.M. Application of soil enzyme activity test kit in a field experiment. Soil Biol. Biochem. 2001, 33, 1665–1672. [Google Scholar] [CrossRef]
  27. Richards, L.A. Diagnosis and Improvement of Saline and Alkali Soil; Handbook 60; US Salinity Lab. Staff, US Department of Agriculture, Agricultural Research Service: Washington DC, USA, 1954; 160p.
  28. Ollat, N.; Peccoux, A.; Papura, D.; Esmenjaud, D.; Marguerit, E.; Tandonnet, J.P.; Bordenave, L.; Cookson, S.J.; Barrieu, F.; Rossdeutsch, L.; et al. Rootstocks as a component of adaptation to environment. In Grapevine in a Changing Environment: A Molecular and Ecophysiological Perspective Eds Gers; John Wiley & Sons: Hoboken, NJ, USA, 2016; pp. 68–108. [Google Scholar] [CrossRef]
  29. Cramer, G.R.; Ergül, A.; Grimplet, J.; Tillett, R.L.; Tattersall, E.A.R.; Bohlman, M.C.; Vincent, D.; Sonderegger, J.; Evans, J.; Osborne, C.; et al. Water and salinity stress in grapevines: Early and late changes in transcript and metabolite profiles. Funct. Integr. Genom. 2007, 7, 111–134. [Google Scholar] [CrossRef]
  30. Walker, R.R.; Blackmore, D.H.; Clingeleffer, P.R.; Correll, R.L. Rootstock effects on salt tolerance of irrigated field-grown grapevines (Vitis vinifera L cv Sultana): 1 yield vigour inter-relationships. Aust. J. Grape Wine Res. 2002, 8, 3–14. [Google Scholar] [CrossRef]
  31. Chan, M.T.; Selvam, A.; Wong, J.W.C. Reducing nitrogen loss and salinity during “struvite” food waste composting by zeolite amendment. Bioresour. Technol. 2016, 200, 838–844. [Google Scholar] [CrossRef]
  32. Yousefian, M.; Jafari, M.; Tavili, A.; Arzani, H.; Jafarian, Z. The effects of superabsorbent polymer on Atriplex lentiformis growth and soil characteristics under drought stress (case study: Desert research Station, Semnan, Iran). J. Rangel Sci. 2018, 8, 65–75. [Google Scholar]
  33. Doni, S.; Gispert, M.; Peruzzi, E.; Macci, C.; Mattii, G.B.; Manzi, D.; Masini, C.M.; Masciandaro, G. Impact of natural zeolite on chemical and biochemical properties of vineyard soils. Soil Use Manag. 2020, 37, 832–842. [Google Scholar] [CrossRef]
  34. Bastida, F.; Torres, I.F.; Hernandez, T.; García, C. The impacts of organic amendments: Do they confer stability against drought on the soil microbial community? Soil Biol. Biochem. 2017, 113, 173–183. [Google Scholar] [CrossRef]
  35. Bastida, F.; García, C.; Fierer, N.; Eldridge, D.J.; Bowker, M.A.; Abades, S.; Alfaro, F.D.; Asefaw Berhe, A.; Cutler, N.A.; Gallardo, A.; et al. Global ecological predictors of the soil priming effect. Nat. Commun. 2019, 10, 3481. [Google Scholar] [CrossRef] [PubMed]
  36. Guenet, B.; Camino-Serrano, M.; Ciais, P.; Tifafi, M.; Maignan, F.; Soong, J.L.; Janssens, I.A. Impact of priming on global soil carbon stocks. Glob. Chang. Biol. 2018, 24, 1873–1883. [Google Scholar] [CrossRef] [PubMed]
  37. Georgiou, K.; Jackson, R.B.; Vindušková, O.; Abramoff, R.Z.; Ahlström, A.; Feng, W.; Harden, J.W.; Pellegrini, A.F.A.; Polley, H.W.; Soong, J.L.; et al. Global stocks and capacity of mineral-associated soil organic carbon. Nat. Commun. 2022, 13, 3797. [Google Scholar] [CrossRef] [PubMed]
  38. Islam, M.R.; Singh, B.; Dijkstra, F.A. Stabilisation of soil organic matter: Interactions between clay and microbes. Biogeochemistry 2022, 160, 145–158. [Google Scholar] [CrossRef]
  39. Kavvadias, V.; Ioannou, Z.; Vavoulidou, E.; Paschalidis, C. Short Term Effects of Chemical Fertilizer, Compost and Zeolite on Yield of Lettuce, Nutrient Composition and Soil Properties. Agriculture 2023, 13, 1022. [Google Scholar] [CrossRef]
  40. Brombin, V.; Salani, G.M.; De Feudis, M.; Mistri, E.; Precisvalle, N.; Bianchini, G. Soil Organic Carbon Depletion in Managed Temperate Forests: Two Case Studies from the Apennine Chain in the Emilia-Romagna Region (Northern Italy). Environments 2023, 10, 156. [Google Scholar] [CrossRef]
  41. Truc, M.T.; Yoshida, M. Effect of Zeolite on the Decomposition Resistance of Organic Matter in Tropical Soils under Global Warming. Int. J. Innov. Sci. Res. 2011, 5, 664–668. [Google Scholar]
  42. Aminiyan, M.M.; Safari Sinegani, A.A.; Sheklabadi, M. The effect of zeolite and some plant residues on soil organic carbon changes in density and soluble fractions: Incubation study. Eurasian J. Soil Sci. 2016, 5, 74. [Google Scholar] [CrossRef]
  43. Guimarães, D.V.; Gonzaga, M.I.; da Silva, T.O.; da Silva, T.L.; da Silva Dias, N.; Matias, M.I. Soil organic matter pools and carbon fractions in soil under different land uses. Soil Tillage Res. 2013, 126, 177–182. [Google Scholar] [CrossRef]
  44. Beqiraj, E.; Gjoka, F.; Muller, F.; Baillif, P. Use of zeolitic material from Munella Region (Albania) as fertilizer in the sandy soils of Divjaka Region (Albania). Carpth. J. Earth Environ. Sci. 2008, 3, 33–47. [Google Scholar]
  45. Allen, A.S.; Schlesinger, W.H. Nutrient limitations to soil microbial biomass and activity in loblolly pine forests. Soil Biol. Biochem. 2004, 36, 581–589. [Google Scholar] [CrossRef]
  46. Conde, E.; Cardenas, M.; Ponce-Mendoza, A.; Dendooven, L. The impacts of inorganic nitrogen application on mineralization of 14C-labelled maize and glucose, and on priming ef- fect in saline alkaline soil. Soil Biol. Biochem. 2005, 37, 681–691. [Google Scholar] [CrossRef]
  47. Baldi, E.; Polidori, G.; Germani, M.; Larocca, G.N.; Mazzon, M.; Allegro, G.; Pastore, C.; Quartieri, M.; Marzadori, C.; Filippetti, I.; et al. Fertilizer Potential of Organic-Based Soil Amendments on cv. Sangiovese (V. vinifera L.) Vines: Preliminary Results. Agronomy 2022, 12, 1604. [Google Scholar] [CrossRef]
  48. Cataldo, E.; Salvi, L.; Paoli, F.; Fucile, M.; Masciandaro, G.; Manzi, D.; Masini, C.M.; Mattii, G.B. Application of zeolites in agriculture and other potential uses: A review. Agronomy 2021, 11, 1547. [Google Scholar] [CrossRef]
  49. Sikora, J.L. Effect of compost-fertilizer blends on crop growth. In The Science of Composting; Bertoldi, M., Sequi, P., Lammers, B., Papi, T., Eds.; Blackie Academic & Professional Publications: Glasgow, UK, 1995; pp. 423–430. [Google Scholar]
  50. Baerlocher, C.H.; Meier, W.M.; Olson, D.H. Atlas of Zeolite Framework Types, 5th ed.; Published on behalf of the Structure Commission of the International Zeolite Association by Elsevier: Amsterdam, The Netherlands, 2001; p. 299. [Google Scholar]
  51. Hedström, A. Ion exchange of ammonium in zeolites: A literature review. J. Environ. Eng. 2001, 127, 673–681. [Google Scholar] [CrossRef]
  52. Loganathan, P.; Vigneswaran, S.; Kandasamy, J.; Bolan, N.S. Removal and re-recovery of phosphate from water using sorption. Crit. Rev. Environ. Sci. Technol. 2014, 44, 847–907. [Google Scholar] [CrossRef]
  53. Chen, K.; Zhao, K.; Zhang, H.; Sun, Q.; Wu, Z.; Zhou, Y.; Zhong, Y.; Ke, F. Phosphorus removal from aqueous solutions using a synthesized adsorbent prepared from mineralized refuse and sewage sludge. Environ. Technol. 2013, 34, 1489–1496. [Google Scholar] [CrossRef] [PubMed]
  54. Meng, S.; Li, Y.; Zhang, T.; Chen, J.; Xu, P.; Song, C.; Fan, L.; Qiu, L. Influences of environmental factors on lanthanum/aluminum-modified zeolite adsorbent (La/Al-ZA) for phosphorus adsorption from wastewater. Water Air Soil Pollut. 2013, 224, 1556. [Google Scholar] [CrossRef]
  55. Onyango, M.S.; Kuchar, D.; Kubota, M.; Matsuda, H. Adsorptive removal of phosphate ions from aqueous solution using synthetic zeolite. Ind. Eng. Chem. Res. 2007, 46, 894–900. [Google Scholar] [CrossRef]
  56. Ozbahce, A.; Tari, A.F.; Gonulal, E.; Simsekli, N. Zeolite for enhancing yield and quality of potatoes cultivated under water-deficit conditions. Potato Res. 2018, 61, 247–259. [Google Scholar] [CrossRef]
  57. Ramesh, K.; Biswas, A.K.; Somasundaram, J.; Rao, A.S. Nanoporous zeolites in farming: Current status and issues ahead. Curr. Sci. 2010, 99, 760–765. [Google Scholar]
  58. Stylianou, M.A.; Inglezakis, V.J.; Loizidou, M.D. Effects of Zeolite Addition on Soil Chemistry-Open Field Experiments. In Proceedings of the Protection and Restoration of The Environment VII, Mykonos, Greece, 28 June–1 July 2004; pp. 1–7. [Google Scholar]
  59. Hazrati, S.; Tahmasebi-Sarvestani, Z.; Modarres-sanavy, S.A.M.; Mokhtassi-Bidgoli, A.; Mohammadi, H.; Nicola, S. Effects of zeolite water stress on growth: Yield chemical compositions of Aloe vera, L. Agric. Water Manag. 2017, 181, 66–72. [Google Scholar] [CrossRef]
  60. Ippolito, J.A.; Tarkalson, D.D.; Lehrsch, G.A. Zeolite Soil Application Method Affects Inorganic Nitrogen, Moisture, and Corn Growth. Soil Sci. 2011, 176, 136–142. [Google Scholar] [CrossRef]
  61. Nakhli, S.A.A.; Delkash, M.; Bakhshayesh, B.E.; Kazemian, H. Application of zeolites for sustainable agriculture: A review on water and nutrient retention. Water Air Soil Pollut. 2017, 228, 464. [Google Scholar] [CrossRef]
  62. Six, J.; Feller, C.; Denef, K.; Ogle, S.M.; de Morales, J.C.; Albrecht, A. Soil organic matter, biota and aggregation in temperate and tropical soils: Effects of no-tillage. Agronomie 2002, 22, 755–775. [Google Scholar] [CrossRef]
  63. Gil-Sotres, F.; Trasar-Cepeda, C.; Leirós, M.C.; Seoane, S. Different approaches to evaluating soil quality using biochemical properties. Soil Biol. Biochem. 2005, 37, 877–887. [Google Scholar] [CrossRef]
  64. Wittmann, C.; Kähkönen, M.A.; Ilvesniemi, H.; Kurola, J.; Salkinoja-Salonen, M.S. Areal activities and stratification of hydrolytic enzymes involved in the biochemical cycles of carbon, nitrogen, sulphur and phosphorus in podsolized boreal forest soils. Soil Boil. Biochem. 2004, 36, 425–433. [Google Scholar] [CrossRef]
  65. Yousefi, R.; Amooei, A.A.; Amel Sakhi, M.; Karimi, A. Experimental study on influence of using urease enzyme on stabilized sandy soil’s engineering property by zeolite and sawdust. Int. J. Marit. Technol. 2021, 15, 17–27. [Google Scholar]
  66. Peng, X.Q.; Wang, W. Stoichiometry of soil extracellular enzyme activity along a climatic transect in temperate grasslands of northern China. Soil Biol. Biochem. 2016, 98, 74–84. [Google Scholar] [CrossRef]
  67. Liu, E.; Zhou, J.; Yang, X.; Jin, T.; Zhao, B.; Li, L.; Wen, Y.; Soldatova, E.; Zamanian, K.; Gopalakrishnan, S.; et al. Long-term organic fertilizer-induced carbonate neoformation increases carbon sequestration in soil. Environ. Chem. Lett. 2023, 21, 663–671. [Google Scholar] [CrossRef]
  68. Zhou, J.; Wen, Y.; Shi, L.; Marshall, M.R.; Kuzyakov, Y.; Blagodatskaya, E.; Zang, H. Strong priming of soil organic matter induced by frequent input of labile carbon. Soil Biol. Biochem. 2021, 152, 108069. [Google Scholar] [CrossRef]
  69. Eivazi, F.; Tabatabai, M. Factors affecting glucosidase and galactosidase in soils. Soil Biol. Biochem. 1990, 22, 891–897. [Google Scholar] [CrossRef]
  70. Condron, L.M.; Turner, B.L.; Cade-Menun, B.J.; Sims, J.; Sharpley, A. Chemistry and dynamics of soil organic phosphorus. In Phosphorus: Agriculture and the Environment; John Wiley & Sons, Inc.: Hoboken, NJ, USA, 2005; pp. 87–121. [Google Scholar]
  71. Peng, Y.P.; He, W.X.; Wang, Z.Q.; Zhang, J.; Yan, H.R.; Gao, Y.J.; Cao, W.D. Soil chemical properties and enzyme activities in long-term green manure plot in Loess Plateau. J. Northwest AF Univ. (Nat. Sci. Ed.) 2015, 43, 131–138. (In Chinese) [Google Scholar]
  72. Delgado, M.; Rodríguez, C.; Martín, J.V.; Miralles de Imperial, R.; Alonso, F. Environmental assay on the effect of poultry manure application on soil organisms in agroecosystem. Sci. Total Environ. 2012, 416, 532–535. [Google Scholar] [CrossRef]
  73. Chen, H.; Luo, P.; Wen, L.; Yang, L.Q.; Wang, K.L.; Li, D.J. Determinants of soil extracellular enzyme activity in a karst region southwest China. Eur. J. Soil Biol. 2017, 80, 69–76. [Google Scholar] [CrossRef]
Figure 1. Location of the wine-growing area and experimental design of the treatments. C: control soil; Z: zeolite; 30 ZEO: 30% zeolite and 70% winery waste compost; 10 ZEO: 10% zeolite and 90% winery waste compost; COM: commercial compost.
Environments 11 00029 g001
Figure 2. The effect of treatments (C, Z, 10 ZEO, 30 ZEO, and COM) on the electrical conductivity of the vineyard soil immediately after treatment (T0) and after 6 months (T1), 18 months (T2), and 30 months (T3). Mean ± standard error. Lowercase letters indicate significantly different values at p < 0.05 between the treatments at each sampling time. Capital letters indicate significantly different values at p < 0.05 between the sampling times in the same treatment.
Environments 11 00029 g002
Figure 3. The effect of treatments (C, Z, 10 ZEO, 30 ZEO, and COM) on soil Total Organic Carbon (TOC) and total nitrogen (TN) of the vineyard soil immediately after treatment (T0) and after 6 months (T1), 18 months (T2), and 30 months (T3). Mean ± standard error. Lowercase letters indicate significantly different values at p < 0.05 between the treatments at each sampling time. Capital letters indicate significantly different values at p < 0.05 between the sampling times in the same treatment.
Environments 11 00029 g003
Figure 4. The effect of treatments (C, Z, 10 ZEO, 30 ZEO, and COM) on total humus, fulvic acids, and humic acids of the vineyard soil immediately after treatment (T0) and after 6 months (T1), 18 months (T2), and 30 months (T3). Mean ± standard error. Lowercase letters indicate significantly different values at p < 0.05 between the treatments at each sampling time. Capital letters indicate significantly different values at p < 0.05 between the sampling times in the same treatment.
Environments 11 00029 g004
Figure 5. The effect of treatments (C, Z, 10 ZEO, 30 ZEO, and COM) on soil enzyme activities of the vineyard soil immediately after treatment (T0) and after 6 months (T1), 18 months (T2), and 30 months (T3). Mean ± standard error. Lowercase letters indicate significantly different values at p < 0.05 between the treatments at each sampling time. Capital letters indicate significantly different values at p < 0.05 between the sampling times in the same treatment.
Environments 11 00029 g005
Figure 6. Biplot of factor scores and loadings in each treatment (C, Z, 30 ZEO, 10 ZEO, and COM) at T0 (grey), T1 (green), T2 (blue), and T3 (yellow) sampling times. CEC: Cation Exchange Capacity; EC: electrical conductivity; TOC: Total Organic Carbon; TN: total nitrogen; TP: total phosphorus; AP: available phosphorus; TK: total potassium; AK: available potassium; TH: total humus; FA: fulvic acids; HA: humic acids; Glu: b-glucosidase activity; Pho: phosphatase activity; BE: butyrate esterase activity; AS: aryl sulphatase activity; WAS: wet aggregate stability; AW: available water.
Environments 11 00029 g006
Table 1. Chemical characteristics of zeolite (Z treatment).
Zeolite-Clinoptilolite (Z)
SiO2 %68.3 ± 4.2
K2 O %2.8 ± 0.31
Na2 O %0.75 ± 0.07
Al2 O3 %12.3 ± 1.03
Fe2 O3 %1.3 ± 0.14
TiO2 %0.15 ± 0.03
CaO %3.9 ± 0.25
MgO %0.9 ± 0.05
Loss on ignition %12.5 ± 0.95
Ration Si/Al %5.1 ± 0.42
CEC cmolc kg−1130 ± 21
CEC: Cation Exchange Capacity.
Table 2. Chemical and biological characteristics of compost treatments (COM, 10 ZEO, and 30 ZEO treatments).
COM10 ZEO30 ZEOItalian Legislation 75/2010EU Legislation 1009/2019
pH 8.6 ± 0.058 ± 0.198.3 ± 0.166–8.8
ECdS m−11.8 ± 0.010.4 ± 0.010.2 ± 0.02
CECcmolc kg−141 ± 2.144 ± 1.546 ± 1.5
TOCC %33 ± 1.429 ± 0.626 ± 0.5≥20
TNTN%3.5 ± 0.061.55 ± 0.131.5 ± 0.08
C/N 9.418.717.3≤50
HCC%6.1 ± 0.0510.4 ± 0.0711.8 ± 0.08≥2.5
TK%0.75 ± 0.0050.8 ± 0.0121.19 ± 0.019
TP%0.13 ± 0.0030.17 ± 0.0040.14 ± 0.004
CumgCu kg−149 ± 457 ± 644 ± 3<230<300
SalmonellaMPN/25 gAbsentAbsentAbsentAbsentAbsent
E. coliCFU/g<1000<1000<1000<1000<1000
GI%115 ± 1.5126 ± 8.1142 ± 6.1>60%
EC: electrical conductivity; CEC: Cation Exchange Capacity; TOC: Total Organic Carbon; TN: total nitrogen; HC: humic carbon; TK: total potassium; TP: total phosphorus; GI: Germination Index.
Table 3. The effect of treatments (C, Z, 10 ZEO, 30 ZEO, and COM) on soil pH, Cation Exchange Capacity (CEC), total (TP and TK), and available (AP and AK) P and K of the vineyard soil immediately after treatments (T0), after six months (T1), 18 months (T2), and 30 months (T3).
pHCEC
cmolc kg−1
T0T1T2T3T0T1T2T3
C7.57 ± 0.37 aB7.65 ± 0.18 aB7.62 ± 0.02 aB7.86 ± 0.46 aA12.9 ± 0.97 cA12.3 ± 0.91 bA12.3 ± 0.92 cA13.4 ± 0.43 cA
Z7.70 ± 0.22 aAB7.60 ± 0.37 aB7.66 ± 0.25 aB7.82 ± 0.27 aA14.5 ± 0.70 bA15.2 ± 0.82 aA15.1 ± 1.13 bA15.0 ± 1.10 bA
10 ZEO7.57 ± 0.48 aB7.51 ± 0.48 aB7.68 ± 0.46 aAB7.89 ± 0.25 aA16.6 ± 0.72 aA16.6 ± 0.98 aA17.0 ± 1.27 aA18.0 ± 0.40 aA
30 ZEO7.66 ± 0.20 aA7.75 ± 0.48 aA7.77 ± 0.45 aA7.79 ± 0.26 aA15.0 ± 0.24 bA15.6 ± 1.13 aA15.7 ± 1.18 bA16.1 ± 1.30 abA
COM7.55 ± 0.20 aB7.71 ± 0.26 aAB7.66 ± 0.38 aB7.89 ± 0.34 aA17.0 ± 0.82 aA16.7 ± 1.27 aA16.1 ± 1.50 aA16.7 ± 1.40 aA
TP
mgP kg−1
TK
mgk kg−1
T0T1T2T3T0T1T2T3
C550 ± 27.5 bA485 ± 69.3 cA540 ± 25.6 bA540 ± 24.6 Ac5345 ± 45.4 bA5333 ± 244 cdA4152 ± 146 dB4307 ± 159 bB
Z532 ± 53.2 bAB502 ± 41.8 Bc522 ± 26.1 bB582 ± 29.1 bA5315 ± 243 bcB5940 ± 48.6 bA5339 ± 245 bB5343 ± 245 aB
10 ZEO626 ± 32.8 aB714 ± 44.6 aA653 ± 46.3 aAB628 ± 49.7 abAB6210 ± 318 aA6242 ± 153 aA6046 ± 91.3 aA5418 ± 226 aB
30 ZEO656 ± 29.9 aAB619 ± 30.9 bB597 ± 43.6 abB697 ± 31.3 aA5059 ± 221 cB5553 ± 77.6 cA5827 ± 285 abA5553 ± 221 aA
COM651 ± 32.5 aA539 ± 27.0 cB566 ± 28.3 bB565 ± 28.2 bcB5582 ± 265 bA5158 ± 169 dAB4934 ± 211 bcBC4573 ± 181 bC
AP
mgP kg−1
AK
mgP kg−1
T0T1T2T3T0T1T2T3
C3.28 ± 0.15 dA3.45 ± 0.14 cA3.64 ± 0.18 dA3.70 ± 0.19 bA242 ± 11.1 bcB291 ± 10.5 bA225 ± 11.3 bBC198 ± 9.9 abC
Z3.79 ± 0.16 cB4.02 ± 0.17 bAB4.30 ± 0.10 cA3.39 ± 0.19 bB220 ± 12.0 cB248 ± 8.4 cA196 ± 9.8 cBC178 ± 12.9 bC
10 ZEO5.52 ± 0.24 bA3.56 ± 0.20 cB3.63 ± 0.2 dB3.64 ± 0.18 bB249 ± 10.5 bB284 ± 8.2 bA256 ± 12.8 aB178 ± 8.9 bC
30 ZEO5.00 ± 0.21 bA4.83 ± 0.15 aA4.75 ± 0.15 bA4.28 ± 0.16 aB259 ± 12.0 bA282 ± 14.1 bA254 ± 12.7 aA184 ± 9.2 bB
COM6.84 ± 0.09 aA5.00 ± 0.11 aB5.24 ± 0.20 aB3.76 ± 0.16 bC324 ± 8.2 aA346 ± 12.3 aA274 ± 13.7 aB204 ± 7.7 aC
Mean ± standard error. Lowercase letters indicate significantly different values at p < 0.05 between the treatments at each sampling time. Capital letters indicate significantly different values at p < 0.05 between the sampling times in the same treatment.
Table 4. The effect of treatments (C, Z, 10 ZEO, 30 ZEO, and COM) on soil wet aggregate stability (WSA) and available water (AW) of the vineyard soil immediately after treatment (T0) and after 6 months (T1), 18 months (T2), and 30 months (T3).
WAS
%
AW
%
T0T1T2T3T0T1T2T3
C17.1 ± 0.86 aA16.37 ± 0.82 aA14.2 ± 1.43 aA15.1 ± 0.75 aA13.5 ± 0.58 aA13.7 ± 0.69 aA13.55 ± 0.48 aA13.3 ± 0.66 aA
Z30.7 ± 1.92 aB29.0 ± 1.45 aC27.8 ± 1.35 aB28.1 ± 1.40 aC14.2 ± 0.61 aAB13.9 ± 0.70 aA14.2 ± 1.42 aAB14.6 ± 0.73 aAB
10 ZEO27.4 ± 1.83 aAB24.1 ± 1.18 aB22.8 ± 1.14 AB23.2 ± 1.15 aB14.9 ± 0.74 aB14.8 ± 1.24 aA15.1 ± 1.06 aB14.8 ± 0.54 aB
30 ZEO23.8 ± 2.65 aB23.5 ± 1.18 aB24.3 ± 1.22 aAB25.5 ± 1.27 aB14.9 ± 0.74 aB14.7 ± 1.47 aA15.0 ± 0.75 aB15.1 ± 0.65 aB
COM21.6 ± 1.08 aA22.7 ± 1.14 aB19.4 ± 0.97 aAB18.8 ± 0.94 aA14.1 ± 0.70 aAB14.6 ± 0.58 aA14.8 ± 0.74 aAB14.4 ± 0.66 aAB
Mean ± standard error. Lowercase letters indicate significantly different values at p < 0.05 between the treatments at each sampling time. Capital letters indicate significantly different values at p < 0.05 between the sampling times in the same treatment.
Table 5. The first two principal components (PCs) and component loadings were obtained by considering all treatments (C, Z, 30 ZEO, 10 ZEO, and COM) and all sampling times (T0, T1, T2, and T3).
PC 1PC 2
CEC0.778 *−0.067
EC−0.0510.679 *
pH−0.030−0.676 *
TOC0.918 *−0.091
TN0.614 *0.167
TP0.753 *0.086
AP0.3890.639 *
TK0.709 *0.236
AK0.0130.865 *
TH0.845 *0.153
FA−0.2380.868 *
HA0.861 *−0.317
Glu0.789 *−0.120
Pho0.5810.574
BE0.418−0.716 *
AS0.4970.803 *
WAS0.748 *0.059
AW0.863 *−0.094
Explained variance (%)40.5825.08
CEC: Cation Exchange Capacity; EC: electrical conductivity; TOC: Total Organic Carbon; TN: total nitrogen; TP: total phosphorus. AP: available phosphorus; TK: total potassium; AK: available potassium; TH: total humus; FA: fulvic acids; HA: humic acids; Glu: b-glucosidase activity; Pho: phosphatase activity; BE: butyrate esterase activity; AS: aryl sulphatase activity; WAS: wet aggregate stability; AW: available water. *Variables with component loadings used to interpret the PCs; threshold level: 0.60.
Disclaimer/Publisher’s Note: The statements, opinions and data contained in all publications are solely those of the individual author(s) and contributor(s) and not of MDPI and/or the editor(s). MDPI and/or the editor(s) disclaim responsibility for any injury to people or property resulting from any ideas, methods, instructions or products referred to in the content.

