

An Effective Biomonitor of Potentially Toxic Elements in Marine Ecosystems: The Brown Alga Dictyota spiralis

 ,
,  , ,
, ,
Abstract
:
1. Introduction
2. Materials and Methods
2.1. Study Area and Sampling Sites
- -
- CT and CP, in the Full Reserve zone (A—where maritime traffic and any type of professional/recreational activities are strictly forbidden) of the MPA,
- -
- OM, in the General Reserve zone (B—where only swimming and slow navigation, <5 kt, are allowed) of the MPA,
- -
- SM, in the Partial Reserve zone (C—where most of the activities are allowed, if compatible with the general protection of the seafloor) of the MPA and close to a small marina,
- -
- TB, outside the MPA and close to its northern boundary,
- -
- AH, outside the MPA and close to a large harbor.

2.2. Sampling and Laboratory Analyses
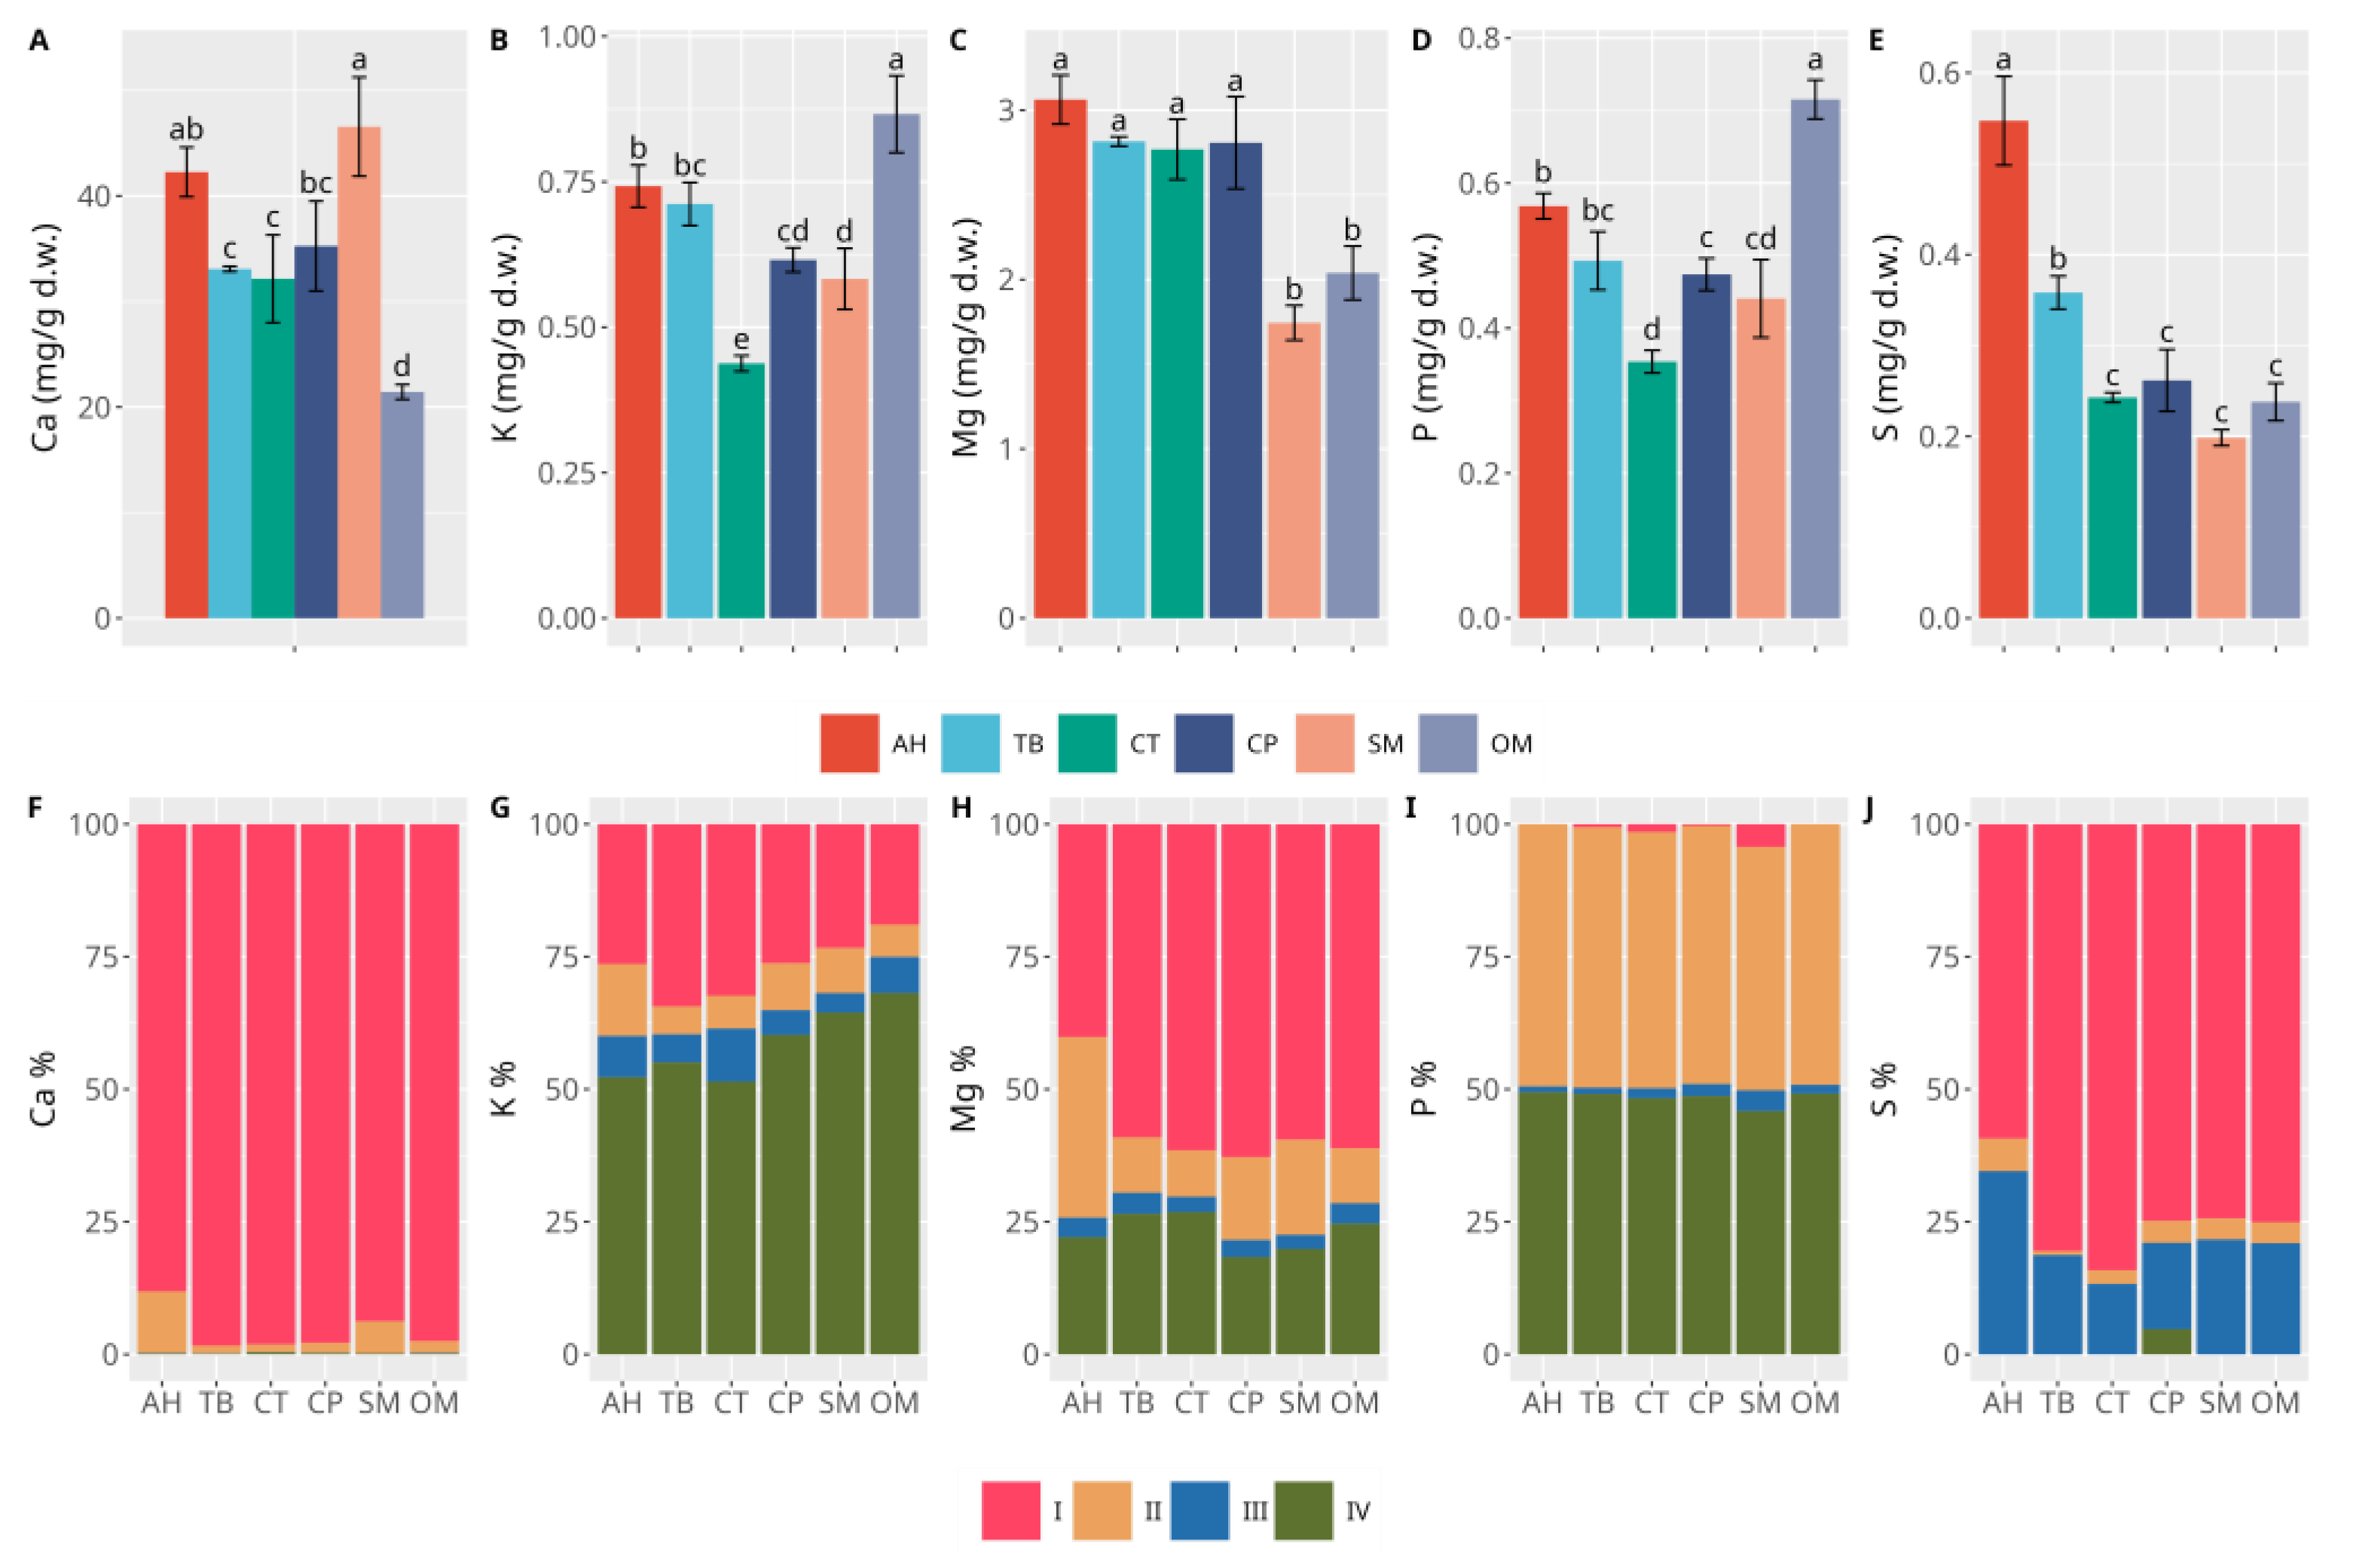
- I:
- Acid-soluble/exchangeable fraction (lightly bound PTEs);
- II:
- Reducible fraction (PTEs associated with Fe and Mn oxides);
- III:
- Oxidizable fraction (PTEs bound to organic matter);
- IV:
- Residual fraction (aqua regia extractable PTEs).
2.3. Data Analysis
3. Results
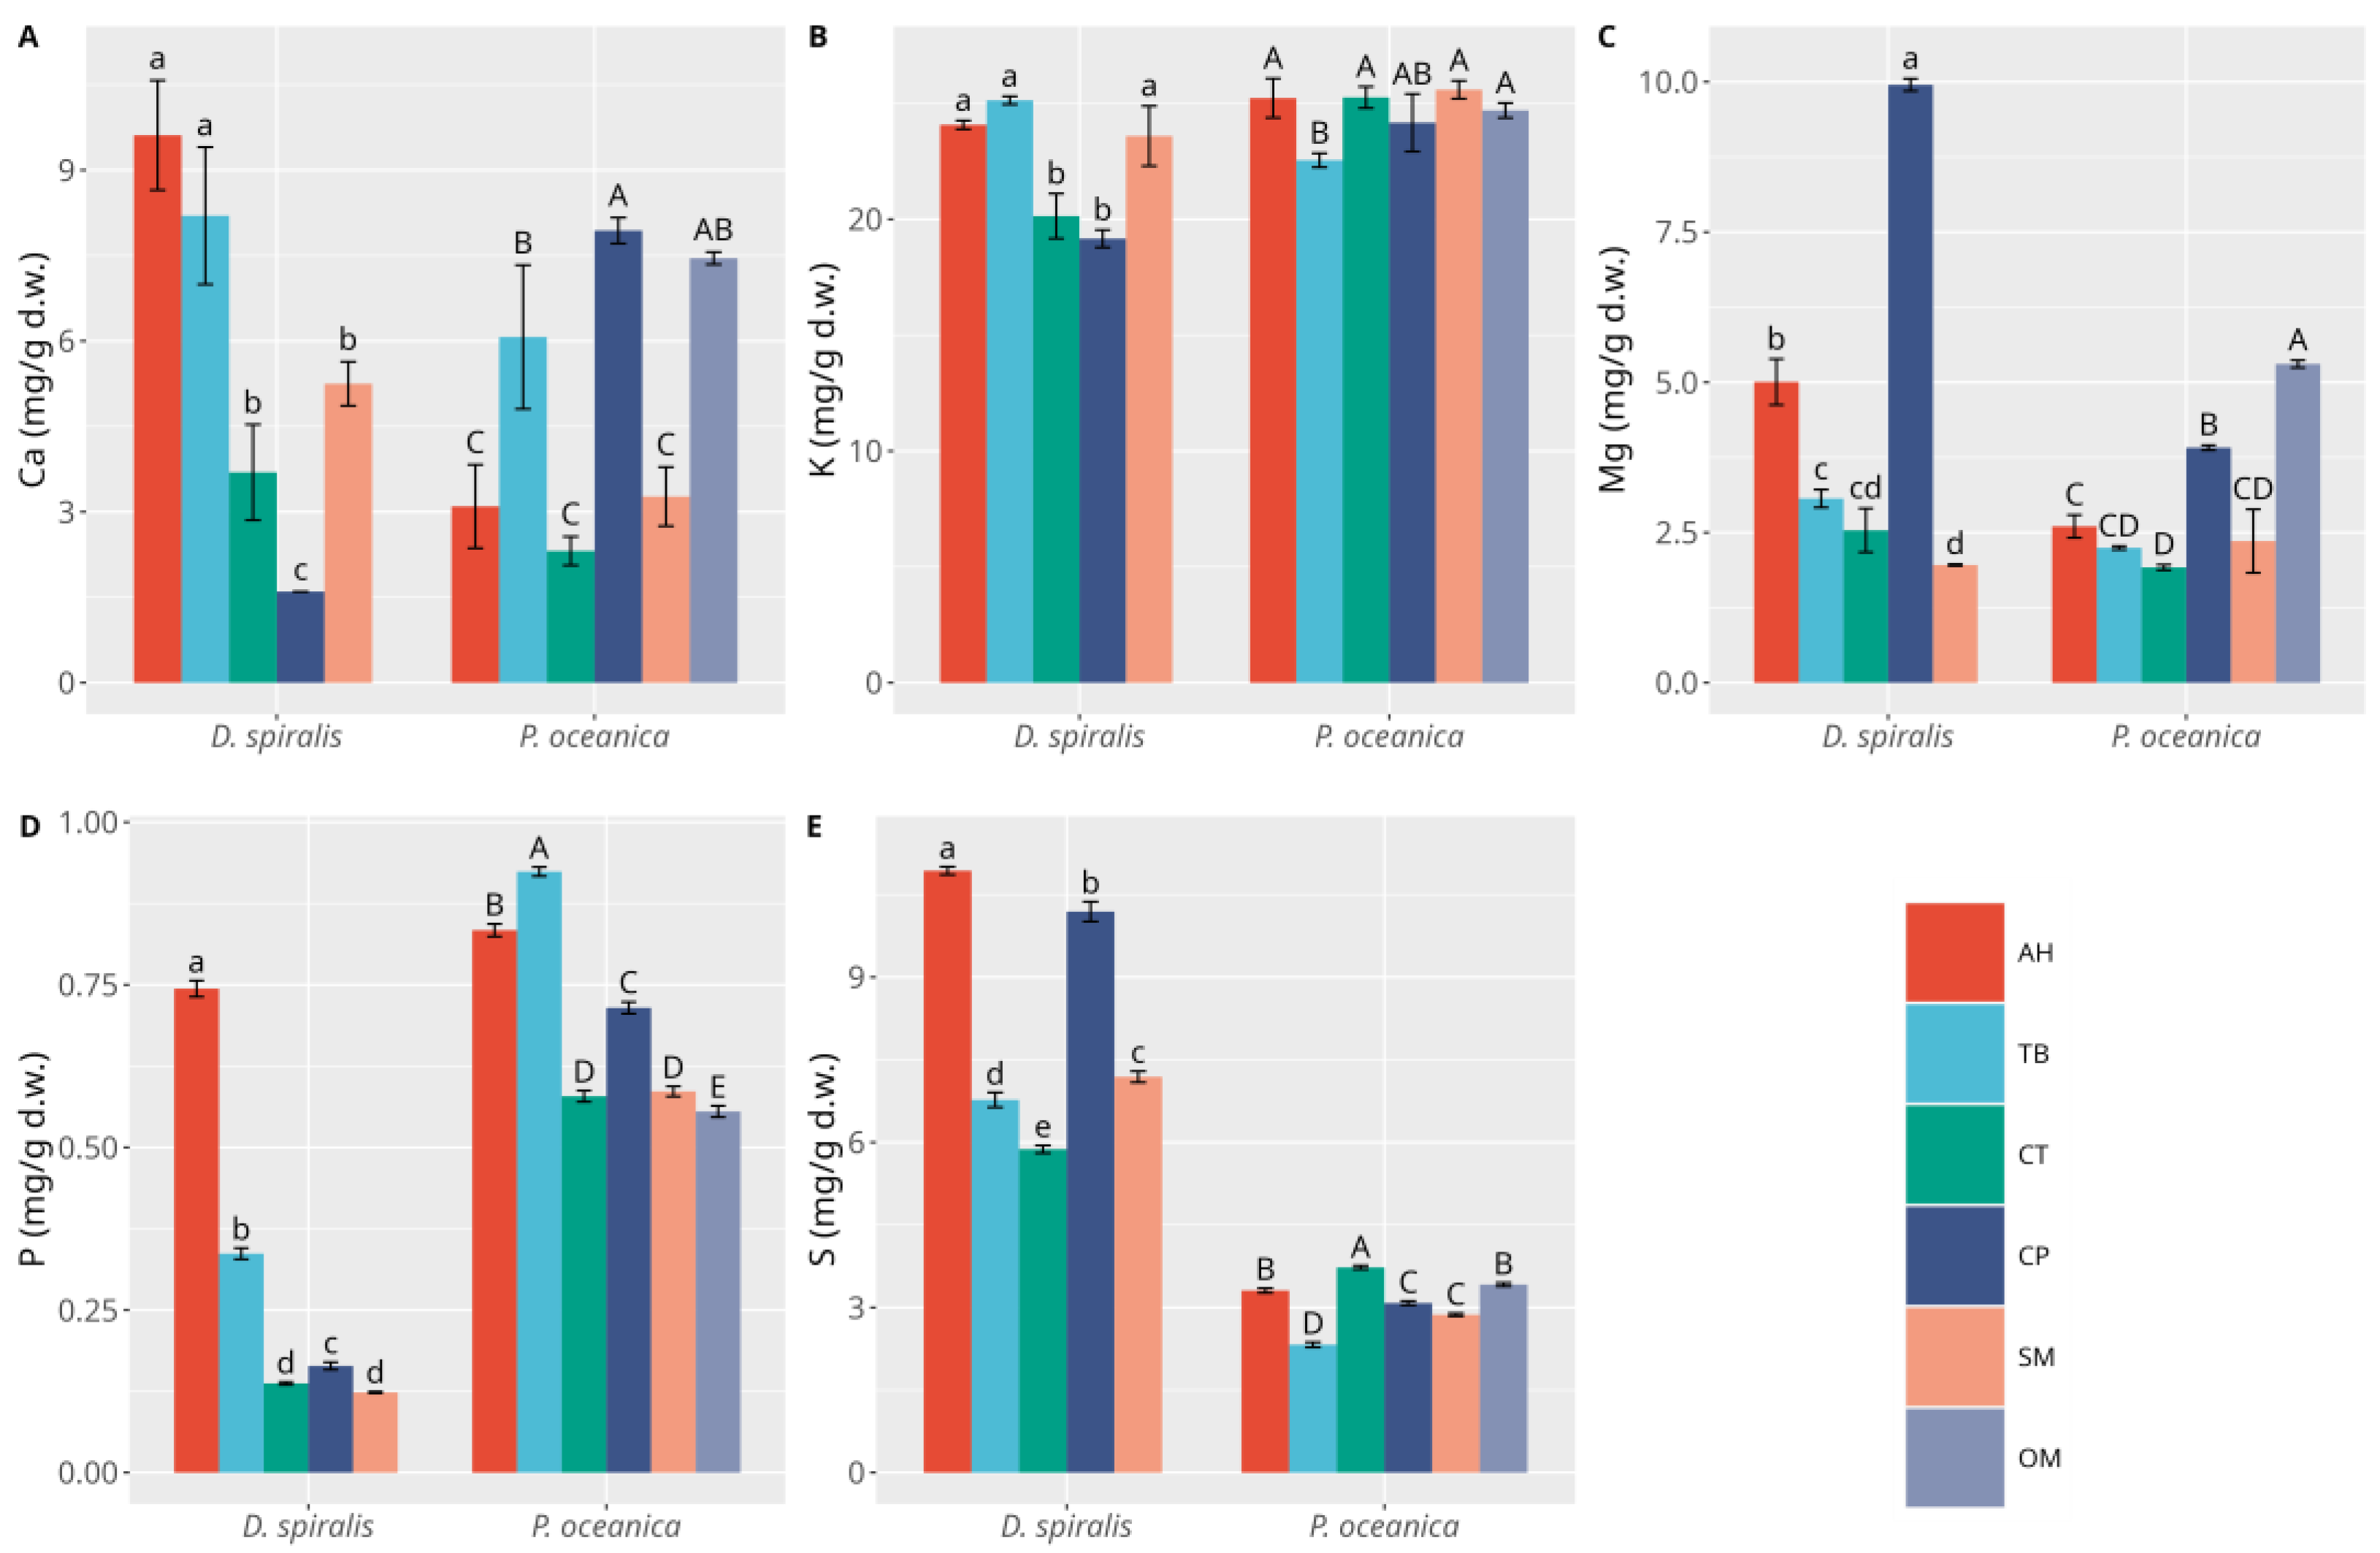
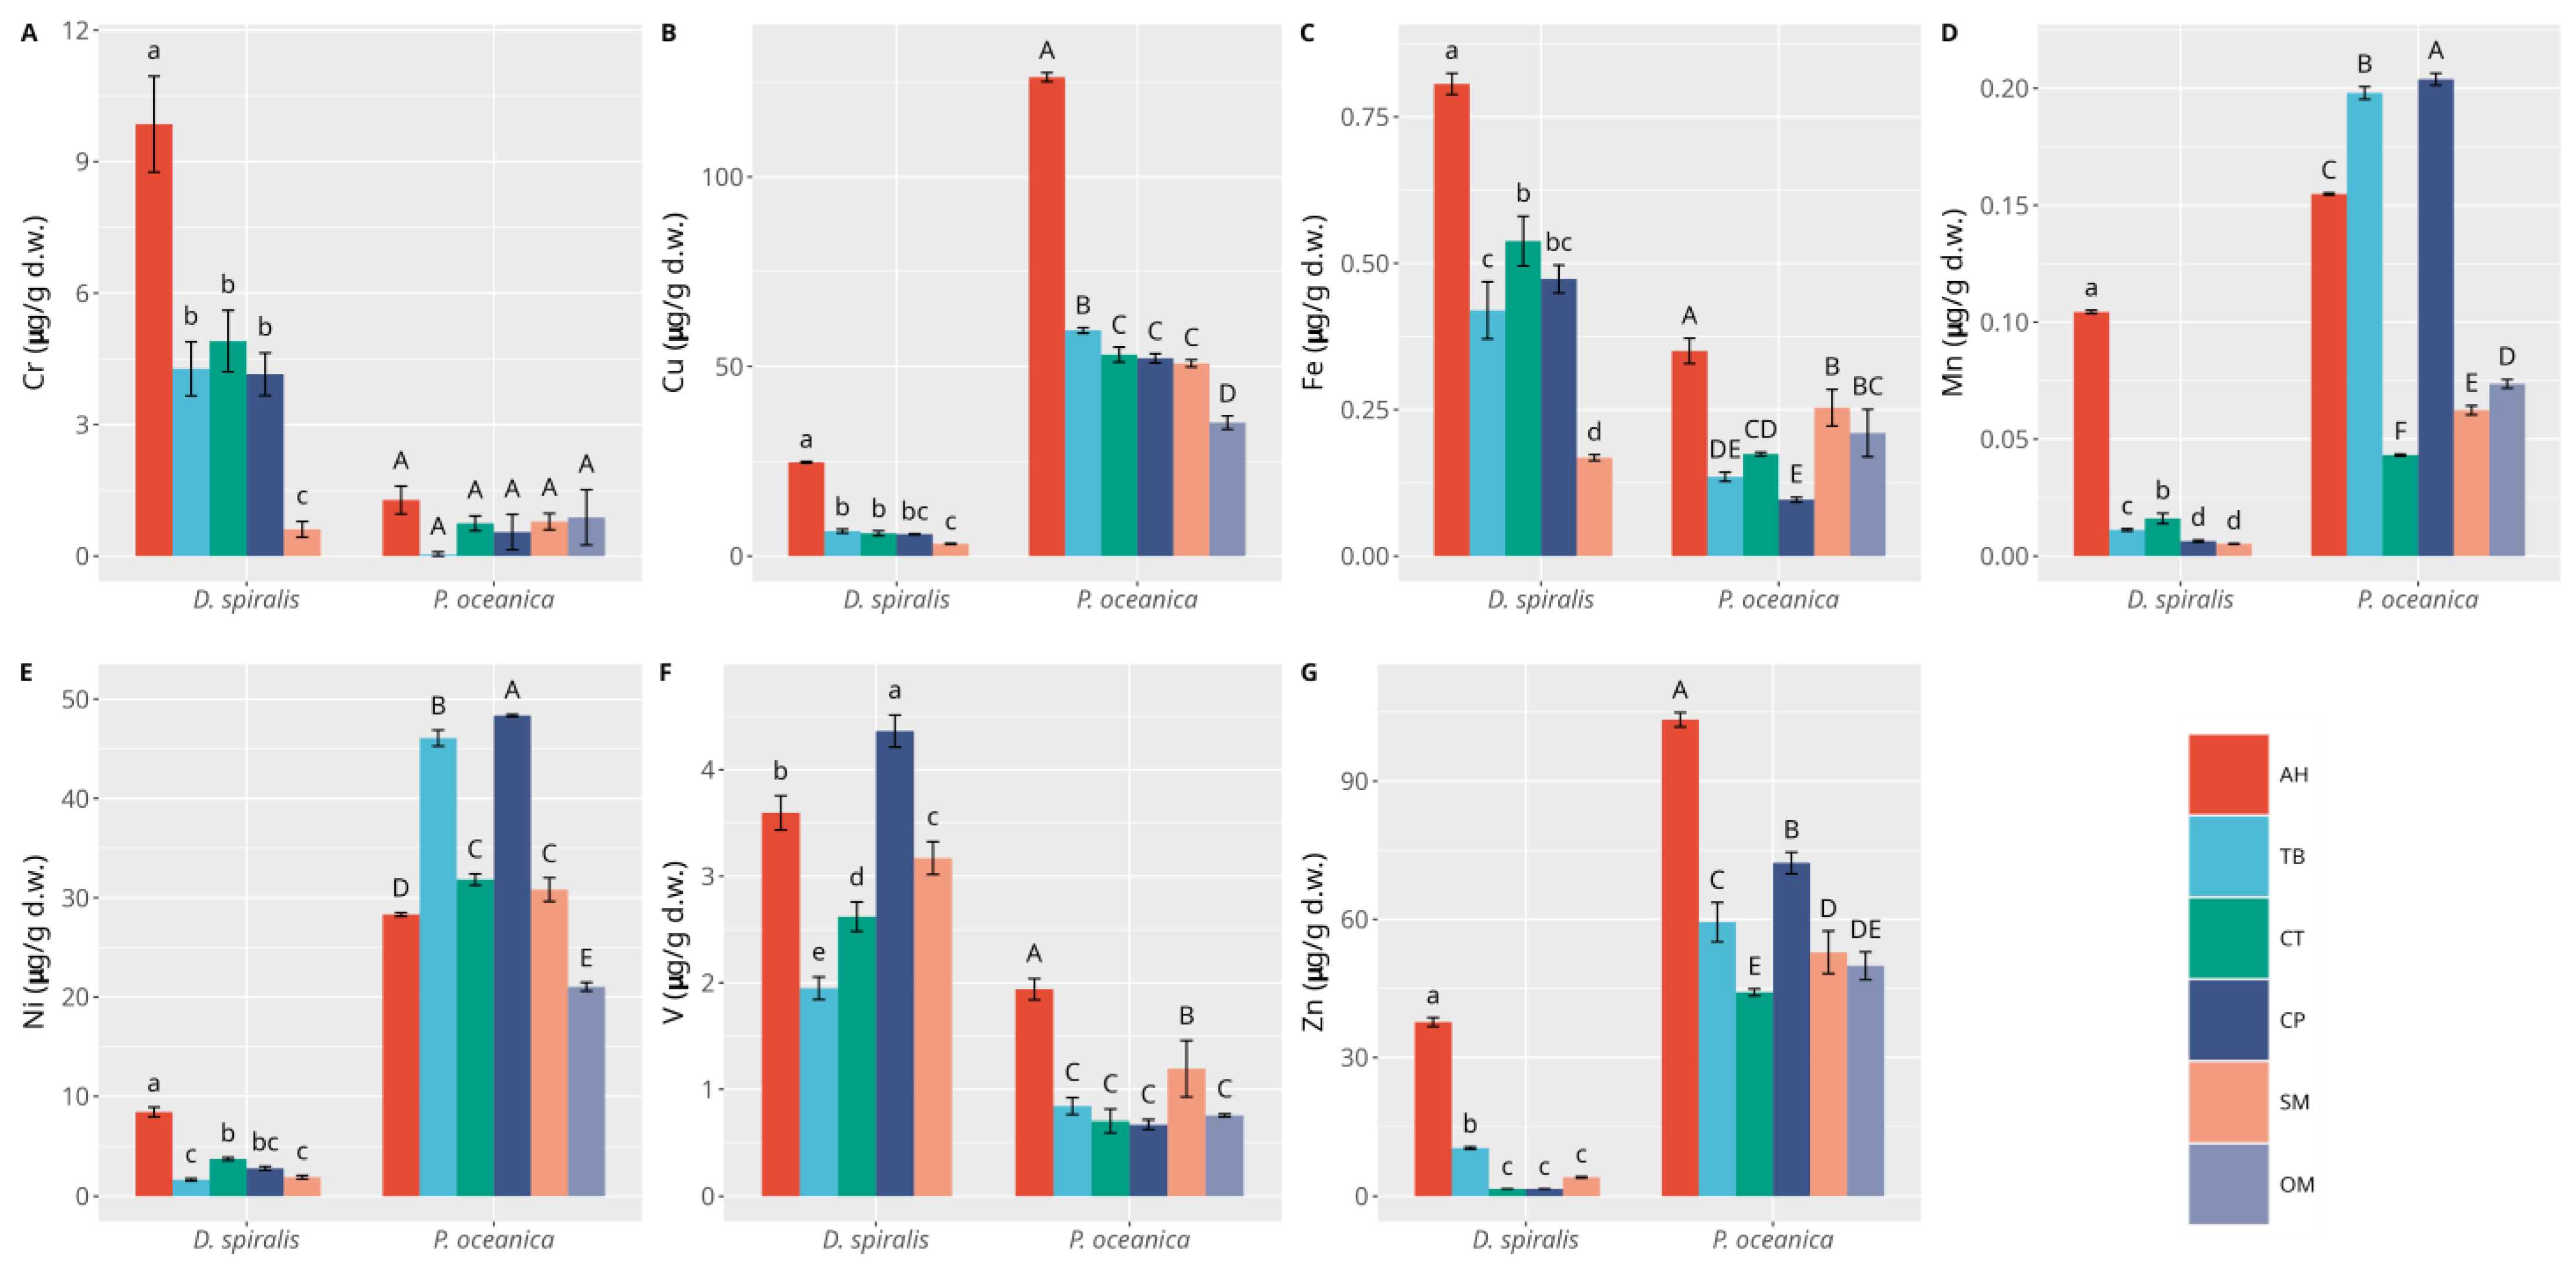
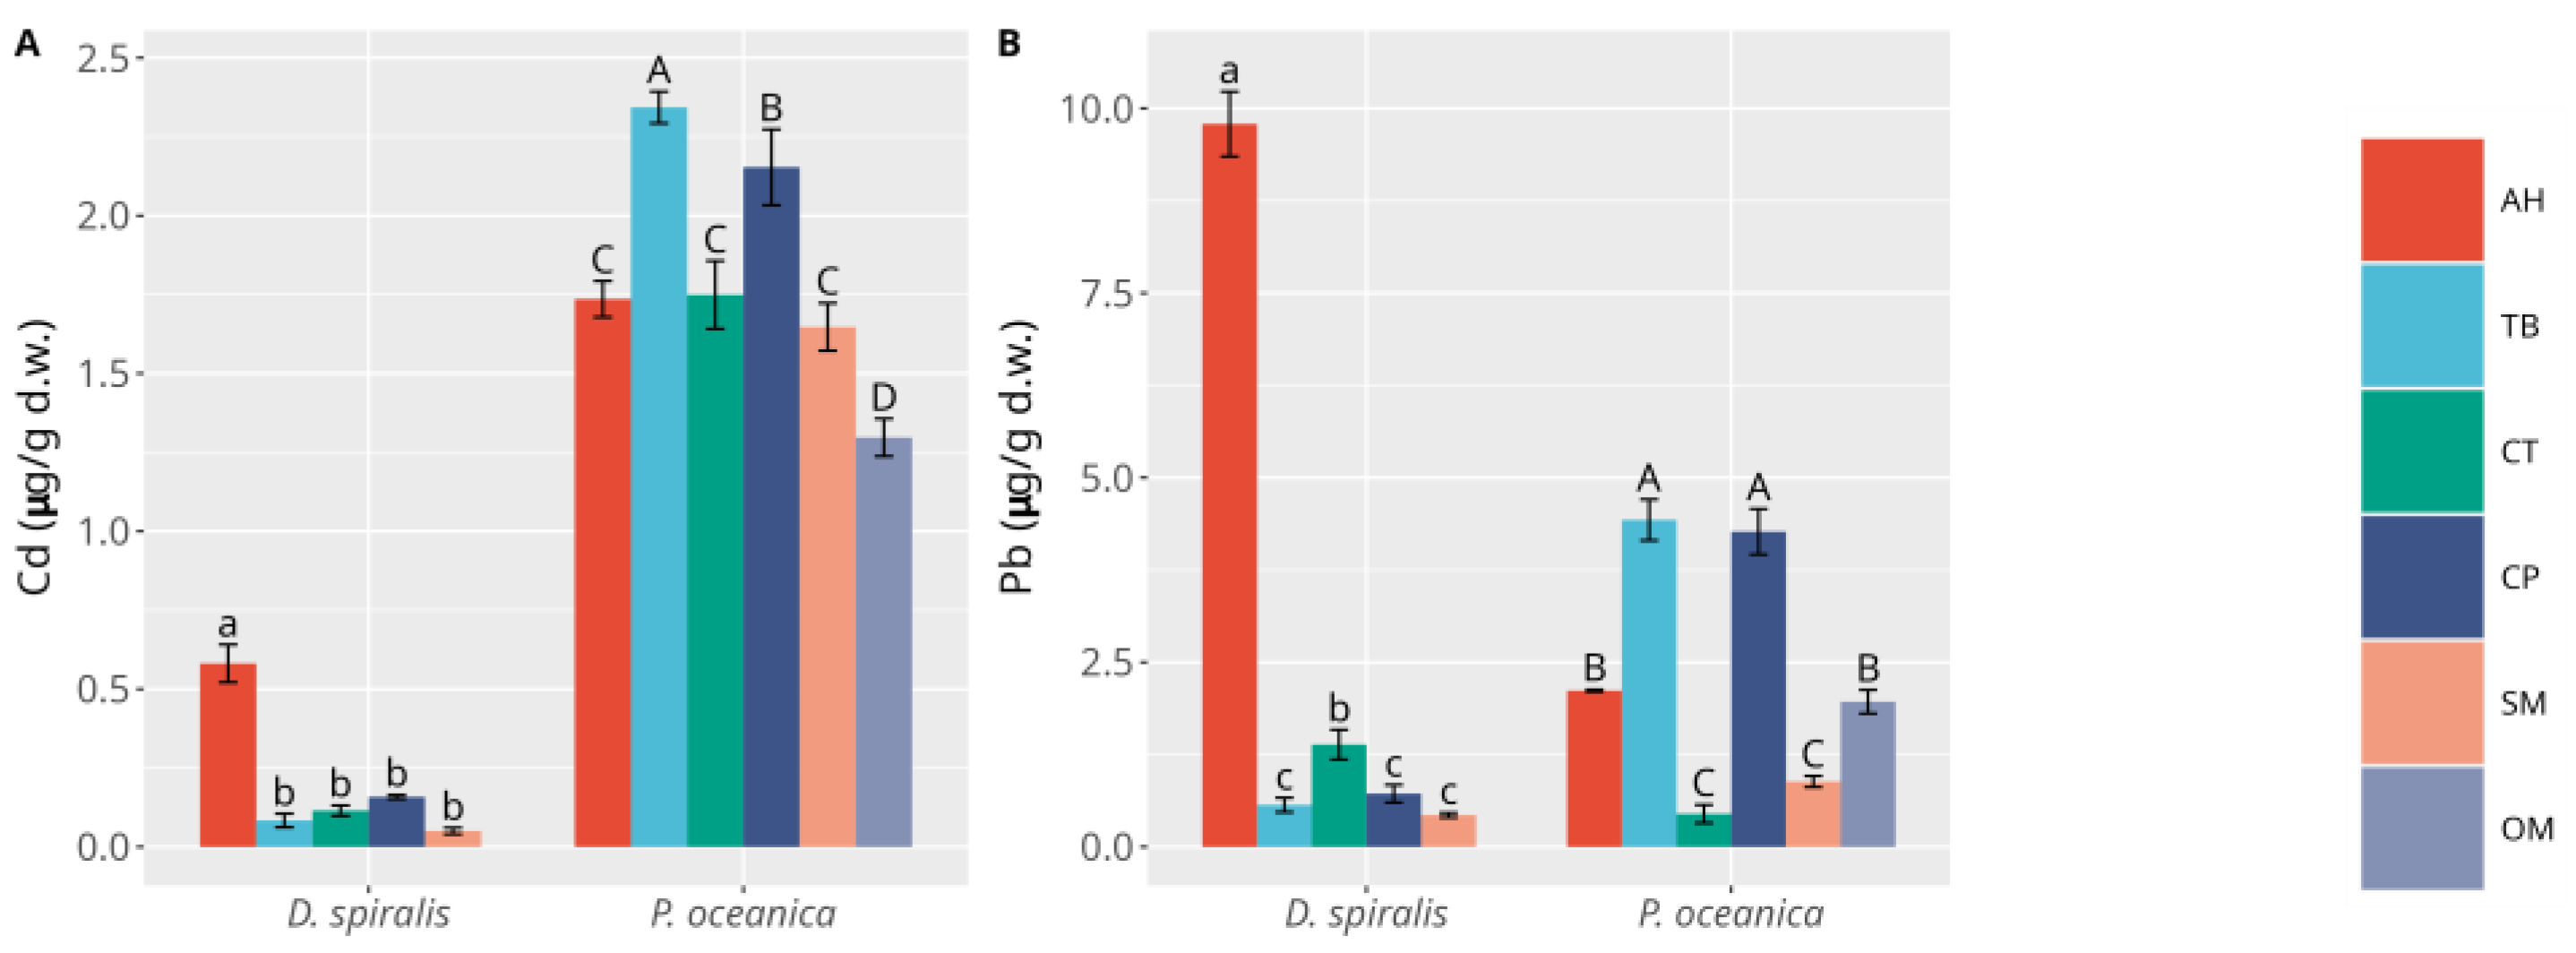
3.1. Macrophytes
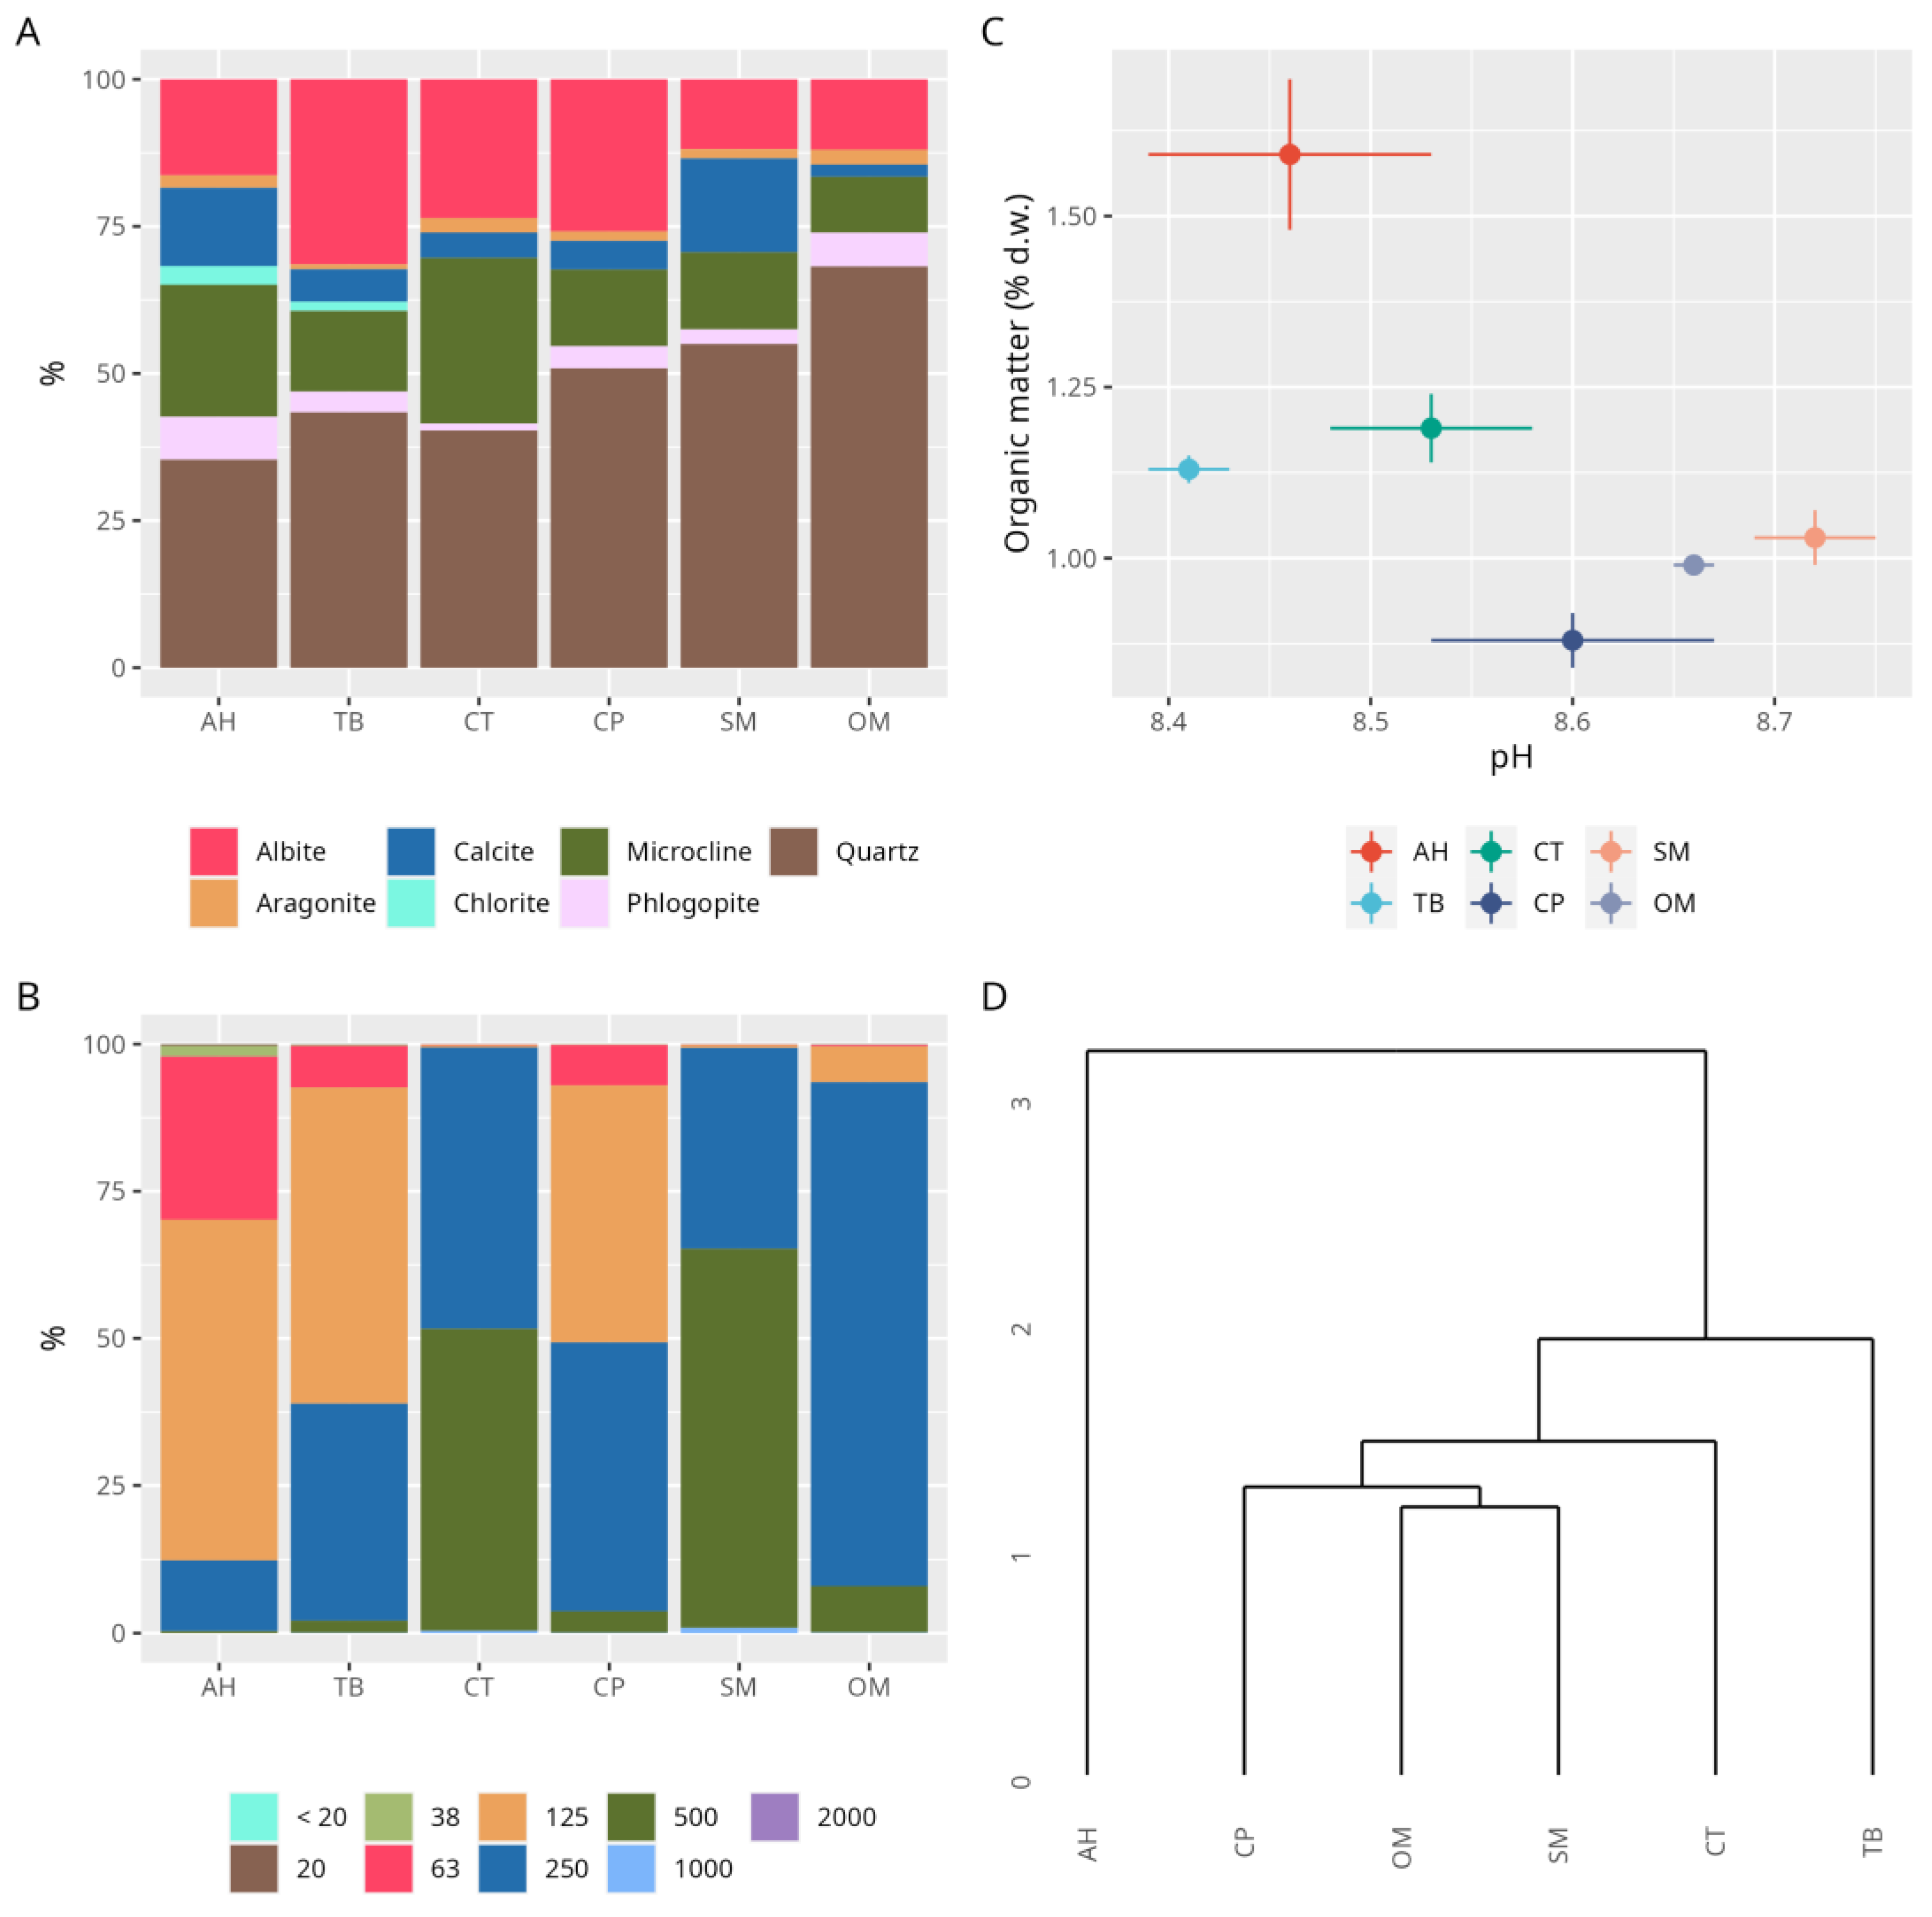
3.2. Sediments
4. Discussion
5. Conclusions
Supplementary Materials
Author Contributions
Funding
Data Availability Statement
Acknowledgments
Conflicts of Interest
References
- Oursel, B.; Garnier, C.; Pairaud, I.; Omanović, D.; Durrieu, G.; Syakti, A.D.; Le Poupon, C.; Thouvenin, B.; Lucas, Y. Behaviour and Fate of Urban Particles in Coastal Waters: Settling Rate, Size Distribution and Metals Contamination Characterization. Estuar. Coast. Shelf Sci. 2014, 138, 14–26. [Google Scholar] [CrossRef]
- Sánchez-Quiles, D.; Marbà, N.; Tovar-Sánchez, A. Trace Metal Accumulation in Marine Macrophytes: Hotspots of Coastal Contamination Worldwide. Sci. Total Environ. 2017, 576, 520–527. [Google Scholar] [CrossRef] [PubMed]
- 2008/56/EC; Directive 2008/56/EC of the European Parliament and of the Council of 17 June 2008 Establishing a Framework for Community Action in the Field of Marine Environmental Policy. Marine Strategy Framework Directive: Strasbourg, France, 2008.
- Dadolahi-Sohrab, A.; Nikvarz, A.; Nabavi, S.; Safahieh, A.; Mohseni, M. Environmental Monitoring of Heavy Metals in Seaweed and Associated Sediment from the Strait of Hormuz, I.R. Iran. World J. Fish Mar. Sci. 2011, 3, 576–589. [Google Scholar]
- Tornero, V.; Hanke, G. Chemical Contaminants Entering the Marine Environment from Sea-Based Sources: A Review with a Focus on European Seas. Mar. Pollut. Bull. 2016, 112, 17–38. [Google Scholar] [CrossRef] [PubMed]
- Jakimska, A.; Konieczka, P.; Skóra, K.; Namieśnik, J. Bioaccumulation of Metals in Tissues of Marine Animals, Part I: The Role and Impact of Heavy Metals on Organisms. Pol. J. Environ. Stud. 2011, 20, 1117–1125. [Google Scholar]
- Allan, I.J.; Vrana, B.; Greenwood, R.; Mills, G.A.; Knutsson, J.; Holmberg, A.; Guigues, N.; Fouillac, A.-M.; Laschi, S. Strategic Monitoring for the European Water Framework Directive. Trends Anal. Chem. 2006, 25, 704–715. [Google Scholar] [CrossRef]
- Rainbow, P.S. Biomonitoring of Heavy Metal Availability in the Marine Environment. Mar. Pollut. Bull. 1995, 31, 183–192. [Google Scholar] [CrossRef]
- Buccolieri, A.; Buccolieri, G.; Cardellicchio, N.; Dell’Atti, A.; Di Leo, A.; Maci, A. Heavy Metals in Marine Sediments of Taranto Gulf (Ionian Sea, Southern Italy). Mar. Chem. 2006, 99, 227–235. [Google Scholar] [CrossRef]
- García-Seoane, R.; Fernández, J.A.; Villares, R.; Aboal, J.R. Use of Macroalgae to Biomonitor Pollutants in Coastal Waters: Optimization of the Methodology. Ecol. Indic. 2018, 84, 710–726. [Google Scholar] [CrossRef]
- Akcali, I.; Kucuksezgin, F. A Biomonitoring Study: Heavy Metals in Macroalgae from Eastern Aegean Coastal Areas. Mar. Pollut. Bull. 2011, 62, 637–645. [Google Scholar] [CrossRef] [PubMed]
- Phillips, D.J.H.; Segar, D.A. Use of Bio-Indicators in Monitoring Conservative Contaminants: Programme Design Imperatives. Mar. Pollut. Bull. 1986, 17, 10–17. [Google Scholar] [CrossRef]
- Rainbow, P.S.; Phillips, D.J.H. Cosmopolitan Biomonitors of Trace Metals. Mar. Pollut. Bull. 1993, 26, 593–601. [Google Scholar] [CrossRef]
- Baldantoni, D.; Bellino, A.; Lofrano, G.; Libralato, G.; Pucci, L.; Carotenuto, M. Biomonitoring of Nutrient and Toxic Element Concentrations in the Sarno River through Aquatic Plants. Ecotoxicol. Environ. Saf. 2018, 148, 520–527. [Google Scholar] [CrossRef]
- Bellino, A.; Alfani, A.; De Riso, L.; Gregorio, R.; Pellegrino, T.; Baldantoni, D. Long-Established and New Active Biomonitors Jointly Reveal Potentially Toxic Element Gradients across Spatial Scales in Freshwater Ecosystems. Ecol. Indic. 2020, 118, 106742. [Google Scholar] [CrossRef]
- Bellino, A.; Alfani, A.; De Riso, L.; Gregorio, R.; Pellegrino, T.; Baldantoni, D. A Promising Cosmopolitan Biomonitor of Potentially Toxic Elements in Freshwater Ecosystems: Concentration Gradients in Sensitive Areas. Ecol. Indic. 2020, 109, 105801. [Google Scholar] [CrossRef]
- Markert, B.A.; Breure, A.M.; Zechmeister, H.G. Bioindicators and Biomonitors; Elsevier: Amsterdam, The Netherlands, 2003; ISBN 978-0-08-052797-0. [Google Scholar]
- Baldantoni, D.; De Nicola, F.; Alfani, A. Potentially Toxic Element Gradients in Remote, Residential, Urban and Industrial Areas, as Highlighted by the Analysis of Quercus ilex Leaves. Urban For. Urban Green. 2020, 47, 126522. [Google Scholar] [CrossRef]
- Ansari, T.M.; Marr, I.L.; Tariq, N. Heavy Metals in Marine Pollution Perspective-a Mini Review. J. Appl. Sci. 2004, 4, 1–20. [Google Scholar] [CrossRef]
- Volterra, L.; Conti, M.E. Algae as Biomarkers, Bioaccumulators and Toxin Producers. Int. J. Environ. Pollut. 2000, 13, 92–125. [Google Scholar] [CrossRef]
- Conti, M.E.; Bocca, B.; Iacobucci, M.; Finoia, M.G.; Mecozzi, M.; Pino, A.; Alimonti, A. Baseline Trace Metals in Seagrass, Algae, and Mollusks in a Southern Tyrrhenian Ecosystem (Linosa Island, Sicily). Arch. Environ. Contam. Toxicol. 2010, 58, 79–95. [Google Scholar] [CrossRef] [PubMed]
- Gosselin, M.; Bouquegneau, J.-M.; Lefèbvre, F.; Lepoint, G.; Pergent, G.; Pergent-Martini, C.; Gobert, S. Trace Metal Concentrations in Posidonia oceanica of North Corsica (Northwestern Mediterranean Sea): Use as a Biological Monitor? BMC Ecol. 2006, 6, 12. [Google Scholar] [CrossRef] [PubMed]
- Pergent-Martini, C.; Leoni, V.; Pasqualini, V.; Ardizzone, G.D.; Balestri, E.; Bedini, R.; Belluscio, A.; Belsher, T.; Borg, J.; Boudouresque, C.F.; et al. Descriptors of Posidonia oceanica Meadows: Use and Application. Ecol. Indic. 2005, 5, 213–230. [Google Scholar] [CrossRef]
- Ralph, P.J.; Tomasko, D.; Moore, K.; Seddon, S.; Macinnis-Ng, C.M.O.; Larkum, A.; Orth, R.J.; Duarte, C.M. Human Impacts on Seagrasses: Eutrophication, Sedimentation, and Contamination. In Seagrasses: Biology, Ecology and Conservation; Springer: Berlin/Heidelberg, Germany, 2006; pp. 567–593. ISBN 978-1-4020-2983-7. [Google Scholar]
- International Union for Conservation of Nature and Natural Resources. IUCN Red List of Threatened Species; International Union for Conservation of Nature and Natural Resources: Gland, Switzerland, 2015. [Google Scholar]
- Bidak, L.M.M.; Heneidy, S.Z.; Wenzhao, L.; Fakhry, A.M.; El-Kenany, E.T.; El-Askary, H.M.; Abdel-Kareem, M.S. Mediterranean Tapeweed Posidonia oceanica (L.) Delile, an Endangered Seagrass Species. Egypt. J. Bot. 2021, 61, 335–348. [Google Scholar] [CrossRef]
- Rai, L.C.; Gaur, J.P.; Kumar, H.D. Phycology and Heavy-Metal Pollution. Biol. Rev. 1981, 56, 99–151. [Google Scholar] [CrossRef]
- Conti, M.E. Environmental Biological Monitoring. In WIT Transactions on State of the Art in Science and Engineering; Conti, M.E., Ed.; WIT Press: Billerica, MA, USA, 2008; Volume 1, pp. 1–23. ISBN 978-1-84564-002-6. [Google Scholar]
- Coll, M.; Piroddi, C.; Steenbeek, J.; Kaschner, K.; Lasram, F.B.R.; Aguzzi, J.; Ballesteros, E.; Bianchi, C.N.; Corbera, J.; Dailianis, T.; et al. The Biodiversity of the Mediterranean Sea: Estimates, Patterns, and Threats. PLoS ONE 2010, 5, e11842. [Google Scholar] [CrossRef] [PubMed]
- Baldantoni, D.; Ligrone, R.; Alfani, A. Macro- and Trace-Element Concentrations in Leaves and Roots of Phragmites australis in a Volcanic Lake in Southern Italy. J. Geochem. Explor. 2009, 101, 166–174. [Google Scholar] [CrossRef]
- NIST. Certification of NIST Standard Reference Material 1547 Peach Leaves Results of an International Laboratory Comparison; NIST: Gaithersburg, MD, USA, 2019.
- Rauret, G.; López-Sánchez, J.F.; Sahuquillo, A.; Rubio, R.; Davidson, C.; Ure, A.; Quevauviller, P. Improvement of the BCR Three Step Sequential Extraction Procedure Prior to the Certification of New Sediment and Soil Reference Materials. J. Environ. Monit. 1999, 1, 57–61. [Google Scholar] [CrossRef]
- Memoli, V.; Eymar, E.; García-Delgado, C.; Esposito, F.; Santorufo, L.; De Marco, A.; Barile, R.; Maisto, G. Total and Fraction Content of Elements in Volcanic Soil: Natural or Anthropogenic Derivation. Sci. Total Environ. 2018, 625, 16–26. [Google Scholar] [CrossRef] [PubMed]
- European Commission. The Certification Reference Material BCR-701; Bureau Community of Reference: Bruxelles, Belgium, 2001. [Google Scholar]
- Lassabatère, L.; Angulo-Jaramillo, R.; Soria Ugalde, J.M.; Cuenca, R.; Braud, I.; Haverkamp, R. Beerkan Estimation of Soil Transfer Parameters through Infiltration Experiments—BEST. Soil Sci. Soc. Am. J. 2006, 70, 521–532. [Google Scholar] [CrossRef]
- Bayat, H.; Rastgo, M.; Mansouri Zadeh, M.; Vereecken, H. Particle Size Distribution Models, Their Characteristics and Fitting Capability. J. Hydrol. 2015, 529, 872–889. [Google Scholar] [CrossRef]
- Doebelin, N.; Kleeberg, R. Profex: A Graphical User Interface for the Rietveld Refinement Program BGMN. J. Appl. Crystallogr. 2015, 48, 1573–1580. [Google Scholar] [CrossRef]
- Gražulis, S.; Daškevič, A.; Merkys, A.; Chateigner, D.; Lutterotti, L.; Quirós, M.; Serebryanaya, N.R.; Moeck, P.; Downs, R.T.; Le Bail, A. Crystallography Open Database (COD): An Open-Access Collection of Crystal Structures and Platform for World-Wide Collaboration. Nucleic Acids Res. 2012, 40, D420–D427. [Google Scholar] [CrossRef]
- Campanella, L.; Conti, M.E.; Cubadda, F.; Sucapane, C. Trace Metals in Seagrass, Algae and Molluscs from an Uncontaminated Area in the Mediterranean. Environ. Pollut. 2001, 111, 117–126. [Google Scholar] [CrossRef]
- Bonanno, G.; Borg, J.A.; Di Martino, V. Levels of Heavy Metals in Wetland and Marine Vascular Plants and Their Biomonitoring Potential: A Comparative Assessment. Sci. Total Environ. 2017, 576, 796–806. [Google Scholar] [CrossRef] [PubMed]
- Bonanno, G.; Di Martino, V. Trace Element Compartmentation in the Seagrass Posidonia oceanica and Biomonitoring Applications. Mar. Pollut. Bull. 2017, 116, 196–203. [Google Scholar] [CrossRef] [PubMed]
- Bonanno, G.; Veneziano, V.; Orlando-Bonaca, M. Comparative Assessment of Trace Element Accumulation and Biomonitoring in Seaweed Ulva lactuca and Seagrass Posidonia oceanica. Sci. Total Environ. 2020, 718, 137413. [Google Scholar] [CrossRef] [PubMed]
- Ustunada, M.; Erduğan, H.; Yılmaz, S.; Akgul, R.; Aysel, V. Seasonal Concentrations of Some Heavy Metals (Cd, Pb, Zn, and Cu) in Ulva rigida J. Agardh (Chlorophyta) from Dardanelles (Canakkale, Turkey). Environ. Monit. Assess. 2011, 177, 337–342. [Google Scholar] [CrossRef] [PubMed]
- Yılmaz, A.B.; Yanar, A.; Alkan, E.N. Review of Heavy Metal Accumulation on Aquatic Environment in Northern East Mediterrenean Sea Part I: Some Essential Metals. Rev. Environ. Health 2017, 32, 119–163. [Google Scholar] [CrossRef] [PubMed]
- Haritonidis, S.; Malea, P. Seasonal and Local Variation of Cr, Ni and Co Concentrations in Ulva rigida C. Agardh and Enteromorpha Linza (Linnaeus) from Thermaikos Gulf, Greece. Environ. Pollut. 1995, 89, 319–327. [Google Scholar] [CrossRef]
- Bonanno, G.; Orlando-Bonaca, M. Chemical Elements in Mediterranean Macroalgae. A Review. Ecotoxicol. Environ. Saf. 2018, 148, 44–71. [Google Scholar] [CrossRef] [PubMed]
- Malea, P.; Haritonidis, S. Use of the Green Alga Ulva rigida C. Agardh as an Indicator Species to Reassess Metal Pollution in the Thermaikos Gulf, Greece, after 13 Years. J. Appl. Phycol. 2000, 12, 169–176. [Google Scholar] [CrossRef]
- Chakraborty, S.; Bhattacharya, T.; Singh, G.; Maity, J.P. Benthic Macroalgae as Biological Indicators of Heavy Metal Pollution in the Marine Environments: A Biomonitoring Approach for Pollution Assessment. Ecotoxicol. Environ. Saf. 2014, 100, 61–68. [Google Scholar] [CrossRef]
- Lim, W.Y.; Aris, A.Z.; Zakaria, M.P. Spatial Variability of Metals in Surface Water and Sediment in the Langat River and Geochemical Factors that Influence their Water-Sediment Interactions. Sci. World J. 2012, 2012, 652150. [Google Scholar] [CrossRef]
- Jiménez-Morillo, N.T.; Moreno, J.; Moreno, F.; Fatela, F.; Leorri, E.; De La Rosa, J.M. Composition and Sources of Sediment Organic Matter in a Western Iberian Salt Marsh: Developing a Novel Prediction Model of the Bromine Sedimentary Pool. Sci. Total Environ. 2024, 907, 167931. [Google Scholar] [CrossRef] [PubMed]
- Alagarsamy, R. Organic Carbon in the Sediments of Mandovi Estuary, Goa. Indian J. Mar. Sci. 1991, 20, 221–222. [Google Scholar]
- Schaffner, L.C. Patterns and Rates of Recovery of Macrobenthic Communities in a Polyhaline Temperate Estuary Following Sediment Disturbance: Effects of Disturbance Severity and Potential Importance of Non-Local Processes. Estuaries Coasts 2010, 33, 1300–1313. [Google Scholar] [CrossRef]
- Baumann, H.A.; Morrison, L.; Stengel, D.B. Metal Accumulation and Toxicity Measured by PAM—Chlorophyll Fluorescence in Seven Species of Marine Macroalgae. Ecotoxicol. Environ. Saf. 2009, 72, 1063–1075. [Google Scholar] [CrossRef] [PubMed]
- Huerta-Diaz, M.A.; de León-Chavira, F.; Lares, M.L.; Chee-Barragán, A.; Siqueiros-Valencia, A. Iron, Manganese and Trace Metal Concentrations in Seaweeds from the Central West Coast of the Gulf of California. Appl. Geochem. 2007, 22, 1380–1392. [Google Scholar] [CrossRef]
- Amado Filho, G.M.; Karez, C.S.; Andrade, L.R.; Yoneshigue-Valentin, Y.; Pfeiffer, W.C. Effects on Growth and Accumulation of Zinc in Six Seaweed Species. Ecotoxicol. Environ. Saf. 1997, 37, 223–228. [Google Scholar] [CrossRef]
- Bonanno, G.; Orlando-Bonaca, M. Perspectives on Using Marine Species as Bioindicators of Plastic Pollution. Mar. Pollut. Bull. 2018, 137, 209–221. [Google Scholar] [CrossRef]
- Davis, T.A.; Volesky, B.; Mucci, A. A Review of the Biochemistry of Heavy Metal Biosorption by Brown Algae. Water Res. 2003, 37, 4311–4330. [Google Scholar] [CrossRef]
- Phillips, D.J.H. Use of Macroalgae and Invertebrates as Monitors of Metal Levels in Estuaries and Coastal Waters. In Heavy Metals in the Marine Environment; CRC Press: Boca Raton, FL, USA, 1990; pp. 81–99. ISBN 978-1-351-07315-8. [Google Scholar]


| Division | Species | Site |
|---|---|---|
| Rhodophyta | Corallina elongata Ellis & Solander, 1786 | AH, TB, CT, CP |
| Haliptilon virgatum (Zanardini) Garbary & Johansen, 1982 | TB | |
| Jania rubens (L.) Lamouroux, 1816 | TB, CP, SM, OM | |
| Laurencia microcladia Kützing, 1865 | CT, CP, SM, OM | |
| Laurencia obtusa (Hudson) Lamouroux, 1813 | CT | |
| Spyridia filamentosa (Wulfen) Harvey, 1833 | CP | |
| Chlorophyta | Cladophora coelothrix Kützing, 1843 | SM |
| Chaetomorpha aerea (Dillwyn) Kützing, 1849 | CT | |
| Ulva clathrata (Roth) Agardh, 1811 | TB | |
| Ulva compressa Forsskål, 1775 | AH | |
| Heterokontophyta | Cystoseira balearica Sauvageau, 1912 | CP |
| Cystoseira crinita Duby, 1830 | CT | |
| Cystoseira compressa (Esper) Gerloff & Nizamuddin, 1975 | CT, CP, SM | |
| Cystoseira spinosa var. tenuior (Ercegovic) Cormaci et al., 1992 | OM | |
| Dictyota spiralis Montagne, 1846 | AH, TB, CT, CP, SM | |
| Taonia atomaria (Woodward) Agardh, 1848 | SM | |
| Embryophyta | Posidonia oceanica (L.) Delile, 1813 | AH, TB, CT, CP, SM, OM |
Disclaimer/Publisher’s Note: The statements, opinions and data contained in all publications are solely those of the individual author(s) and contributor(s) and not of MDPI and/or the editor(s). MDPI and/or the editor(s) disclaim responsibility for any injury to people or property resulting from any ideas, methods, instructions or products referred to in the content. |
© 2024 by the authors. Licensee MDPI, Basel, Switzerland. This article is an open access article distributed under the terms and conditions of the Creative Commons Attribution (CC BY) license (https://creativecommons.org/licenses/by/4.0/).
Share and Cite
Nitopi, M.A.; Baldantoni, D.; Baldi, V.; Di Stefano, F.; Bellino, A. An Effective Biomonitor of Potentially Toxic Elements in Marine Ecosystems: The Brown Alga Dictyota spiralis. Environments 2024, 11, 51. https://doi.org/10.3390/environments11030051
Nitopi MA, Baldantoni D, Baldi V, Di Stefano F, Bellino A. An Effective Biomonitor of Potentially Toxic Elements in Marine Ecosystems: The Brown Alga Dictyota spiralis. Environments. 2024; 11(3):51. https://doi.org/10.3390/environments11030051
Chicago/Turabian StyleNitopi, Maria Antonietta, Daniela Baldantoni, Vincenzo Baldi, Floriana Di Stefano, and Alessandro Bellino. 2024. "An Effective Biomonitor of Potentially Toxic Elements in Marine Ecosystems: The Brown Alga Dictyota spiralis" Environments 11, no. 3: 51. https://doi.org/10.3390/environments11030051