Article

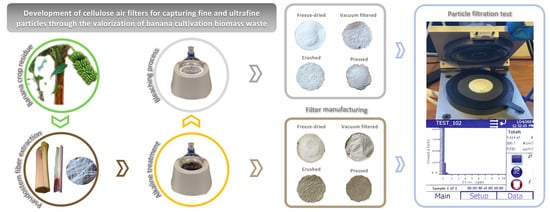
Development of Cellulose Air Filters for Capturing Fine and Ultrafine Particles through the Valorization of Banana Cultivation Biomass Waste

by
Yumara Martín-Cruz
1,
Pablo Bordón
2,*,
Elisenda Pulido-Melián
1,*,
Teresa Saura-Cayuela
1 and
Mario Monzón
2
1
Grupo de Fotocatálisis y Espectroscopía para Aplicaciones Medioambientales (FEAM), Instituto de Estudios Ambientales y Recursos Naturales (i-UNAT), Universidad de Las Palmas de Gran Canaria, 35017 Las Palmas, Spain
2
Departamento de Ingeniería Mecánica, Universidad de Las Palmas de Gran Canaria, 35017 Las Palmas, Spain
*
Authors to whom correspondence should be addressed.
Environments 2024, 11(3), 50; https://doi.org/10.3390/environments11030050
Submission received: 2 February 2024 / Revised: 23 February 2024 / Accepted: 5 March 2024 / Published: 7 March 2024

Abstract

:
Outdoor and indoor atmospheric pollution is one of the major problems that humanity continues to face. As a mitigation pathway, numerous technologies have been developed for air purification, including the use of fibrous filters. In this study, the particle capture efficiencies and pressure drops of air filters manufactured with cellulose pulp extracted from banana pseudostems were studied across three particle size ranges (PM10, PM2.5, and PM1). Two pretreatments were applied, alkaline with soda-antraquinone (alkali-treated pulp) and a subsequent bleaching process (bleached pulp), and four manufacturing processes were tested: crushing, freeze-drying, vacuum filtration, and pressing. In addition, a study varying filter grammage (70, 100, and 160 g·m−2) and pressing pressures (2, 4, 6, and 8 t) was also performed. After conducting these particle tests, the filter manufactured with bleached pulp, having a grammage of 160 g·m−2 and pressed at 4 t, was deemed the optimal individual solution. It demonstrated high particle retention efficiencies across all particle size ranges (with values exceeding 80%), a moderate pressure drop below 1000 Pa, and high thermal stability (degradation above 220 °C). However, combining freeze-drying and two-ton pressing processes yielded improved results (83% for the smallest particles and 89% for others) with approximately half the pressure drop. Based on these results, this study stands as a noteworthy contribution to waste valorization and the advancement of environmentally friendly materials for particle air filters. This is achieved through the adoption of simple and cost-effective technology, coupled with the utilization of 100% natural agricultural waste as the primary manufacturing material.

Graphical Abstract

1. Introduction

Air pollution is a major problem that has been increasing due to industrial and technological development and is the fourth leading cause of death worldwide, with 6.7 million deaths each year [1]. Atmospheric particulate matter (PM) is a complex composite of heavy metals, inorganic compounds, water soluble secondary inorganic compounds (sulphates, nitrates and ammonia), organic compounds (HAPs and COVs), and elemental carbon [2,3,4,5,6,7,8]. PM is one of the most dangerous atmospheric pollutants, with very harmful effects on human health. It causes cardiovascular [6,9], respiratory [10,11,12] and brain diseases [9,13,14], sleep disorders [8], dermal cancer [15], and bone lesions. In addition, PM affects the lymphatic system, causing damage to the spleen [14,16], as well as the digestive system (leading to damage in the liver, pancreas, and gastrointestinal tract) [13,14] and reproductive systems [17]. The extent to which PM is a risk to human health depends not only on its chemical composition, but also the particle size: the finer the particle, the more easily it is able to penetrate into the human body. In the study of air quality, three ranges of particles size are identified: (a) coarse particle, which includes particles with an aerodynamic diameter equal to or less than 10 µm (PM10), with special attention paid to particles with diameters between 10 and 2.5 µm; (b) fine particle, which comprises particles with an aerodynamic diameter equal to or less than 2.5 µm (PM2.5); and (c) ultrafine particle, which comprises particles with aerodynamic diameters of submicron scale (PM1). Particles in the first classification are known as thoracic particles and are retained between the larynx and bronchial tree. The other two inhalable particles lodge in the alveolar region, with ultrafine particles passing directly in the bloodstream [6,18].
The sources of PM are highly varied, which explains its complex chemical composition, as mentioned above. Natural sources include mineral dust from arid areas, such as the Saharan desert [19] and volcanic eruptions [20]. Maritime and vehicular traffic [21,22], industrial activities [23,24], or agricultural activities [25] are examples of anthropogenic sources. In addition, indoor activities are a very important source of PM [26,27]. Sources of indoor air pollution include, among many others, gas or kerosene cooking (especially in developing countries), combustion activities (use of fireplaces, kerosene heater, etc.), cleaning activities (use of air fresheners or cleaning solutions), the infiltration of outdoor pollutants, the use of printers, permanent-marker, and photographic solutions, and even hobbies like carpentry or metal working [27,28,29,30]. The implementation of air purification measures, both indoors and outdoors, will very often be required to stay below the limits established by the World Health Organization (WHO). For PM10, the annual and daily limits are 15 µg·m−3 and of 45 µg·m−3, respectively, and for PM2.5, 5 µg·m−3 and 15 µg·m−3, respectively. Currently, more than 99% of the world’s population is exposed to concentrations above these limits, according to the latest WHO report [1].
There are many technologies that have been developed for PM removal, including scrubbers [31], electrostatic precipitators [32], and air filters [33,34,35,36]. The filtration method consists of the separation of particles by their retention in a porous surface when the gas stream passes through it, via chemisorption and physisorption processes [37]. Fibrous filters are the most used [38,39], and the particle capture efficiency and pressure drop depend on the filtration material (fiber size, surface area, etc.) [36,38]. In recent decades, thermoplastic polymers made from fossil fuels (e.g., polyethylene) or glass fiber [37,40,41,42] have been used as materials for the manufacture of air filters. From such materials, and depending on the manufacturing process, it is possible to achieve particle capture efficiency ranging 50–90% (ePM1, ePM2.5, and ePM10 in industrial filters according to ISO 16890 standards) [43]. Moreover, these materials can be used to produce filters with very high particle retention efficiency for particles larger than 0.3 μm, exceeding 99% in the case of HEPA-type filters, with pressure drops below 300 Pa [44]. However, these filters have significant disadvantages due to their high cost and non-biodegradable nature [37,41]. As an alternative, biopolymer-based air filters are now being manufactured as they are biodegradable, easily available, and recyclable. In addition, they have more functional groups that increase the particle capture efficiency [45]. Keratin, chitin, and cellulose are examples of biopolymers used in air filter manufacturing [36,37,45,46,47]. In this context of biomass utilization, various studies have focused on developing filters using wood biomass, achieving particle retention efficiencies ranging from 70% to 97% [48] by incorporating corn proteins and nanocellulose. Other biomass combinations derived from Konjac glucomannan, gelatin, starch, and wheat straw have been successfully tested to produce filtering aerogels with efficiencies exceeding 99% in enclosure filtration studies [49]. Lignin aerogels have also been developed to achieve high particle filtration efficiencies (exceeding 99%) with low pressure loss, albeit through complex manufacturing processes [50].
Cellulose is the most widely used biopolymer due to its abundance in nature. Agricultural waste is one of the raw materials used to obtain it. In the case of banana crops, the cellulose is extracted in larger quantities from banana pseudostem [46,51,52]. In the Canary Islands (Spain), where the present study was carried out, banana plantations are widespread and, with a production of 347,378 ton·year−1 in 2022, represented 84% of total agricultural production (Ministry of Agriculture, Fisheries and Food of the Government of Spain, 2022). This results in a large amount of banana pseudostem waste as the banana tree only bears fruit once [51], with a production of around 17 million tons per year in the Canary Islands. This biomass has been subject to analysis in various applications, such as the use of its fibers as reinforcement in polymeric materials [53,54,55], the extraction of subcomponents [56,57], the textile industry [58,59], or the generation of biochar for industrial applications [60,61,62], among others. Another potential application could be found in the extraction of its cellulose for use in filtration purposes, allowing for the substitution of conventional raw materials based on non-renewable materials, such as those derived from fossil fuels.
This study aims to accomplish two primary objectives: firstly, to enhance the value of agricultural residue by manufacturing air filters with cellulose extracted from banana pseudostems; and secondly, to assess various manufacturing methods to identify a simplified approach for filter production. The selected methodology should meet two critical criteria: ensuring high efficiency in capturing fine and ultrafine particles, while simultaneously minimizing pressure drop.

2. Materials and Methods

2.1. Obtaining Banana Pseudostem Pulp

The banana fibers were obtained from banana pseudostem (Dwarf Cavendish variety) using a slitting machine designed and patented by the Integrated and Advanced Manufacturing Research Group [63], where the pseudostem fibers are mechanically separated by different and automated steps. Extraction of the cellulose pulp from fibers was carried out using a delignification method with soda-anthraquinone (alkali treatment). A large amount of lignin was removed during this process (about 70%), enabling purer cellulose fiber to be obtained. For this, NaOH, deionized water, and anthraquinone, which acts as a catalyst, were added to the fibers, for a reaction time of 2.5 h at 160 °C. At the end of this time, the alkali-treated pulp obtained was washed with water, and then crushed using a ZM 200 ultra-centrifugal mill (Retsch GmbH, Haan, Germany) with a built-in sieve with a 0.5 mm light passage. For the air filter manufacturing, only the centrifuged pulp was used (homogeneous and fine pulp).

Bleaching Process

As a secondary treatment, and in a second variety of filters, a bleaching process was applied to the alkali-treated pulp to remove as much of the remaining lignin and hemicellulose as possible and to analyze potential filtration improvements. The procedure is as follows: (1) 160 mL of 0.3 M NaClO2 was added to 1 g of pulp, as well as 2 mL of glacial acetic acid to adjust the pH to approximately 4.5. The bleaching reaction was carried at 70 °C for an hour and with slight magnetic stirring; (2) the bleached pulp was filtered under vacuum using a Buchner funnel and Whatman filter paper grade 1. It was then washed with abundant water until a neutral pH was achieved; and (3) the bleached pulp was dried at 35–40 °C in a stove and also crushed as described in Section 2.1.

2.2. Pulp Characterization

The physical characterization of both the alkali-treated and bleached pulp was carried out using the following three techniques. Scanning electron microscope (SEM) images were taken with a Hitachi TM3030 scanning electron microscope (Hitachi High-Tech Corporation, Tokyo, Japan) operating at 15 kV. Samples were Au/Pd coated using a Quorum SC7620 mini sputter coater (Quorum Technologies Ltd., Laughton, UK). Fourier transmission infrared spectroscopy (FTIR) was applied using a Thermo Scientific infrared spectrophotometer (Thermo Fisher Scientific Inc., Waltham, MA, USA) in the range of 400 to 4000 cm−1 and 32 scans. The disk was prepared with KBr at a pressure of approximately 2 t. Finally, thermogravimetric analysis (TGA) was performed using a NETZSCH STA 449 F3 Jupiter (NETZSCH-Gerätebau GmbH, Selb, Germany). The samples were weighed in alumina crucibles and heated from 40 °C to 900 °C, with a heating rate of 40 °C/min and in an inert atmosphere, with a nitrogen flow rate of 20 mL·min−1.
Table 1 shows each of the processes carried out for the quantification of the structural components of the alkali-treated pulp as well as the moisture and ash content. Each one was performed in triplicate.

2.3. Manufacture of Air Filters

A first generation of filters with a grammage of 100 g·m−2 (typical filter grammage) were manufactured using both alkali-treated pulp and bleached pulp with four manufacturing process variants (Figure 1): crushing, vacuum filtration, pressing, and freeze-drying. For the first variant, the crushed pulp (as described in Section 2.1) was molded into a circular shape using a Petri plate, after being previously moistened to facilitate its handling. In the second variant, the pulp was homogenized in 20 mL of deionized water under magnetic stirring for five days and filtered under vacuum with a Buchner funnel at a vacuum pressure of 8 mbar and using a filter with Whatman filter paper grade 1. After filtration, the filters were dried in a stove at about 30 °C for 24 h. In the third variant, the pulp was placed in a Petri place to acquire the circular shape and pressed using a hydraulic press, applying a pressure of 8 t. As in the case of crushed filters, the pulp was pre-wetted. Finally, in the fourth variant, the freeze-drying technique was carried out, which consists of freezing the sample and removing the water by sublimation under vacuum conditions (0.3 mbar). The pulp was homogenized following the same procedure described for the filtered filters. The resulting mass was poured into a Petri place and was placed in the freeze-dryer, with a freeze temperature of −57.2 °C. Figure 1 shows the filters resulting from each process, manufactured in triplicate.
A second generation of filters was developed based on the first-generation filters with the best results, varying filter grammage for a more in-depth analysis. Finally, with the best filter obtained (in terms of particle capture efficiency results), a third and final generation was developed by modifying the main variable of its manufacturing process to optimize the filtration results.
While the filter grammage has been established as the basic variable for comparison, the average thicknesses of each filter type were measured using a Mitutoyo digital micrometer, with 5 measurements taken for each of the 3 replicas. For the first generation of filters, with a grammage of 100 g·m−2, mean thicknesses of 0.22, 0.39, and 4.77 mm were recorded for pressed (8 t), filtered, and freeze-dried filters, respectively. As anticipated, the lyophilization process resulted in porous filters with greater thickness. The reduction in weight (70 g·m−2) led to a significant decrease in thickness for all filters, reaching thicknesses of 0.17 mm for pressed and filtered filters, and 4.03 mm for freeze-dried filters. Conversely, increasing the weight to 160 g·m−2 only affected the thickness of pressed filters (0.32, 0.34, 0.42, and 0.45 mm for pressing pressures of 8, 6, 4, and 2 t, respectively), while lyophilized filters remained within the same thickness range.

2.4. Development of Filter Test Bench

The manufactured filters were tested using the test bench depicted in Figure 2, which was developed based on the following standards: UNE-EN 149:2001+A1:2010, UNE-EN 13274-7:2020 and NIOSH TEB-APR-STP-0003/0007/0059 [64,65,66]. However, due to the low flow rate required in this case, a similar configuration developed by the Massachusetts Institute of Technology (MIT) was selected.
The di-ethyl-hexyl-sebacat (DESH) aerosol was chosen to study the capture efficiency, generated using an ATM 221 (TOPAS GmbH, Dresden, Germany) aerosol generator with an inlet air pressure of 0.5 bar. Upstream and downstream particle counting was carried out, alternatively, with an optical particle sizer (OPS), model 3330 (TSI). Both particle concentration and particle size distribution were measured over a range of 0.3 to 10 µm, with a size resolution < 5%. The pressure drop was measured with a Belimo 22ADP-184 differential pressure sensor (BELIMO Ibérica de Servomotores S.A., Madrid, Spain). The passage diameter of the filter holder was 31.8 mm, with an aerosol flow rate of 4.5 L·min−1 (regulated with a flow meter and rotameters). The duration of each particle count was 10 min at both inlet and outlet, carried out in triplicate for each filter.
Table 2 shows the particle size ranges measured in each test, selected based on ISO 21501-4:2018 (Determination of particle size distribution-Single particle light interaction methods-Part 4: Light scattering airborne particle counter for clean spaces. Amendment 1). To better analyze the values of the capture efficiencies, we considered equivalent particle size ranges following the selective sampling criterion, as shown in Table 2. In this way, we evaluated the following:
  • Capture efficiency of particles with an aerodynamic diameter between 0.3 and 10 µm (PM10), corresponding to global efficiency of the filters;
  • Capture efficiency of particles with an aerodynamics diameter between 0.3 and 2.5 µm (PM2.5), evaluating the retention of fine particles;
  • Capture efficiency of particles with an aerodynamics diameter between 0.3 and 1 µm (corresponding to the smallest particles, the most hazardous, and referred to in this work as PM1).
Although the applications and types of air particle filters are extensive, in order to establish a comparative framework with the developed filters and analyze their potential practical application, two commercial filtering elements made from non-biobased materials have been tested. The first filtering element corresponds to a certified VP1 IIR surgical mask according to UNE-EN 14683:2019 (grammage 77 g·m−2), manufactured using different layers of polypropylene. The second one is a high-efficiency multipurpose glass microfiber filter Whatman GF/A CAT 1820-061 (Whatman PCL, Kent, UK) with a grammage of 105 g·m−2.

3. Results and Discussion

3.1. Pulp Characterization

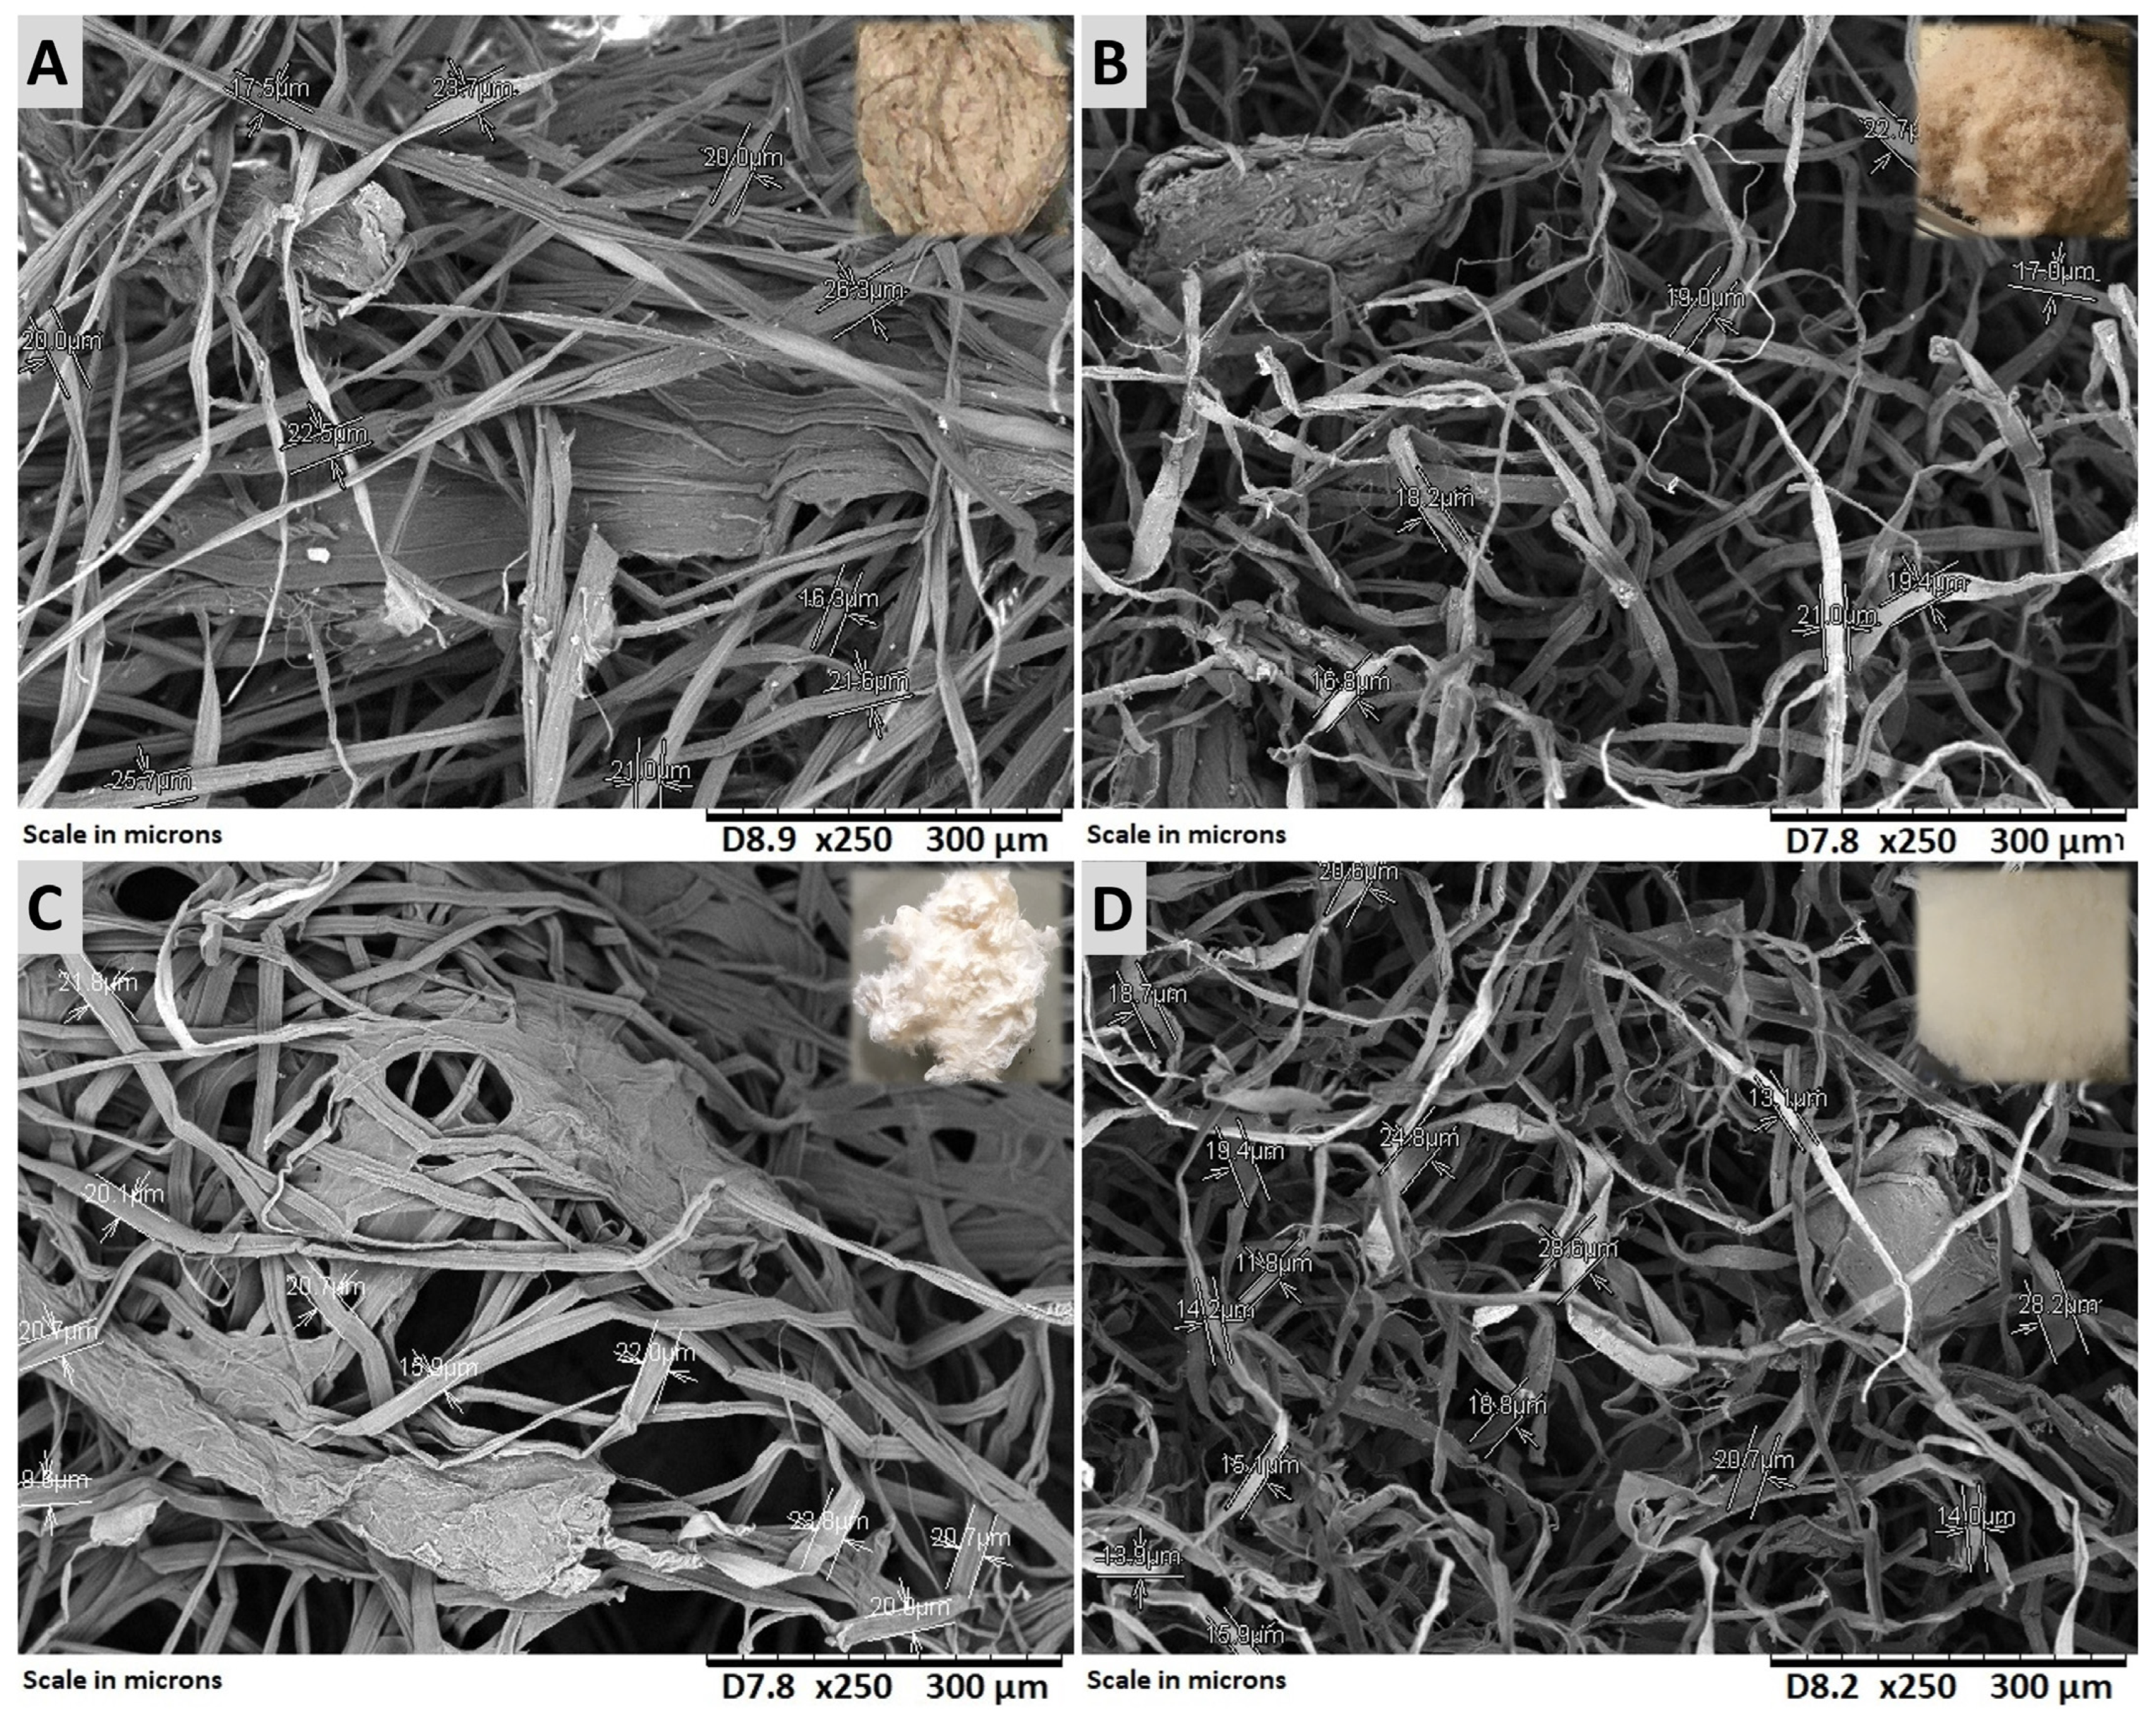
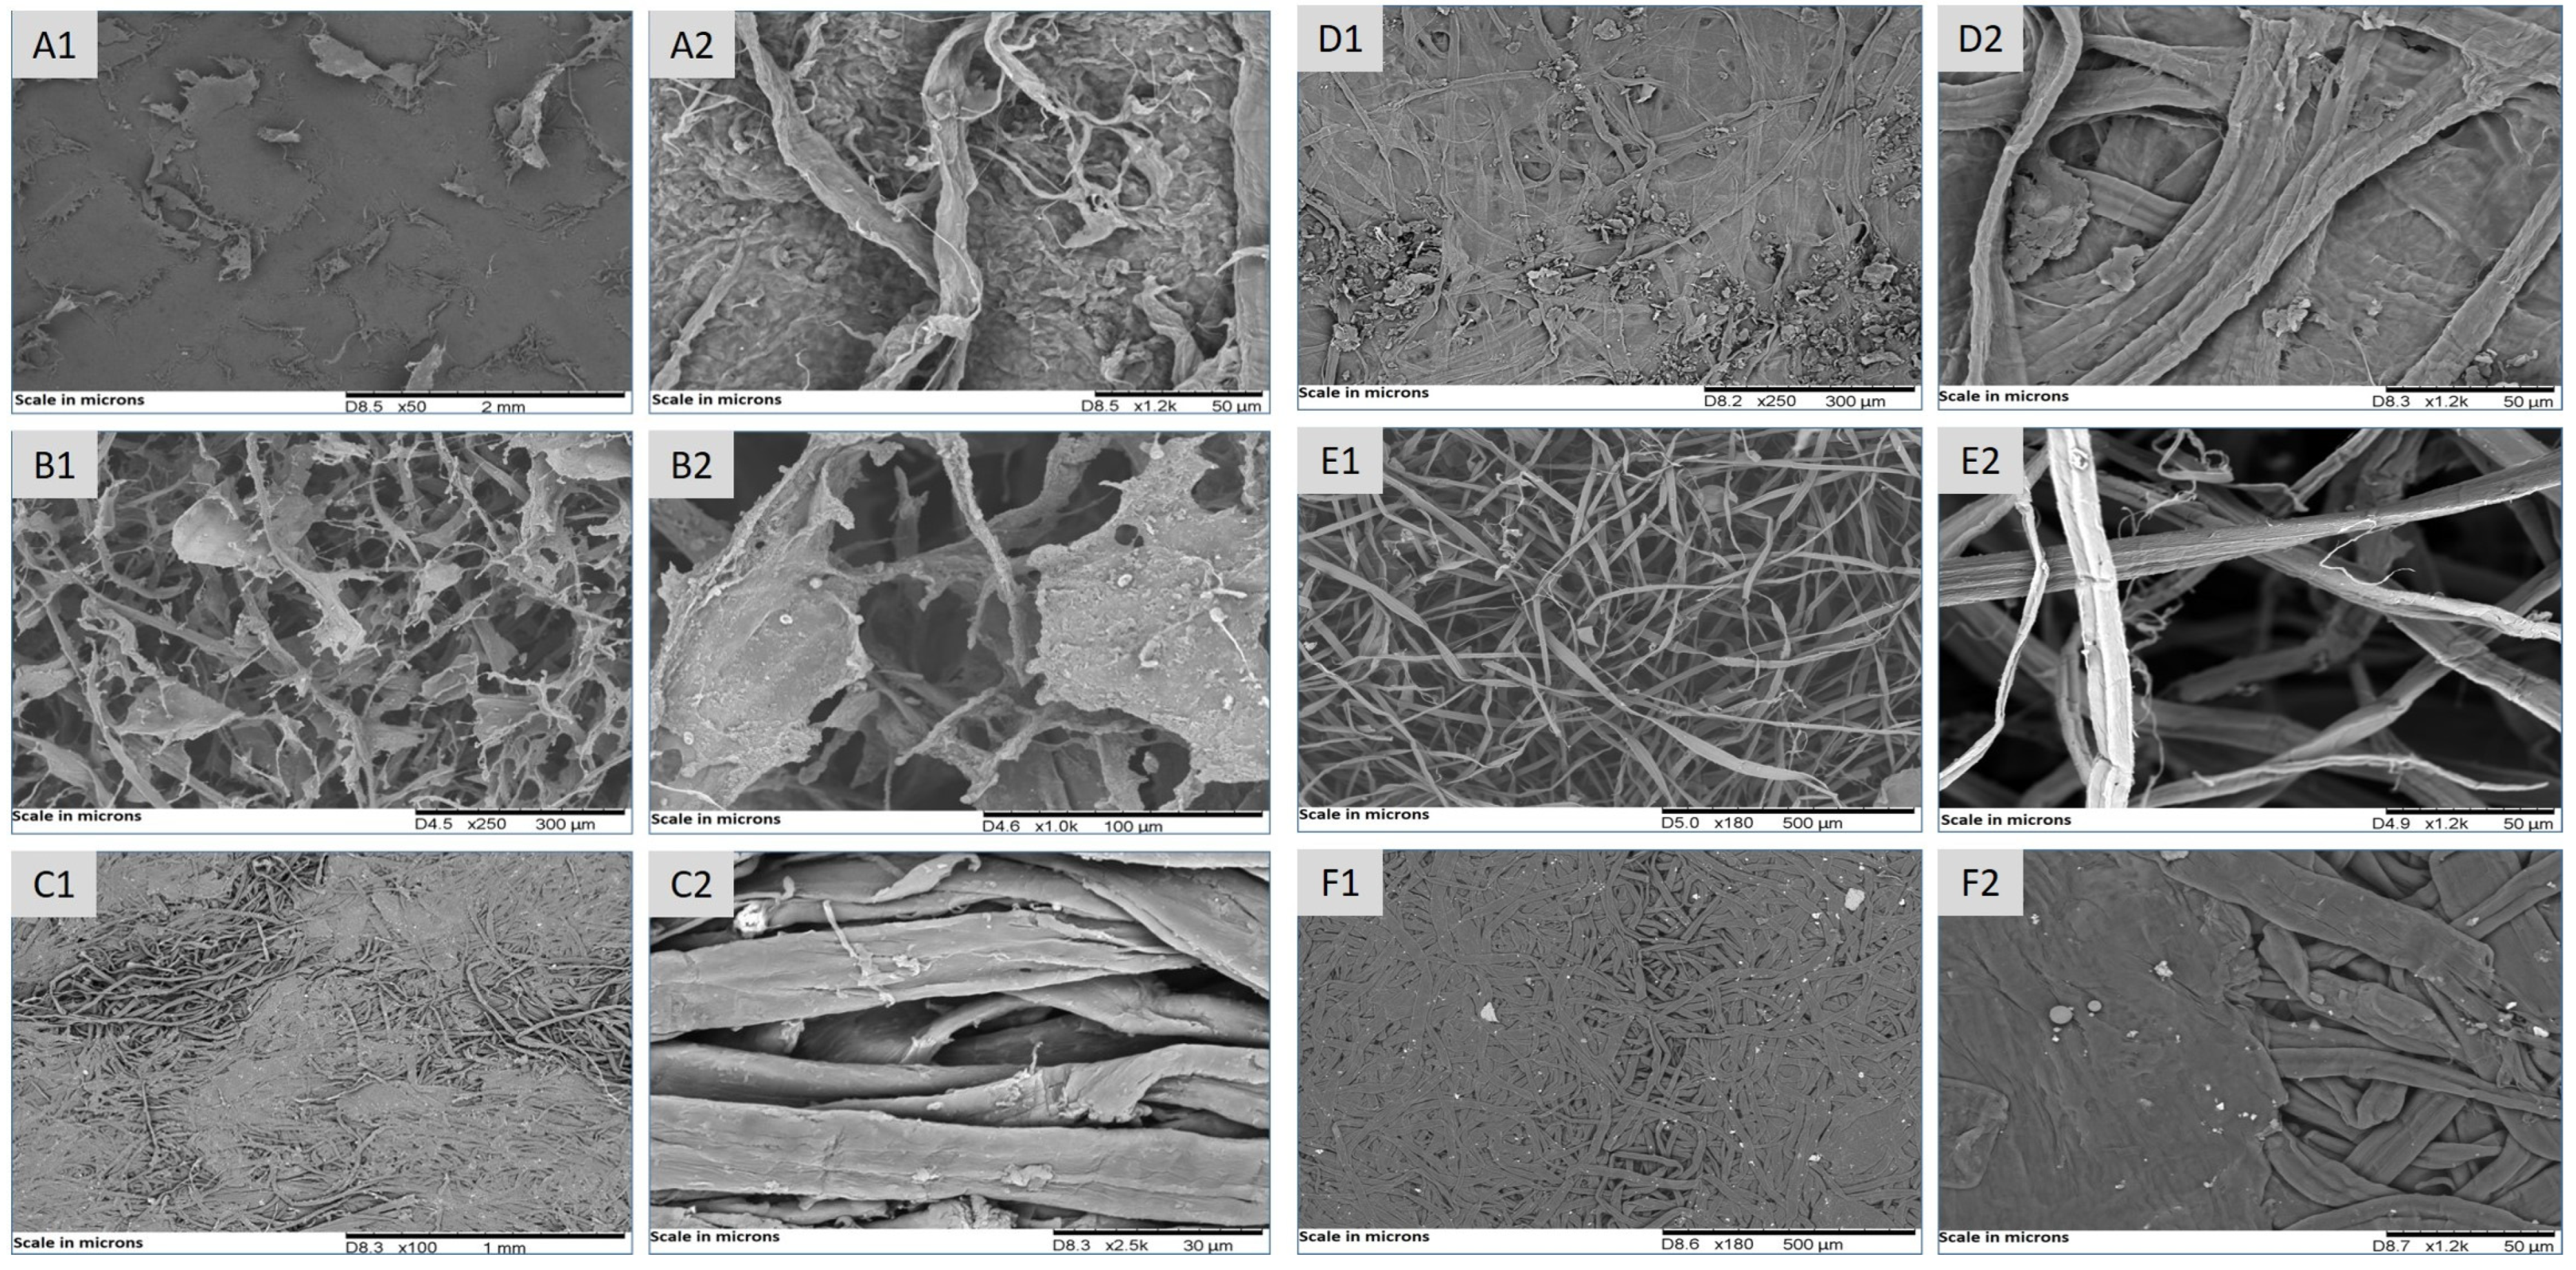
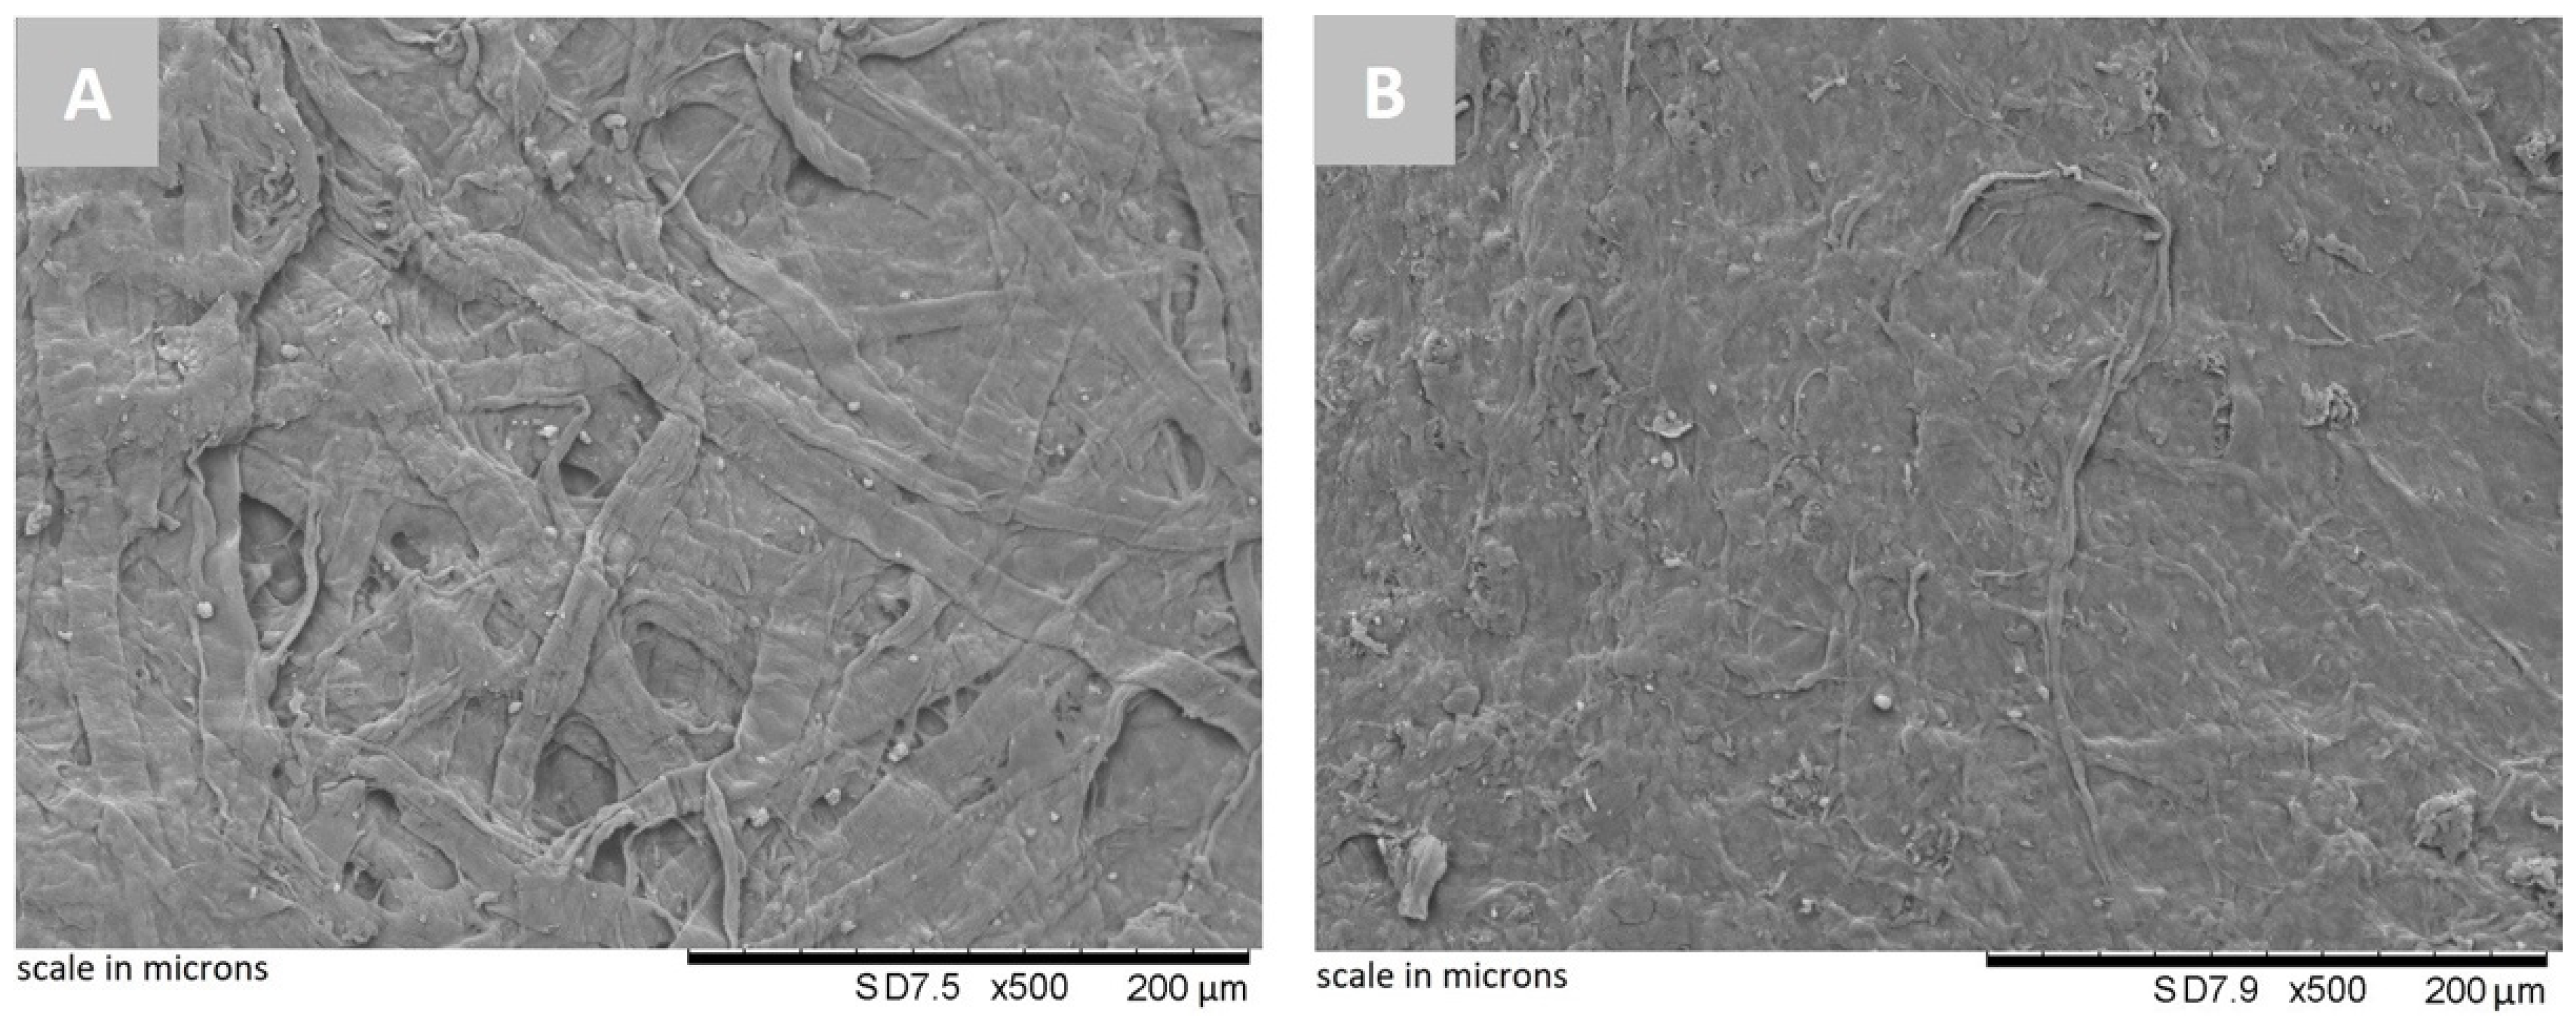
3.1.1. Morphological Analysis

Figure 3 shows SEM analysis images of alkali-treated and bleached pulp. In the case of uncrushed alkali-treated pulp (Figure 3A), fiber clumps were observed, possibly due to pulp components such as lignin or hemicellulose which act as natural glue for cellulose fibers. In the case of uncrushed bleached pulp (Figure 3C), the fiber aggregates were also observed, although they were less significant than in the alkali-treated pulp possibly due to the removal of a large amount of the alkali-treated pulp components during the bleaching process. After the crushing process, the fibers in both the alkali-treated pulp and bleached pulp were freer (Figure 3B,D), with the presence of some granules which may correspond to polycondensation of the material by the sieving process or inorganic minerals.
A semi-quantitative analysis of these granulates was performed, and metals such as manganese, silicon, and calcium were detected in the case of the alkali-treated pulp (Figure 4A). The same analysis only revealed the presence of carbon and oxygen in the case of bleached pulp (Figure 4B), with the metals possibly removed during the bleaching process. Fiber size was between 15 and 20 microns, with no changes observed after the bleaching and crushing processes.

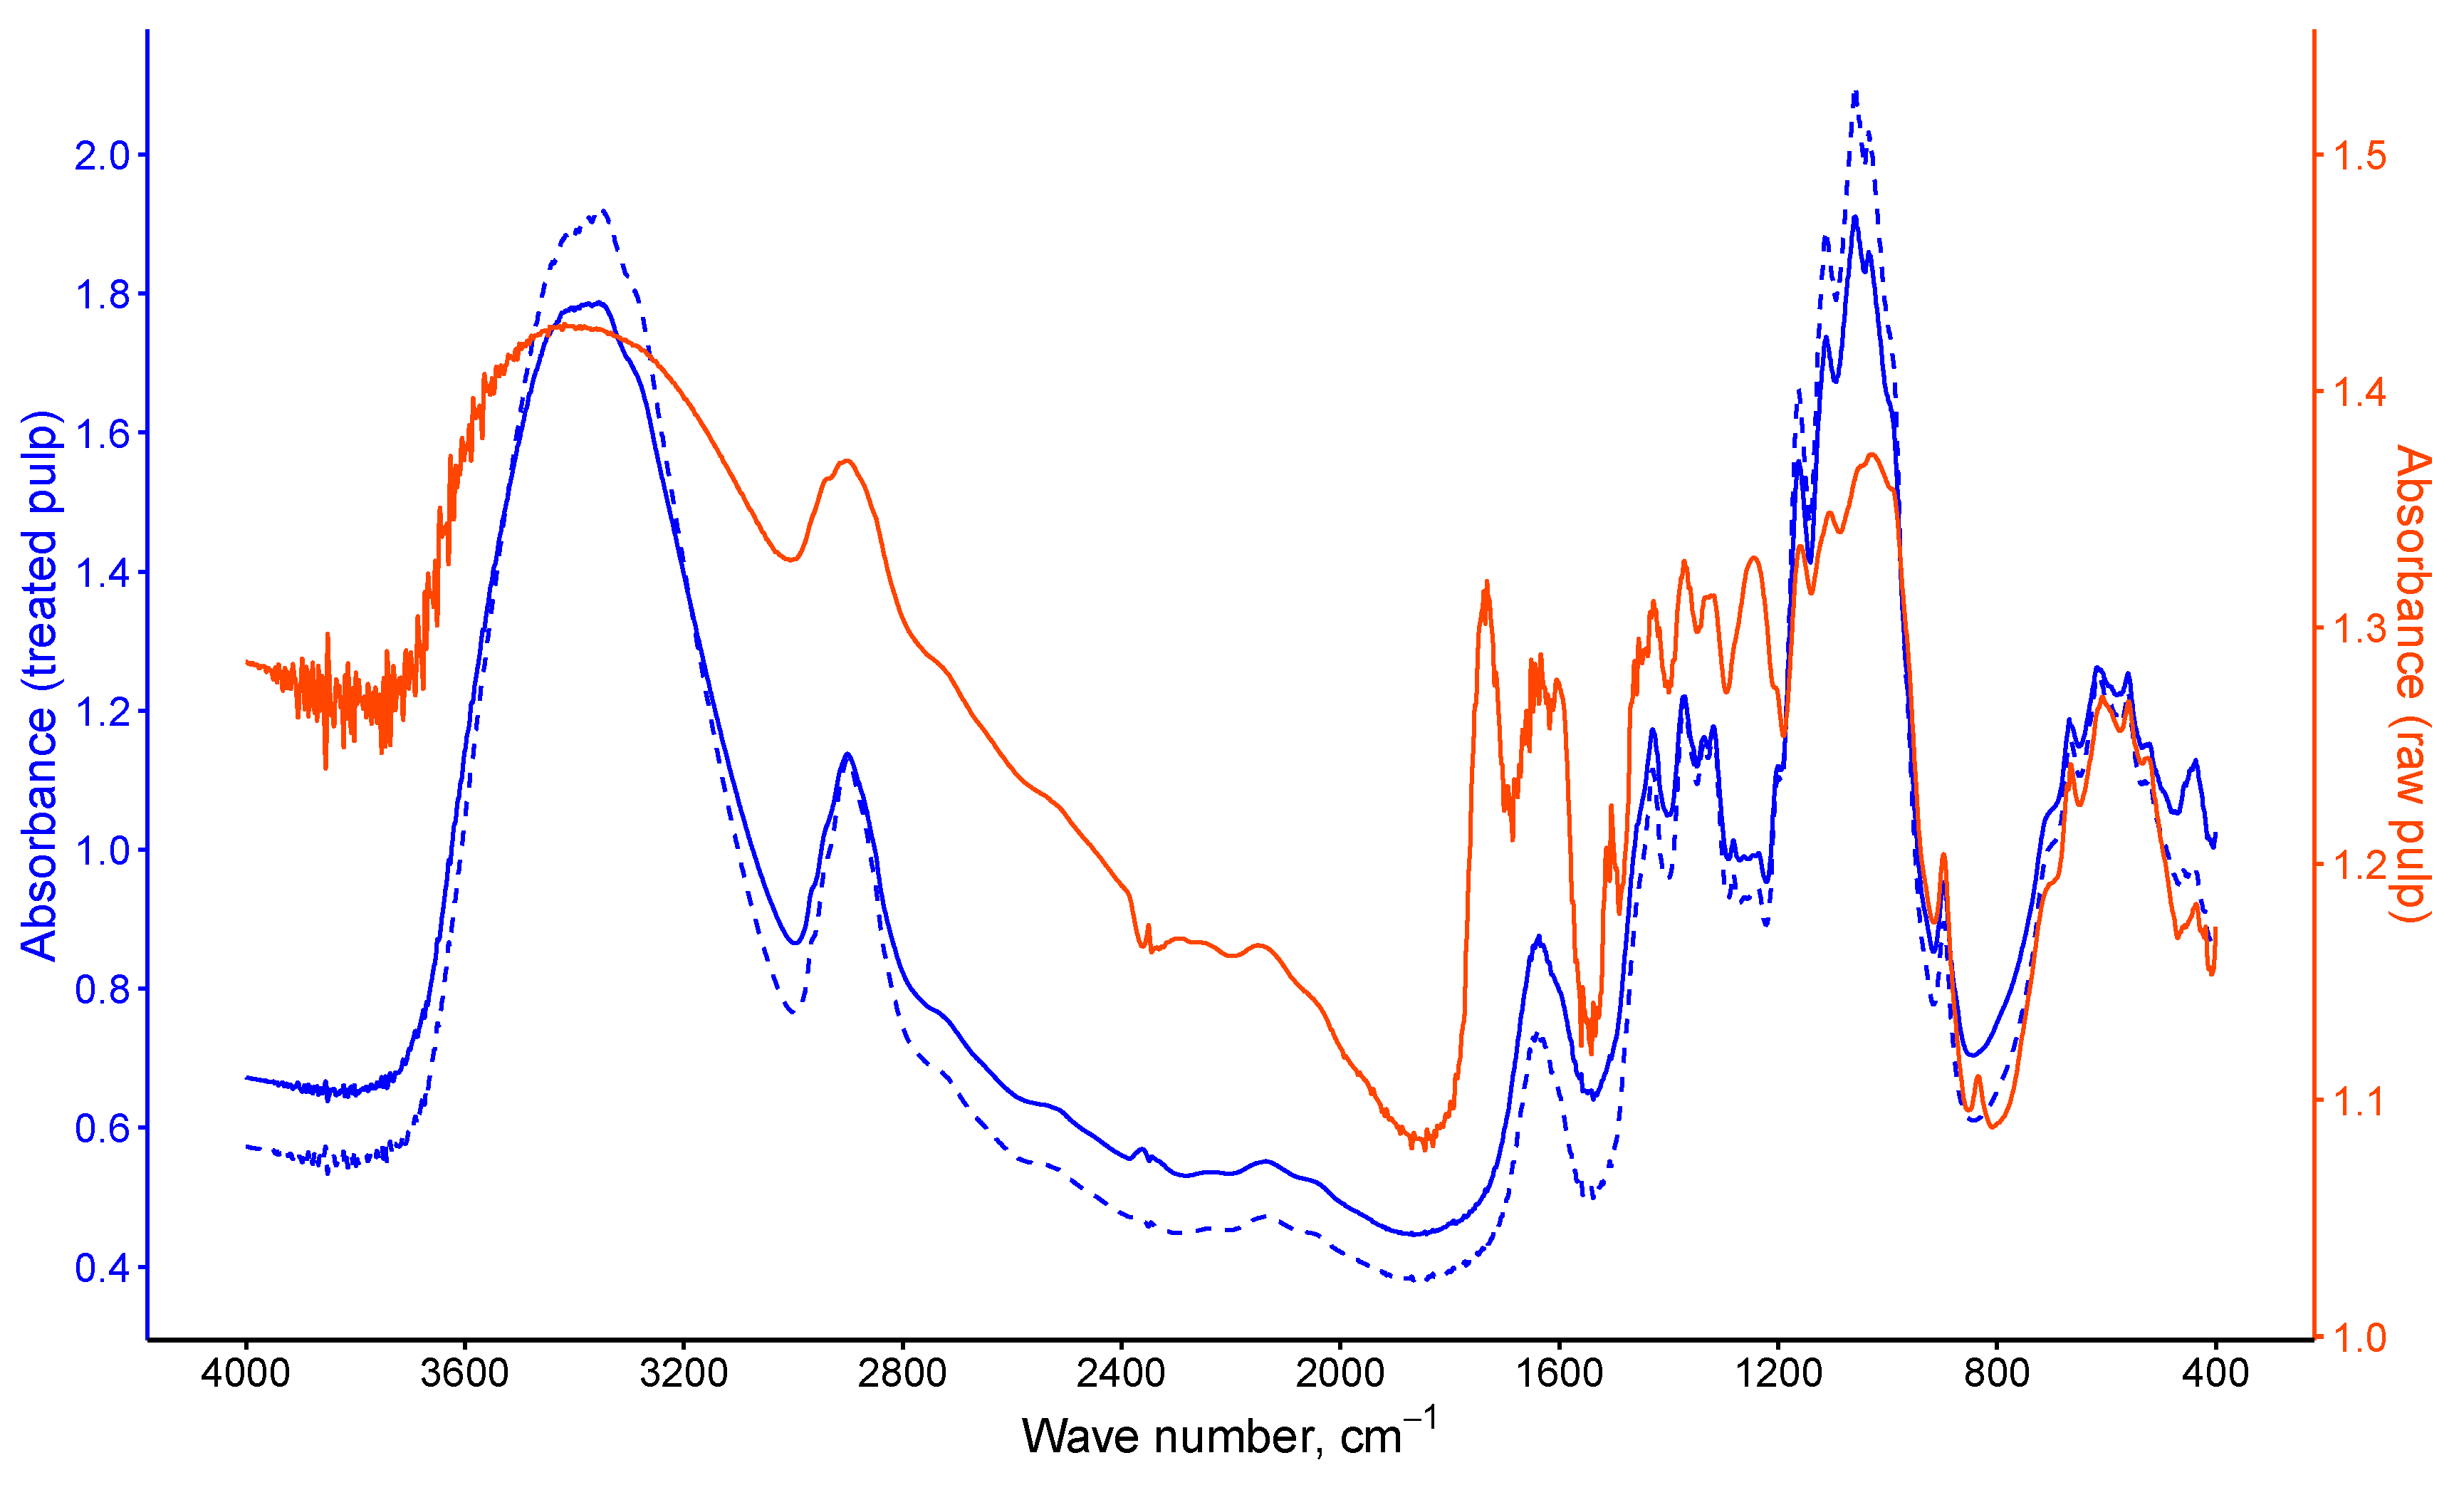
3.1.2. FTIR Analyses

Figure 5 shows the FTIR spectra of the raw, alkali-treated, and bleached pulp. As the banana pseudostem fibers were subjected to an alkaline treatment catalyzed with anthraquinone, the absorption bands at 1612 cm−1 and 1509 cm−1, detected in the raw pulp spectrum and corresponding to the stretching of the C-C double bonds of the aromatic rings and the aromatic skeletal vibration of polyphenolic groups characteristic of lignin, were not observed in both the alkali-treated and bleached pulp. Although the alkali-treated pulp was colored, indicating that the lignin was still present, most of it had been removed in the described pretreatment, leaving a concentration below the detection limit of the equipment. As a result, the spectra of the alkali- treated and bleached pulp are very similar, with the following absorption bands. The broad band observed at 3000–3600 cm−1 corresponds to the stretching vibration of hydroxyl groups of cellulose, hemicellulose, lignin, and other organic compounds of the fibers. Asymmetrical and symmetrical stretching vibrations due to CH links are identified with the absorption band at 2900 cm−1. Another band was observed at 1637 cm−1, corresponding to the bending-angular deformation of the water molecules absorbed in the fibers. The absorption peaks located between 1200 and 1400 cm−1 were due to symmetrical bending of the CH2 group, the deformation in the OH plane of cellulose and the skeletal vibration of the pyranose ring of cellulose. The bands observed between 950 and 1200 cm−1 were characteristic of the symmetrical and asymmetrical stretching of the C-O-C ether bond of the anhydropyranosic cycle, C-C, C-OH, C-H ring, and side group vibrations. Finally, the band around 600 cm−1 corresponded to the out-of-plane deformation of the C-OH group of cellulose.

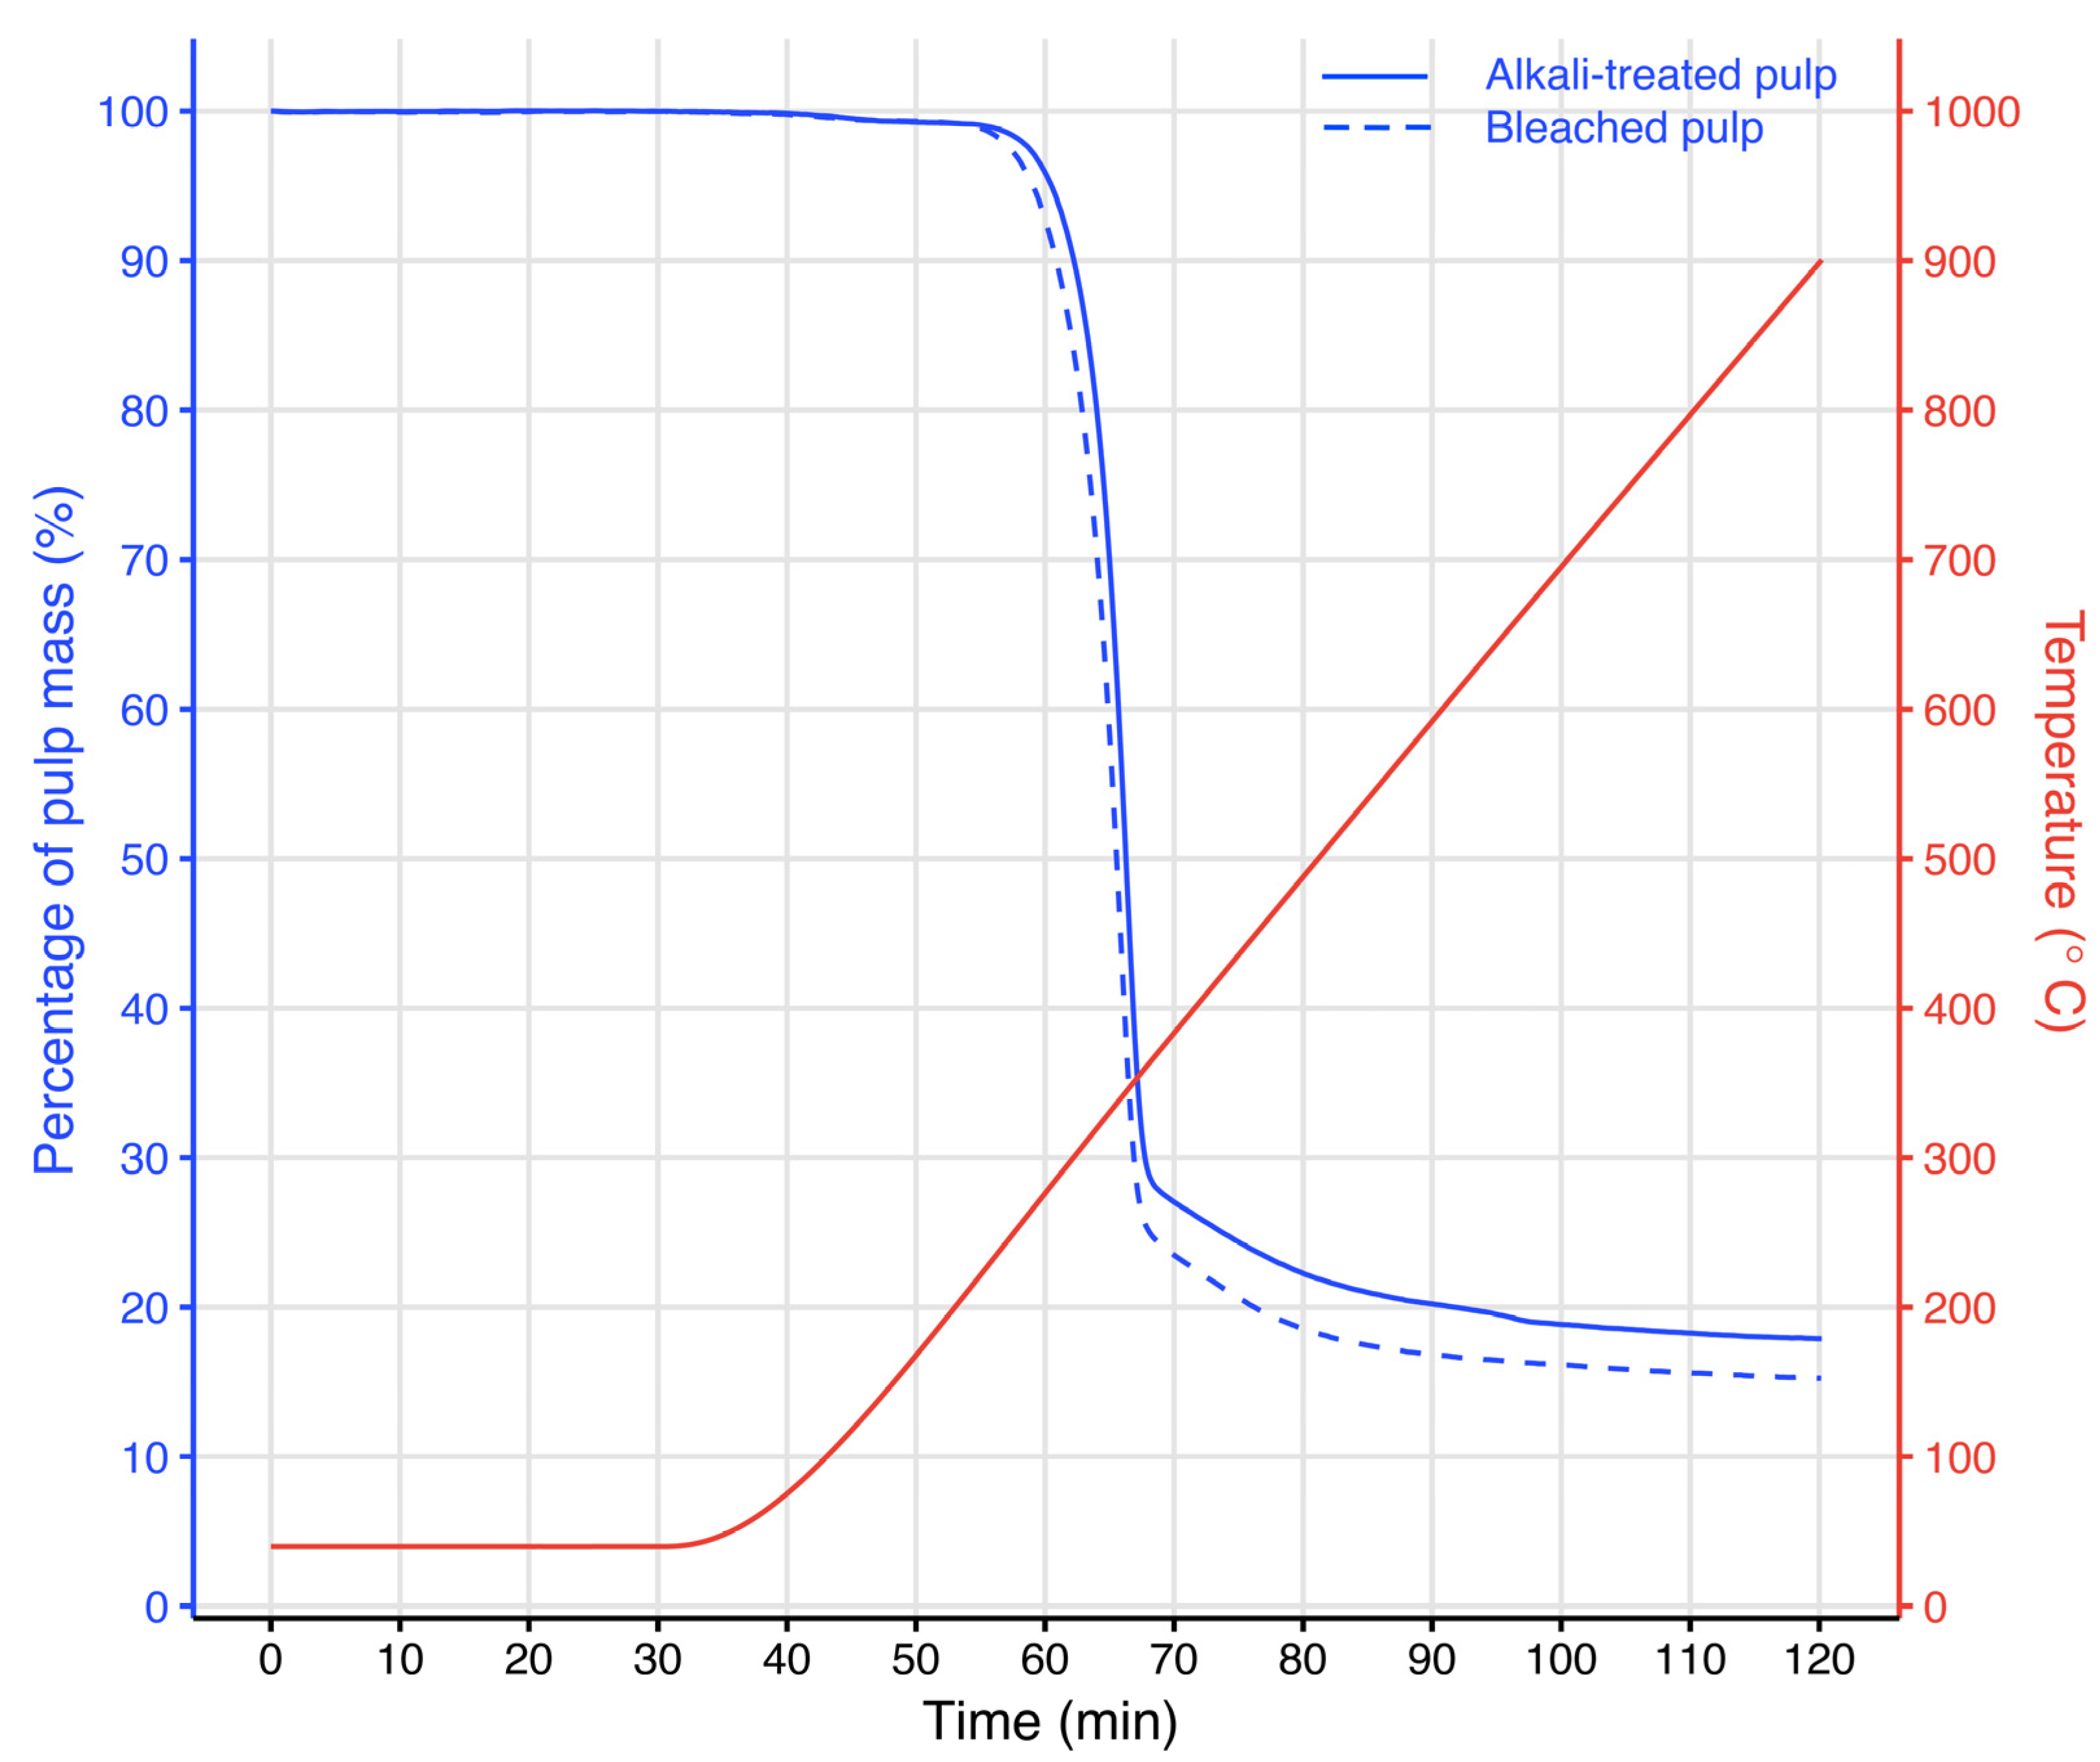
3.1.3. Thermogravimetric Analysis

Figure 6 shows the curves obtained from the TGA analysis of the alkali-treated and bleached pulp. The thermal behavior in both cases was very similar, with mass loss starting a few minutes earlier in the bleached pulp. Three stages of thermal degradation were observed. At the beginning, a very slight mass decrease of about 1% was observed between 75.3 °C and 221.6 °C. This corresponded to the loss of the remaining moisture. During thermal conditioning, the alkali-treated pulp lost 1.16 mg and the bleached pulp lost 0.91 mg, a loss of about 7% in both cases. This indicates that most of the moisture was removed during this conditioning, being totally eliminated at 221.6 °C. As the temperature increased from this value, the mass loss was quite significant in both samples, with a decrease equal to 71% and 75% in the alkali-treated pulp and bleached pulp, respectively, at about 362 °C. In this temperature range, most of the cellulose and hemicellulose content was degraded. In addition, degradation of the remaining lignin in the alkali-treated and bleached pulp was started. Thermal degradation in the last stage was slower and less marked, with a decrease of 11.1% in the pulp and 9.8% in the bleached pulp. In this stage, the waxes of the fibers were degraded in conjunction with the rest of the lignin, which originates ash as residue. The total mass loss in the bleached pulp was slightly higher, in the order of 3%, indicating a lower thermal stability after the bleaching process.

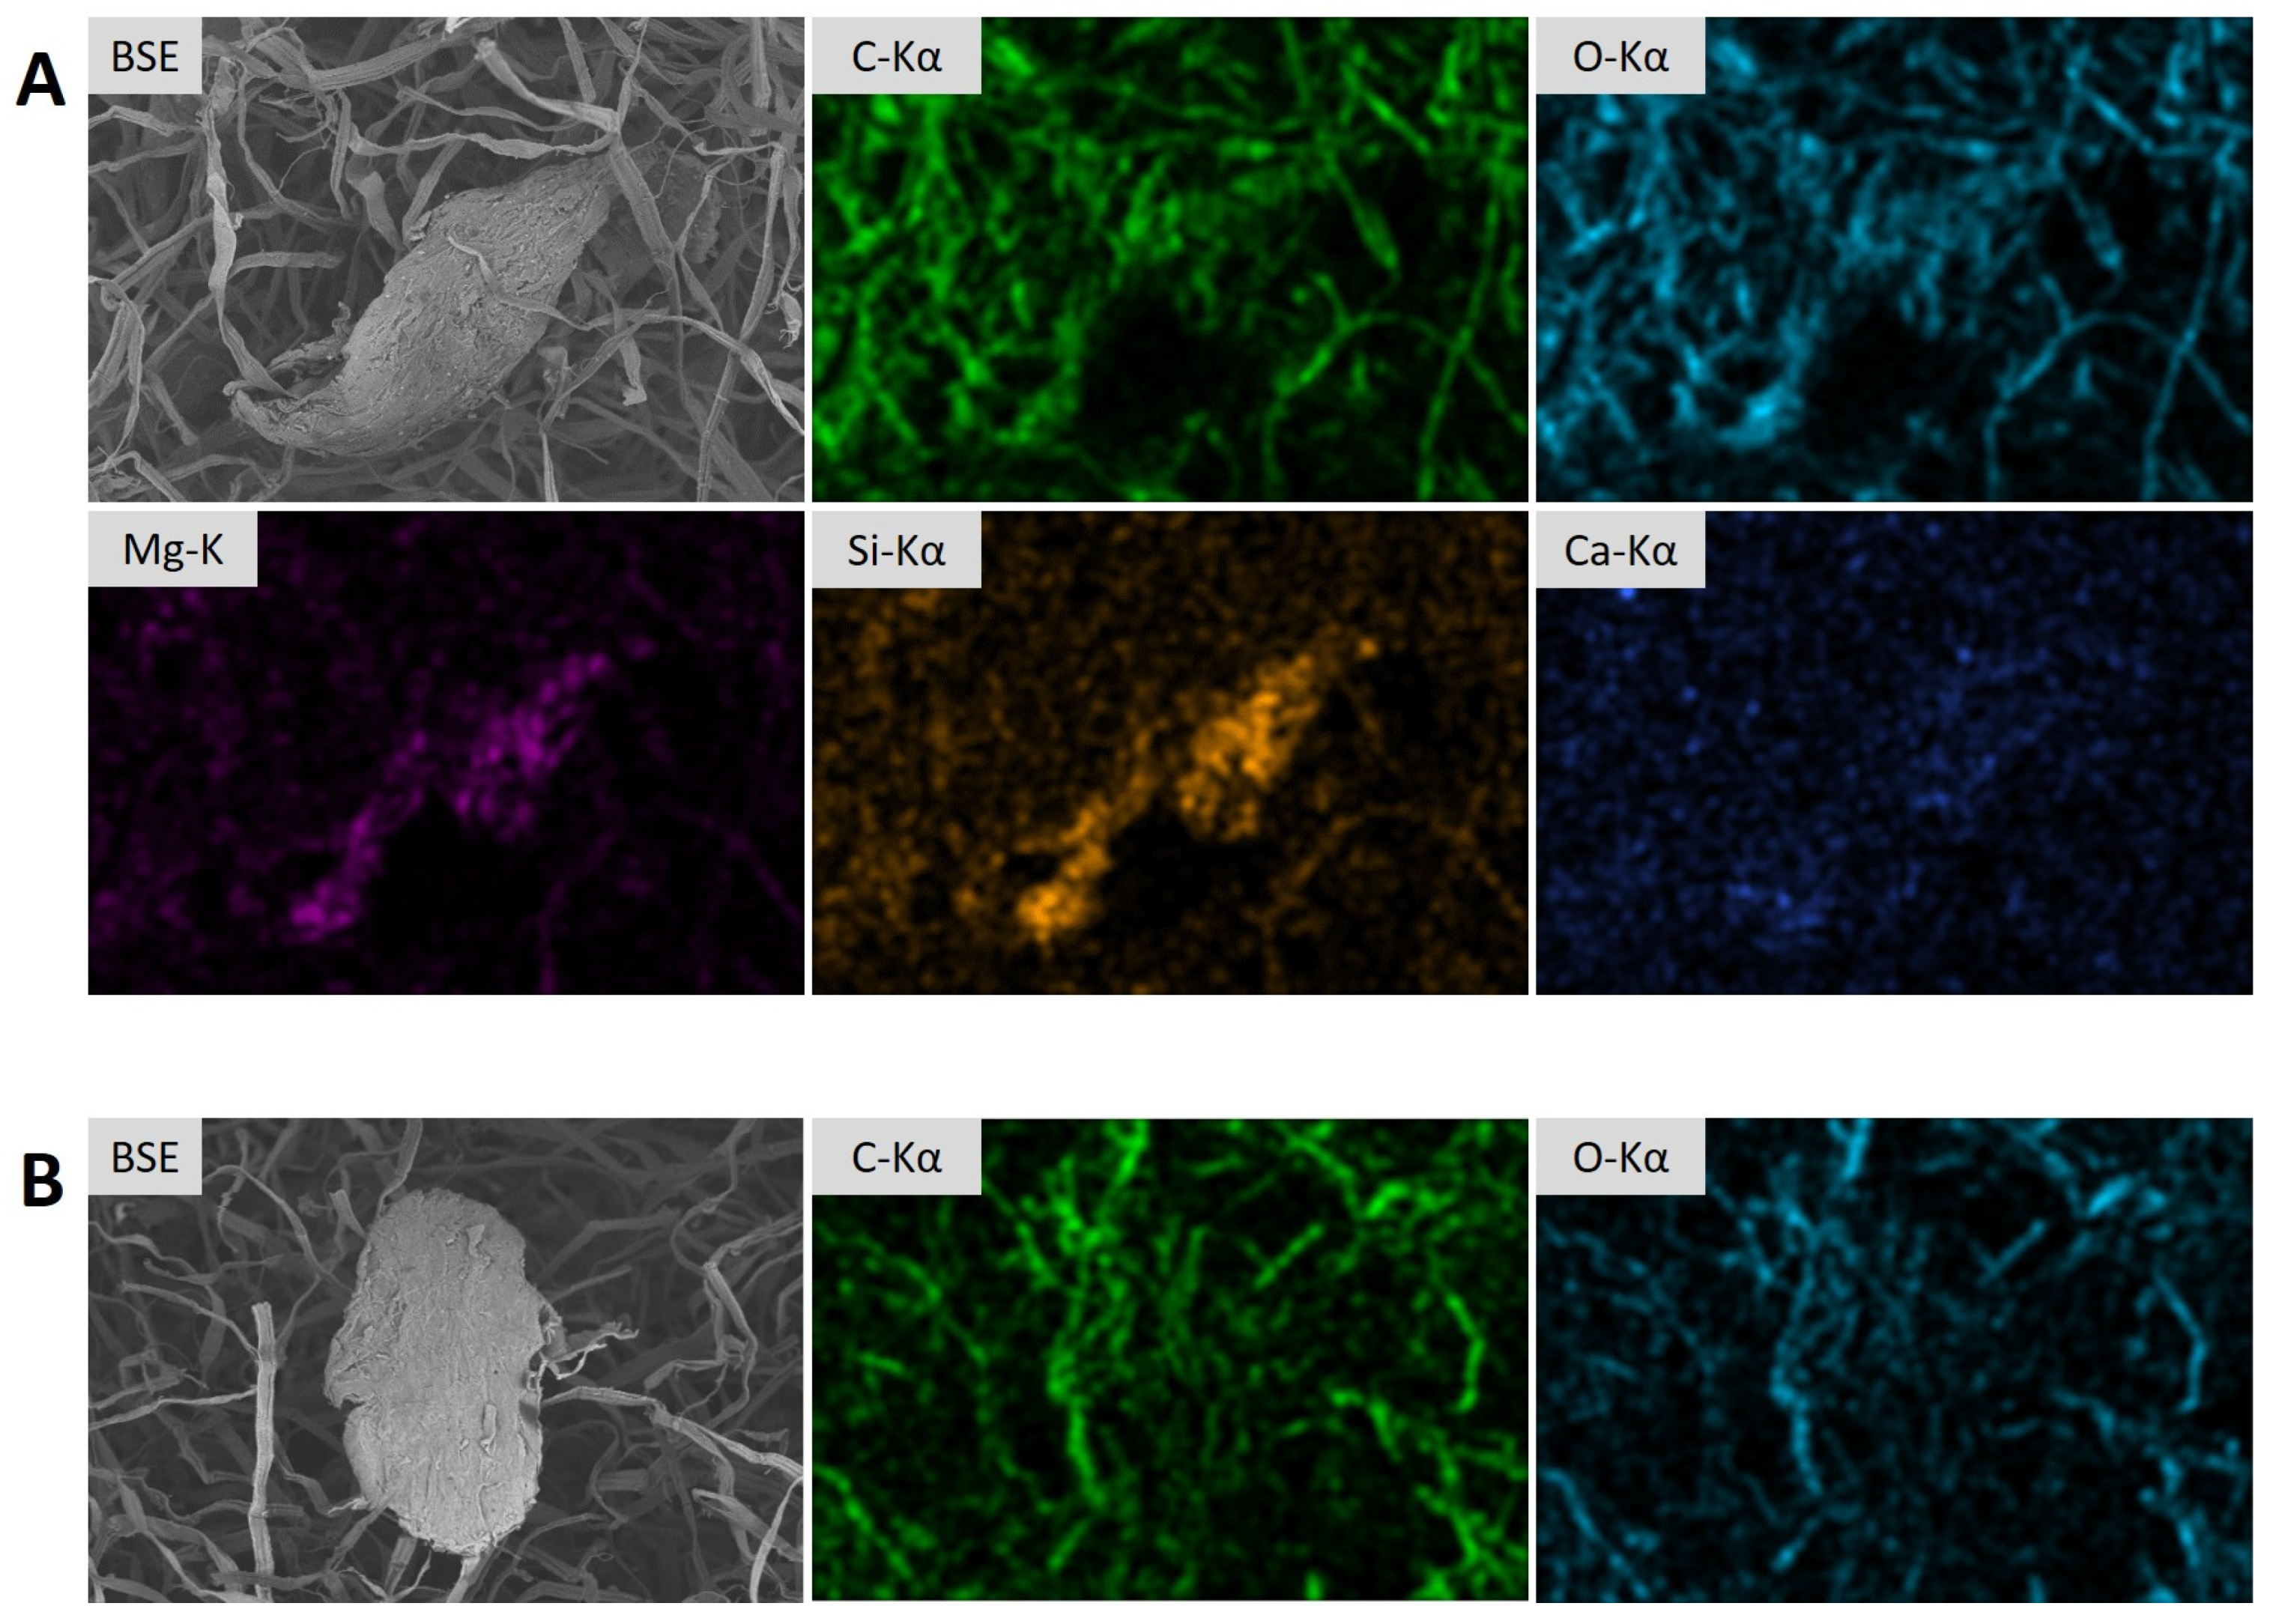
3.1.4. Chemical Composition

Table 3 shows the average percentage composition of each component analyzed in the alkali-treated pulp. This characterization was made with respect to dried mass of alkali-treated pulp. Low levels were obtained in the case of the pectin, lignin, and extractives in comparison with other pulp characterization studies. This can be attributed to the pulp used in this study for filter manufacturing being subjected to an alkaline process for delignification with NaOH and anthraquinone. Comparing the results with those from the study conducted by Diarsa and Gupte [67], in which a similar pretreatment process was carried out, the lignin values were more similar, ratifying the effect of the described pretreatment. However, the lignin composition was approximately half as low. The pulp lost color during pectin quantification, which might have resulted in a loss of lignin in conjunction with pectin. Ash content was high compared to that found in Diarsa and Gupte [67]. A plausible cause may be the introduction of metals such as Ca or Mg into the banana pseudostem through the irrigation, considering the high hardness of Canary Islands waters. Sb, Na, and S were also detected in the tests. In the case of Na, in addition to its possible introduction via irrigation water, its presence may be due to residue from the delignification process with NaOH and anthraquinone. The presence of Sb may be due to external contamination, and the origin of S may be the use of fertilizers. The undetermined percentage may refer to waxes and other organic compound content of the banana pseudostem fibers.

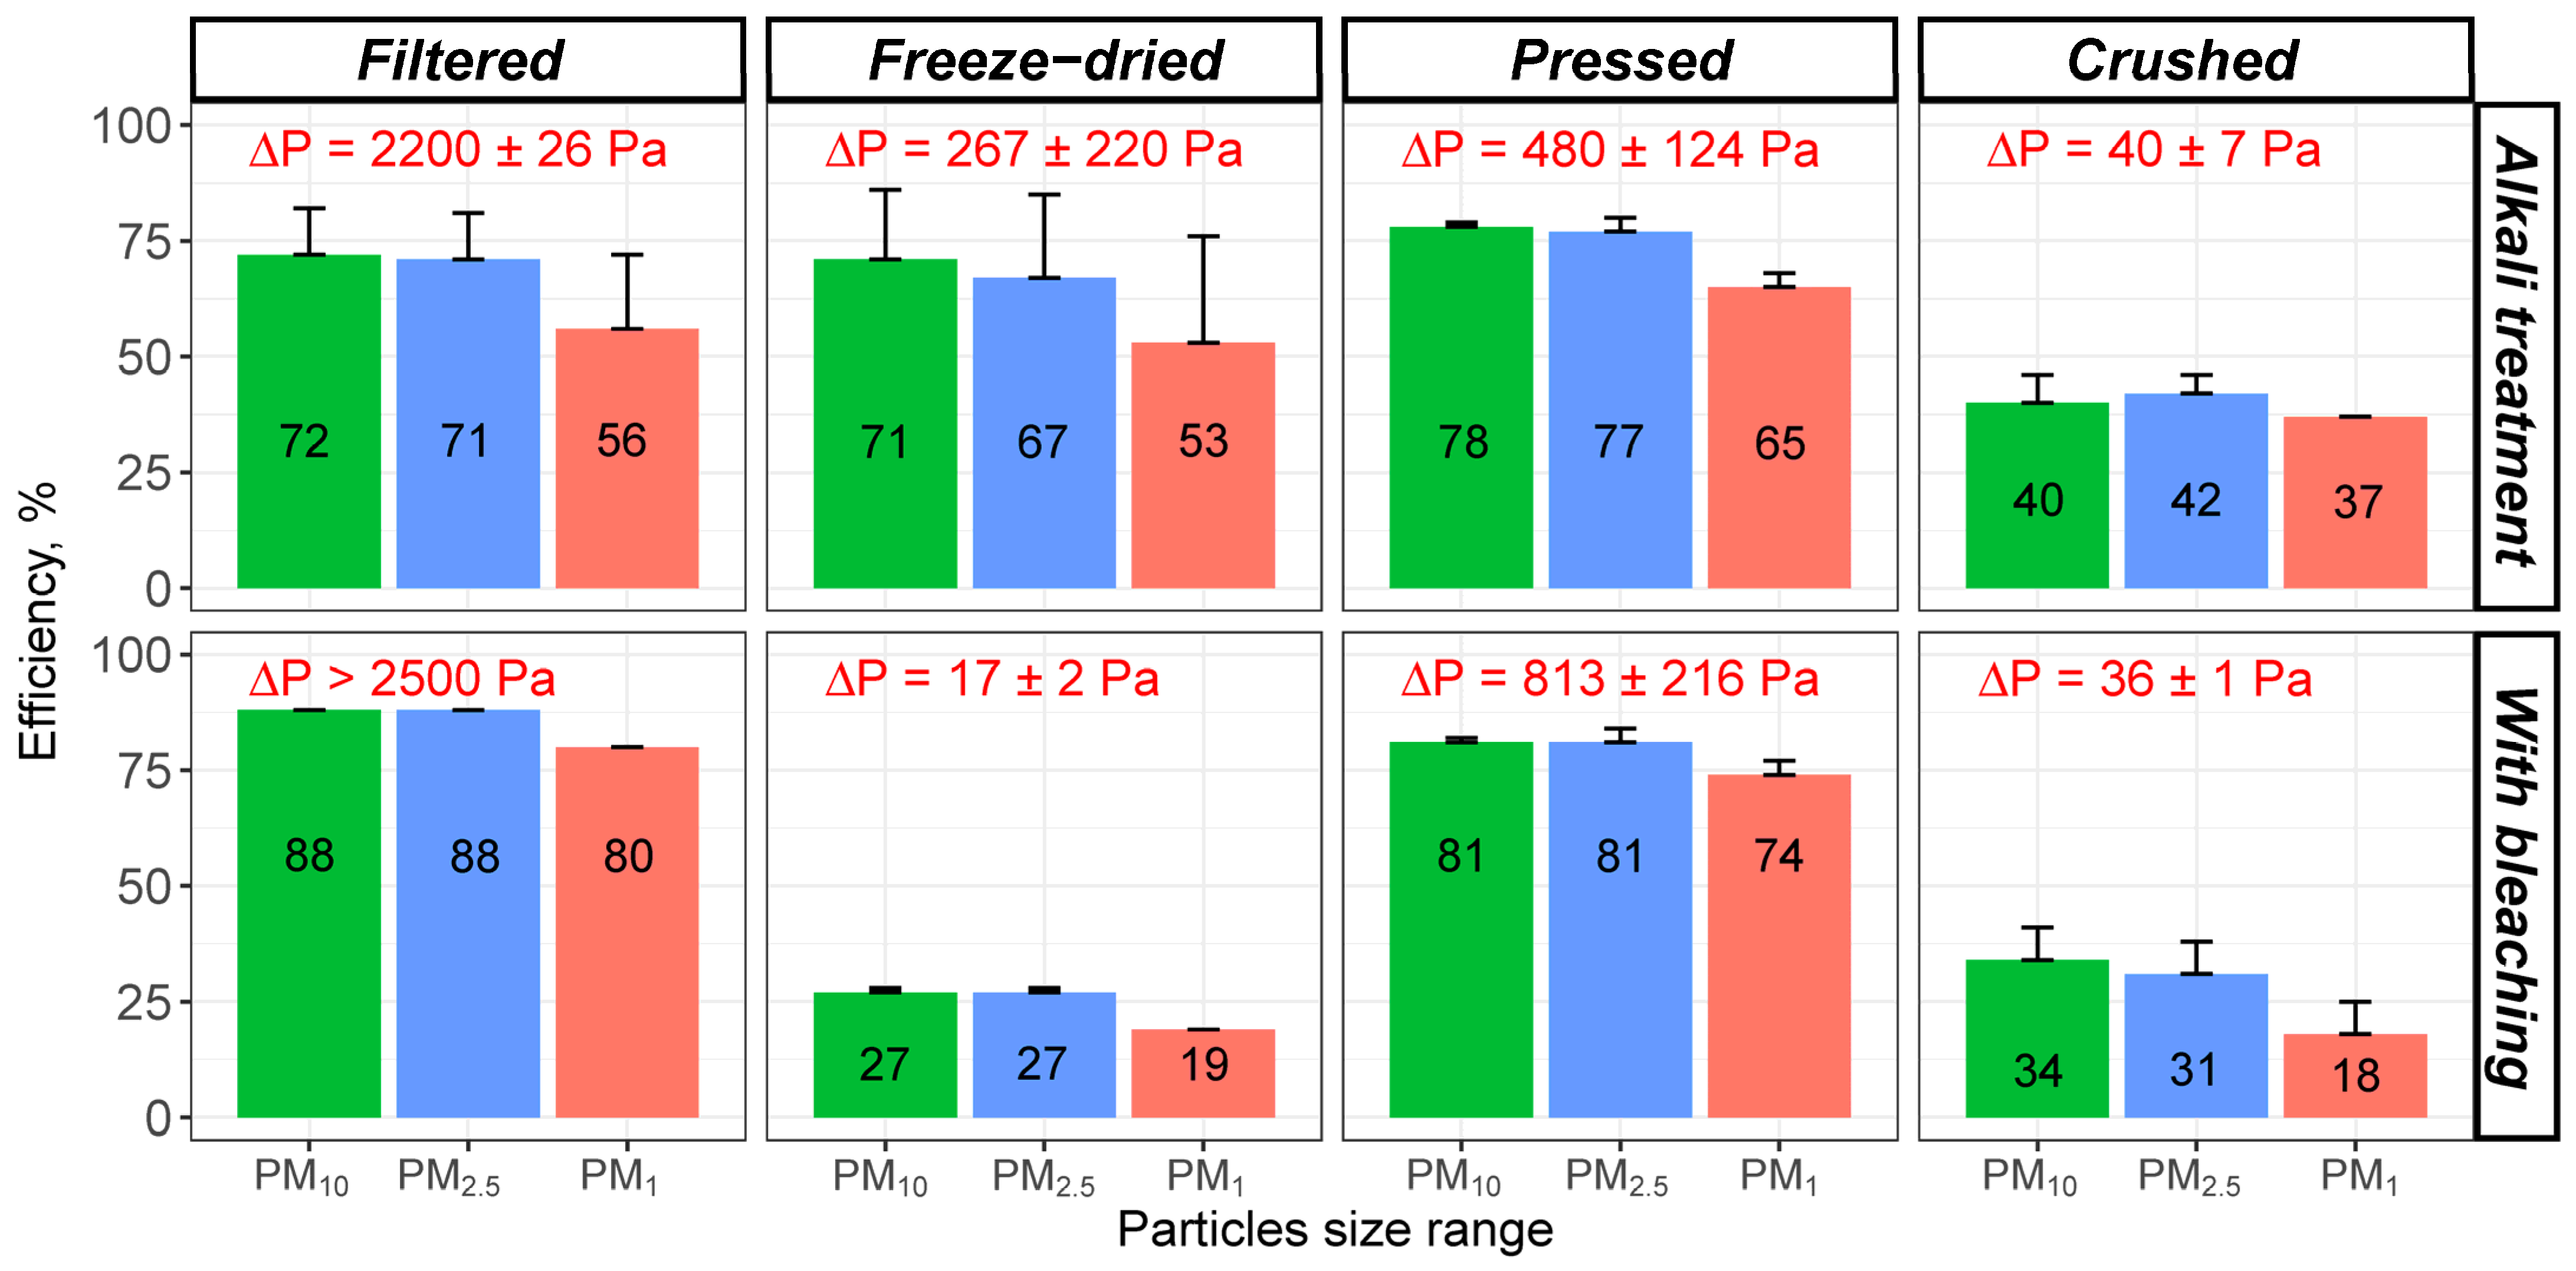
3.2. Particles Capture Efficiency Comparison of Manufacturing Processes

Figure 7 shows the mean capture efficiencies obtained according to the particle size ranges (PM10, PM2.5, and PM1) for each manufacturing process tested with filters with a grammage of 100 g·m−2. The crushed filter manufacturing process presented poor results, even obtaining negative efficiencies in some tests, possibly due to the small difference between the particle count at the outlet and inlet as a result of the low particle retention of the filter or the detachment of crushed particles still present in the filter. As similar results were obtained in filters from both alkali-treated and bleached pulp, this type of manufacturing process was discarded for the subsequent tests. Another significant result was the efficiency of freeze-dried filters with bleached pulp in comparison with those with alkali-treated pulp. Efficiency was notably lower in the former, with values below 30% for all particle size ranges. This may be due to the lignin content in the alkali-treated pulp in comparison with the bleached pulp (Table 4). When analyzing the SEM images, the fibers of the alkali-treated pulp filters were more chipboard-like due to the lignin (Figure 8B), whereas the bleached pulp filters were uniform and separated (Figure 8E). This could have allowed the aerosol to pass more easily through the filter, decreasing the particle retention.
Efficiencies were very similar between filtered and pressed filters. Efficiency values higher than 80% were achieved for PM10 and PM2.5 in the case of filters with bleached pulp and higher than 70% in filters with alkali-treated pulp. The capture efficiencies for the smallest particles were lower, 80% and 56% in the filtered filters manufactured with bleached pulp and with alkali-treated pulp, respectively. To analyze the effect of pretreatment (alkaline and bleaching), the mean differences between both processes were examined, regardless of the manufacturing process, through a two-samples Hotelling’s T2 test. The results are shown in Table 4. F-values greater than 1 indicate significant differences between the average efficiencies of the bleached pulp filters and alkali-treated pulp filters in the vacuum filtration and pressing processes, with the differences being slightly higher in the first case. This is confirmed with p-values below the significance level (α = 0.05), discharging the H0 (equal means).
Average differences between the processes tested for the same treatment were studied by applying the Kruskal–Wallis test (Table 5) due to the lack of normality of the data set and the small sample size. The results confirmed there were no significant differences between the efficiencies of each process (freeze-drying, filtration, and pressing) for alkali-treated pulp filters. In the case of bleached pulp filters, no significant differences were observed between the filtered and pressed types.
With respect to data reproducibility, the filter type that showed the highest variation was the freeze-dried pulp filter, with 10, 14, and 11 times higher standard variation for PM10, PM2.5, and PM1, respectively, compared to the freeze-dried bleached pulp filter. This was also observed with the filtered filter, with a standard deviation twice as high as in the case of the pulp filters. In addition to the effect of the bleaching process, for the manufacturing of both freeze-dried and filtered filters, the pulp (alkali-treated and bleached) was subjected to magnetic stirring for five days. This homogenization process may be affected by external variables such as the stirring power or the structural characteristics of the type of treated pulp used in each case. In contrast, pressed filters’ variability was very low for both alkali-treated and bleached pulp types, with standard deviation values below 3% for all particle size ranges. In this manufacturing process, the pulp used was only wetted and, finally, pressed at the same pressure, reducing the effect of external factors.
In addition to filter efficiency, the pressure drop across each filter was studied. These values are shown in Figure 7 in red. The lowest pressure drop of 17 Pa was recorded with the freeze-dried filters manufactured with bleached pulp, which implies a reduction greater than 90% compared to the filter manufactured with alkali-treated pulp. As mentioned above, the bleached pulp fibers were more separated and cleaner in the SEM images (Figure 8). The lignin in the pulp filters, which acts as a binder, provides greater resistance to the aerosol pass as well as to reducing the filter sponging. In contrast, in the pressed filters, the pressure drop was around twice as high in the bleached pulp filters (813 Pa). A possible reason for this may be the greater effect of the press in the bleached pulp because the fibers were freer, which may allow for greater fiber coupling and bundling. Finally, the pressure drop was also higher in the bleached pulp filtered filters than in the alkali-treated type, with values above 2500 Pa in the former, possibly due to the same reason as in the case of pressed filters. In summary, considering the above, the filters that were subjected to a compression force, as in the case of filtered and pressed filters, had higher pressure drops, creating very little space between fibers and, thus, significantly reducing the air flow, as observed in the SEM images (Figure 8).

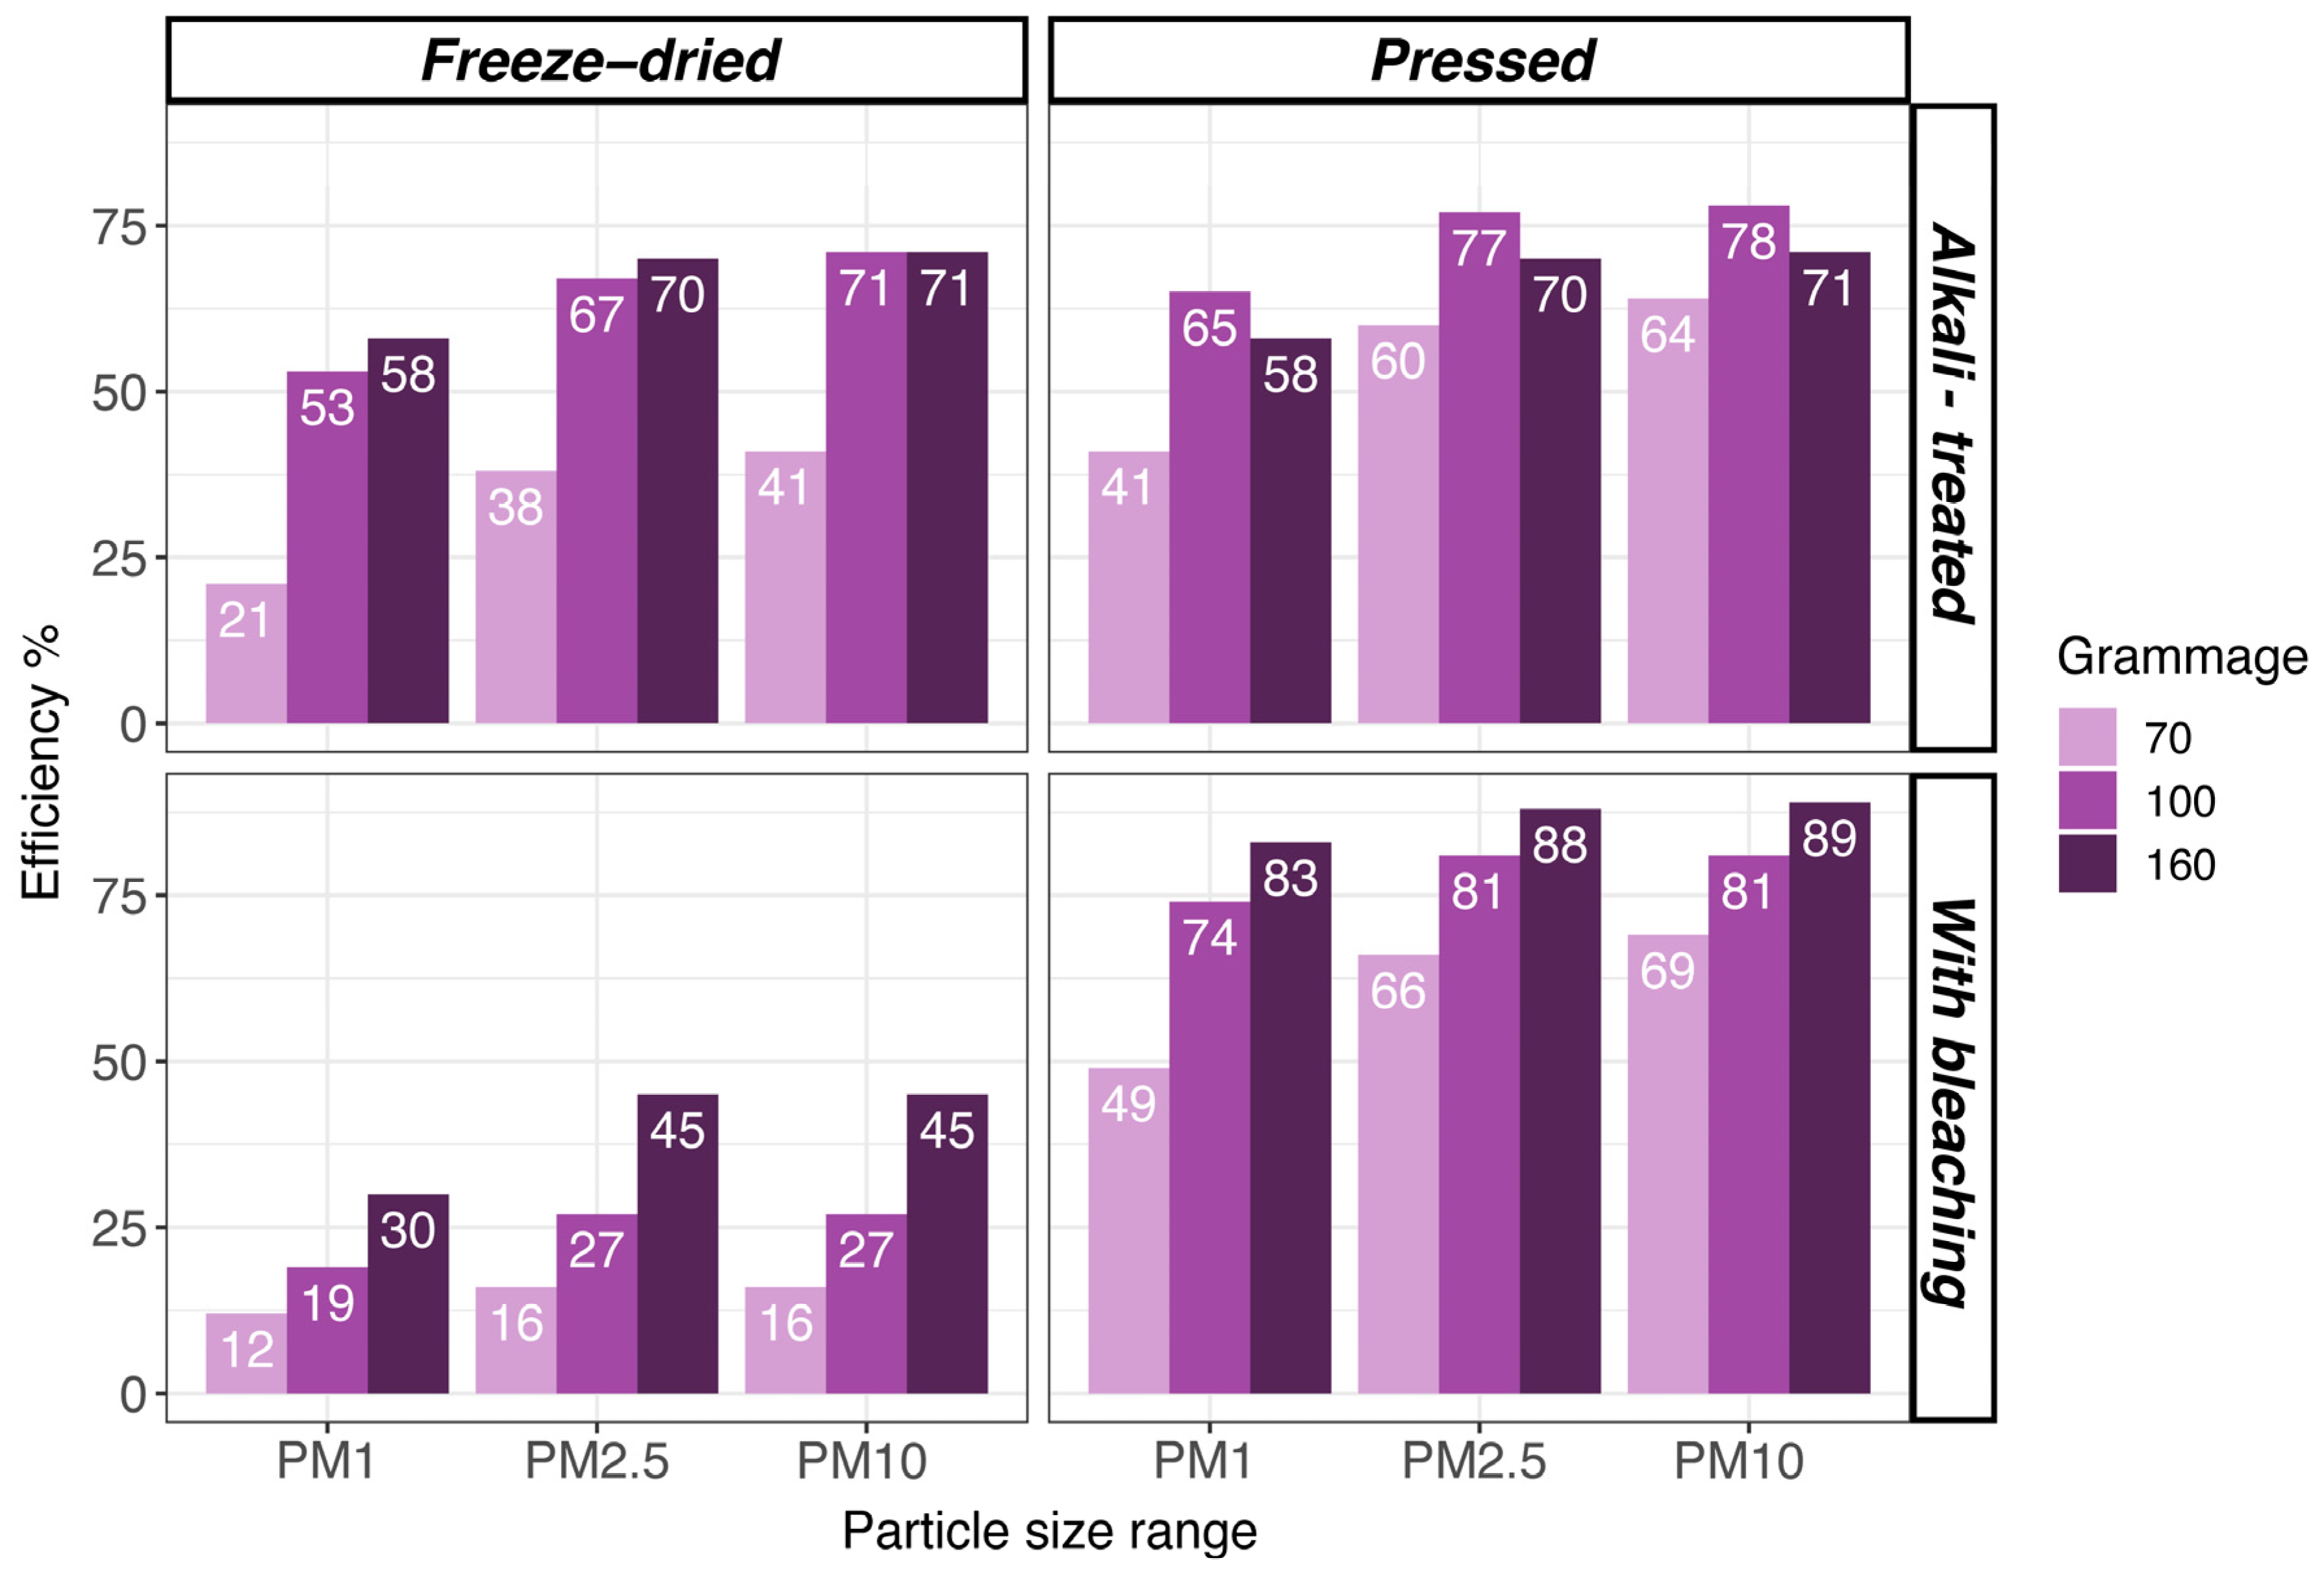
3.3. Analysis of Filter Variations

In view of the results obtained for filters with a grammage of 100 g·m−2, filters with lower and higher grammage (70 g·m−2 and 160 g·m−2, respectively) were tested in order to evaluate the effect of the grammage on capture efficiency and pressure drop. In addition, as the pressed filters with bleached pulp had high efficiencies but also high pressure drops, the influence of pressing pressure was also analyzed by testing filters pressed at 2, 4, and 6 t. The results obtained are described in the following subsections.

3.3.1. Assessment of Filter Grammage

Considering the higher particle retention efficiencies observed in the filtered filters with a grammage of 100 g·m−2, it was initially also decided to test those with a grammage of 160 g·m−2, despite the high pressure drops. At the end of the drying stage at room temperature in the manufacturing process, filter diameters decreased about 7 mm, which meant a drastic change in the final grammage, passing from 160 g·m−2 to 200 g·m−2. For this reason, these filters were dried using an absorbent material. On this occasion, the grammage was maintained, but anomalous particle capture efficiency and pressure drop values were obtained. A SEM analysis (Figure 9) was carried out, and it was observed that the surface in the filtered filters of 160 g·m−2 was less uniform than in the case of those of 100 g·m−2, which might allow better flow of the aerosol. In view of this and the fact that it was not possible to control the grammage with the vacuum pressure applied in this study, the filtered filters of 160 g·m−2 were not considered in this secondary study. We intend for them to be the subject of future research.
With respect to the filtered filters with a grammage of 70 g·m−2, the particle capture efficiencies of the filters manufactured with bleached pulp decreased, especially in the range PM1. In contrast, the particle retention efficiencies of the alkali-treated filters with the same grammage increased. This may also be related to the problem of grammage control as mentioned above, requiring further in-depth analysis.
The decrease in capture efficiency observed in the filters with a grammage of 70 g·m−2 was more significant in the freeze-dried filters (Figure 10). Less homogeneity was observed in these filters due to the lower mass of the pulp used. In addition, in the freeze-dried filters with bleached pulp, it was observed that the number of particles at the outlet was higher than at the inlet in the case of sizes larger than eight microns, which may be due to the dragging of the filter material by the aerosol stream. For this reason, these filters were discarded from the analysis. In contrast, in this type of filters (with bleached), the highest increase in capture efficiency was experienced in the case of the grammage of 160 g·m−2, with a 67% increase in PM10 and PM2.5 and a 58% increase in PM1. However, the obtained efficiency values were low, falling below 50%.
As for the pressed filters, significant differences were observed between unbleached and bleached types. In the former, there are no increase in capture efficiencies in any of the grammages studied. In the latter, an increase was observed in the grammage of 160 g·m−2, reaching very high efficiency values of close to 90% in PM10 and PM2.5 (an increase of 10% and 9%, respectively) and 83% (a 12% increase) in the PM1 range. This may indicate that the bleaching process improves the contact surface, since pulp components such as the lignin are removed, as previously mentioned. The change in grammage from 100 g·m−2 to 160 g·m−2 also caused an increase in the pressed filter pressure drops (Table 6). This may reveal a greater disposition of the filters with a grammage of 160 g·m−2 to clogging, decreasing their useful life. However, in the freeze-dried filter with a grammage of 160 g·m−2, the pressure drop decreased only in the alkali-treated sample. This could be attributed to the increased need for water and agitation during the manufacturing of the filter, given its higher mass, resulting in a more compact material.

3.3.2. Different Manufacturing Pressing Pressures (Pressed Filters)

Table 7 shows the average particle capture efficiencies and pressure drops obtained for each of the press pressures tested for filters with a grammage of 160 g·m−2 and manufactured with bleached pulp. For a more statistical analysis, the Kruskal–Wallis test was applied, using the values of efficiencies obtained in each test. No significant differences were detected, with p-values below the significance level (α = 0.05). Another factor considered was the variability of the data. The coefficient of variation at low pressures was quite low, ranging between 3.2% (for PM10) and 6% (for PM1) at 2 t, between 1.7% (PM10) and 4.2% (PM1) at 4 t, between 14.3% (PM10) and 19.0% (PM1) at 6 t and, finally, between 8.2% (PM10) and 10.9% (PM1) at 8 t. Regarding pressure drops, a significant difference was observed between the tested pressures, increasing more than three times at the highest pressure compared to the lowest pressure, as can be seen in Table 8. In view of the high capture efficiency, low data variability and a pressure drop lower than 1000 Pa, the pressing at 4 t is considered the best solution.

3.3.3. Assessment of Hybrid Freeze-Dried and Pressed Filters

Due to the superior filtration efficiencies of pressed filters and the low pressure drop of freeze-dried filters, a final variation of filters has been generated by combining freeze-dried processes, to achieve a better fibrillar structure and pressing. From freeze-dried filters with a grammage of 160 g·m−2 and bleaching treatment, different replicas of hybrid filters have been obtained with various pressing pressures, corresponding to 0.25, 0.5, 1, and 2 t. Table 8 presents the particle capture efficiency for each of the manufactured hybrid filters, along with their corresponding pressure drop values.
The increase in pressing pressures led to a gradual improvement in filtration efficiencies across all particle size ranges, although it also resulted in a progressive increase in pressure drop, albeit significantly lower than pressed filters. Particle retention efficiencies close to 90% for PM10 and PM2.5 sizes were achieved. The combination of these two processes demonstrates how it is possible to achieve higher efficiencies with lower pressing pressures (2 t) compared to the best pressed filters (8 t), while maintaining reasonable pressure drop levels.
Comparing the performance of these hybrid filters to the tested commercial filters (Table 9), the efficiencies are very close to those of surgical respiratory filters but still fall short of high-efficiency fiberglass filters, albeit with lower pressure drops than the latter. Observing the efficiency trend of hybrid filters, increasing pressures could potentially further enhance filtration efficiencies, although at the expense of generating higher pressure loads. In any case, the results of these hybrid filters reveal their potential application in industrial filtration processes by combining efficiencies and pressure drops that are acceptable for a wide spectrum of airborne particulate filtration processes.

4. Conclusions

In this study, air filters for capturing fine and ultrafine particles were manufactured with cellulose pulp extracted from banana pseudostem fibers using both alkali-treated pulp and bleached pulp. Four manufacturing processes (crushing, freeze-drying, pressing, and vacuum filtration) were tested, analyzing the capture efficiencies of different particles size ranges: PM10, PM2.5, and PM1. The other parameter studied was the pressure drop of the filters.
Initially, filters with a grammage of 100 g·m−2 were manufactured. Given the results obtained, the crushing process was discarded because the particle retention efficiencies were very low. In contrast to crushed filters, the filtered and pressed filters manufactured with bleached pulp had high efficiencies, reaching as high as 70% of efficiency in the smallest particles retention. However, these last two types of filter also showed high pressure drops, especially in the filtered type, with values above 2500 Pa. In the case of freeze-dried filters, the highest efficiency values were obtained with alkali-treated pulp as opposed to bleached pulp. Nevertheless, these efficiency values remain very low compared to pressed and filtered filters, despite having a favorable pressure drop.
Regarding the analysis of grammage variation (70 g·m−2 and 160 g·m−2), an increase in grammage generally results in an improvement in filtration efficiency. Specifically, the pressed filter type with bleached pulp and a grammage of 160 g·m−2 showed the best results, with efficiencies exceeding 83% in all particle size ranges. However, this type of filter exhibits a relatively high pressure drop, exceeding 2000 Pa. Therefore, after analyzing the influence of pressing pressure on filtration results (tests with filters at 2, 4, 6, and 8 t), it can be concluded that filters pressed at 4 t, featuring a grammage of 160 g·m−2, and manufactured with bleached pulp, represent one of the best solutions. These filters exhibit good capture efficiencies (80.5% for the smallest particles and 88% for others), very close to the maximums observed in filters pressed at 8 t, but with a pressure drop below 1000 Pa.
Considering the combination of filter manufacturing processes and in the final experimental phase, employing a combination of freeze-dried and 2-ton pressing processes yields enhanced results (83% for the smallest particles and 89% for others) with approximately half the pressure drop (558 Pa), establishing it as a superior overall solution. This hybridization of processes allowed the integration, in a single filter, of the advantages that each forming process contributes to them, paving the way for potential future research directions.
Finally, the results of this exploratory study demonstrate the potential use of agricultural waste materials from banana cultivation to develop environmentally friendly filtering materials for airborne particles, through simple manufacturing methods, providing an alternative to fuel-derived polymers. Indeed, considering that conventional shaping processes and basic pulp treatments have been investigated, there are still numerous opportunities for improvement to explore, such as the incorporation or combination of other filter shaping technologies, additional physicochemical treatments, defibrillation of cellulose, as well as the multilayer structuring of filters, among many other possibilities. These alternatives could significantly enhance the results obtained in future research.

Author Contributions

Conceptualization, P.B., E.P.-M. and M.M.; methodology, Y.M.-C., P.B., E.P.-M. and M.M.; software, Y.M.-C. and P.B.; validation, Y.M.-C., P.B. and E.P.-M.; formal analysis, Y.M.-C., P.B. and E.P.-M.; investigation, Y.M.-C., P.B., E.P.-M. and T.S.-C.; resources, P.B. and E.P.-M.; data curation, Y.M.-C., P.B. and E.P.-M.; writing—original draft preparation, Y.M.-C., P.B. and E.P.-M.; writing—review and editing, Y.M.-C., P.B. and E.P.-M.; visualization, Y.M.-C., P.B. and E.P.-M.; supervision, P.B. and E.P.-M.; project administration, E.P.-M.; funding acquisition, P.B., E.P.-M. and M.M. All authors have read and agreed to the published version of the manuscript.

Funding

This research was funded by Fundación CajaCanarias and Fundación Bancaria ‘la Caixa’ as part of the FILTRACEL project (code: 2021ECO2).

Data Availability Statement

The raw data supporting the conclusions of this article will be made available by the authors on request.

Conflicts of Interest

The authors declare no conflicts of interest. The funders had no role in the design of the study; in the collection, analyses, or interpretation of data; in the writing of the manuscript; or in the decision to publish the results.

References

  1. World Health Organization (WHO). Air Pollution Data Portal. Available online: https://www.who.int/data/gho/data/themes/air-pollution (accessed on 20 December 2023).
  2. Amma, C.; Inomata, Y.; Kohno, R.; Satake, M.; Furukawa, A.; Nagata, Y.; Sugiyama, H.; Seto, T.; Suzuki, R. Copper in Airborne Fine Particulate Matter (PM2.5) from Urban Sites Causes the Upregulation of pro-Inflammatory Cytokine IL-8 in Human Lung Epithelial A549 Cells. Environ. Geochem. Health 2023, 45, 5879–5891. [Google Scholar] [CrossRef]
  3. Bimenyimana, E.; Pikridas, M.; Oikonomou, K.; Iakovides, M.; Christodoulou, A.; Sciare, J.; Mihalopoulos, N. Fine Aerosol Sources at an Urban Background Site in the Eastern Mediterranean (Nicosia; Cyprus): Insights from Offline versus Online Source Apportionment Comparison for Carbonaceous Aerosols. Sci. Total Environ. 2023, 893, 164741. [Google Scholar] [CrossRef]
  4. Gramblicka, T.; Parizek, O.; Stupak, M.; Pulkrabova, J. Assessment of Atmospheric Pollution by Oxygenated and Nitrated Derivatives of Polycyclic Aromatic Hydrocarbons in Two Regions of the Czech Republic. Atmos. Environ. 2023, 310, 119981. [Google Scholar] [CrossRef]
  5. Huang, W.; Luo, X.-S.; Pang, Y.; Tang, M.; Zhao, Z.; Li, H. Diverse Chemical Components of PM10 Emitted from Different Coal Combustions Resulting in Distinct Cytotoxicity. Fuel 2023, 353, 129207. [Google Scholar] [CrossRef]
  6. Ryu, J.; Lee, S.H.; Kim, S.; Jeong, J.-W.; Kim, K.S.; Nam, S.; Kim, J.-E. Urban Dust Particles Disrupt Mitotic Progression by Dysregulating Aurora Kinase B-Related Functions. J. Hazard. Mater. 2023, 459, 132238. [Google Scholar] [CrossRef]
  7. Via, M.; Yus-Díez, J.; Canonaco, F.; Petit, J.-E.; Hopke, P.; Reche, C.; Pandolfi, M.; Ivančič, M.; Rigler, M.; Prevôt, A.S.H.; et al. Towards a Better Understanding of Fine PM Sources: Online and Offline Datasets Combination in a Single PMF. Environ. Int. 2023, 177, 108006. [Google Scholar] [CrossRef]
  8. Li, L.; Zhang, W.; Xie, L.; Jia, S.; Feng, T.; Yu, H.; Huang, J.; Qian, B. Effects of Atmospheric Particulate Matter Pollution on Sleep Disorders and Sleep Duration: A Cross-Sectional Study in the UK Biobank. Sleep. Med. 2020, 74, 152–164. [Google Scholar] [CrossRef] [PubMed]
  9. Chew, S.; Kolosowska, N.; Saveleva, L.; Malm, T.; Kanninen, K.M. Impairment of Mitochondrial Function by Particulate Matter: Implications for the Brain. Neurochem. Int. 2020, 135, 104694. [Google Scholar] [CrossRef] [PubMed]
  10. Wu, J.; Ge, D.; Zhou, L.; Hou, L.; Zhou, Y.; Li, Q. Effects of Particulate Matter on Allergic Respiratory Diseases. Chronic Dis. Transl. Med. 2018, 4, 95–102. [Google Scholar] [CrossRef]
  11. Wu, Y.; Jin, T.; He, W.; Liu, L.; Li, H.; Liu, C.; Zhou, Y.; Hong, J.; Cao, L.; Lu, Y.; et al. Associations of Fine Particulate Matter and Constituents with Pediatric Emergency Room Visits for Respiratory Diseases in Shanghai, China. Int. J. Hyg. Environ. Health 2021, 236, 113805. [Google Scholar] [CrossRef]
  12. Renzi, M.; Scortichini, M.; Forastiere, F.; de’ Donato, F.; Michelozzi, P.; Davoli, M.; Gariazzo, C.; Viegi, G.; Stafoggia, M.; Ancona, C.; et al. A Nationwide Study of Air Pollution from Particulate Matter and Daily Hospitalizations for Respiratory Diseases in Italy. Sci. Total Environ. 2022, 807, 151034. [Google Scholar] [CrossRef] [PubMed]
  13. O’Piela, D.R.; Durisek, G.R.; Escobar, Y.-N.H.; Mackos, A.R.; Wold, L.E. Particulate Matter and Alzheimer’s Disease: An Intimate Connection. Trends Mol. Med. 2022, 28, 770–780. [Google Scholar] [CrossRef] [PubMed]
  14. Zhang, J.; Chen, Z.; Shan, D.; Wu, Y.; Zhao, Y.; Li, C.; Shu, Y.; Linghu, X.; Wang, B. Adverse Effects of Exposure to Fine Particles and Ultrafine Particles in the Environment on Different Organs of Organisms. J. Environ. Sci. 2024, 135, 449–473. [Google Scholar] [CrossRef] [PubMed]
  15. Kim, K.E.; Cho, D.; Park, H.J. Air Pollution and Skin Diseases: Adverse Effects of Airborne Particulate Matter on Various Skin Diseases. Life Sci. 2016, 152, 126–134. [Google Scholar] [CrossRef] [PubMed]
  16. He, Z.; Zhang, H.; Song, Y.; Yang, Z.; Cai, Z. Exposure to Ambient Fine Particulate Matter Impedes the Function of Spleen in the Mouse Metabolism of High-Fat Diet. J. Hazard. Mater. 2022, 423, 127129. [Google Scholar] [CrossRef]
  17. Zhang, H.; Mao, Z.; Huang, K.; Wang, X.; Cheng, L.; Zeng, L.; Zhou, Y.; Jing, T. Multiple Exposure Pathways and Health Risk Assessment of Heavy Metal(Loid)s for Children Living in Fourth-Tier Cities in Hubei Province. Environ. Int. 2019, 129, 517–524. [Google Scholar] [CrossRef]
  18. Schwarz, M.; Schneider, A.; Cyrys, J.; Bastian, S.; Breitner, S.; Peters, A. Impact of Ultrafine Particles and Total Particle Number Concentration on Five Cause-Specific Hospital Admission Endpoints in Three German Cities. Environ. Int. 2023, 178, 108032. [Google Scholar] [CrossRef]
  19. Lokorai, K.; Ali-Khodja, H.; Khardi, S.; Bencharif-Madani, F.; Naidja, L.; Bouziane, M. Influence of Mineral Dust on the Concentration and Composition of PM10 in the City of Constantine. Aeolian Res. 2021, 50, 100677. [Google Scholar] [CrossRef]
  20. Milford, C.; Torres, C.; Vilches, J.; Gossman, A.-K.; Weis, F.; Suárez-Molina, D.; García, O.E.; Prats, N.; Barreto, Á.; García, R.D.; et al. Impact of the 2021 La Palma Volcanic Eruption on Air Quality: Insights from a Multidisciplinary Approach. Sci. Total Environ. 2023, 869, 161652. [Google Scholar] [CrossRef]
  21. Cai, R.; Zhang, J.; Nie, X.; Tjong, J.; Matthews, D.T.A. Wear Mechanism Evolution on Brake Discs for Reduced Wear and Particulate Emissions. Wear 2020, 452–453, 203283. [Google Scholar] [CrossRef]
  22. Martínez-López, A.; Marrero, Á.; Martín-Cruz, Y.; González, M.M. Environmental Assessment Model for Scrubbers versus Alternative Mitigation Systems for Feeder Vessels in Liner Shipping. J. Environ. Manag. 2022, 321, 115954. [Google Scholar] [CrossRef] [PubMed]
  23. Moreno, T.; Querol, X.; Alastuey, A.; de la Rosa, J.; Sánchez de la Campa, A.M.; Minguillón, M.; Pandolfi, M.; González-Castanedo, Y.; Monfort, E.; Gibbons, W. Variations in Vanadium, Nickel and Lanthanoid Element Concentrations in Urban Air. Sci. Total Environ. 2010, 408, 4569–4579. [Google Scholar] [CrossRef] [PubMed]
  24. Sadeghi, B.; Choi, Y.; Yoon, S.; Flynn, J.; Kotsakis, A.; Lee, S. The Characterization of Fine Particulate Matter Downwind of Houston: Using Integrated Factor Analysis to Identify Anthropogenic and Natural Sources. Environ. Pollut. 2020, 262, 114345. [Google Scholar] [CrossRef] [PubMed]
  25. Kabelitz, T.; Ammon, C.; Funk, R.; Münch, S.; Biniasch, O.; Nübel, U.; Thiel, N.; Rösler, U.; Siller, P.; Amon, B.; et al. Functional Relationship of Particulate Matter (PM) Emissions, Animal Species, and Moisture Content during Manure Application. Environ. Int. 2020, 143, 105577. [Google Scholar] [CrossRef] [PubMed]
  26. Saraga, D.Ε.; Querol, X.; Duarte, R.M.B.O.; Aquilina, N.J.; Canha, N.; Alvarez, E.G.; Jovasevic-Stojanovic, M.; Bekö, G.; Byčenkienė, S.; Kovacevic, R.; et al. Source Apportionment for Indoor Air Pollution: Current Challenges and Future Directions. Sci. Total Environ. 2023, 900, 165744. [Google Scholar] [CrossRef] [PubMed]
  27. U.S. Environmental Protection Agency Indoor Particulate Matter. Available online: https://www.epa.gov/indoor-air-quality-iaq/indoor-particulate-matter (accessed on 20 January 2024).
  28. Weschler, C.J. Changes in Indoor Pollutants since the 1950s. Atmos. Environ. 2009, 43, 153–169. [Google Scholar] [CrossRef]
  29. Shupler, M.; Godwin, W.; Frostad, J.; Gustafson, P.; Arku, R.E.; Brauer, M. Global Estimation of Exposure to Fine Particulate Matter (PM2.5) from Household Air Pollution. Environ. Int. 2018, 120, 354–363. [Google Scholar] [CrossRef]
  30. Rojano, R.; Vengoechea, A.M.; Arregocés, H.A. Indoor/Outdoor Relationship of Particulate Matter (PM10) and Its Chemical Composition in a Coastal Region of Colombia. Case Stud. Chem. Environ. Eng. 2023, 8, 100397. [Google Scholar] [CrossRef]
  31. Pan, H.-J.; Fang, M.-C.; Ward, J.D.; Lee, H.-Y.; Lin, H.-Y.; Hsieh, C.-T.; Lee, C.-L.; Huang, T.-H.; Hsieh, Y.-C.; Lin, S.-C.; et al. Modeling of an Integrated H2S/NH3 Scrubber and Regeneration Columns for Coke Oven Gas Purification. J. Clean. Prod. 2023, 389, 136065. [Google Scholar] [CrossRef]
  32. Tański, M.; Berendt, A.; Mizeraczyk, J. Closed SDBD-Driven Two-Stage Electrostatic Precipitator. J. Clean. Prod. 2019, 226, 74–84. [Google Scholar] [CrossRef]
  33. Barba-Lobo, A.; Gutiérrez-Álvarez, I.; Adame, J.A.; Bolívar, J.P. A Simple and Precise Methodology to Determine Particulate Matter Mass in Atmospheric Filters; Validation and Application Cases. Environ. Res. 2022, 214, 113817. [Google Scholar] [CrossRef] [PubMed]
  34. Cai, R.-R.; Zhang, L.-Z. Progress and Perspective of Polymer Electret-Based PM2.5 Filtration: Efficiencies, Regeneration, and Energy Implications. Energy 2023, 283, 128504. [Google Scholar] [CrossRef]
  35. Matthaios, V.N.; Harrison, R.M.; Koutrakis, P.; Bloss, W.J. In-Vehicle Exposure to NO2 and PM2.5: A Comprehensive Assessment of Controlling Parameters and Reduction Strategies to Minimise Personal Exposure. Sci. Total Environ. 2023, 900, 165537. [Google Scholar] [CrossRef] [PubMed]
  36. Zhang, H.; Hu, Q.; Si, T.; Tang, X.; Shan, S.; Gao, X.; Peng, L.; Chen, K. All-Cellulose Air Filter Composed with Regenerated Nanocellulose Prepared through a Facile Method with Shear-Induced. Int. J. Biol. Macromol. 2023, 228, 548–558. [Google Scholar] [CrossRef] [PubMed]
  37. Rana, A.K.; Mostafavi, E.; Alsanie, W.F.; Siwal, S.S.; Thakur, V.K. Cellulose-Based Materials for Air Purification: A Review. Ind. Crops Prod. 2023, 194, 116331. [Google Scholar] [CrossRef]
  38. Yang, H.; Zhu, H.; Fu, H. Numerical Calculation and Analysis of Filtration Performance of an Effective Novel Structural Fiber for PM2.5. PLoS ONE 2020, 15, e0240941. [Google Scholar] [CrossRef] [PubMed]
  39. Yadav, S.; Das, D. Microstructure and Particle Filtration Behavior of Multimodal Fibrous Filter Media Made of Fibres of Different Sizes for Engine Intake Air Filtration. Indian J. Fibre Text. Res. 2022, 47, 166–176. [Google Scholar] [CrossRef]
  40. Hwang, S.; Roh, J.; Park, W.M. Comparison of the Relative Performance Efficiencies of Melt-Blown and Glass Fiber Filter Media for Managing Fine Particles. Aerosol Sci. Technol. 2018, 52, 451–458. [Google Scholar] [CrossRef]
  41. Sepahvand, S.; Ashori, A.; Jonoobi, M. Application of Cellulose Nanofiber as a Promising Air Filter for Adsorbing Particulate Matter and Carbon Dioxide. Int. J. Biol. Macromol. 2023, 244, 125344. [Google Scholar] [CrossRef]
  42. Zhang, X.; Ma, J.; Nie, X.; Fan, Y.; Wang, H.; Cui, Y. Establishment of Air Fiber Filtration Model Based on Fractal Theory and Analysis of Filtration Performances. Mater. Today Commun. 2023, 34, 105301. [Google Scholar] [CrossRef]
  43. Macrofilter Filtro Mini Pleat. Available online: https://filtrosindustrialesmacrofilter.com/wp-content/uploads/2023/09/Catalogo-y-Ficha-tecnica-MP-Macrofilter-V1.pdf (accessed on 12 December 2023).
  44. ISOFILTER Filtros HEPA. Available online: https://www.isofilter.es/filtro-hepa-h13-h14/ (accessed on 15 December 2023).
  45. Gough, C.R.; Callaway, K.; Spencer, E.; Leisy, K.; Jiang, G.; Yang, S.; Hu, X. Biopolymer-Based Filtration Materials. ACS Omega 2021, 6, 11804–11812. [Google Scholar] [CrossRef]
  46. Cecci, R.R.R.; Passos, A.A.; de Aguiar Neto, T.C.; Silva, L.A. Banana Pseudostem Fibers Characterization and Comparison with Reported Data on Jute and Sisal Fibers. SN Appl. Sci. 2020, 2, 20. [Google Scholar] [CrossRef]
  47. Lippi, M.; Riva, L.; Caruso, M.; Punta, C. Cellulose for the Production of Air-Filtering Systems: A Critical Review. Materials 2022, 15, 976. [Google Scholar] [CrossRef] [PubMed]
  48. Fan, X.; Wang, Y.; Zhong, W.-H.; Pan, S. Hierarchically Structured All-Biomass Air Filters with High Filtration Efficiency and Low Air Pressure Drop Based on Pickering Emulsion. ACS Appl. Mater. Interfaces 2019, 11, 14266–14274. [Google Scholar] [CrossRef] [PubMed]
  49. Wang, Y.; Tapia-Brito, E.; Riffat, J.; Chen, Z.; Jiang, F.; Riffat, S. Investigation on the Efficient Removal of Particulate Matter (PM) with Biomass-Based Aerogel. Future Cities Environ. 2021, 7. [Google Scholar] [CrossRef]
  50. Zeng, Z.; Ma, X.Y.D.; Zhang, Y.; Wang, Z.; Ng, B.F.; Wan, M.P.; Lu, X. Robust Lignin-Based Aerogel Filters: High-Efficiency Capture of Ultrafine Airborne Particulates and the Mechanism. ACS Sustain. Chem. Eng. 2019, 7, 6959–6968. [Google Scholar] [CrossRef]
  51. Ai, B.; Zheng, L.; Li, W.; Zheng, X.; Yang, Y.; Xiao, D.; Shi, J.; Sheng, Z. Biodegradable Cellulose Film Prepared From Banana Pseudo-Stem Using an Ionic Liquid for Mango Preservation. Front. Plant Sci. 2021, 12, 625878. [Google Scholar] [CrossRef] [PubMed]
  52. Thi Thuy Van, N.; Gaspillo, P.; Thanh, H.G.T.; Nhi, N.H.T.; Long, H.N.; Tri, N.; Thi Truc Van, N.; Nguyen, T.-T.; Ky Phuong Ha, H. Cellulose from the Banana Stem: Optimization of Extraction by Response Surface Methodology (RSM) and Charaterization. Heliyon 2022, 8, e11845. [Google Scholar] [CrossRef] [PubMed]
  53. Liu, H.; Wu, Q.; Zhang, Q. Preparation and Properties of Banana Fiber-Reinforced Composites Based on High Density Polyethylene (HDPE)/Nylon-6 Blends. Bioresour. Technol. 2009, 100, 6088–6097. [Google Scholar] [CrossRef]
  54. Venkateshwaran, N.; Elayaperumal, A. Banana Fiber Reinforced Polymer Composites—A Review. J. Reinf. Plast. Compos. 2010, 29, 2387–2396. [Google Scholar] [CrossRef]
  55. Bordón, P.; Elduque, D.; Paz, R.; Javierre, C.; Kusić, D.; Monzón, M. Analysis of Processing and Environmental Impact of Polymer Compounds Reinforced with Banana Fiber in an Injection Molding Process. J. Clean. Prod. 2022, 379, 134476. [Google Scholar] [CrossRef]
  56. Díaz, S.; Benítez, A.N.; Ramírez-Bolaños, S.; Robaina, L.; Ortega, Z. Optimization of Banana Crop By-Products Solvent Extraction for the Production of Bioactive Compounds. Biomass Convers. Biorefinery 2023, 13, 7701–7712. [Google Scholar] [CrossRef]
  57. Subash, M.C.; Perumalsamy, M. Ultrasound-Mediated Pectin Extraction from Pseudostem Waste of Musa Balbisiana: A Resource from Banana Debris. Polym. Bull. 2023, 80, 9963–9987. [Google Scholar] [CrossRef]
  58. Balakrishnan, S.; Wickramasinghe, G.; Wijayapala, U.S. Investigation on Improving Banana Fiber Fineness for Textile Application. Text. Res. J. 2019, 89, 4398–4409. [Google Scholar] [CrossRef]
  59. Moreira, M.I.D.; Zambrano, D.B.V.; Villafuerte, C.R.D. Evaluation of the Physical Properties of Banana Pseudostem for Textile Application. Vis. Sustain. 2023, 2023. [Google Scholar] [CrossRef]
  60. Xu, S.; Yu, W.; Liu, S.; Xu, C.; Li, J.; Zhang, Y. Adsorption of Hexavalent Chromium Using Banana Pseudostem Biochar and Its Mechanism. Sustainability 2018, 10, 4250. [Google Scholar] [CrossRef]
  61. Liu, K.; Du, H.; Zheng, T.; Liu, H.; Zhang, M.; Zhang, R.; Li, H.; Xie, H.; Zhang, X.; Ma, M.; et al. Recent Advances in Cellulose and Its Derivatives for Oilfield Applications. Carbohydr. Polym. 2021, 259, 117740. [Google Scholar] [CrossRef] [PubMed]
  62. Bahsaine, K.; Chakhtouna, H.; Mekhzoum, M.E.M.; Zari, N.; Benzeid, H.; Qaiss, A.; Bouhfid, R. Efficient Cadmium Removal from Industrial Phosphoric Acid Using Banana Pseudostem-Derived Biochar. Biomass Convers. Biorefinery 2023. [Google Scholar] [CrossRef]
  63. Monzón, M.; Suárez, L.A.; Pestana, J.D.; Ortega, F.; Benítez, A.N.; Ortega, Z.; Hernández, P.M.; Marrero, M.D.; Díaz, N.; Paz, R.; et al. Procedimiento y Máquina Para La Obtención de Fibra a Partir de Hojas. Patent ES2514215A2, 27 October 2014. [Google Scholar]
  64. TEB-APR-STP-0003; Determination of Exhalation Resistance Test, Air-Purifying Respirators Standard Testing Procedure (STP). National Institute for Occupational Safety and Health: Pittsburgh, PA, USA, 2023.
  65. TEB-APR-STP-0007; Determination of Inhalation Resistance Test, Air-Purifying Respirators Standard Testing Procedure (STP). National Institute for Occupational Safety and Health: Pittsburgh, PA, USA, 2023.
  66. TEB-APR-STP-0059TEB-APR-STP-0059; Determination of Particulate Filter Efficiency Level for N95 Series Filters Against Solid Particulates for Non-Powered, Air-Purifying Respirators (STP). National Institute for Occupational Safety and Health: Pittsburgh, PA, USA, 2019.
  67. Diarsa, M.; Gupte, A. Preparation, Characterization and Its Potential Applications in Isoniazid Drug Delivery of Porous Microcrystalline Cellulose from Banana Pseudostem Fibers. 3 Biotech 2021, 11, 334. [Google Scholar] [CrossRef]
Figure 1. Filters obtained by each manufacturing process: freeze-dried, vacuum filtered, crushed, and pressed (from left to right). (A) row: alkali-treated pulp. (B) row: from bleached pulp.
Environments 11 00050 g001
Figure 2. Test bench used: (A) Equipment installed in the laboratory; (B) Test bench flow diagrams and configurations.
Environments 11 00050 g002
Figure 3. Images from SEM analysis: (A) Uncrushed alkali-treated pulp; (B) Crushed alkali-treated pulp; (C) Uncrushed bleached pulp; (D) Crushed bleached pulp.
Environments 11 00050 g003
Figure 4. Mapping images of observed granulates: (A) Alkali-treated pulp; (B) Bleached pulp.
Environments 11 00050 g004
Figure 5. FTIR spectra of the pulp (solid blue line), the bleached pulp (dashed blue line), and the raw pulp (solid orange line).
Environments 11 00050 g005
Figure 6. Curves from TGA analysis of the alkali-treated pulp (solid line) and bleached pulp (dashed line).
Environments 11 00050 g006
Figure 7. Average particle capture efficiencies for each particle size range (green PM10, blue PM2.5, and red PM1) and manufacturing process. The error bars are also shown. The numbers in red indicate average pressure drops in Pa.
Environments 11 00050 g007
Figure 8. SEM images of tested filters: (A) Filtered filters with alkali-treated pulp; (B) Freeze-dried filters with alkali-treated pulp; (C) Pressed filters with alkali-treated pulp; (D) Filtered filters with bleached pulp; (E) Freeze-dried filters with bleached pulp; (F) Pressed filters with bleached pulp. The number 1 indicates a major scale and the number 2, a minor scale.
Environments 11 00050 g008
Figure 9. SEM images of filtered filters: (A) Grammage of 160 g·m−2; (B) Grammage of 100 g·m−2.
Environments 11 00050 g009
Figure 10. Particle capture efficiencies considering different grammages and treatments.
Environments 11 00050 g010
Table 1. Procedure carried out to quantify each pulp component.
ComponentProcedureEquation
MThe alkali-treated pulp (G1) was dried at 105 °C at constant weight (G2). M = G 1     G 2 G 1
IESoxhlet extraction with 380 mL of acetone for three hours. After the extraction, the alkali-treated pulp was raised, filtered and dried at 105 °C at constant weight (G3). I E = G 2     G 3 G 2
SEReflux with 150 mL of deionized water for two hours. After the extraction, the pulp was raised, filtered and dried at 105 °C at constant weight (G4). S E = G 3     G 4 G 2
PReflux with 75 mL of (NH4)2C2O4 for an hour and buffered at pH 5 with a buffer dissolution of acetate. After the extraction, the pulp was raised, filtered and dried at 105 °C at constant weight (G5). P = G 4     G 5 G 2
LBleaching process with 200 mL of NaClO2 (160 mL/g pulp) and 2 mL of glacial acetic acid to maintain a pH 4–5. Reaction time was an hour at 70 °C and with magnetic stirring. Then, the pulp was raised with abundant water TO pH 7, filtered and dried at 105 °C at constant weight (G6). L = G 5     G 6 G 2
HCReflux with 300 mL of 0.5 M NaOH for three hours with an extraction every hour. Followed by filtration using a Gooch funnel and drying at 105 °C at constant weight. Finally, resulting cellulose wash washed filtered and drying at 105 °C at constant weight (G7). H C = G 6     G 7 G 2
AA quantity of alkali-treated pulp (G′1) was burned at 550 °C for five hours in a muffle furnace (G′2). A = G 2 G 1
Moisture (M); insoluble extractive (IE); soluble extractive (SE); pectin (P); lignin (L); hemicellulose (HC); ash (A).
Table 2. Test-bench-measured particle size ranges and particle size classification for the analysis of capture efficiencies.
Measured Particles Size Ranges (µm)PM1PM2.5PM10
0.300–0.374
0.374–0.465
0.465–0.579
0.579–0.721
0.721–0.897
0.897–1.117
1.117–1.391
1.391–1.732
1.732–2.156
2.156–2.685
2.685–3.343
3.343–4.162
4.162–5.182
5.182–6.451
6.451–8.031
8.031–10.00
Table 3. Average percentage composition of each component analyzed in the pulp.
ComponentMass Average (%)
Moisture7.79 ± 0.24
On a dry pulp basis
  Extractive (insoluble)0.76 ± 0.09
  Extractive (soluble)2.13 ± 0.24
  Pectin3.78 ± 0.17
  Lignin2.84 ± 0.64
  Cellulose81.31 ± 1.02
  Hemicellulose1.77 ± 0.12
  Ash5.41 ± 0.04
O48.78 ± 1.78
Ca21.33 ± 3.42
Mg15.26 ± 1.07
Si11.06 ± 1.39
P1.51 ± 0.87
Sb0.95 ± 2.27
Na0.77 ± 0.82
S0.29 ± 0.51
  Undetermined1.99 ± 0.98
Table 4. Results of the two-sample Hotelling’s T2 test.
Size RangeFp-ValueAverage Efficiencies (%)
PM1023.883 × 10−5m (bleached pulp) = 86.5
m (alkali-treated pulp) = 71.0
PM2.523.253 × 10−5m (bleached pulp) = 85.5
m (alkali-treated pulp) = 69.8
PM124.472 × 10−5m (bleached pulp) = 78.1
m (alkali-treated pulp) = 56.0
Table 5. Results of Kruskal–Wallis test (third column) and pair-wise Wilcoxon test (fourth column).
Size RangeFilter Typep-Valuep-Value by Pairs
PM10alkali-treated pulp0.585Freeze-dried—filtered: 1
Freeze-dried—pressed: 1
Filtered—pressed: 1
bleached pulp0.0001Freeze-dried—filtered: 0.0001
Freeze-dried—pressed: 0.0008
Filtered—pressed: 0.7223
PM2.5alkali-treated pulp0.406Freeze-dried—filtered: 0.77
Freeze-dried—pressed: 0.56
Filtered—pressed: 1
bleached pulp0.0002Freeze-dried—filtered: 0.0001
Freeze-dried—pressed: 0.0008
Filtered—pressed: 0.7223
PM1alkali-treated pulp0.588Freeze-dried—filtered: 1
Freeze-dried—pressed: 0.87
Filtered—pressed: 1
bleached pulp0.0001Freeze-dried—filtered: 0.0001
Freeze-dried—pressed: 0.0008
Filtered—pressed: 0.5340
Table 6. Pressure drop, in Pa, for different grammages.
Grammage (g·m−2)Freeze-DriedPressed
Alkali TreatmentBleachingAlkali TreatmentBleaching
7020 ± 28 ± 1408 ± 116552 ± 307
100267 ± 22017 ± 2480 ± 124813 ± 216
160137 ± 8533 ± 22258 ± 3192272 ± 264
Table 7. Particle capture efficiencies and pressure drops for each manufacturing pressure (160 g·m−2).
Pressure (t)Efficiency (%)Pressure Drop (Pa)
PM1PM2.5PM10
270.6 ± 4.382.2 ± 2.682.57 ± 2.3644 ± 158
480.5 ± 3.488.0 ± 1.688.2 ± 1.5957 ± 95
681.6 ± 15.587.0 ± 11.587.0 ± 11.61729 ± 699
882.6 ± 9.087.8 ± 7.888.7 ± 7.22272 ± 264
Table 8. Particle capture efficiency and pressure drop results in freeze-dried pressed hybrid filters.
Pressure (t)Efficiency (%)Pressure Drop (Pa)
PM1PM2.5PM10
0.2551.11 ± 4.4565.97 ± 3.2067.20 ± 2.09117 ± 5
0.562.51 ± 7.6574.77 ± 5.3775.67 ± 5.13212 ± 12
1.068.98 ± 10.2880.11 ± 6.5380.80 ± 6.53379 ± 137
2.083.15 ± 2.0789.28 ± 1.3889.90 ± 1.38558 ± 171
Table 9. Results of filtration tests for commercial filters.
Filter TypeEfficiency (%)Pressure Drop (Pa)
PM1PM2.5PM10
Surgical mask88.08 ± 7.2792.20 ± 4.9592.71 ± 4.2267 ± 4
Whatman GF/A99.87 ± 0.2497.09 ± 0.0397.12 ± 0.04747 ± 19
Disclaimer/Publisher’s Note: The statements, opinions and data contained in all publications are solely those of the individual author(s) and contributor(s) and not of MDPI and/or the editor(s). MDPI and/or the editor(s) disclaim responsibility for any injury to people or property resulting from any ideas, methods, instructions or products referred to in the content.

