Article

Evaluation of the Effects of Environmental Factors on Seasonal Variations in Fish Diversity on a Coastal Island in Western Japan

1
Graduate School of Environmental and Life Science, Okayama University, Okayama 7008530, Japan
2
Faculty of Technology—Engineering—Environment, An Giang University, Vietnam National University Ho Chi Minh City, Long Xuyen 880000, An Giang, Vietnam
3
Graduate School of Advanced Science and Engineering, Hiroshima University, Higashi Hiroshima 7398521, Japan
4
Ushimado Marine Institute (UMI), Graduate School of Environment, Life, Natural Science and Technology, Okayama University, Okayama 7014303, Japan
*
Author to whom correspondence should be addressed.
Environments 2024, 11(3), 60; https://doi.org/10.3390/environments11030060
Submission received: 16 February 2024 / Revised: 17 March 2024 / Accepted: 18 March 2024 / Published: 20 March 2024

Abstract

:
Coastal habitats are crucial for supporting ecological processes and serve as vital ecosystems for diverse fish species, providing essential functions such as feeding, nursery provision, and reproductive habitats. Fish communities are ecologically important components of coastal ecosystems and are affected by multiple environmental factors. Despite their importance, determining the effects of environmental factors on seasonal variations in fish species diversity and community dynamics remains a challenge. The advent of environmental DNA (eDNA) technology, an environmentally conscious approach, has resulted in considerable advancements in recent years and has been progressively adopted for marine fish population monitoring. Here, we used environmental DNA metabarcoding to study seasonal variations in fish community structure on a coastal island, and we assessed the effects of environmental factors in structuring these communities. Our findings revealed a rich diversity of 72 fish species across 40 families and 23 orders in the seawater surrounding an island of the Seto Inland Sea (SIS), Western Japan. Notably, the composition of fish communities varied significantly between seasons, with seawater temperature, salinity, and dissolved inorganic phosphorus (DIP) concentration identified as important factors correlated with fish communities’ structures. In conclusion, our study provides useful information of fish diversity, and we suggest that eDNA is a valuable technique for monitoring fish diversity in coastal areas. These findings are crucial for ecological studies and the environmental monitoring of oceanic coastal environments.

1. Introduction

Coastal areas serve as the interface between inland and offshore ecosystems and provide important ecosystem functions (such as spawning, baiting, and nursery grounds) [1]. More species of global marine life have been recorded in coastal than in offshore regions [2]. Coastal fisheries make up 85% of marine capture fisheries [3], indicating that coastal areas are essential for both ecosystem diversity and food security. As the top consumers in coastal ecosystems, fish play a pivotal role that reflects the condition of ecosystems’ health. The changes in fish communities are related to multiple factors, such as hydrological conditions, seawater quality, and habitats [4,5,6]. For example, the structure of coastal fish communities is potentially influenced by geographical factors (e.g., latitudes and longitudes, coastal topography) [6,7]. Previous studies have discussed ecosystem diversity and fish communities in several domains such as in open oceans, continental shelves, enclosed seas, and estuaries [7,8,9,10,11,12]. Within vast coastal ecosystems, coastal islands are characterized by greater species diversity [12,13,14]. Coastal island ecosystems are diverse and include many types of habitats such as seagrass meadows, kelp forests, rocky shores, coral reefs, and sandy beaches [1,15,16]. Due to their diverse physical settings, topography, and geologies, coastal islands provide a rich array of marine habitats for the organisms that inhabit them [1,17,18]. In the environments of small-scale islands, terrestrial factors, such as freshwater discharges, exert a greater influence, with significant seasonal variability, than open ocean factors such as oceanic currents [13,16,19]. However, the effects of environmental factors on fish diversity remain incompletely understood, particularly when considering seasonal variations in fish community composition.
Environmental factors that can affect the fish community vary not only spatially, but also temporally. For example, seasonal changes in physical and biogeochemical factors, such as temperature and salinity, as well as nutrient loadings can significantly impact the abundance and composition of fish communities [20,21]. During the rainy season, high freshwater discharge can modify environmental conditions, leading to seasonal fluctuations in temperature, salinity, and nutrient loadings [22,23,24]. Variations in nutrient loadings influence the production and biomass of phytoplankton, impacting competition for resources and predator–prey dynamics [24,25,26]. Seasonal seawater temperature patterns impact the metabolism of fish species, the activities of larvae, and the distribution of fish eggs [20,27,28,29]. The migration and spawning behaviors of fish species are likewise influenced by seasonal variations in temperature and salinity, leading to fluctuations in species number, biomass, and density [30,31,32,33]. Thus, to ensure sustainable use of fishery resources, it is necessary to obtain basic information on fish communities and their responses to changes in the seasonal variations in environmental factors.
Generally, monitoring marine species is difficult because of the challenges in accessing marine habitats and developing methods that can accurately detect all species present. Traditional methods for surveying fish diversity based on capture methods (e.g., traps, tow nets, and beam trawls) are time-consuming, detrimental to biodiversity, rely on taxonomic expertise, only select a subset of species at the time, and are spatially restricted to certain areas. Other non-destructive survey methods such as underwater visual censuses (UVCs) [34] and baited remote underwater video stations [35] may be affected by the turbidity of underwater ecosystems, hindering the efficiency and accuracy of these methods. Nowadays, environmental DNA (eDNA) is utilized to detect species within specific areas through the collection of sediment [36,37] and water samples [7,38,39], followed by DNA extraction, PCR amplification, and high-throughput sequencing. All sites, including rivers [40], lakes [41], lagoons [42], estuaries [43,44], and coastal waters [43,45] can be easily sampled to collect eDNA. This technique is considered sensitive because it allows for the identification of rare [40,46], invasive [47,48], or migratory species [49,50]. eDNA metabarcoding enables simultaneous detection of multiple species using high-throughput next-generation sequencing [51,52,53]. Thus, this approach is more accurate and simpler to utilize than traditional methods [45,54]. This study aimed to (i) utilize eDNA technology to reveal seasonal differences in fish community patterns and (ii) to identify the influence of physical and biochemical factors associated with seasonal changes observed in an island of the SIS, Western Japan. We compared fish communities in summer and autumn, exploring regular and seasonal species habits, in addition to assessing how changes in environmental factors correlate with fish community composition.

2. Materials and Methods

2.1. Study Area

Stretching over 3000 km from the subtropics to the subarctic, the Japanese archipelago, comprising four main islands and numerous smaller ones, parallels the eastern rim of the Eurasian continent. Its coast, influenced by two warm (Tsushima and Kuroshio) and one cold (Oyashio) currents, hosts a diverse array of over 4500 warm- and cold-water fish species across 370 families [5]. We carried out this research in the coastal area of Ikuchijima Island, which is in the central region of the Seto Inland Sea (SIS) and far from the two channels (Bungo channel and Kii channel) which connect to the Pacific Ocean (Figure 1b,c). This island appeared to be more influenced by terrestrial factors, such as freshwater discharge, than oceanic currents, which seem to be nearly uniform around the entire island [24,55]. The water temperature in the study area rises by 10 °C from early April to August, peaking in the summer [56]. Rainfall is unevenly distributed, with the majority falling during the rainy season (June to July), leading to increased terrestrial discharge in the area [57,58]. We observed that the coastal area of this island is surrounded by sandy beaches, rocky reefs, and clusters of seaweed and seagrass meadows. The seafloor substrate in the seagrass area consists primarily of mud and sand [59,60]. Moreover, significant agricultural production is carried out on this island, and it ranks as one of Japan’s foremost citrus-producing regions. However, the substantial expansion in agricultural activities has led to a notable surge in the discharge of domestic and agricultural pollutants, exerting a substantial impact on the island’s marine ecosystem [61]. This scenario indicates that nutrient loading predominantly arises from terrestrial sources [24,55].

2.2. Sample Collection

Field surveys were conducted in the coastal area of Ikuchijima Island in August 2021 (summer) and November 2022 (autumn). These seasons were selected because the fish assemblages and nutrient loadings have been shown to vary greatly between these seasons [59,60,62]. Seawater samples were collected from the surface layer from a boat by slowly circling around 13 stations of the island; the stations were chosen based on a previous study [58]. Those stations are located approximately 100 m from the shore. At each station, three 100 mL seawater samples were collected and transported to the laboratory and kept at 4 °C for chemical analysis. Parameters examined included the levels of ammonia nitrogen (NH4-N, mg/L); nitrite (NO2-N, mg/L); nitrate (NO3-N, mg/L); phosphate (PO4-P, mg/L); and silicate (Si(OH)4-Si, mg/L). Chemical analyses were performed using an auto-analyzer (swAAt, BLTEC). We define dissolved inorganic nitrogen (DIN) as the sum of ammonia nitrogen (NH4-N, mg/L), nitrite (NO2-N, mg/L), and nitrate (NO3-N, mg/L). Phosphate (PO4-P, mg/L) is reported as dissolved inorganic phosphorus (DIP), while silicate (Si(OH)4-Si, mg/L) is reported as dissolved silicate (DSi). While collecting seawater samples, a potable water quality analyzer (CTD-Diver, vanEssen Instruments) was employed to record seawater temperatures and salinity at each station.
For eDNA samples, surface seawater samples were collected from 13 stations along the coast of Ikuchijima Island for each survey. Two 1 L bottles of water were collected per site (two replicates) from the surface layer using polypropylene bottles, with 1 mL of 10% benzalkonium chloride solution (Osvan 10%, Nihon Pharmaceutical Co., Ltd., Tokyo, Japan) being immediately added to prevent eDNA degradation by bacteria. Field water samples and 1 L distilled water (negative control) were kept on ice during sampling and transport until filtration. Each 1 L water sample was filtered through a Sterivex-HV filter (pore size, 0.45 μm; Merck Millipore, Burlington, MA, USA) using a luer-lock syringe (TERUMO, Tokyo, Japan) and directly immersed in 1.5 mL of RNAlater (Thermo Fisher Scientific, Waltham, MA, USA) to avoid DNA degradation. Filtered Sterivex units were stored at −20 °C in the laboratory until DNA extraction.

2.3. Environmental DNA (eDNA) Analysis and Species Analysis

Total DNA was extracted by using a DNeasy Blood and Tissue Kit (Qiagen, Hilden, Germany), as described by Minamoto et al. [63] and following the manufacturer’s protocol with minor modifications. After purification, the DNA was eluted with 100 μL elution buffer (buffer AE) and stored at −20 °C.
The amplicon libraries of the spatial 12S rRNA region were constructed using the universal Mifish primer sets (MiFish-E-F/R-v2:MiFish-U-F/R:MiFish-U2-F/R = 1:2:1) following the procedures described by Miya et al. [52]. KAPA HiFi HotStart ReadyMix (KAPA Biosystems, Wilmington, MA, USA) was used for the amplification of eDNA, and GeneRead Size Selection Kit (Qiagen, Hilden, Germany) and Agencourt AMPure XP (Beckman Coulter, Tokyo, Japan) for purification of first and second PCR products according to the manufacturers’ protocols. Purified PCR products were quantified using a Qubit 2.0 fluorometer and dsDNA HS Assay Kit (Thermo Fisher Scientific, Waltham, MA, USA) and a TapeStation 4150 and DNA High Sensitivity D1000 (Agilent, Santa Clara, CA, USA). The obtained sequencing libraries were quantified using a Qubit 2.0 fluorometer and dsDNA HS Assay Kit (Thermo Fisher Scientific, Waltham, MA, USA) and pooled in equal concentrations. Libraries were sequenced using an Illumina MiSeq system with 600-cycle chemistry (2 × 300 bp paired-end sequencing using the MiSeq Reagent Kit v3) (Illumina, San Diego, CA, USA).

2.4. Bioinformatic Analysis

Sequence pairs of all samples were analyzed following Miya et al. (2015) and using the publicly available bioinformatics pipeline, Mifish Pipeline [64]. All sequencing data underwent quality control by FastQC, and low-quality 3′-tails were trimmed. FLASH was used to merge paired-end reads and to remove erroneously merged reads (229 ± 25 bp by default). The primer sequences were removed by TagCleaner. Finally, sequence data were clustered and dereplicated into unique sequences, followed by the removal of singleton and chimera sequences by Uclust and UCHIME. The ZOTUs (zero-radius Operation Taxonomic Units) table was obtained and queried against the Mitofish database (fish mitochondrial genome database) with a identification threshold of 97% and an e-value of 10−5 as determine by Blast [65,66].
Species lists obtained from the pipeline have yet to be verified; each species on the list was checked against originally aligned sequences by the NCBI Basic Local Alignment Search Tool [67]. Thereafter, only ZOTUs with a number of reads > 0.05% (i.e., ≥16 reads) were used for future analyses [6,23,44]. Any species that failed to meet these requirements were excluded from the fish list, as failure indicates a highly suspicious sign of contamination. This study focused exclusively on the coastal fish community, excluding non-fish and freshwater fish species from the analysis. The total number of reads obtained is shown in Table S1.

2.5. Statistical Analysis

2.5.1. Nonparametric Analyses

First, to illustrate the relative proportion of fish species detected, the raw read numbers were transformed into relative abundance [68]. For further analysis, the raw dataset obtained from eDNA metabarcoding was transformed by Hellinger transformation, and the environmental factors dataset was standardized [68]. The fish alpha diversity was characterized using species richness (total number of species at each station) and the Shannon–Wiener diversity index (H) [69]. To evaluate the disparity in fish community composition between two seasons, assessments of community dissimilarity were performed through Analysis of Similarities (ANOSIM) utilizing a Bray–Curtis matrix within the respective groups. In this analysis, 999 random permutations were performed to evaluate the statistical significance of the differences in fish community structure between seasons [70]. Similarity Percentage (SIMPER) analysis of the Bray–Curtis matrix was used to identify the key fish species with the most substantial contribution to the dissimilarity observed between the two seasons. The cut-off threshold was set at >7% (Contrib%) [43] to identify fish species that contributed substantially to the overall dissimilarity. Subsequently, the average dissimilarity within each season was calculated, and this average dissimilarity was divided into the contributions of each individual species [70].

2.5.2. Multivariate Analysis

Principal component analysis (PCA) was used to analyze correlations between the fish alpha diversity index and environmental factors. The loadings of the original variables on each principal component (PC) indicated their contributions to the overall variation in the dataset. Positive or negative loadings indicated positive or negative correlations, respectively, between the variables and the corresponding PC [71]. For the PCA, variables with a cos2 value closer to 1 are more representative in the principal component, while those closer to 0 are less representative. Variables that are close together and in the same direction indicate a positive correlation, while those in the opposite direction indicate a negative correlation. When the environmental vector is long, it accounts for a high percentage of the variation. The ‘mvpart’ package and ‘MVPARTwrap’ package were used for multiple regression tree (MRT) analysis. The multiple regression tree model utilizes environmental factors as nodes for classification, effectively partitioning sampling stations into clusters that represent cohorts of sampling points characterized by similar environmental conditions and fish community compositions [72]. Spearman’s correlation was applied to find the correlations between environmental factors and fish communities for each season [73]. The Mantel tests combined with Spearman correlation matrices were performed using the ‘linkET’ package (manteltest function) in R software to determine the correlations between environmental factors and fish community composition [23,74]. To compare the fish species detected by eDNA in this study with those identified in previous studies in the Seto Inland Sea and other coastal areas, a comprehensive checklist of the fish species found in the Seto Inland Sea was compiled. This checklist was established utilizing the eDNA detection data from this study, supplemented by peer-reviewed publications. The methodologies employed in each publication were meticulously documented alongside the respective species lists. A Venn diagram was constructed to illustrate the comparative results. All statistical analyses were performed using R version 4.2.0 [75].

3. Results

3.1. Seasonal Variations in Water Temperature, Salinity, and Nutrients

The mean seawater temperature in summer was 26.5 °C ± 0.67 SD (standard deviation), ranging from 26.0 °C to 28.0 °C. In contrast, during autumn, the seawater temperatures ranged from 19.8 °C to 21.7 °C, with a mean seawater temperature of 20.7 °C ± 0.55 SD being recorded. The mean salinity, ranging from 30.5 psu ± 0.19 SD to 33.5 psu ± 0.10 SD, exhibited seasonal variation, with the highest levels observed during autumn and the lowest during the summer survey. In terms of nutrient concentrations, dissolved inorganic nitrogen (DIN) levels were lower in summer than in autumn. However, both dissolved inorganic phosphorus (DIP) and dissolved silicate (DSi) concentrations were higher in summer (Table 1). In summary, the summer season demonstrated higher surface temperatures and DIP and DSi concentrations but lower salinity and DIN concentrations than autumn.

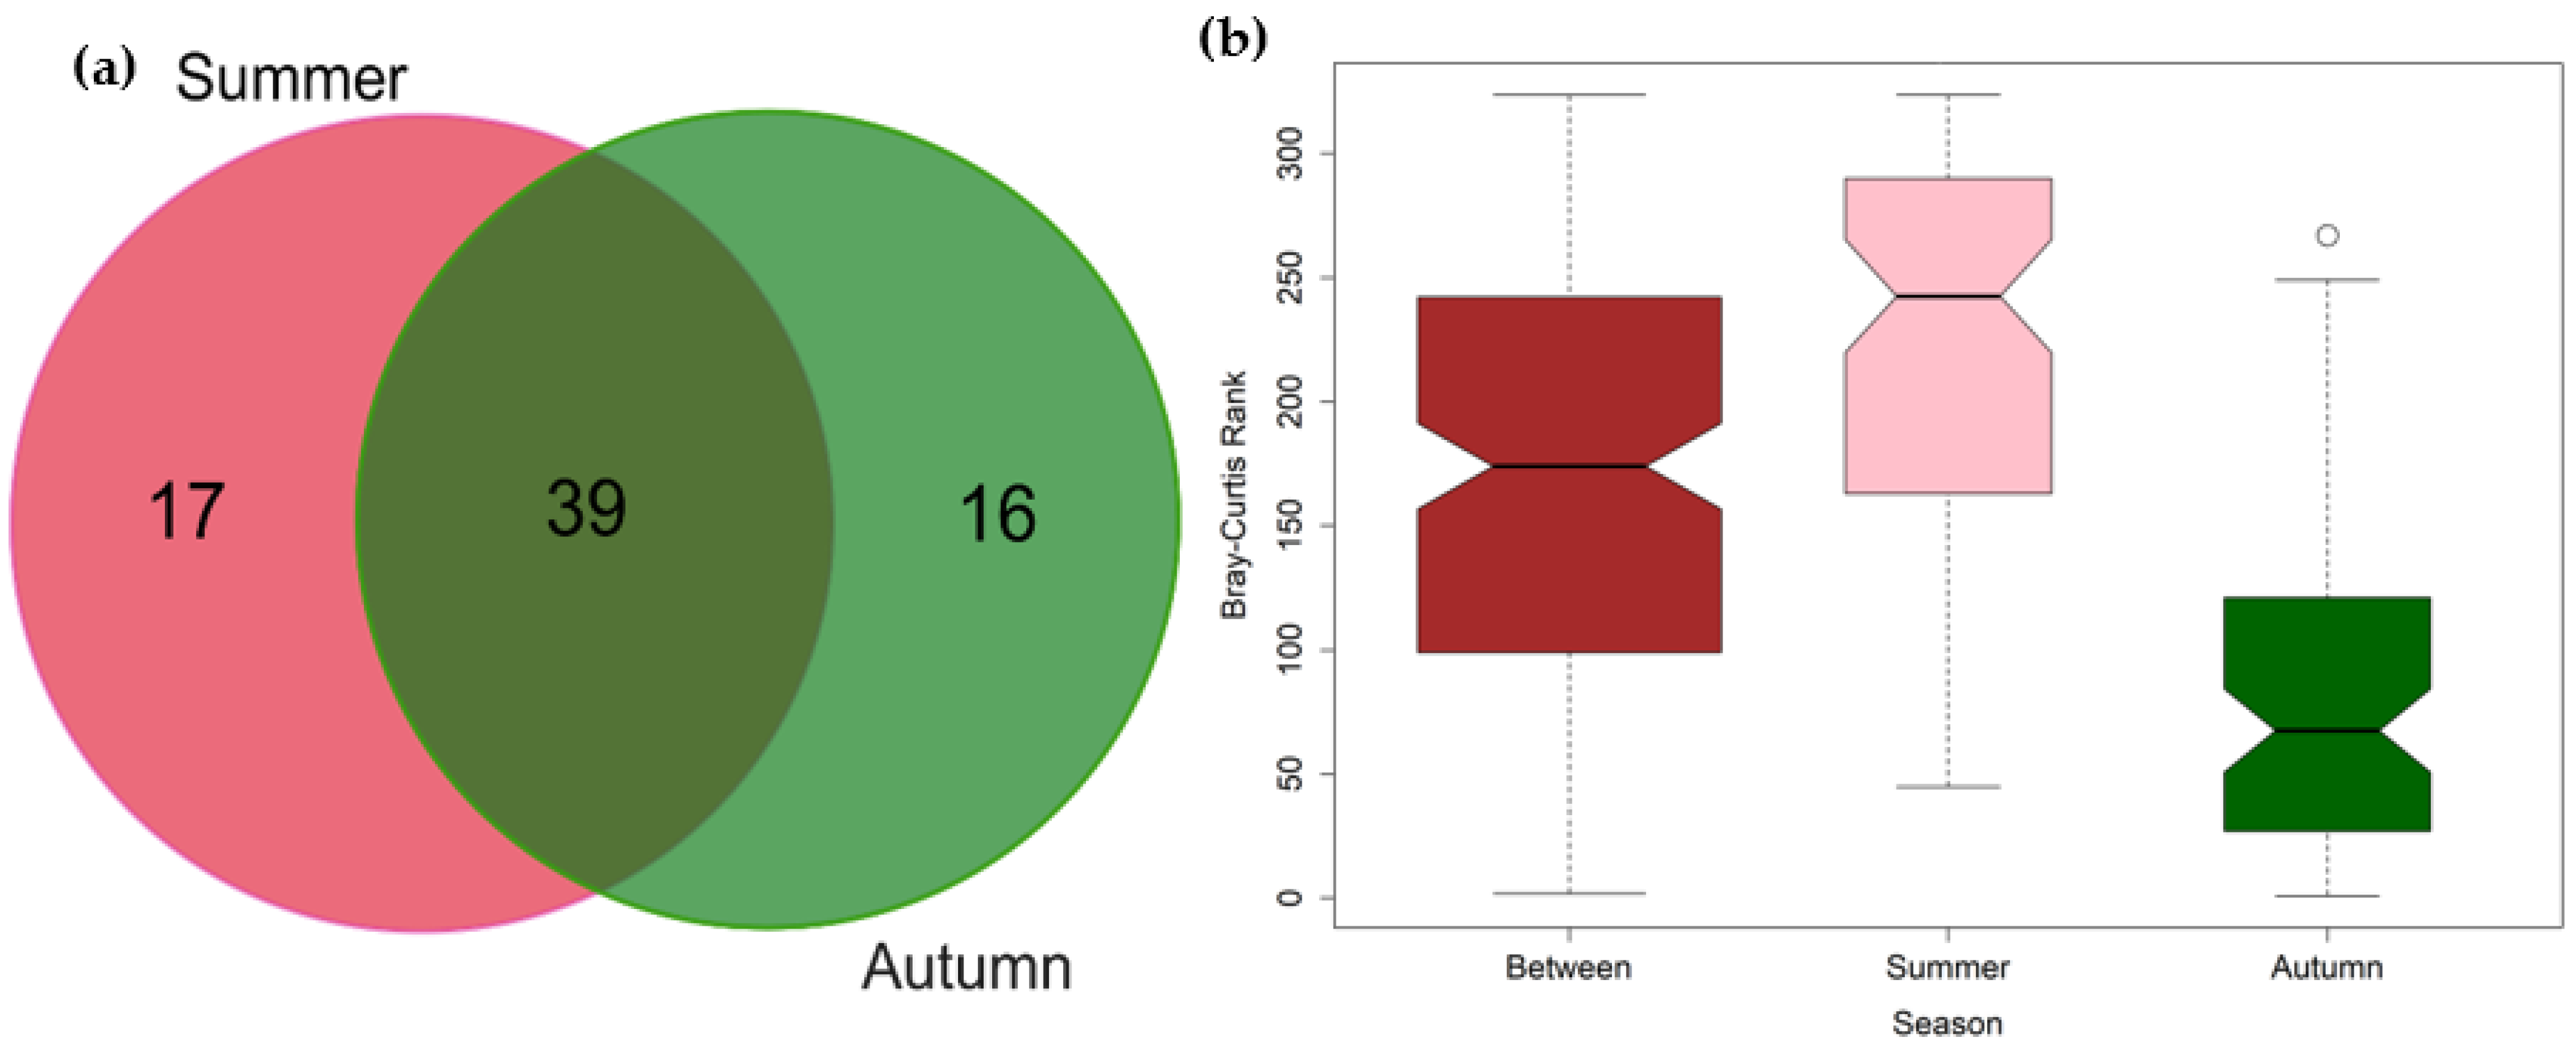
3.2. Seasonal Variations in the Composition of Fish Communities

Sequencing of the 12S libraries generated 6,600,220 raw reads. After quality filtering, removal of chimeric sequences, filtering based on read length, denoising, and bioinformatic identification using the Mifish pipeline, a final count of 2,999,240 reads were obtained (964,886 and 2,034,354 reads in the summer and autumn surveys, respectively) (Table S2). No fish species were detected in the negative controls, including the field/filtration blanks, and PCR-negative controls. Based on a sequence consistency threshold of at least 97% [65], 72 fish species belonging to 40 families and 23 orders were identified in the 26 samples collected from 13 different stations in summer and autumn, accounting for 2,999,240 reads. The most abundant fish species sed on percent composition were blackhead seabream (Acanthopagrus schelegelii), red seabream (Pagrus major), Japanese anchovy (Engraulis japonicus), flathead grey mullet (Mugil cephalus), mottled spinefoot (Siganus fuscescens), and Japanese sillago (Sillago japonica) (Figure 2).
Analysis of the eDNA metabarcoding revealed significant seasonal differences in fish communities. A shift in the composition of fish communities was observed (Figure 3a), with 56 fish species identified in summer and 55 species in autumn. Among all the species detected, 17 fish species were exclusive to the summer season, whereas 16 fish species were unique to autumn. There were 17 species of warm-water fish, 44 species of temperate-water fish, and 11 species of cold-water fish, which represented proportions of 23.6%, 61.1%, and 15.3%, respectively, of the total fish species. Temperate-water species were the dominant species, followed by warm-water and cold-water species. The number of species found in cold water increased in autumn. The nonparametric test of ANOSIM with Bray–Curtis distance demonstrated that fish communities’ compositions showed significant differences between summer and autumn (R = 0.115, p = 0.0083) (Figure 3b). Using SIMPER analysis, we identified fish species responsible for 73.05% of the dissimilarity observed in the pairwise seasonal comparisons (Table S3). Notably, some of these species are known to be migratory, and classified such as Japanese anchovy (Engraulis japonicus), flathead grey mullet (Mugil cephalus), Japanese halfbreak (Hyporhamphus sajori), marbled rockfish (Sebastiscus marmoratus), and (Seriola quinqueradiata), highly contributing to the dissimilarity.

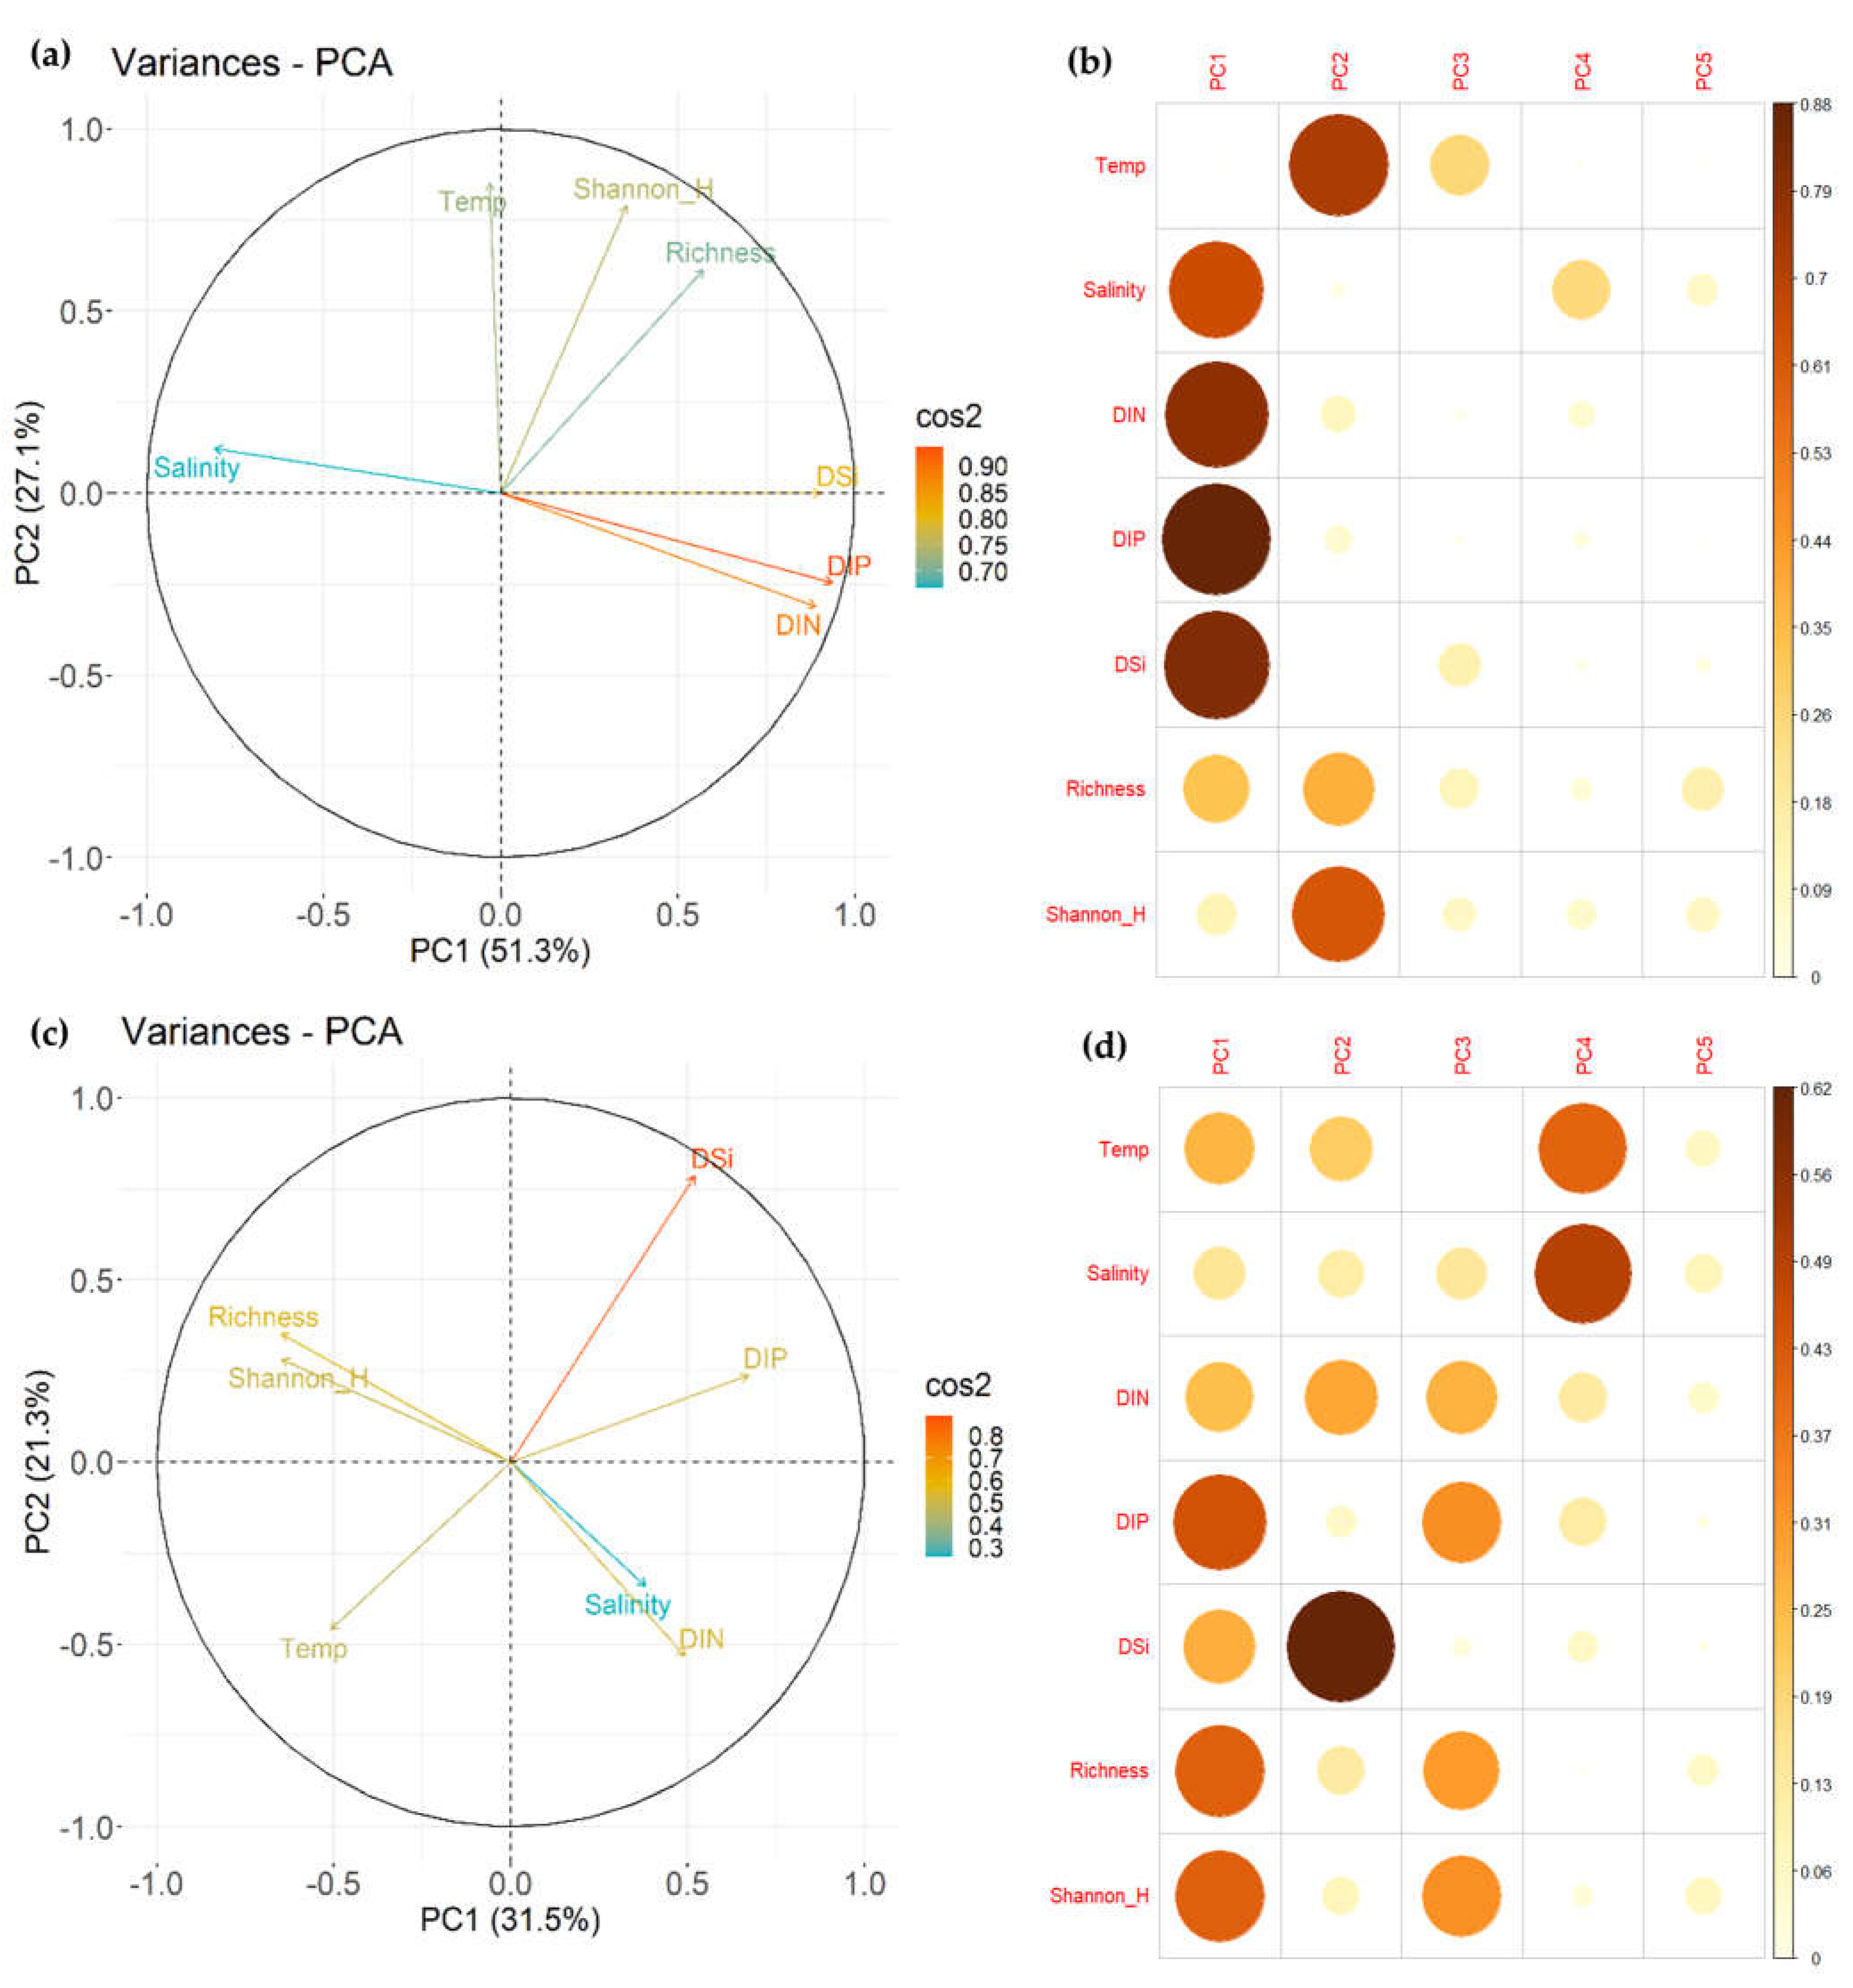
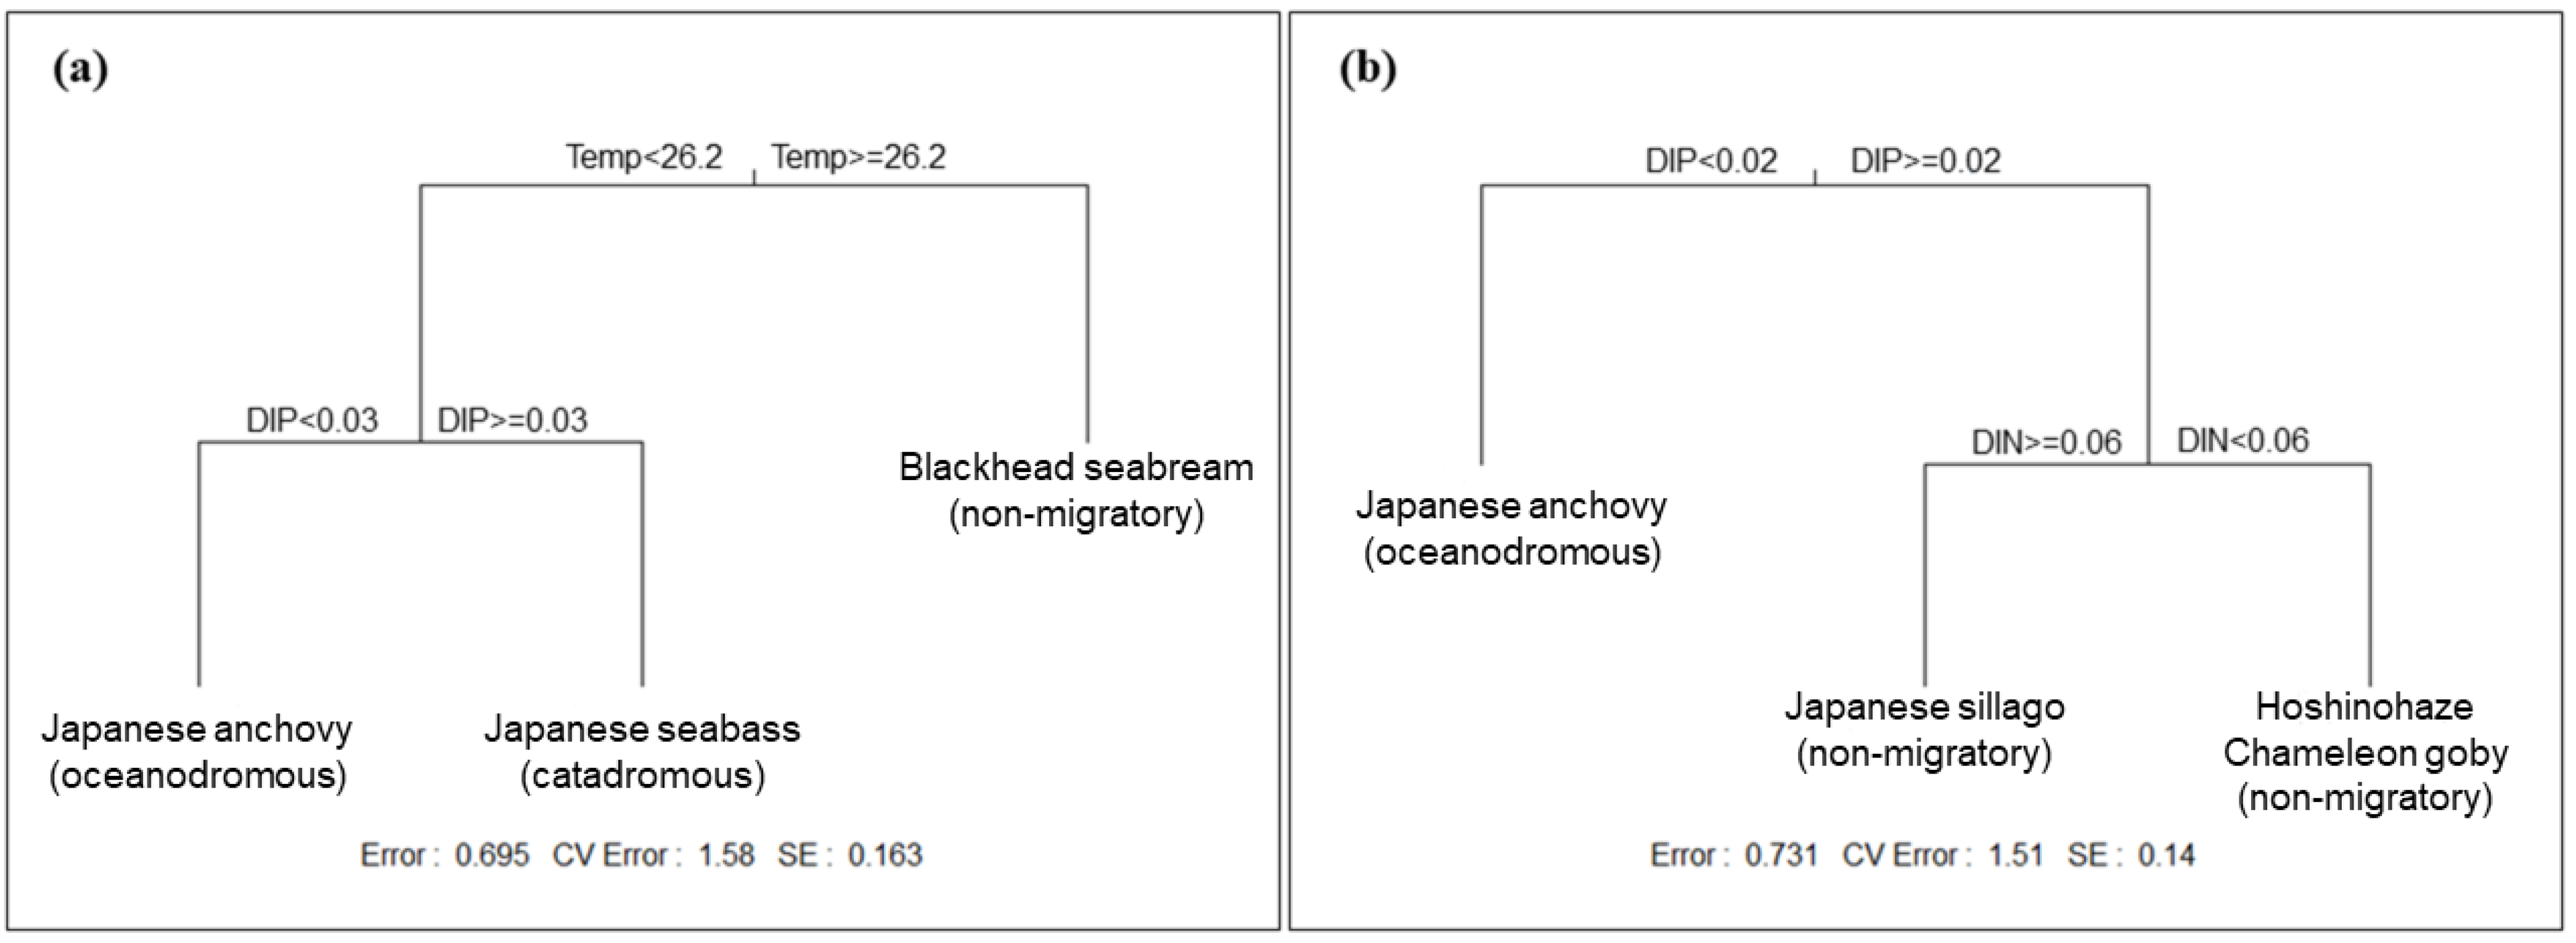
3.3. Influence of Environmental Factors on Fish Communities

Principal component analysis was performed to evaluate how environmental factors, fish species richness, and fish diversity index (Shannon H) were correlated across the two seasons (Figure 4). In summer, the results obtained from the PCA revealed that the species richness and H index were highly correlated with water temperature, salinity, and the concentration of nutrients (DIN, DIP, and DSi). PC1 and PC2 explained 51.3% and 27.1% of the total variance, respectively, as illustrated in Figure 4a,b. In autumn, PC1 and PC2 explained 31.5% and 21.3% of the variation, accounting for 52.8% of the total variance. Specifically, water temperature, DSi, and DIP were highly correlated with fish alpha diversity (species richness and Shannon H index) in PC1 (Figure 4c,d). In addition, the fish diversity index and nutrient concentrations (DIP and DIN) were explained well by PC3. PC3 reflected the correlation between nutrients and fish alpha diversity in autumn (Figure 4d).
A comprehensive multiple regression tree model was used to explore the relationship between environmental factors and fish communities (Figure 5). In summer, a three-branch tree is formed by two splits; the first based on seawater temperature (Temp < 26.2 and ≥26.2) and then, for the low seawater temperature level, a second split based on DIP concentration (<0.03 and ≥0.03). Analysis of the multiple regression tree model revealed seawater temperature as the most influential predictor of fish community dynamics, followed by DIP as the next most significant factor (Figure 5a). The model illustrates that during summer, the fish community structure is primarily correlated to seawater temperature and DIP, explaining 30.5% of the variance in community composition. In contrast, in autumn, the model first splits based on DIP concentration (<0.02 and ≥0.02), and then, for high DIP levels, it splits again based on DIN concentration (≥0.06 and <0.06). Moreover, DIP and DIN emerge as the primary factors in autumn, contributing to 26.9% of the variance (Cb). The top indicator fish species are shown in Figure 5 for each leaf of both trees. These results indicate a seasonal shift in the biotic and abiotic factors influencing the structure of the coastal fish community.
To explore the association between the taxonomy of each fish and the environmental factors, the Spearman test and Mantel test were applied. At the family level, Spearman’s correlation test provided insights into the associations between specific fish families and environmental factors. Sillaginidae, Clupeidae, and Hemiramphidae were positively and statistically significantly correlated with seawater temperature, indicating that seawater temperature increased with increasing relative abundance of those families. Blenniidae and Mugilidae were negatively associated with salinity and concurrently displayed positive associations with DIN, DIP, and DSi during summer (Figure S1), indicating that salinity increases with decrease in the relative abundance of those families. In contrast, throughout autumn, Sillaginidae exhibited strong positive correlations with DIN and DIP. Girellidae, Stichaeidae, and Carangidae all displayed robust positive associations with DIN. Additionally, DSi was negatively correlated with Haemulidae, whereas only Leiognathidae displayed a substantial negative association with salinity (Figure S1). Overall, nutrient concentrations have strong correlations with the relative abundance of some specific families, except for a negative correlation with the relative abundance of Haemulidae. The Mantel test also revealed significant associations between water temperature, salinity, and specific fish groups at the species level in summer or autumn (Figure S2).

3.4. Comparison of eDNA-Based Species with Previous Reports

Based on the results of eDNA detection and additional data from various sources, we obtained a fish checklist composed of 72 species. Fishes included on the checklist also exhibited a range of habitat preferences (i.e., warm water, cold water, and temperate), life history strategies (i.e., amphidromous, catadromous, oceanodromous, and marine), and the importance of fishery (Table S2). We observed a resemblance between the results of the eDNA methods in this study and those in previous databases which used catch methods in the central SIS area. Specifically, we identified 31 overlapping families between Ikuchijima and the previous surveys in the SIS [59,60]. This similarity strongly suggests that the sampling areas were relatively homogeneous. In addition, Sardinella lemuru (near-threatened) and Epinephelus akaara (endangered), two species on the IUCN Red list, were only detected by eDNA metabarcoding in this study and were not detected in previous studies. In this study, we also compared the number of fish species across various coastal habitats, including coastal bays, shelves, estuaries, and gulfs (Table S5). Our observations revealed that the waters surrounding Ikuchijma Island contain a notably higher number of fish species compared to other surveyed areas.

4. Discussion

4.1. Controlling Factors of the Seasonal Fluctuations in Fish Community Compositions

Seasonal variations in fish communities are driven by an interplay of environmental factors and biological traits, including reproductive behaviors and migrations. Through the eDNA analysis, and incorporating principal component analysis, a multiple regression tree model, and Mantel tests, we identified temperature as a key environmental factor influencing both warm-water and cold-water fish communities (Figure S2). Species such as Acanthopagrus schlegelii and Pagrus major, endemic to the Seto Inland Sea, exhibit ecological attributes that enable adaptation to diverse temperature and salinity conditions, indicative of their high physiological adaptability [76,77,78,79]. While these species were detected across seasons, their relative abundance exhibited seasonal variation (Table S3). The autumn season is distinguished by a pronounced prevalence of resident coastal fish species, predominantly Acanthopagrus schlegelii, with its relative abundance exceeding that of the summer season.
In summer, the eDNA abundances of Japanese gizzard shad (Konosirus punctatus), Japanese halfbreak (Hyporhamphus sajori), and marbled rockfish (Sebastiscus marmoratus) were higher than in the autumn (Table S2). These species, particularly Konosirus punctatus (an oceanodromous species) and Hyporhamphus sajori (an amphidromous species) are typically found in coastal and bay environments from June to August. While these species do not undertake long-distance migrations during their lifetime, they do exhibit small-scale seasonal migrations. The high seawater temperature in summer plays a crucial role in the reproductive biology of these species. For instance, it creates optimal conditions for the spawning and larval development of Konosirus punctatus [80]. Similarly, Hyporhamphus also exhibits a peak in reproductive activities during the summer, resulting in higher abundances due to increased food availability and favorable environmental conditions [81]. In addition to temperature, the presence of larger seagrass patches at shore sites during the summer season contributes to a higher relative abundance of some fish species. For example, Konosirus punctatus and Hyporhamphus sajori are usually found near the sites where seagrass and seaweed are present. Females of these species often enter seaweed beds and attach their eggs to seaweeds or drifting seaweeds during their spawning season [30,80,82]. During the summer season, the seagrass meadows of Ikuchijima Island serve as the spawning and nursery grounds for some fish species, leading to a high relative abundance of these species. This highlights the importance of these habitats in supporting the life cycles of various fish species.
During the autumn season, the compositions of fish communities are significantly influenced by the arrival of migratory fish species. These include Engraulis japonicus, Mugil cephalus, Sillago japonica, and Seriola quinqueradiata (Table S3). As the temperature begins to drop, Engraulis japonicus (Japanese anchovy), known for its migratory behavior, tends to migrate toward coastal areas. These areas provide suitable conditions for feeding and spawning [83,84]. Similarly, the catadromous species, adult M. cephalus, usually forms large schools and migrates to coastal areas for spawning in early autumn [85]. Our study documented an elevated eDNA abundance of this species during the November survey, which aligns with the spawning season trend of M. cephalus. Another species, Seriola quinqueradiata (yellowtail), which is an oceanodromous species, undergoes a northward migration in its early life stages. This migration to recruit marine waters occurs from autumn to early winter [86]. Our study revealed a similar trend in which the yellowtail migrated to the shallow coastal shoreline as the water temperature declined during the autumn survey. Salinity also had a significant influence on the fish community in the study area. Salinity levels were discovered to have a negative correlation with essential nutrient concentrations, such as nitrogen and phosphorus, vital for aquatic life. These fluctuations persist across seasons as the ecosystem reacts to changing environmental factors. Consequently, these variations directly influence the distribution of fish species within the ecosystem. When conditions shift, species with specific habitat preferences may migrate, leading to changes in biodiversity [21]. In addition, fishing activity can also impact the seasonal composition of fish populations. For example, the fishing season for Japanese sillago runs from May to August annually, while Hong Kong grouper’s season spans from June to August [87]. Fishing activities in the study area occur from late November to August each year [87].
Our study provides empirical evidence underscoring the role of chemical factors in shaping fish community compositions. We documented seasonal fluctuations in nutrient concentrations in the coastal seawater surrounding Ikuchijima Island, with DIP and DSi concentrations being higher in summer than in autumn, indicative of nitrogen-limited conditions. During the summer, increased insolation and elevated temperatures stimulate biological activity, such as plant uptake and phytoplankton growth, leading to a reduction in seawater nitrogen concentration [62]. Concurrently, high precipitation, particularly during the summer, increases the amount of DIP and DSi in surface water and groundwater, which then increases the amount discharged into the sea [88,89]. Conversely, in autumn, seawater temperatures drop, growth rates for these vital organisms decrease, and excessive stratification may hinder the mixing of essential nutrients from deeper layers to the surface [24]. Moreover, diminished terrestrial discharge, which serves as a significant source of nutrients like nitrogen and phosphorus, further compounds the issue by potentially lowering nutrient concentrations in coastal seawater [90,91]. The nutrient availability in marine ecosystems fosters the proliferation of planktonic organisms, a primary food source, which in turn can have cascading effects on numerous fish species [92,93]. Additionally, the intricate relationship between nutrient availability and fish composition is further complicated by the specific nutrient requirements of different fish species and the presence of their prey in the food web [83,94,95]. Our observations underscore a robust association between nutrient availability and the ecological dynamics of local coastal ecosystems. Furthermore, our findings reveal that fish community composition exhibits local-scale variations due to environmental factors, which were found to differ between summer and autumn.

4.2. Comprehensive Fish Species Detection through This Study

In this study, we found that the eDNA method detected far more fish at the species and family levels compared to the findings of previous studies which used the catch method (net sampling) during the same season in the SIS (Table S4). The greater detectability of fish when using eDNA methods compared to traditional methods has been reported previously. Traditional methods (i.e., gillnetting, seine netting, and fyke nets) are selective, such as mesh size, net diameter, and materials used to determine the catch; for example, small fish can escape through large mesh sizes. Furthermore, the eDNA method is sensitive enough to detect larvae and small-size fish, which may be overlooked by conventional netting techniques [45,96]. In summary, our study highlights that eDNA metabarcoding is an effective tool for monitoring fish diversity that provides useful information that may be used to manage coastal ecosystems.
In addition, the results of our study indicate that the Ikuchijima Island area is a highly diverse ecosystem, with a higher number of species detected compared to some other coastal areas, despite the small size of the research area [12,13,14,97]. The nearshore regions surrounding this island are characterized by a seafloor substrate primarily composed of mud and sand [59,98]. These areas are also characterized by a diverse array of habitats, including sandy beaches, rocky reefs, and clusters of seaweed and seagrass meadows. Extensive patches of seagrass are observed during the summer season. These features suggest that the Ikuchijima Island area serves as a suitable habitat for ichthyofauna, harboring a wide species diversity that often includes threatened species due to its relatively high biodiversity and productivity [13,20,97,99]. The waters around Ikuchijima Island are also home to a variety of fish species, from objects of high-production commercial fisheries (e.g., Japanese anchovy, Japanese pufferfish, yellowtail) to endangered species on the IUCN Red List, such as Sardinella lemuru (near-threatened) and Epinephelus akaara (endangered) (Table S2). Thus, the high species diversity and unique ecosystem of the Ikuchijima Island area make it an important area for conservation and further study.

5. Conclusions

This study represents the first analysis of seasonal variations in fish community composition in the seawater surrounding an island in the Seto Inland Sea using the eDNA metabarcoding method, while also exploring the impact of physical and biochemical factors on the community composition. Our observations identified key factors influencing coastal fish communities, notably emphasizing the significant influences of seawater temperature and salinity between the two seasons on the fish species within the community. Furthermore, among the chemical factors, DIP was shown to influence the structure of fish communities in both seasons. Through the analysis of eDNA metabarcoding data, we successfully identified seasonal variations in the composition of fish communities, indicating that fish migration occurred during summer and autumn. In conclusion, our findings highlight the potential of eDNA metabarcoding as a tool for monitoring fish communities and enhancing our understanding of their seasonal dynamics, particularly in the context of changes in coastal environments.

Supplementary Materials

The following supporting information can be downloaded at: https://www.mdpi.com/article/10.3390/environments11030060/s1, Figure S1. Correlations between environmental factors and fish family in autumn and summer, Figure S2. Mantel tests and Spearman’s correlation matrix illustrate the relationships between composition of fish communities and dependent factors, Table S1. The total number of reads, Table S2. List of fish species in both seasons, Table S3. % contribution of each species to the Bray Curtis dissimilarity metric between two seasons identified by SIMPER analysis, Table S4. Venn results of fish family detect by eDNA on Ikuchijima vs. catch method on Central Seto Inland Sea, Table S5. Fish spcies detect by eDNA on Ikuchijima vs previous studies. References [7,8,14,15,23,44,53,100] are cited in the supplementary materials.

Author Contributions

Conceptualization, M.S. and S.-i.O.; Methodology, M.S., S.-i.O., M.H. and N.H.N.; Validation, S.-i.O.; Formal analysis, N.H.N.; Investigation, M.S., S.-i.O., M.H. and N.H.N.; Data curation, N.H.N. and M.H.; Writing—original draft preparation, N.H.N.; Writing—review and editing, N.H.N., M.S. and M.H.; Visualization, N.H.N.; Supervision, M.S. and S.-i.O.; Project Administration, M.S. All authors have read and agreed to the published version of the manuscript.

Funding

This research was supported by JSPS Grant-in-Aid for Scientific Research (B) (No. 21H03650, PI: Mitsuyo Saito) and Fostering Joint International Research (A) (No. 20KK0262, PI: Mitsuyo Saito).

Data Availability Statement

The raw data supporting the conclusions of this article will be made available by the corresponding author upon request.

Acknowledgments

We would like to express our gratitude to Tatsuya Sakamoto for the support in using the laboratory of the Ushimado Marine Institute for eDNA analysis and to Hideaki Nagare and Fujio Hyodo for their valuable comments and support of the field campaign. We would like to thank our laboratory members at Hiroshima University and Okayama University for their support during the field campaigns and laboratory analyses.

Conflicts of Interest

The authors declare that they have no known competing financial interests or personal relationships that could have appeared to influence the work reported in this paper. The funders had no role in the design of the study; in the collection, analyses, or interpretation of data; in the writing of the manuscript; or in the decision to publish the results.

References

  1. Friedlander, A.M.; Ballesteros, E.; Caselle, J.E.; Gaymer, C.F.; Palma, A.T.; Petit, I.; Varas, E.; Muñoz Wilson, A.; Sala, E. Marine Biodiversity in Juan Fernández and Desventuradas Islands, Chile: Global Endemism Hotspots. PLoS ONE 2016, 11, e0145059. [Google Scholar] [CrossRef]
  2. Costello, M.J.; Chaudhary, C. Marine Biodiversity, Biogeography, Deep-Sea Gradients, and Conservation. Curr. Biol. 2017, 27, R511–R527. [Google Scholar] [CrossRef]
  3. FAO. Coastal Fisheries Initiative. Available online: https://www.fao.org/in-action/coastal-fisheries-initiative/overview/context/en/ (accessed on 3 January 2024).
  4. Henriques, S.; Guilhaumon, F.; Villéger, S.; Amoroso, S.; França, S.; Pasquaud, S.; Cabral, H.N.; Vasconcelos, R.P. Biogeographical Region and Environmental Conditions Drive Functional Traits of Estuarine Fish Assemblages Worldwide. Fish Fish. 2017, 18, 752–771. [Google Scholar] [CrossRef]
  5. Endo, H.; Matsuura, K. Geography, Currents, and Fish Diversity of Japan. In Fish Diversity of Japan; Springer Nature Singapore: Singapore, 2022; pp. 7–18. [Google Scholar]
  6. Kume, M.; Lavergne, E.; Ahn, H.; Terashima, Y.; Kadowaki, K.; Ye, F.; Kameyama, S.; Kai, Y.; Henmi, Y.; Yamashita, Y.; et al. Factors Structuring Estuarine and Coastal Fish Communities across Japan Using Environmental DNA Metabarcoding. Ecol. Indic. 2021, 121, 107216. [Google Scholar] [CrossRef]
  7. Kim, E.-B.; Sagong, H.; Lee, J.-H.; Kim, G.; Kwon, D.-H.; Kim, Y.; Kim, H.-W. Environmental DNA Metabarcoding Analysis of Fish Assemblages and Phytoplankton Communities in a Furrowed Seabed Area Caused by Aggregate Mining. Front. Mar. Sci. 2022, 9, 788380. [Google Scholar] [CrossRef]
  8. Li, C.; Long, H.; Yang, S.; Zhang, Y.; Tang, F.; Jin, W.; Wang, G.; Chang, W.; Pi, Y.; Gao, L.; et al. EDNA Assessment of Pelagic Fish Diversity, Distribution, and Abundance in the Central Pacific Ocean. Reg. Stud. Mar. Sci. 2022, 56, 102661. [Google Scholar] [CrossRef]
  9. Pintueles-Tamayo, J.F.; Nieto-Navarro, J.T.; Marquez-Cuétara, A.; Domínguez-Ojeda, D.; Zetina-Rejón, M.J. Fish Community Diversity in a Coastal Zone at Southeastern Gulf of California, Mexico. Environ. Sci. Pollut. Res. 2022, 29, 61747–61766. [Google Scholar] [CrossRef]
  10. Lee, Y.-D.; Lee, G.-M.; Gwak, W.-S. Assessment of Fish Diversity in the Coastal Waters off Nodaedo Island, Tongyeong, Korea, Using an Underwater Visual Census and Environmental DNA Metabarcoding. Mar. Biol. 2024, 171, 23. [Google Scholar] [CrossRef]
  11. Itsukushima, R. Broad-Scale Environmental Factors Determining Fish Species Composition of River Estuaries in the Japanese Archipelago. Estuaries Coasts 2023, 46, 1829–1843. [Google Scholar] [CrossRef]
  12. Riofrío-Lazo, M.; Zetina-Rejón, M.J.; Vaca-Pita, L.; Murillo-Posada, J.C.; Páez-Rosas, D. Fish Diversity Patterns along Coastal Habitats of the Southeastern Galapagos Archipelago and Their Relationship with Environmental Variables. Sci. Rep. 2022, 12, 3604. [Google Scholar] [CrossRef]
  13. Luo, Z.; Yang, C.; Wang, L.; Liu, Y.; Shan, B.; Liu, M.; Chen, C.; Guo, T.; Sun, D. Relationships between Fish Community Structure and Environmental Factors in the Nearshore Waters of Hainan Island, South China. Diversity 2023, 15, 901. [Google Scholar] [CrossRef]
  14. Lee, Y.D.; Lee, G.M.; Park, J.Y.; Gwak, W.S. Comparing Environmental DNA Metabarcoding and Underwater Visual Census to Monitor Korean Coastal Fish Community. Ocean Sci. J. 2022, 57, 592–606. [Google Scholar] [CrossRef]
  15. Nguyen, B.N.; Shen, E.W.; Seemann, J.; Correa, A.M.S.; O’Donnell, J.L.; Altieri, A.H.; Knowlton, N.; Crandall, K.A.; Egan, S.P.; McMillan, W.O.; et al. Environmental DNA Survey Captures Patterns of Fish and Invertebrate Diversity across a Tropical Seascape. Sci. Rep. 2020, 10, 6729. [Google Scholar] [CrossRef]
  16. Gillespie, R.G. Oceanic Islands: Models of Diversity. In Encyclopedia of Biodiversity; Elsevier: Amsterdam, The Netherlands, 2001; pp. 590–599. [Google Scholar]
  17. Pippard, H.; Ralph, G.M.; Harvey, M.S.; Carpenter, K.E.; Buchanan, J.R.; Greenfield, D.W.; Harwell, H.D.; Larson, H.K.; Lawrence, A.; Linardich, C.; et al. The Conservation Status of Marine Biodiversity of the Pacific Islands of Oceania; IUCN International Union for Conservation of Nature: Gland, Switzerland, 2017. [Google Scholar]
  18. Ceríaco, L.M.P.; Santos, B.S.; de Lima, R.F.; Bell, R.C.; Norder, S.J.; Melo, M. Physical Geography of the Gulf of Guinea Oceanic Islands. In Biodiversity of the Gulf of Guinea Oceanic Islands; Springer International Publishing: Cham, Switzerland, 2022; pp. 13–36. [Google Scholar]
  19. Cheng, X.; Wang, Z.; Zhang, S.; Zhao, X.; Lin, J.; Huang, H.; Chen, Y.; Zou, Q. Analysis of Short-Term and Local Scale Variations in Fish Community Structure in Dachen Island Waters. Front. Mar. Sci. 2023, 10, 1199524. [Google Scholar] [CrossRef]
  20. Baptista, J.; Martinho, F.; Martins, R.; Carneiro, M.; Azevedo, M.; Vieira, A.R.; Gomes, P.; Pardal, M.A. Water Temperature Gradient Shapes the Structure and Composition of Nearshore Marine Fish Communities in Southern Europe. J. Sea Res. 2019, 154, 101807. [Google Scholar] [CrossRef]
  21. Getz, E.; Eckert, C. Effects of Salinity on Species Richness and Community Composition in a Hypersaline Estuary. Estuaries Coasts 2023, 46, 2175–2189. [Google Scholar] [CrossRef]
  22. Jiang, P.; Zhang, S.; Xu, S.; Xiong, P.; Cao, Y.; Chen, Z.; Li, M. Comparison of Environmental DNA Metabarcoding and Bottom Trawling for Detecting Seasonal Fish Communities and Habitat Preference in a Highly Disturbed Estuary. Ecol. Indic. 2023, 146, 109754. [Google Scholar] [CrossRef]
  23. Li, Z.; Jiang, P.; Wang, L.; Liu, L.; Li, M.; Zou, K. A Comparison of Seasonal Composition and Structure of Fish Community between Environmental DNA Technology and Gillnetting in the Pearl River Estuary, China. Ecol. Indic. 2023, 147, 109915. [Google Scholar] [CrossRef]
  24. Nishijima, W.; Umehara, A.; Yamamoto, K.; Asaoka, S.; Fujii, N.; Otani, S.; Wang, F.; Okuda, T.; Nakai, S. Temporal Distribution of Primary and Secondary Production Estimated from Water Quality Data in the Seto Inland Sea, Japan. Ecol. Indic. 2021, 124, 107405. [Google Scholar] [CrossRef]
  25. Lin, H.Y.; Chiu, M.Y.; Shih, Y.M.; Chen, I.S.; Lee, M.A.; Shao, K.T. Species Composition and Assemblages of Ichthyoplankton during Summer in the East China Sea. Cont. Shelf Res. 2016, 126, 64–78. [Google Scholar] [CrossRef]
  26. Shiomoto, A.; Inoue, K. Seasonal Variations of Size-Fractionated Chlorophyll a and Primary Production in the Coastal Area of Hokkaido in the Okhotsk Sea. SN Appl. Sci. 2020, 2, 1880. [Google Scholar] [CrossRef]
  27. Szabó, P. Ideal Free Distribution of Metabolic Activity: Implications of Seasonal Metabolic-Activity Patterns on Competitive Coexistence. Theor. Popul. Biol. 2016, 111, 1–8. [Google Scholar] [CrossRef]
  28. Bloomfield, E.J.; Guzzo, M.M.; Middel, T.A.; Ridgway, M.S.; McMeans, B.C. Seasonality Can Affect Ecological Interactions between Fishes of Different Thermal Guilds. Front. Ecol. Evol. 2022, 10, 986459. [Google Scholar] [CrossRef]
  29. Bergström, L.; Bergström, U.; Olsson, J.; Carstensen, J. Coastal Fish Indicators Response to Natural and Anthropogenic Drivers–Variability at Temporal and Different Spatial Scales. Estuar. Coast. Shelf Sci. 2016, 183, 62–72. [Google Scholar] [CrossRef]
  30. Long, X.; Wan, R.; Li, Z.; Ren, Y.; Song, P.; Tian, Y.; Xu, B.; Xue, Y. Spatio-Temporal Distribution of Konosirus Punctatus Spawning and Nursing Ground in the South Yellow Sea. Acta Oceanol. Sin. 2021, 40, 133–144. [Google Scholar] [CrossRef]
  31. Shin, D.; Park, T.H.; Kim, D.; Lee, C.I.; Lee, S.J.; Lee, J.H.; Kang, S.; Park, H.J. Spatial and Temporal Variations in Trophic Structure of Fish Assemblages in the Yellow Sea Revealed by C and N Stable Isotopes. Mar. Pollut. Bull. 2023, 196, 115678. [Google Scholar] [CrossRef]
  32. Fujita, T.; Yamamoto, M.; Kono, N.; Tomiyama, T.; Sugimatsu, K.; Yoneda, M. Temporal Variations in Hatch Date and Early Survival of Japanese Anchovy (Engraulis japonicus) in Response to Environmental Factors in the Central Seto Inland Sea, Japan. Fish. Oceanogr. 2021, 30, 527–541. [Google Scholar] [CrossRef]
  33. Da Silva, V.E.L.; Dolbeth, M.; Fabré, N.N. Assessing Tropical Coastal Dynamics across Habitats and Seasons through Different Dimensions of Fish Diversity. Mar. Environ. Res. 2021, 171, 105458. [Google Scholar] [CrossRef]
  34. Edgar, G.J.; Stuart-Smith, R.D. Systematic Global Assessment of Reef Fish Communities by the Reef Life Survey Program. Sci. Data 2014, 1, 140007. [Google Scholar] [CrossRef]
  35. Whitmarsh, S.K.; Fairweather, P.G.; Huveneers, C. What Is Big BRUVver up to? Methods and Uses of Baited Underwater Video. Rev. Fish Biol. Fish. 2017, 27, 53–73. [Google Scholar] [CrossRef]
  36. Ortega, A.; Geraldi, N.R.; Duarte, C.M. Environmental DNA Identifies Marine Macrophyte Contributions to Blue Carbon Sediments. Limnol. Oceanogr. 2020, 65, 3139–3149. [Google Scholar] [CrossRef]
  37. Wei, N.; Nakajima, F.; Tobino, T. Variation of Environmental DNA in Sediment at Different Temporal Scales in Nearshore Area of Tokyo Bay. J. Water Environ. Technol. 2019, 17, 153–162. [Google Scholar] [CrossRef]
  38. Selleslagh, J.; Amara, R. Environmental Factors Structuring Fish Composition and Assemblages in a Small Macrotidal Estuary (Eastern English Channel). Estuar. Coast. Shelf Sci. 2008, 79, 507–517. [Google Scholar] [CrossRef]
  39. Minamoto, T.; Fukuda, M.; Katsuhara, K.R.; Fujiwara, A.; Hidaka, S.; Yamamoto, S.; Takahashi, K.; Masuda, R. Environmental DNA Reflects Spatial and Temporal Jellyfish Distribution. PLoS ONE 2017, 12, e0173073. [Google Scholar] [CrossRef]
  40. Sakata, M.K.; Maki, N.; Sugiyama, H.; Minamoto, T. Identifying a Breeding Habitat of a Critically Endangered Fish, Acheilognathus Typus, in a Natural River in Japan. Sci. Nat. 2017, 104, 100. [Google Scholar] [CrossRef]
  41. Fujii, K.; Doi, H.; Matsuoka, S.; Nagano, M.; Sato, H.; Yamanaka, H. Environmental DNA Metabarcoding for Fish Community Analysis in Backwater Lakes: A Comparison of Capture Methods. PLoS ONE 2019, 14, e0210357. [Google Scholar] [CrossRef]
  42. Oka, S.; Doi, H.; Miyamoto, K.; Hanahara, N.; Sado, T.; Miya, M. Environmental DNA Metabarcoding for Biodiversity Monitoring of a Highly Diverse Tropical Fish Community in a Coral Reef Lagoon: Estimation of Species Richness and Detection of Habitat Segregation. Environ. DNA 2021, 3, 55–69. [Google Scholar] [CrossRef]
  43. DiBattista, J.D.; Fowler, A.M.; Riley, I.J.; Reader, S.; Hay, A.; Parkinson, K.; Hobbs, J.-P.A. The Use of Environmental DNA to Monitor Impacted Coastal Estuaries. Mar. Pollut. Bull. 2022, 181, 113860. [Google Scholar] [CrossRef]
  44. Cheang, C.C.; Lee, B.Y.; Ip, B.H.Y.; Yiu, W.H.; Tsang, L.M.; Ang, P.O. Fish and Crustacean Biodiversity in an Outer Maritime Estuary of the Pearl River Delta Revealed by Environmental DNA. Mar. Pollut. Bull. 2020, 161, 111707. [Google Scholar] [CrossRef]
  45. Bleijswijk, J.D.L.; Engelmann, J.C.; Klunder, L.; Witte, H.J.; Witte, J.I.; Veer, H.W. Analysis of a Coastal North Sea Fish Community: Comparison of Aquatic Environmental DNA Concentrations to Fish Catches. Environ. DNA 2020, 2, 429–445. [Google Scholar] [CrossRef]
  46. Sigsgaard, E.E.; Carl, H.; Møller, P.R.; Thomsen, P.F. Monitoring the Near-Extinct European Weather Loach in Denmark Based on Environmental DNA from Water Samples. Biol. Conserv. 2015, 183, 46–52. [Google Scholar] [CrossRef]
  47. Chucholl, F.; Fiolka, F.; Segelbacher, G.; Epp, L.S. EDNA Detection of Native and Invasive Crayfish Species Allows for Year-Round Monitoring and Large-Scale Screening of Lotic Systems. Front. Environ. Sci. 2021, 9, 639380. [Google Scholar] [CrossRef]
  48. Fernandez, S.; Miller, D.L.; Holman, L.E.; Gittenberger, A.; Ardura, A.; Rius, M.; Mirimin, L. Environmental DNA Sampling Protocols for the Surveillance of Marine Non-Indigenous Species in Irish Coastal Waters. Mar. Pollut. Bull. 2021, 172, 112893. [Google Scholar] [CrossRef]
  49. Thalinger, B.; Wolf, E.; Traugott, M.; Wanzenböck, J. Monitoring Spawning Migrations of Potamodromous Fish Species via EDNA. Sci. Rep. 2019, 9, 15388. [Google Scholar] [CrossRef]
  50. Boussarie, G.; Bakker, J.; Wangensteen, O.S.; Mariani, S.; Bonnin, L.; Juhel, J.-B.; Kiszka, J.J.; Kulbicki, M.; Manel, S.; Robbins, W.D.; et al. Environmental DNA Illuminates the Dark Diversity of Sharks. Sci. Adv. 2018, 4, eaap9661. [Google Scholar] [CrossRef] [PubMed]
  51. Kelly, R.P.; Port, J.A.; Yamahara, K.M.; Crowder, L.B. Using Environmental DNA to Census Marine Fishes in a Large Mesocosm. PLoS ONE 2014, 9, e86175. [Google Scholar] [CrossRef] [PubMed]
  52. Miya, M.; Sato, Y.; Fukunaga, T.; Sado, T.; Poulsen, J.Y.; Sato, K.; Minamoto, T.; Yamamoto, S.; Yamanaka, H.; Araki, H.; et al. MiFish, a Set of Universal PCR Primers for Metabarcoding Environmental DNA from Fishes: Detection of More than 230 Subtropical Marine Species. R. Soc. Open Sci. 2015, 2, 150088. [Google Scholar] [CrossRef] [PubMed]
  53. Yamamoto, S.; Masuda, R.; Sato, Y.; Sado, T.; Araki, H.; Kondoh, M.; Minamoto, T.; Miya, M. Environmental DNA Metabarcoding Reveals Local Fish Communities in a Species-Rich Coastal Sea. Sci. Rep. 2017, 7, 40368. [Google Scholar] [CrossRef] [PubMed]
  54. McElroy, M.E.; Dressler, T.L.; Titcomb, G.C.; Wilson, E.A.; Deiner, K.; Dudley, T.L.; Eliason, E.J.; Evans, N.T.; Gaines, S.D.; Lafferty, K.D.; et al. Calibrating Environmental DNA Metabarcoding to Conventional Surveys for Measuring Fish Species Richness. Front. Ecol. Evol. 2020, 8, 276. [Google Scholar] [CrossRef]
  55. Okaichi, T. Environmental Management of the Semi Enclosed Sea and Red Tide Problems in the Seto Inland Sea. Fish. Sci. 2002, 68, 483–488. [Google Scholar] [CrossRef] [PubMed]
  56. JMA. Coastal Sea Surface Temperature Information Bingonada/Hibinada. Available online: https://www.data.jma.go.jp/kaiyou/data/db/kaikyo/series/engan/engan509.html (accessed on 2 March 2024).
  57. International EMECS Center. Environmental Conservation of the Seto Inland Sea; International EMECS Center, Ed.; Kobe International EMECS Center: Kobe, Japan, 2008. [Google Scholar]
  58. Zhu, A.; Saito, M.; Onodera, S.; Shimizu, Y.; Jin, G.; Ohta, T.; Chen, J. Evaluation of the Spatial Distribution of Submarine Groundwater Discharge in a Small Island Scale Using the 222Rn Tracer Method and Comparative Modeling. Mar. Chem. 2019, 209, 25–35. [Google Scholar] [CrossRef]
  59. Kamimura, Y.; Shoji, J. Seasonal Changes in the Fish Assemblage in a Mixed Vegetation Area of Seagrass and Macroalgae in the Central Seto Inland Sea. Aquac. Sci. 2009, 57, 233–241. [Google Scholar] [CrossRef]
  60. Mohri, K.; Kamimura, Y.; Mizuno, K.; Kinoshita, H.; Toshito, S.; Shoji, J. Seasonal Changes in the Fish Assemblage in a Seagrass Bed in the Central Seto Inland Sea. Aquac. Sci. 2013, 61, 215–220. [Google Scholar] [CrossRef]
  61. Onodera, S.; Saito, M.; Hayashi, M.; Sawano, M. Nutrient Dynamics with Groundwater-Seawater Interactions in a Beach Slope of a Steep Island, Western Japan. IAHS Publ. 2007, 312, 150. [Google Scholar]
  62. Saito, M.; Onodera, S.; Jin, G.; Shimizu, Y.; Taniguchi, M. Nitrogen Dynamics in a Highly Urbanized Coastal Area of Western Japan: Impact of Sewage-Derived Loads. Prog. Earth Planet. Sci. 2018, 5, 17. [Google Scholar] [CrossRef]
  63. Minamoto, T.; Miya, M.; Sado, T.; Seino, S.; Doi, H.; Kondoh, M.; Nakamura, K.; Takahara, T.; Yamamoto, S.; Yamanaka, H.; et al. An Illustrated Manual for Environmental DNA Research: Water Sampling Guidelines and Experimental Protocols. Environ. DNA 2021, 3, 8–13. [Google Scholar] [CrossRef]
  64. Sato, Y.; Miya, M.; Fukunaga, T.; Sado, T.; Iwasaki, W. MitoFish and MiFish Pipeline: A Mitochondrial Genome Database of Fish with an Analysis Pipeline for Environmental DNA Metabarcoding. Mol. Biol. Evol. 2018, 35, 1553–1555. [Google Scholar] [CrossRef] [PubMed]
  65. Iwasaki, W.; Fukunaga, T.; Isagozawa, R.; Yamada, K.; Maeda, Y.; Satoh, T.P.; Sado, T.; Mabuchi, K.; Takeshima, H.; Miya, M.; et al. Mitofish and Mitoannotator: A Mitochondrial Genome Database of Fish with an Accurate and Automatic Annotation Pipeline. Mol. Biol. Evol. 2013, 30, 2531–2540. [Google Scholar] [CrossRef]
  66. Zhu, T.; Sato, Y.; Sado, T.; Miya, M.; Iwasaki, W. MitoFish, MitoAnnotator, and MiFish Pipeline: Updates in 10 Years. Mol. Biol. Evol. 2023, 40, msad035. [Google Scholar] [CrossRef]
  67. Sayers, E.W.; Bolton, E.E.; Brister, J.R.; Canese, K.; Chan, J.; Comeau, D.C.; Connor, R.; Funk, K.; Kelly, C.; Kim, S.; et al. Database Resources of the National Center for Biotechnology Information. Nucleic Acids Res. 2022, 50, D20–D26. [Google Scholar] [CrossRef]
  68. Laporte, M.; Berger, C.S.; García-Machado, E.; Côté, G.; Morissette, O.; Bernatchez, L. Cage Transplant Experiment Shows Weak Transport Effect on Relative Abundance of Fish Community Composition as Revealed by EDNA Metabarcoding. Ecol. Indic. 2022, 137, 108785. [Google Scholar] [CrossRef]
  69. Spellerberg, I.F.; Fedor, P.J. A Tribute to Claude Shannon (1916–2001) and a Plea for More Rigorous Use of Species Richness, Species Diversity and the ‘Shannon-Wiener’ Index. Glob. Ecol. Biogeogr. 2003, 12, 177–179. [Google Scholar] [CrossRef]
  70. Clarke, K.R. Non-Parametric Multivariate Analyses of Changes in Community Structure. Austral. Ecol. 1993, 18, 117–143. [Google Scholar] [CrossRef]
  71. Abdi, H.; Williams, L.J. Principal Component Analysis. Wiley Interdiscip. Rev. Comput. Stat. 2010, 2, 433–459. [Google Scholar] [CrossRef]
  72. Glenn, D. Multivariate Regression Trees: A New Technique for Modeling Species–Environment Relationships. Ecology 2002, 83, 1105–1117. [Google Scholar] [CrossRef]
  73. Makowski, D.; Ben-Shachar, M.; Patil, I.; Lüdecke, D. Methods and Algorithms for Correlation Analysis in R. J. Open Source Softw. 2020, 5, 2306. [Google Scholar] [CrossRef]
  74. Huang, H. LinkET: Everything Is Linkable. In R Package Version 0.0, Shenzhen, China, 2021; Volume 2. Available online: https://github.com/Hy4m/linkET (accessed on 15 February 2024).
  75. R Core Team. R: A Language and Environment for Statistical Computing; R Core Team: Vienna, Austria, 2022. [Google Scholar]
  76. Zhang, Z.; Xu, S.; Capinha, C.; Weterings, R.; Gao, T. Using Species Distribution Model to Predict the Impact of Climate Change on the Potential Distribution of Japanese Whiting Sillago Japonica. Ecol. Indic. 2019, 104, 333–340. [Google Scholar] [CrossRef]
  77. Yoneda, M.; Fujita, T.; Yamamoto, M.; Tadokoro, K.; Okazaki, Y.; Nakamura, M.; Takahashi, M.; Kono, N.; Matsubara, T.; Abo, K.; et al. Bottom-up Processes Drive Reproductive Success of Japanese Anchovy in an Oligotrophic Sea: A Case Study in the Central Seto Inland Sea, Japan. Prog. Oceanogr. 2022, 206, 102860. [Google Scholar] [CrossRef]
  78. Sasano, S.; Murakami, H.; Suzuki, K.W.; Minamoto, T.; Yamashita, Y.; Masuda, R. Seasonal Changes in the Distribution of Black Sea Bream Acanthopagrus Schlegelii Estimated by Environmental DNA. Fish. Sci. 2022, 88, 91–107. [Google Scholar] [CrossRef]
  79. Kawai, K.; Fujita, H.; Sanchez, G.; Furusawa, S.; Umino, T. Estimating the Spawning Season of Black Sea Bream Acanthopagrus Schlegelii in Hiroshima Bay, Japan, from Temporal Variation in Egg Density. Fish. Sci. 2020, 86, 645–653. [Google Scholar] [CrossRef]
  80. Kong, L.; Kawasaki, M.; Kuroda, K.; Kohno, H.; Fujita, K. Spawning Characteristics of the Konoshiro Gizzard Shad in Tokyo and Sagami Bays, Central Japan. Fish. Sci. 2004, 70, 116–122. [Google Scholar] [CrossRef]
  81. Gwak, W.-S.; Zhang, Q.; Roy, A. Low Genetic Diversity and Shallow Population Structure of the Japanese Halfbeak Hyporhamphus Sajori Revealed from Mitochondrial DNA in the Northeast Asia. Korean J. Ichthyol. 2019, 31, 187–194. [Google Scholar] [CrossRef]
  82. Oya, F.; Tsuji, T.; Fujiwara, S.-I. Relative Growth and Feeding Habits of Halfbeak, Hyporhamphus Sajori, Larvae and Juveniles in Toyama Bay of the Japan Sea. Aquac. Sci. 2002, 50, 47–54. [Google Scholar]
  83. Niu, M.; Jin, X.; Li, X.; Wang, J. Effects of Spatio-Temporal and Environmental Factors on Distribution and Abundance of Wintering Anchovy Engraulis japonicus in Central and Southern Yellow Sea. Chin. J. Oceanol. Limnol. 2014, 32, 565–575. [Google Scholar] [CrossRef]
  84. Sakamoto, W.; Tanaka, Y. Water Temperature Patterns and Distributions of Fish Eggs and Larvae in the Vicinity of Shallow Sea Front. NIPPON SUISAN GAKKAISHI 1986, 52, 767–776. [Google Scholar] [CrossRef]
  85. Park, J.M.; Huh, S.H.; Baeck, G.W. Temporal Variations of Fish Assemblage in the Surf Zone of the Nakdong River Estuary, Southeastern Korea. Anim. Cells Syst. 2015, 19, 350–358. [Google Scholar] [CrossRef]
  86. Zhu, Y.; Minami, K.; Iwahara, Y.; Oda, K.; Hidaka, K.; Hoson, O.; Morishita, K.; Hirota, M.; Tsuru, S.; Shirakawa, H.; et al. Seasonal Variation in Fish School Spatial Distribution and Abundance under the Kuroshio Regular Pattern and the Large Meander in Suzu Coastal Waters. PLoS ONE 2021, 16, e0260629. [Google Scholar] [CrossRef] [PubMed]
  87. Onomichi City Hall. Onomichi City Fisheries Promotion Vision; Onomichi City Hall: Onomichi City, Japan, 2019. [Google Scholar]
  88. Oehler, T.; Eiche, E.; Putra, D.; Adyasari, D.; Hennig, H.; Mallast, U.; Moosdorf, N. Seasonal Variability of Land-Ocean Groundwater Nutrient Fluxes from a Tropical Karstic Region (Southern Java, Indonesia). J. Hydrol. 2018, 565, 662–671. [Google Scholar] [CrossRef]
  89. Sugimoto, R.; Honda, H.; Kobayashi, S.; Takao, Y.; Tahara, D.; Tominaga, O.; Taniguchi, M. Seasonal Changes in Submarine Groundwater Discharge and Associated Nutrient Transport into a Tideless Semi-Enclosed Embayment (Obama Bay, Japan). Estuaries Coasts 2016, 39, 13–26. [Google Scholar] [CrossRef]
  90. Tada, K.; Monaka, K.; Morishita, M.; Hashimoto, T. Standing Stocks and Production Rates of Phytoplankton and Abundance of Bacteria in the Seto Inland Sea, Japan. J. Oceanogr. 1998, 54, 285–295. [Google Scholar] [CrossRef]
  91. Yamaguchi, H.; Hirade, N.; Higashizono, K.; Tada, K.; Kishimoto, K.; Oyama, K.; Ichimi, K. Light and Nutrient Limitation on Phytoplankton Production in the Strait of an Enclosed Coastal Sea (Bisan Strait, Eastern Seto Inland Sea, Japan). J. Sea Res. 2015, 103, 75–83. [Google Scholar] [CrossRef]
  92. Cloern, J. Our Evolving Conceptual Model of the Coastal Eutrophication Problem. Mar. Ecol. Prog. Ser. 2001, 210, 223–253. [Google Scholar] [CrossRef]
  93. Cermeño, P.; Marañón, E.; Pérez, V.; Serret, P.; Fernández, E.; Castro, C.G. Phytoplankton Size Structure and Primary Production in a Highly Dynamic Coastal Ecosystem (Ría de Vigo, NW-Spain): Seasonal and Short-Time Scale Variability. Estuar. Coast. Shelf Sci. 2006, 67, 251–266. [Google Scholar] [CrossRef]
  94. Lavanya, D.; Ramalingaiah, D.; Suguna, T.; Kumar Reddy, D.R.; Madhavi, K. Food and Feeding Ecology of Mugil Cephalus from Krishnapatnam and Mypadu Coasts of Nellore District, Andhra Pradesh. Int. J. Curr. Microbiol. Appl. Sci. 2018, 7, 2616–2630. [Google Scholar] [CrossRef]
  95. Nixon, S.W.; Oviatt, C.A.; Frithsen, J.; Sullivan, B. Nutrients And The Productivity Of Estuarine And Coastal Marine Ecosystems. J. Limnol. Soc. S. Afr. 1986, 12, 43–71. [Google Scholar] [CrossRef]
  96. Czeglédi, I.; Sály, P.; Specziár, A.; Preiszner, B.; Szalóky, Z.; Maroda, Á.; Pont, D.; Meulenbroek, P.; Valentini, A.; Erős, T. Congruency between Two Traditional and EDNA-Based Sampling Methods in Characterising Taxonomic and Trait-Based Structure of Fish Communities and Community-Environment Relationships in Lentic Environment. Ecol. Indic. 2021, 129, 107952. [Google Scholar] [CrossRef]
  97. Snigirov, S.; Goncharov, O.; Sylantyev, S. The Fish Community in Zmiinyi Island Waters: Structure and Determinants. Mar. Biodivers. 2012, 42, 225–239. [Google Scholar] [CrossRef]
  98. Sugimoto, K.; Nakano, Y.; Okuda, T.; Nakai, S.; Nishijima, W.; Okada, M. Coexistence between Zostera Marina and Zostera Japonica in Seagrass Beds of the Seto Inland Sea, Japan. J. Ecol. Environ. 2017, 41, 523. [Google Scholar] [CrossRef]
  99. Zamora-López, A.; Guerrero-Gómez, A.; Torralva, M.; Zamora-Marín, J.M.; Guillén-Beltrán, A.; Oliva-Paterna, F.J. Shallow Waters as Critical Habitats for Fish Assemblages under Eutrophication-Mediated Events in a Coastal Lagoon. Estuar. Coast Shelf Sci. 2023, 291, 108447. [Google Scholar] [CrossRef]
  100. Afzali, S.F.; Bourdages, H.; Laporte, M.; Mérot, C.; Normandeau, E.; Audet, C.; Bernatchez, L. Comparing Environmental Metabarcoding and Trawling Survey of Demersal Fish Communities in the Gulf of St. Lawrence, Canada. Env. DNA 2021, 3, 22–42. [Google Scholar] [CrossRef]
Figure 1. Map showing the location of the study area and sampling sites, with red dots indicating sampling stations. (a) Japan; (b) Seto Inland Sea and (c) Ikuchijima Island.
Environments 11 00060 g001
Figure 2. Heatmap of relative abundance (%) of dominant fish species in autumn and summer, determined by eDNA metabarcoding at each station. The heatmap colors represent the relative abundances of fish species. Sorting is in proportion to relative abundance, with a decreasing trend from top to bottom.
Environments 11 00060 g002
Figure 3. (a) Venn diagrams comparing number of fish species detected by eDNA in the summer and autumn; (b) boxplot of ANOSIM results of seasonal differences in fish communities on Ikuchijima Island between summer and autumn. On the x-axis, ‘between’ boxplot means between-season variation. Single dots indicate values outside of the interquartile range.
Environments 11 00060 g003
Figure 4. Principal component analysis (PCA) results of influential environmental factors on fish species richness and fish diversity index during (a,b) summer and (c,d) autumn. (a,c): The correlation circle obtained from the PCA; the color palette corresponds to the different cos2 values, and a higher cos2 value indicates a larger contribution of variation to the principal component; the percentage (%) indicates the proportion of variance; (b,d): PCA corrplot showing cos2 of variables in all principal component (PC) dimensions.
Environments 11 00060 g004
Figure 5. Multivariate regression tree analysis of the relation between relative abundance of fish species and environment factors in (a) summer and (b) autumn. The statistics at the bottom of the figure are the residual error (Error), the cross-validated error (CVError), and the standard error (SE).
Environments 11 00060 g005
Table 1. Mean ± standard deviation (SD) of environmental variables for both seasons.
SeasonSummerAutumn
VariableMeanSDMeanSD
Temp (°C)26.5±0.6720.7±0.55***
Salinity (psu)30.5±0.1933.5±0.10***
DIN (mg/L)0.02±0.020.06±0.01***
DIP (mg/L)0.04±0.020.02±0.00**
DSi (mg/L)0.57±0.120.2±0.02***
Statistical significance markers: ** p < 0.05; *** p < 0.01.
Disclaimer/Publisher’s Note: The statements, opinions and data contained in all publications are solely those of the individual author(s) and contributor(s) and not of MDPI and/or the editor(s). MDPI and/or the editor(s) disclaim responsibility for any injury to people or property resulting from any ideas, methods, instructions or products referred to in the content.

