
Establishing an Early Warning System for Dust Storms in Peri-Desert Regions

State Key Laboratory of Desert and Oasis Ecology, Xinjiang Institute of Ecology and Geography, Chinese Academy of Sciences, Urumqi 830011, China
*
Author to whom correspondence should be addressed.
†
These authors contributed equally to this work.
Environments 2024, 11(4), 61; https://doi.org/10.3390/environments11040061
Submission received: 18 January 2024
/
Revised: 18 March 2024
/
Accepted: 22 March 2024
/
Published: 24 March 2024
Abstract
:The Taklimakan Desert in northwest China stands as a significant contributor to dust storms, with its fringe oases already designated as ecologically fragile due to the severe impacts of these storms. This study focuses on Moyu County, situated on the southwest edge of the Taklimakan Desert, examining the origin and transport pathways of dust storms from 2004 to 2021. The classification involves utilizing a 36 h backward trajectory model and the k-means clustering technique, resulting in three clusters displaying distinct transport pathways and entry directions. Air pollutant concentrations at the study site corresponding to each cluster are analyzed to elucidate the contribution of dust storms from different directions. The results categorize 1952 dusty days into three categories: NE-SE (cluster 1), N-N (cluster 2), and NW-W (cluster 3). The highest frequency of dust storms, accounting for 64% of the total suspended dust weather, originates from the northeast and southeast direction (NE-SE category), with relatively weak intensity, mainly as suspended dust (71.5%). Strong sand storms predominantly occur from the northwest direction (57.8%). Cluster 1 (the southeast direction) exhibits a higher concentration of SO2, NO2, and CO, mainly associated with its pathway over anthropogenically polluted areas. Conversely, Cluster 3 (northwest direction) shows higher PM10 and PM2.5 concentrations due to increased wind speed and stronger dust storm intensity. The study develops dust storm early warning schemes based on 15-day advance predictions, utilizing an 18-year trajectory model and local monitoring data. This proposed warning scheme serves as a predictive tool for potential dust storm events and air pollution levels, aiding in both scientific research and policy formulation for dust storm mitigation and adaptation. The data obtained also hols relevance for conducting further scientific research in this field.
1. Introduction
1.1. Dust Storms: A Meteorological Hazard
Dust storms, recognized as significant meteorological hazards, impart substantial environmental and health repercussions not only within the source region and its environs but also in areas downstream [1,2,3,4]. The occurrence of dust storms entails the transport of loose particles from deserts and other air pollutants originating from anthropogenic sources over extended distances by the wind. This process leads to heightened concentrations of air pollutants, subsequently diminishing air visibility [5,6,7]. The far-reaching impact of dust storms underscores their multifaceted influence on both the environment and public health. The environmental impact of dust storms extends far beyond their source regions, as the transported particles can settle over vast areas, affecting ecosystems, soil fertility, and water quality [6]. Dust deposition can alter nutrient cycles, leading to changes in plant composition and productivity. Moreover, when deposited into water bodies, dust can contribute to eutrophication and harm aquatic life. In agricultural areas, dust storms can damage crops, reduce yields, and degrade soil quality, exacerbating food security concerns [4,5].
1.2. The Taklimakan Desert: A Source of Dust Storms
Situated in northwest China, the Taklimakan Desert holds the distinction of being the world’s second-largest shifting-sand desert, covering an expansive 337,000 square kilometers. Long recognized as a primary origin of dust storms in China, this region has been extensively studied [8,9]. The oases located at the periphery of the desert are considered more habitable, with Moyu County along the southwest edge of the Taklimakan Desert being particularly noteworthy. However, this area is characterized as more fragile due to its historical susceptibility to severe dust storms, as documented in previous studies [10]. The unique geographical and meteorological characteristics of the Taklimakan Desert contribute to its role as a primary emitter of airborne particulate matter. With its location surrounded by high mountain ranges, including the Tianshan and Kunlun Mountains, the desert experiences distinct wind patterns influenced by local topography. During the spring and summer months, prevailing westerly winds, intensified by thermal gradients between the desert and adjacent regions, accelerate across the arid landscape, picking up fine particles of sand and dust along the way [7,8]. Given the significance of the Taklimakan Desert as a source of dust storms, efforts to mitigate their impact and improve the understanding of their dynamics are imperative. Comprehensive monitoring networks, advanced modeling techniques, and collaborative research initiatives are essential for enhancing early warning systems, informing policy interventions, and promoting sustainable land management practices aimed at reducing aeolian erosion and dust emissions in this iconic desert landscape.
1.3. Advancements in Dust Storm Research and Early Warning Systems
Currently, some advanced research methods and measuring techniques are used to determine the source regions of pollutants. The HYSPLIT model, capable of identifying source–receptor relationships over long distances of air pollutants, has become the most widely applied tool [11,12]. By integrating meteorological data, satellite observations, and ground-based measurements, these models provide valuable insights into the spatiotemporal distribution of dust storms and their potential environmental impacts [13,14,15]. Additionally, advancements in remote sensing technology have enabled researchers to monitor dust emissions in real time, allowing for the timely detection and tracking of dust storm events [16,17]. These technological innovations have paved the way for the development of early warning systems that can alert communities and authorities to impending dust storms, enabling them to take proactive measures to mitigate their adverse effects on public health, infrastructure, and the environment. Most previous research work on dust storms in the Taklimakan Desert focused on the spatiotemporal distribution and environmental impact of dust storms, with little emphasis on mitigation and adaptation strategies [18,19]. To address this gap, this study develops an early warning system for dust storms based on HYSPLIT cluster analysis results. This early warning scheme aims to minimize exposure risks, thereby reducing the effects on human health and properties, while also improving the accuracy of dust storm forecasting services and technical support.
2. Data and Methods
2.1. Description of the Study Area
Moyu County, one of the severe dust-affected areas in China, is located at the southwest edge of the Taklimakan Desert and the north slope of Kunlun Mountain. The vast area of this county, with a total area of 25,788.86 km2, is geographically stretched between 36.6°~39.61° N and 79.12°~80.85° E, and the total population is 632,740 [20]. The terrain of the county gradually decreases from south to north, the average altitude in the plain area is 1120 m, and in the mountain areas in the south it is 3663 m [17,20]. The county is surrounded by the Taklimakan Desert to the north, northwest, and northeast (Figure 1).
As part of the temperate zone, Moyu County has an extremely arid climate with four distinct seasons. In the summer, it is hot and dry, and the temperatures rise rapidly in the spring. January is the month with the lowest temperature (−6.5 °C) and July has the highest average temperature (26.4 °C). Temperatures differ greatly between day and night, it does not frost for a long period, the annual precipitation averages 36–37 mm, the evaporation averages 2239 mm, and the average sunshine hours are 2655 [21].
The large areas of desert and complicated atmospheric circulation are the substantial basis of the thermo-dynamical force of dust storm formation in the study area. The annual frequency of dusty days in the study area is around 220 days. The frequency of dust storms in the spring (from March to May) accounts for approximately 60% of annual dust storms. April is the most active period with the highest frequency and intensity of dust storms [21].
2.2. Data Sources
Surface meteorological data including types of dust storms and wind speed data in the dusty season of each year (from 1 March to 30 June) from 2004 to 2021 were collected from the Moyu Meteorological Bureau and the official website of the National Meteorological Administration of China (http://cdc.cma.gov.cn, accessed on 18 July 2023). Other meteorological data related to the air mass along with the dust storm pathway were obtained by running a 36 h backward trajectory model, which is available at the NOAA-ARL (National Oceanic and Atmospheric Administration—Air Resources Laboratory) website: http://www.arl.noaa.gov/ready.html (accessed on 18 July 2023). Daily average concentrations of six types of air pollutants, PM2.5, PM10, SO2, NO2, O3, and CO, in the same period were used in this study. Air pollutant concentration data for the period of 2004–2011 were collected from Hetian Environmental Protection Bureaus, and data for the period of 2012–2021 were collected from Xinjiang Environmental Monitoring Centers, respectively.
Three types of dust storm weather, that is, suspended dust, blowing dust, and sand storm, were considered in this study, and were classified by using the criteria given by the National Standard Committee (2006) into 3 intensity grades based on the severity. Among them, suspended dust is the weaker type of dust storm, which refers to floating dust in the air under lower wind forces. Blowing dust is a medium–severe type of dust storm with a horizontal visibility of 1–10 km. The sand storm is the most severe type of dust storm with a horizontal visibility below 1 km and a wind speed of over 25 m/s [22,23,24].
2.3. Methods
2.3.1. Classification of Dust Storm Transport Pathway
In this study, a total of 1952 dusty days from 2004 to 2021 were selected for the HYSPLIT model analysis. Each of the selected days was run through the HYSPLIT model to obtain the 36 h backward trajectories of the air mass. In this model, the starting point was 37.26° N, 79.72° E (center of Moyu County), and the starting time was 10:00 UTC (Universal Coordinated Time). As a result of the topography of the Taklimakan Desert and surrounding areas, as well as friction effects from the surface, the height of air masses at the arriving point was set at 500 m above ground level (AGL). Due to the inclusion of meteorological variables in the “model vertical velocity option”, the HYSPLIT model was run using this option. Using the SPSS 20 software, k-means clustering was used to classify air mass trajectories by considering meteorological variables at the arriving location (Moyu County) such as ambient temperature (K), potential temperature (K), rainfall (mm/day), mixing layer depth (m), relative humidity (RH, %), solar radiation flux (W/m2), and wind speed (m/s). Backward trajectories of air masses are defined by their latitudes, longitudes, and altitudes at four points on their trajectory: 9 h, 18 h, 27 h, and 36 h. Data points are divided into homogeneous clusters (k) using k-means clustering. The cluster membership is determined by the distance between each data point and the centroids in each cluster [25,26]. The concentration of air pollutants corresponding to each cluster is also obtained by using cluster analysis.
K-means clustering separates the observations into k clusters such that the observations are distributed near the centroids of their clusters. The clustering is conducted such that the following error function is minimized:
where C1, C2, …, Ck are the k disjoint clusters, μ(Ci) is the centroid of each cluster, and d(x, μ(Ci)) is the observation-to-centroid distance.
2.3.2. Establishment of Dust Storm Early Warning Scheme
To develop an early warning scheme for dust storms, principal component analysis (PCA) was applied based on long-term (18 years) statistical data, which were obtained by using k-means clustering. The selected variables (19 variables) were first standardized so that the mean value of each variable equaled 0 with a standard deviation of 1.
Standard value = (original data − mean)/standard deviation.
The PC score was obtained by using the following equation. For example, let X = [xi] be any k × 1 random vector. We now define a k × 1 vector Y = [yi], where for each i the ith principal component of X is
where βij is a regression coefficient, and since each yi is a linear combination of the xj, Y is a random vector.
Detailed processes to develop an early warning scheme are presented in Section 3.4.
3. Results and Discussions
3.1. Overview of Existing Dust Storm Early Warning Scheme
To enhance the comprehension of our dust storm forecasting system, we undertake a comprehensive analysis of existing dust storm forecasting systems both within China and globally. Through this comparative examination, we construct a framework diagram elucidating the variances between these systems. This comparative analysis stands as a noteworthy discovery in our study. Nowadays, some countries including Australia, South Korea, China, and Iran have already established dust storm monitoring and forecasting systems. The World Meteorological Organization (WMO) has also developed and implemented a Sand and Dust Storms Warning Advisory and Assessment System (SDS-WAS) [27]. Most of these schemes rely on surface-based observation data and satellite-based observation data. Using this forecasting system, the forthcoming dust storm events can be predicted, and early warning can be employed. The operational framework of monitoring, forecasting, and early warning is shown in Figure 2.
China is one of the most severely affected countries by dust storms and desertification in the world. The total area of desert land coverage is 2.67 million km2 [27]. The vast areas of deserts in China have always been considered as the major source region of Asian dust storm events. The China Meteorological Administration (CMA) is the only authorized agency to issue public advisories on forthcoming dust storm events [27]. In 2001, the CMA developed a dust storm forecasting and early warning system, the monitoring and forecasting framework of dust storm events as seen in Figure 3.
This forecasting scheme consists of a forecast model, a dust aerosol module, and a data assimilation system. Both surface-based observation data (absolute value of visibility, TSP, PM10, etc.) and satellite-based observation data (land use/cover, soil moisture, and distribution of dust storms) are used in this system. These data are first transferred to the data assimilation system and then sorted and analyzed in the system to provide new information for rolling forecasting [27]. The warning information, including source information, spatial distribution, and deposition of dust aerosols, which are derived from dust storm forecasting systems, can be used as a scientific basis to assess the impact of dust storms on the environment, human health, economic loss, and so on.
3.2. Classification of Dust Storm Pathway in Study Area
A total of 2196 days were extracted from 18 years of the study period (March–June: 122 days/year × 18 years) for dust storm classification. Among them, suspended dust weather occurred on 1378 days, blowing dust weather occurred on 406 d, and sand storm weather occurred on 168 days, while the other 244 d were non-dusty days.
The 36 h of the HYSPLIT backward trajectories, which show the origin and pathways of the air masses arriving at Moyu County, were obtained on 1952 dusty days in the study period (2004–2021). Based on the trajectory data obtained by using the HYSPLIT model, air mass trajectories arriving at Moyu County were classified into three clusters by using the k-means clustering technique. These clusters have different origins and entry directions into the study area (Figure 4).
It can be seen from Figure 4 that the length, shape, vertical position, and origins of the 36 h backward trajectories of the three clusters are quite different.
- (1)
- Cluster 1: NE-SE category
Air masses within this cluster originate in the middle of the Taklimakan Desert at 440 m above ground level (Figure 4), then move westward through the desert, turning south, and finally arriving at Moyu from the southeast. As the cluster with the highest frequency (64.1%) of all the clusters, it was observed on 1251 days out of the total dusty season over 18 years. Suspended dusty weather makes up 71.5% of the total dusty weather frequency. Besides crossing desert areas, it passes over populated areas as well.
- (2)
- Cluster 2: N-N category
This cluster of air masses originates in the middle-west part of the Taklimakan Desert (390 m at AGL, Figure 4), moves southward through the desert, and arrived at Moyu from the north. This cluster, which accounts for 11.1% of the days examined, has the lowest number of trajectories. There is a high ambient temperature and little rainfall in this cluster of air masses due to their dry and hot characteristics (Table 1). Similar to Cluster 1, this cluster also has a longer pathway above desert areas.
- (3)
- Cluster 3: NW-W category
In this cluster, air masses start from the northwestern Taklimakan Desert and move westward, turning south along the western edge of the desert, then arriving at Moyu from the west (Figure 4). There are 486 days or 24.8% of occurrences for this cluster, the second most frequent among the three clusters. Cool and damp air masses are characteristic of this type of air mass, characterized by the lowest ambient temperature of 282 K, the highest rainfall (0.42 mm/day), and the highest relative humidity (34%) (Table 1). The wind speed is the highest (8.6 m/s). The high-speed movement of the air mass determines the higher frequency of strong sand storm weather in this cluster. The occurrence frequency, meteorological characteristics, and air pollutant concentration within each cluster are presented in Table 1.
Air pollutant concentrations associated with different clusters of air mass were also analyzed together with the dust storm frequencies and meteorological characteristics. It can be seen from Table 1 that both the PM10 and PM2.5 concentrations corresponding to Cluster 3 (coming from the west direction) show higher values than those of the other two clusters (619.51 μg/m3 and 539.66 μg/m3) because of the higher wind speed (8.6 m/s) and stronger dust storm intensity (57.8% of sand storms come from this direction) of this cluster. The concentration of SO2, NO2, and CO corresponding to Cluster 1 (which comes from the southeast direction) shows a higher value than that of the other two clusters because of the longer pathway of this cluster above the anthropogenic polluted areas.
3.3. Development of Dust Storm Early Warning Scheme
The warning system for the likelihood of dust storm occurrence and potential pollution levels was made using forecasted meteorology data. There were 19 variables requested for clustering, including ambient temperature (K), potential temperature (K), daily rainfall (mm/day), mixing layer depth (m), relative humidity (RH, %), solar radiation flux (W/m2), as well as the coordinates of air mass backward trajectories including latitudes, longitudes, and altitudes of the air masses at four points on a trajectory: 9 h, 18 h, 27 h, and 36 h. The wind speed (m/s) was measured at the arriving location (Moyu County). Among them, daily wind speed data are available from the local weather forecast with 15 d in advance. The other 18 variables can be obtained by running the HYSPLIT model, which is available from the NOAA ARL website (http://ready.arl.noaa.gov/hypub-bin/traj1.pl, accessed on 12 September 2022). The proposed scheme for an early warning system of the likelihood of dust storm occurrence and potential air pollution levels was performed in two stages. By classifying the HYSPLIT pattern of one day in the dusty season into one of the three clusters (Figure 4), the warning signal can be issued based on the long-term occurrence frequency of the cluster and the associated pollution levels (Figure 5).
Figure 5 presents the steps for using meteorological parameters for a particular predicted day using the PCA and k-means clustering techniques for specified clusters. The trajectory of the selected day can be matched with one of the three clusters using the following steps and information.
- (a)
- Step 1: Obtaining 19 variables from a 15 d forecast.
For the 15 d warning, the backward HYSPLIT trajectory was run using the predicted meteorological data taken from the Global Forecast System (GFS) dataset available on the NOAA website. The variables of latitude, longitude, and altitude coordinates at the four time interval points (9 h, 18 h, 27 h, and 36 h) were extracted from the HYSPLIT backward trajectory results. Other variables of potential and ambient temperature, rainfall, mixed layer depth, relative humidity, and downward solar radiation flux were obtained from the website for the starting point of HYSPLIT, i.e., the Moyu County site (37.26° N, 79.72° E). The 15 d forecast wind speed data were provided by the local meteorological bureau of Moyu County. The obtained 19 variables were then tabulated.
- (b)
- Step 2: Standardized 19 variables.
The 19 variable values obtained from Step 1 are then standardized using the following equation:
where:
Z = (X − Xn)/D
Z: standardized value of each of the 19 variables.
X: forecasted values for each variable obtained from Step 1.
Xn: mean value of long-term data for the variables.
D: standard deviation of long-term data for the variables.
The long-term mean values and standard deviation of the 19 variables used in the PCA for HYSPLIT clustering can be obtained by using SPSS software [28]. These were obtained from the 1952 days of the dusty season in the 18 years (2004–2021).
- (c)
- Step 3: PC score calculation for predicted day.
The PC score for the predicted day was calculated using the following equation [15]:
where:
Wi: component score coefficients from component score coefficient matrix from long-term data.
Zi: standardized variables obtained from Step 2.
- (d)
- Step 4: calculation of the absolute deviation from mean PC scores of the clusters.
The PC score for the predicted day obtained from Step 3 was used to calculate the absolute deviation from the long-term mean PC score for each cluster by using the following equation:
where:
Absolute deviation (AD) = ∣PCLT − PCND∣
PCLT: PC score of each cluster obtained from long-term data analysis.
PCND: PC score of the predicted (new) day developed in Step 3.
Finally, the cluster type for the predicted day was identified as the one that had the minimum absolute deviation value.
3.4. Evaluation of Early Warning Scheme
Meteorological factors including wind direction, wind speed, temperature, and relative humidity significantly affect the formation, dispersion, diffusion, and deposition of airborne PM in the ambient environment. In this study, we propose an early warning system for dust storms in peri-desert regions based on previous incidents of high concentrations of airborne PMs from historical data. The system combines an artificial neural-network-based prediction model, which aims to increase the quality of input data.
To evaluate the application of the dust storm early warning scheme more specifically, let us use an example to further verify the early warning scheme we propose. The early warning scheme proposed in Figure 5 was applied on the selected day, e.g., 18 February 2023. HYSPLIT backward trajectory was run to obtain 18 predicted variables while the wind speed data were taken from the local meteorological bureau of Moyu County. Based on the mean values and standard deviations of long-term data (18 years) of selected variables, the PC score of each cluster obtained from the long-term data analysis and the predicted (new) day were obtained. The PC scores of three clusters were 3.018, 3.198, and 1.487, and the PC scores of the predicted day were 2.080, 1.610, and 5.780. Based on these PC scores, the absolute deviation of each cluster was calculated as follows:
ADcluster1 = ∣3.018 − 2.080∣ = 0.937;
ADcluster2 = ∣3.198 − 1.610∣ = 1.592;
ADcluster3 = ∣1.487 − 5.780∣ = 4.298;
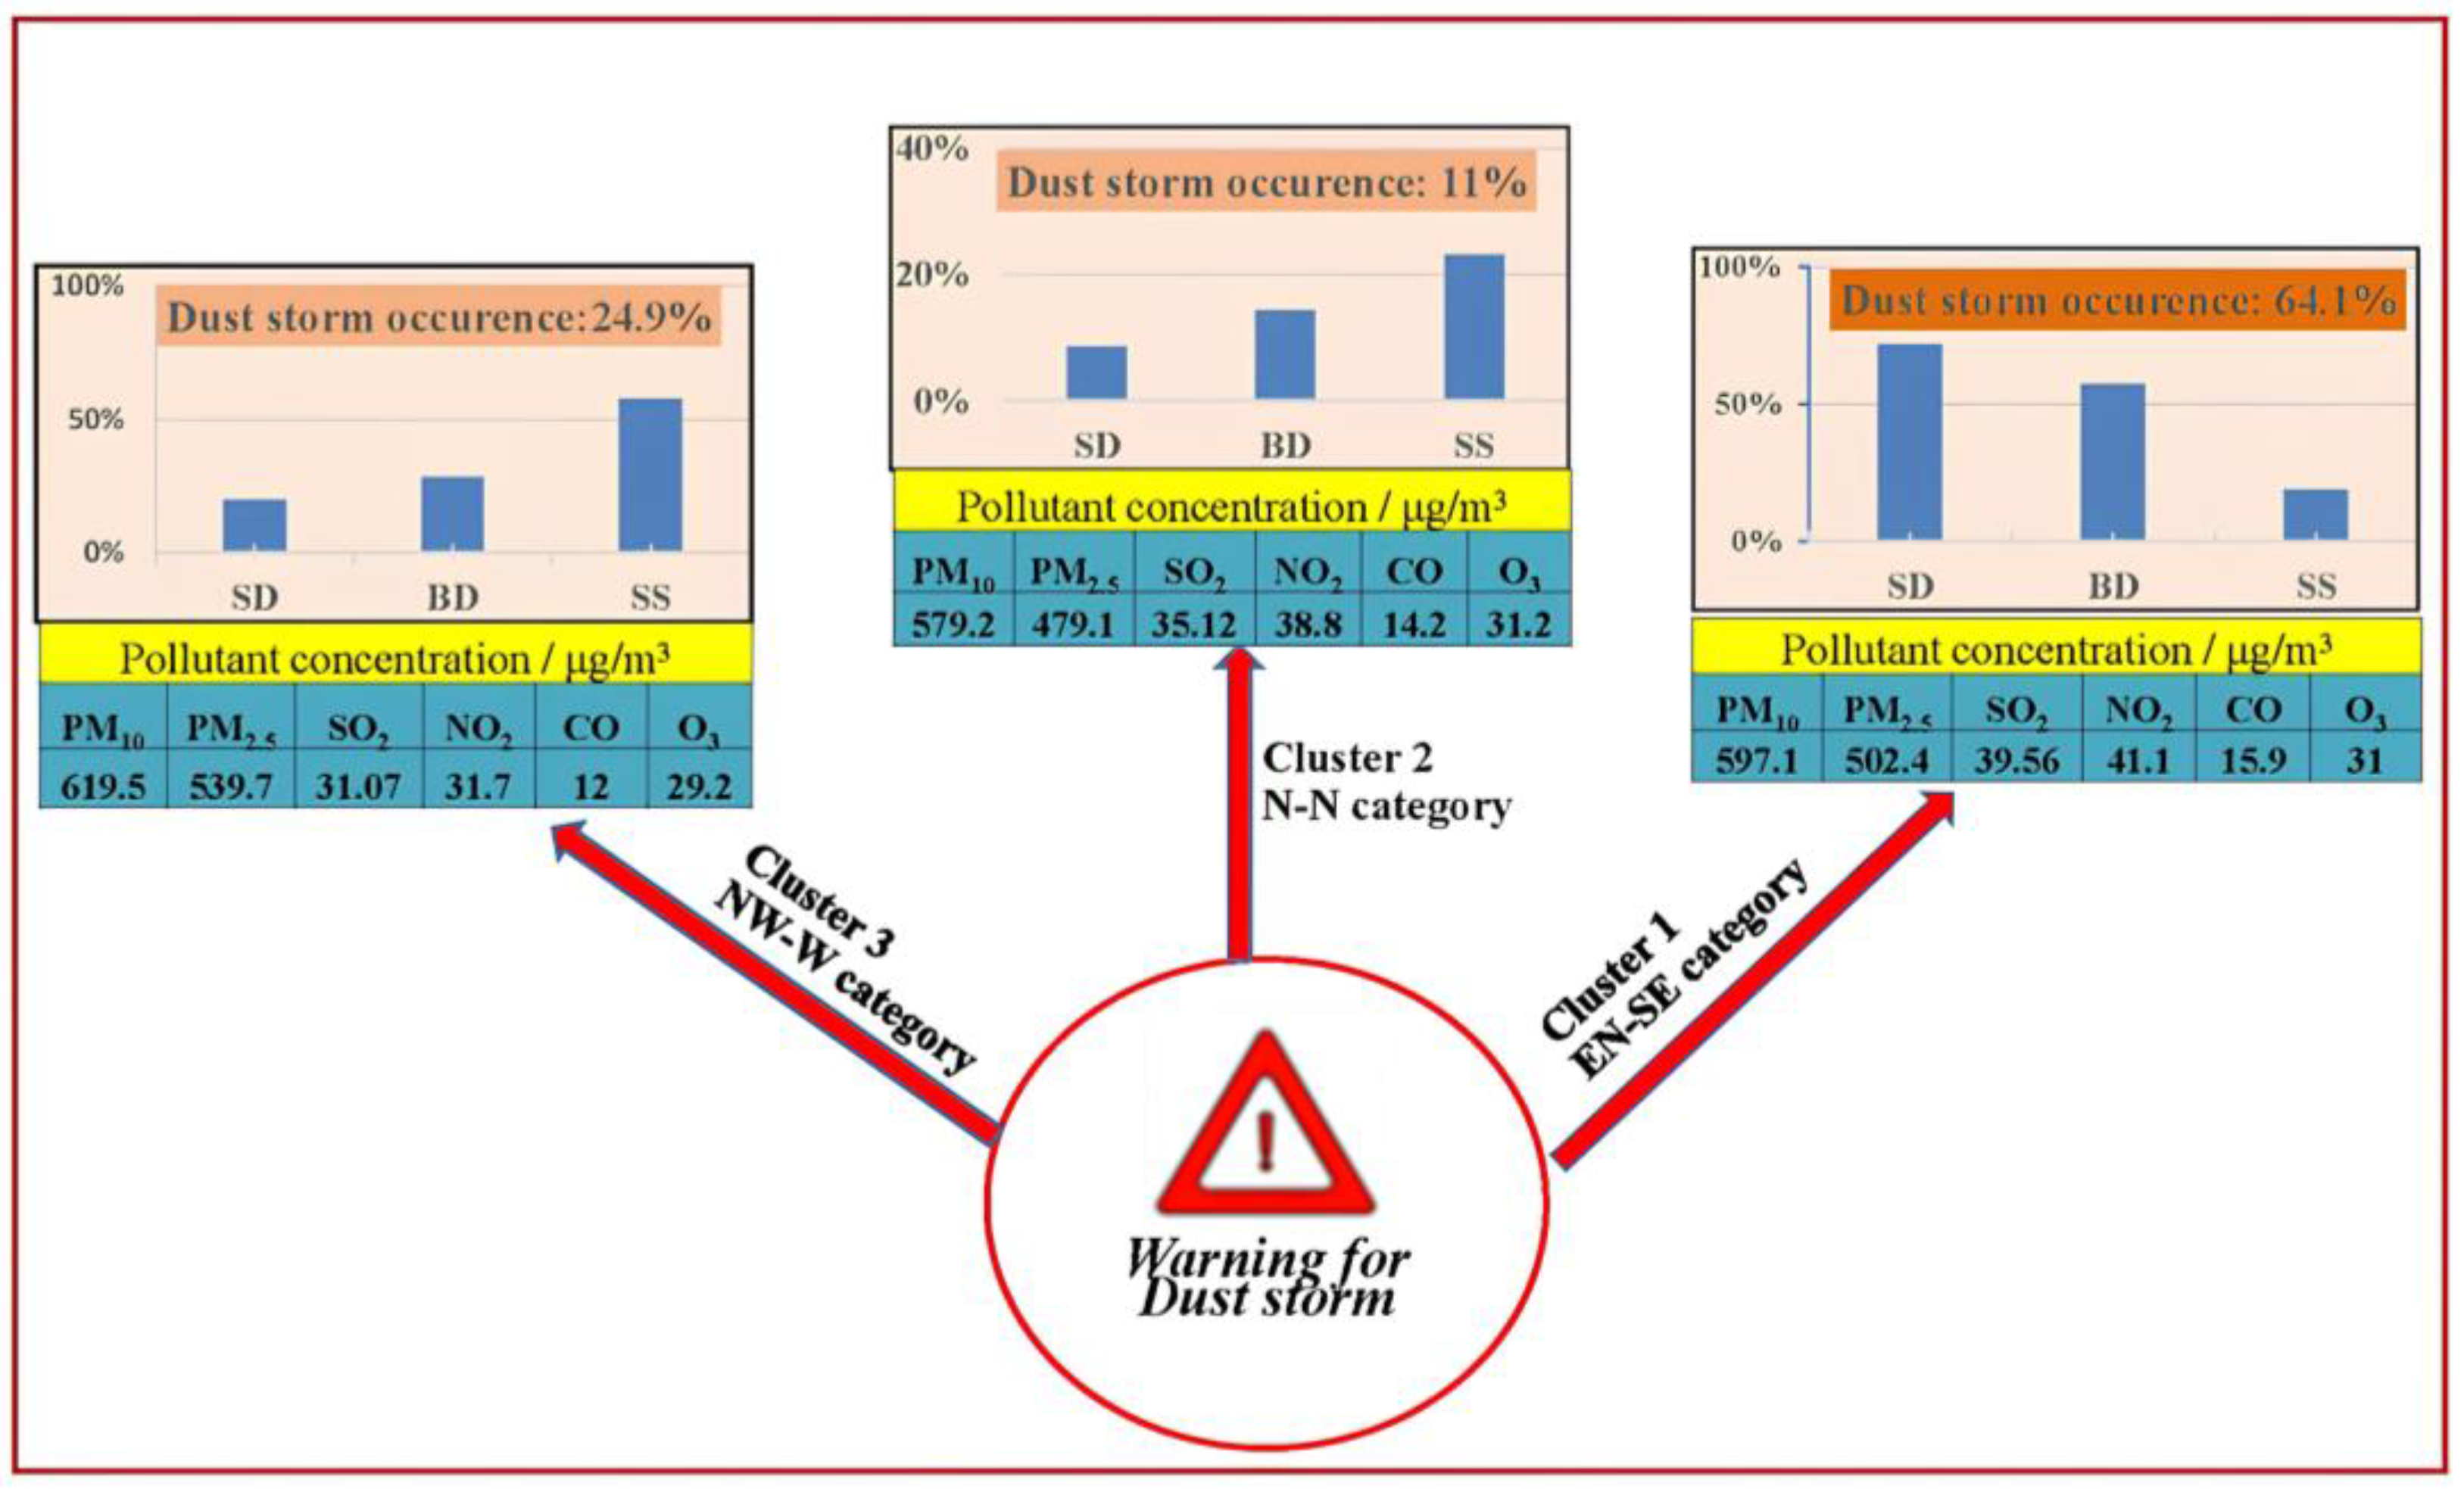
ADcluster1 was the minimum, hence the day belongs to Cluster 1. Similarly, the calculation can be performed for other predicted days 15 days in advance. The trajectory of the selected day (18 February) was categorized into Cluster 1, so the occurrence frequency of dust storms and air pollution levels can be predicted based on our results proposed in this study. That is, the dust storm would come from the southeast direction, and the possible occurrence frequency of dust storms on this day is 64.1%. The possible occurrence frequency of different types of dusty days is 71.5% for suspended dust, 57.4% for blowing dust, 19.1% for sand storms, and 28.3% for non-dusty days. Similarly, the daily air pollutant levels in the evaluation period also exhibit a certain discrepancy with the long-term statistics for different clusters. The possible air pollutant concentration on this day can also be predicted as follows: 619.51 μg/m3 for PM10, 539.66 μg/m3 for PM2.5, 31.07 μg/m3 for SO2, 31.68 for NO2, 12.04 μg/m3 for CO, and 29.21 μg/m3 for O3.
Figure 6 shows the likelihood of the occurrence and intensity of dust storms and the associated air pollution levels for each cluster.
The early warning can be issued 15 d in advance using this scheme. The information on the likelihood of dust storm direction, the occurrence frequency of different types of dust storms, and air pollutant concentrations in the study area can be communicated online so that people can be informed in advance.
3.5. Comparison of the Early Warning Scheme Developed in This Study with Other Warning Systems Based on Dispersion Modeling
In our study, the clustering method is used to identify the dust storm pattern. Clustering represents an unsupervised machine-learning technique designed to partition unlabeled datasets into clusters comprising similar data points. In contrast, supervised machine-learning techniques rely on labeled datasets to predict classifications and values, as outlined in Table 2. While both supervised and unsupervised learning methodologies are firmly established, supervised learning predominates in forecasting systems. This prevalence of supervised learning may stem from several factors, one of which is the challenge associated with interpreting the clusters generated by unsupervised learning algorithms. This difficulty in interpretation can deter interest and the adoption of unsupervised learning approaches within forecasting systems. Our dust storm warning system stands out distinctively from other dispersion modeling systems due to its comprehensive utilization of various data types. These encompass emission data, providing insights into the sources of particulate matter; meteorological data, enabling the consideration of weather patterns and atmospheric conditions conducive to dust storm formation; satellite data, facilitating the observation of dust events over large geographic areas; air pollutant data, aiding in understanding the composition and concentration of airborne particles; and importantly, the integration of resultant model outputs and detailed warning information. This multifaceted approach enhances the system’s accuracy and effectiveness in the prediction and alerting of dust storm events.
The proposed early warning scheme in this study has been developed based on a statistical approach, which is different from those developed based on a dispersion modeling approach [29,30]. There are advantages and shortcomings associated with each approach. The differences between these two types of warning system development approaches are shown in Table 2.
In summary, the proposed early warning scheme in this study has been developed based on a statistical approach and does not require intensive input data or the operation of complex dispersion modeling systems to predict dust storm occurrence frequency, type, and pollution level. The advantages of the scheme developed in this study are listed below.
- (1)
- The scheme relies on accessible website information and is easily implemented.
- (2)
- The origins and entry directions of dust storms at the study site can be predicted based on the results of cluster analysis.
- (3)
- The occurrence frequency and potential levels of air pollution associated with each cluster can be predicted 15 days in advance.
4. Conclusions
- (1)
- Dust storms have become a considerable environmental problem for many countries. At present, many countries have developed different forecasting systems based on surface-based and satellite-based observation data.
- (2)
- The southwest edge of the Taklimakan Desert is one of the most frequent dust storm areas. A total of 1952 dusty days were observed in the dusty season from 2004 to 2021. Among them, suspended dust weather occurred on 1378 days, blowing dust weather occurred on 406 days, and sand storm weather occurred on 168 days.
- (3)
- A 36 h backward trajectory model classified the dust storms arriving at the study site into three clusters. The highest frequency of dust storms was observed in Cluster 1 (coming from the east direction), accounting for 64.1%, but the dust storm intensity was relatively weak, while strong dust storms came from the west direction.
- (4)
- A dust storm early warning scheme was developed by using principal component analysis and the k-means clustering technique based on long-term statistical data obtained in this study. Using this scheme, the moving path of a dust storm and the corresponding pollutant concentration 15 days in advance can be predicted by running a simple trajectory model.
- (5)
- Our study is one of the first studies building a prediction model for dust storm events using PCA, associated with sampling strategies. The dust storm events in peri-desert regions will be predicted through not only air pollutant concentrations but also dust storm frequency data. The early warning system in this study is based upon credible data from historical records, which would be a useful concept for further studies, and would also be very useful to vulnerable populated areas, in that people would have sufficient time to implement appropriate risk mitigation measures.
Author Contributions
Conceptualization, A.A., A.W. and H.X.; formal analysis, X.Z. and A.A.; methodology, A.A. and A.W.; project administration, A.A. and H.X. All authors have read and agreed to the published version of the manuscript.
Funding
This study is jointly supported by the Natural Science Foundation of Xinjiang Uygur Autonomous Region (2022D01A353, Funder: Aishajiang Aili); and the Entrusted project by Tarim River Basin Authority (TGJGLGJG-2022KYXM 0001, Funder: Hailiang Xu).
Data Availability Statement
The data that support the findings of this study are available from the corresponding author, upon reasonable request.
Acknowledgments
The authors would like to acknowledge the NOAA Air Resource Laboratory for providing HYSPLIT online. We also thank all of the staff from the Meteorological Department of Moyu County, Xinjiang, for their cooperation in data collection.
Conflicts of Interest
The authors declare no conflict of interest.
References
- Katsoulis, B.D. The potential for long-range transport of air-pollutants into Greece: A climatological analysis. Sci. Total Environ. 1999, 231, 101–113. [Google Scholar] [CrossRef] [PubMed]
- Liu, L.Y.; Shi, P.J.; Gao, S.Y. Dustfall in China’s western loess plateau is influenced by dust storms and haze events. Atmos. Environ. 2004, 38, 1699–1703. [Google Scholar] [CrossRef]
- Flores, R.M.; Kaya, N.; Ęser, Ö.; Saltan, Ş. The effect of mineral dust transport on PM10 concentrations and physical properties in Istanbul during 2007–2014. Atmos. Res. 2017, 197, 342–355. [Google Scholar] [CrossRef]
- Gupta, V.; Sharma, M.; Pachauri, R.; Babu, K.D. A comprehensive review on the effect of dust on solar photovoltaic systems and mitigation techniques. Sol. Energy 2019, 191, 596–622. [Google Scholar] [CrossRef]
- Englert, N. Fine particles and human health—A review of epidemiological studies. Toxicol. Lett. 2004, 149, 235–242. [Google Scholar] [CrossRef]
- Karaca, F.; Anil, I.; Alagha, O. Long-range potential source contributions of episodic aerosol events to PM10 profile of a megacity. Atmos. Environ. 2009, 43, 5713–5722. [Google Scholar] [CrossRef]
- Li, J.; Wang, S.Z.; Dong, M.M.; Liu, W.D.; Tao, B.; Xiao, S.W.; Zhang, P.Q.; Zhang, X.P. Polycyclic aromatic hydrocarbons in atmospheric PM2.5 and PM10 in the semi-arid city of Xi’an, Northwest China: Seasonal variations, sources, health risks, and relationships with meteorological factors. Atmos. Res. 2019, 229, 63–70. [Google Scholar]
- Wang, X.M.; Dong, Z.B.; Zhang, J.W.; Liu, L.C. Modern dust storms in China: An overview. J. Arid Environ. 2004, 58, 559–574. [Google Scholar] [CrossRef]
- Pan, H.; Huo, W.; Wang, M.; Zhang, J.; Meng, L.; Kumar, K.R.; Devi, N.L. Insight into the climatology of different sand-dust aerosol types over the Taklimakan Desert based on the observations from radiosonde and a-train satellites. Atmos. Environ. 2020, 238, 117705. [Google Scholar] [CrossRef]
- Yan, L.; Zhang, R.Q.; Maituohuti, A.; Wang, C.; Yang, X.D. SHRIMP U–Pb zircon ages, mineral compositions and geochemistry of placer nephrite in the Yurungkash and Karakash River deposits, West Kunlun, Xinjiang, northwest China: Implication for a Magnesium Skarn. Ore Geol. Rev. 2016, 72, 699–727. [Google Scholar]
- Plaisance, H.; Galloo, J.C.; Guillermo, R. Source identification and variation in the chemical composition of precipitation at two rural sites in France. Sci. Total Environ. 1997, 1, 79–93. [Google Scholar] [CrossRef]
- Shao, Y.; Dong, C.H. A review on East Asian dust storm climate, modeling, and monitoring. Glob. Planet. Chang. 2006, 52, 1–22. [Google Scholar] [CrossRef]
- Draxler, R.R.; Hess, G.D. Description of the HYSPLIT4 Modeling System. NOAA Technical Memorandum, ERLARL. 1997, 224. Available online: http://www.arl.noaa.gov/data/web/models/hysplit4/win95/arl-224.pdf (accessed on 12 September 2022).
- Xu, X.K.; Levy, J.K.; Lin, Z.H.; Chen, H. An investigation of sand–dust storm events and land surface characteristics in China using NOAA NDVI data. Glob. Planet. Chang. 2006, 52, 182–196. [Google Scholar] [CrossRef]
- Pongkiatkul, P.; Oanh, N.T.K. Assessment of potential long-range transport of particulate air pollution using trajectory modeling and monitoring data. Atmos. Res. 2007, 85, 3–17. [Google Scholar] [CrossRef]
- Ma, M.J.; Yang, X.H.; Yang, Q.H.; Cheng, L.Z.; Ali, M.; Wen, H.; Fan, Y. Characteristics of a dust devil and its dust emission in the northern margin of the Taklimakan Desert. Aeolian Res. 2020, 44, 100579. [Google Scholar] [CrossRef]
- Aili, A.; Xu, H.L.; Zhao, X.F. Health Effects of Dust Storms on the South Edge of the Taklimakan Desert, China: A Survey-Based Approach. Int. J. Environ. Res. Public Health 2022, 19, 4022. [Google Scholar] [CrossRef] [PubMed]
- Olaf, N. Early warning alerts for extreme natural hazard events: A review of worldwide practices. Int. J. Dis. Risk Red. 2021, 60, 102295. [Google Scholar]
- Tang, J.J.; Liu, A.R.; Qiu, H.G. Early warning, adaptation to extreme weather, and attenuation of economic losses: Empirical evidence from pastoral China. Int. J. Dis. Risk Red. 2023, 80, 103563. [Google Scholar] [CrossRef]
- Yu, H.; Yang, W.; Wang, X.H.; Yin, B.H.; Zhang, X.; Wang, J.; Gu, C.; Ming, J.; Geng, C.M.; Bai, Z.P. A seriously sand storm mixed air-polluted area in the margin of Tarim Basin: Temporal-spatial distribution and potential sources. Sci. Total Environ. 2019, 676, 436–446. [Google Scholar] [CrossRef]
- Wang, S.G.; Yaun, W.; Shang, K.Z. The impact of different kinds of dust weather on PM10 pollution in northern China. Atmos. Environ. 2006, 40, 7975–7982. [Google Scholar] [CrossRef]
- Quan, L.; Shi, S.; Zhu, Y.; Qian, W. Temporal–spatial distribution characteristics and causes of dust-day in China. Acta Geogr. Sin. 2001, 6, 477–485. (In Chinese) [Google Scholar]
- AQSIQ (Administration of Quality Supervision, Inspection and Quarantine)/NSC (National Standards Committee), 2006. Dust Storm Weather Classification Criterion, Standard Code: GBT 20480–2006, China, Standard Press, Beijing. Available online: http://www.gov.cn/govweb/fwxx/bw/jyzj/index.htm (accessed on 18 July 2023).
- Zhang, J.Y.; Meng, H.Y.; Zhang, G.B. Relationship between air pollution and daily respiratory system disease mortality in Chaoyang district, Beijing: A time-series analysis. J. Environ. Health 2011, 28, 788–791. [Google Scholar]
- Ekstrom, M.H.; Tanish, G.; Cappell, A. Australian Dust Storms: Temporal trends and relationships with synoptic pressure distributions (1960–99). Int. J. Climatol. 2004, 24, 1581–1599. [Google Scholar] [CrossRef]
- Hesam, S.; Mohsen, S. Determination of the transport routes of and the areas potentially affected by SO2 emanating from Khatoonabad Copper Smelter (KCS), Kerman province, Iran using HYSPLIT. Atmos. Pollut. Res. 2019, 10, 321–333. [Google Scholar]
- World Meteorological Organization (WMO), “Warning Dissemination and Communication”. Available online: https://public.wmo.int/en/our-mandate/focus-areas/natural-hazards-and-disaster-risk-reduction/mhews-checklist/warning-dissemination-and-communication (accessed on 18 May 2021).
- Kimoanh, N.; Chutimon, P.; Ekbordin, W.; Supat, W.; Oanh, N.T.K. Meteorological pattern classification and application for forecasting air pollution episode potential in a mountain-valley area. Atmos. Environ. 2005, 39, 1211–1225. [Google Scholar] [CrossRef]
- Dimitris, V.; Kostas, K.; Jaakko, K.; Teemu, R.; Ari, K.; Mikko, K. Intercomparison of air quality data using principal component analysis, and forecasting of PM10 and PM2.5 concentrations using artificial neural networks, in Thessaloniki and Helsinki. Sci. Total Environ. 2011, 409, 1266–1276. [Google Scholar]
- Song, J.I.; Yum, S.S.; Ismail, G.; Chang, K.H.; Kim, B.G. Development of a new visibility parameterization based on the measurement of fog microphysics at a mountain site in Korea. Atmos. Res. 2019, 229, 115–126. [Google Scholar] [CrossRef]
Figure 1.
Location and surrounding environment of the study area (Note: Driving number of this map: GS (2020)4619).
Figure 1.
Location and surrounding environment of the study area (Note: Driving number of this map: GS (2020)4619).

Figure 2.
The commonly used operational framework of forecasting systems in the world.
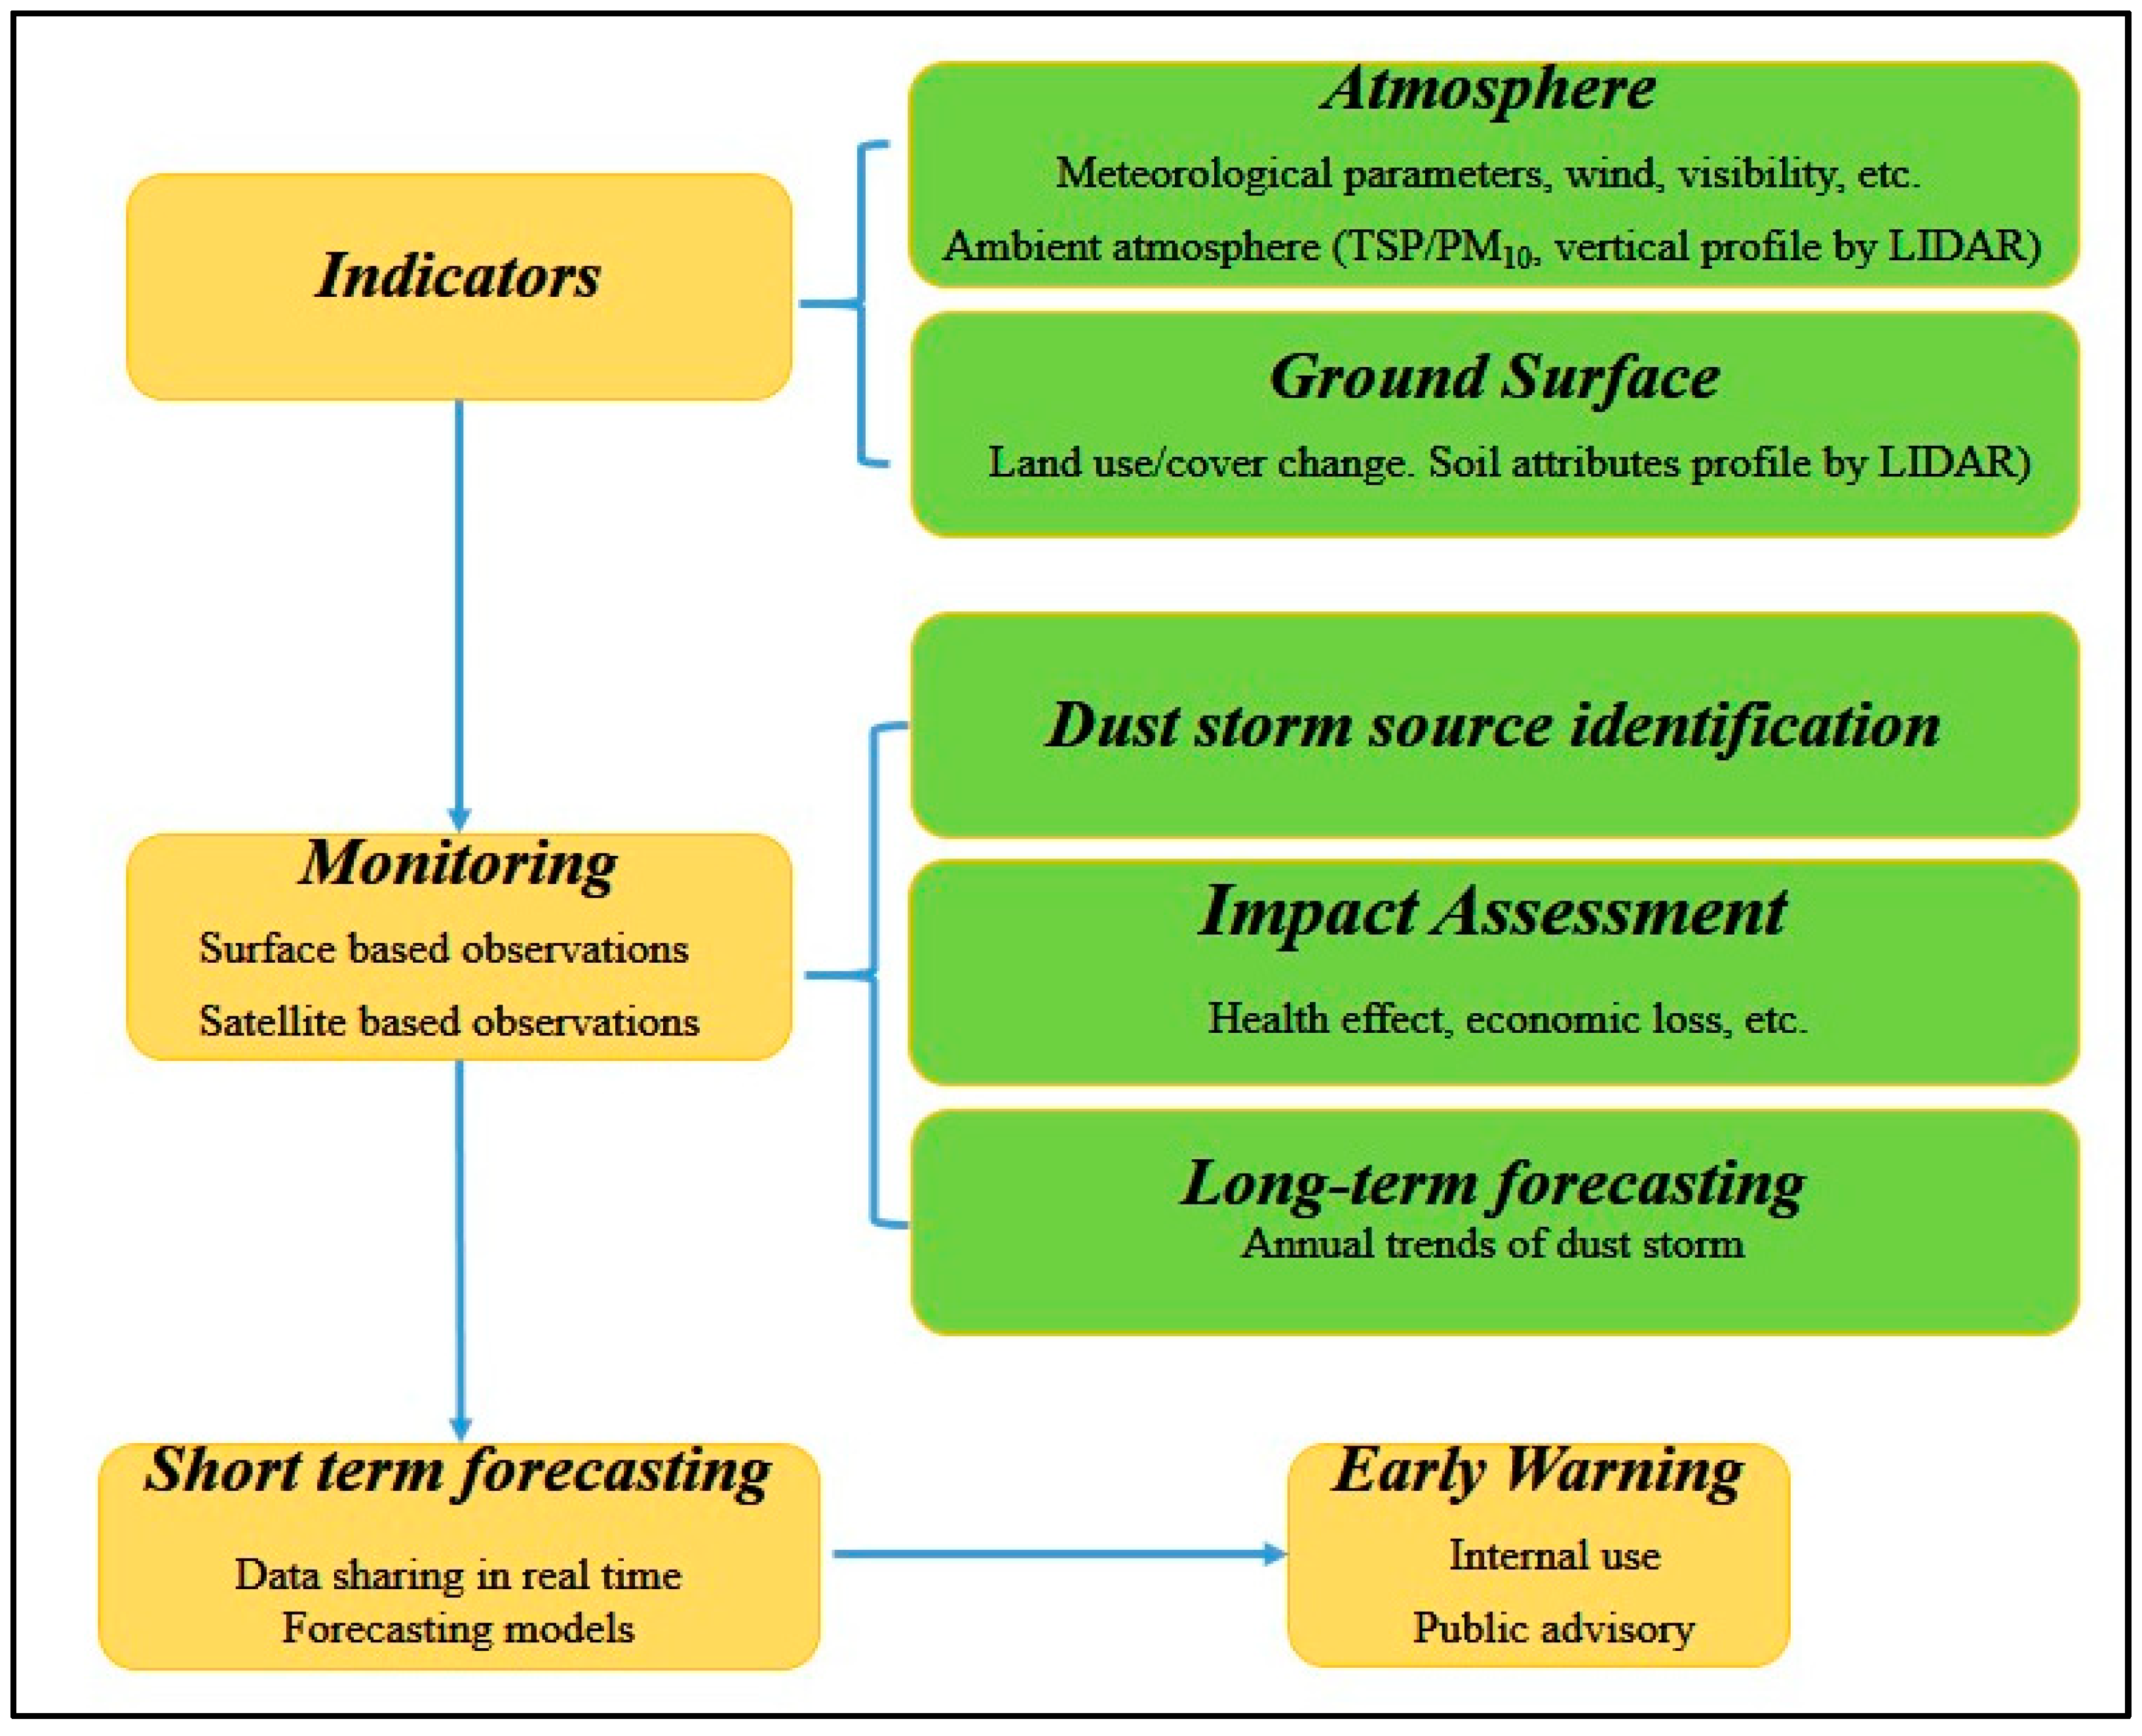
Figure 3.
Monitoring and early warning framework for dust storms in China.

Figure 4.
36 h of backward trajectory and vertical movement of a dust storm arriving at the study area (Note: Star * in the map is the study area or the ending point of the trajectory).
Figure 4.
36 h of backward trajectory and vertical movement of a dust storm arriving at the study area (Note: Star * in the map is the study area or the ending point of the trajectory).
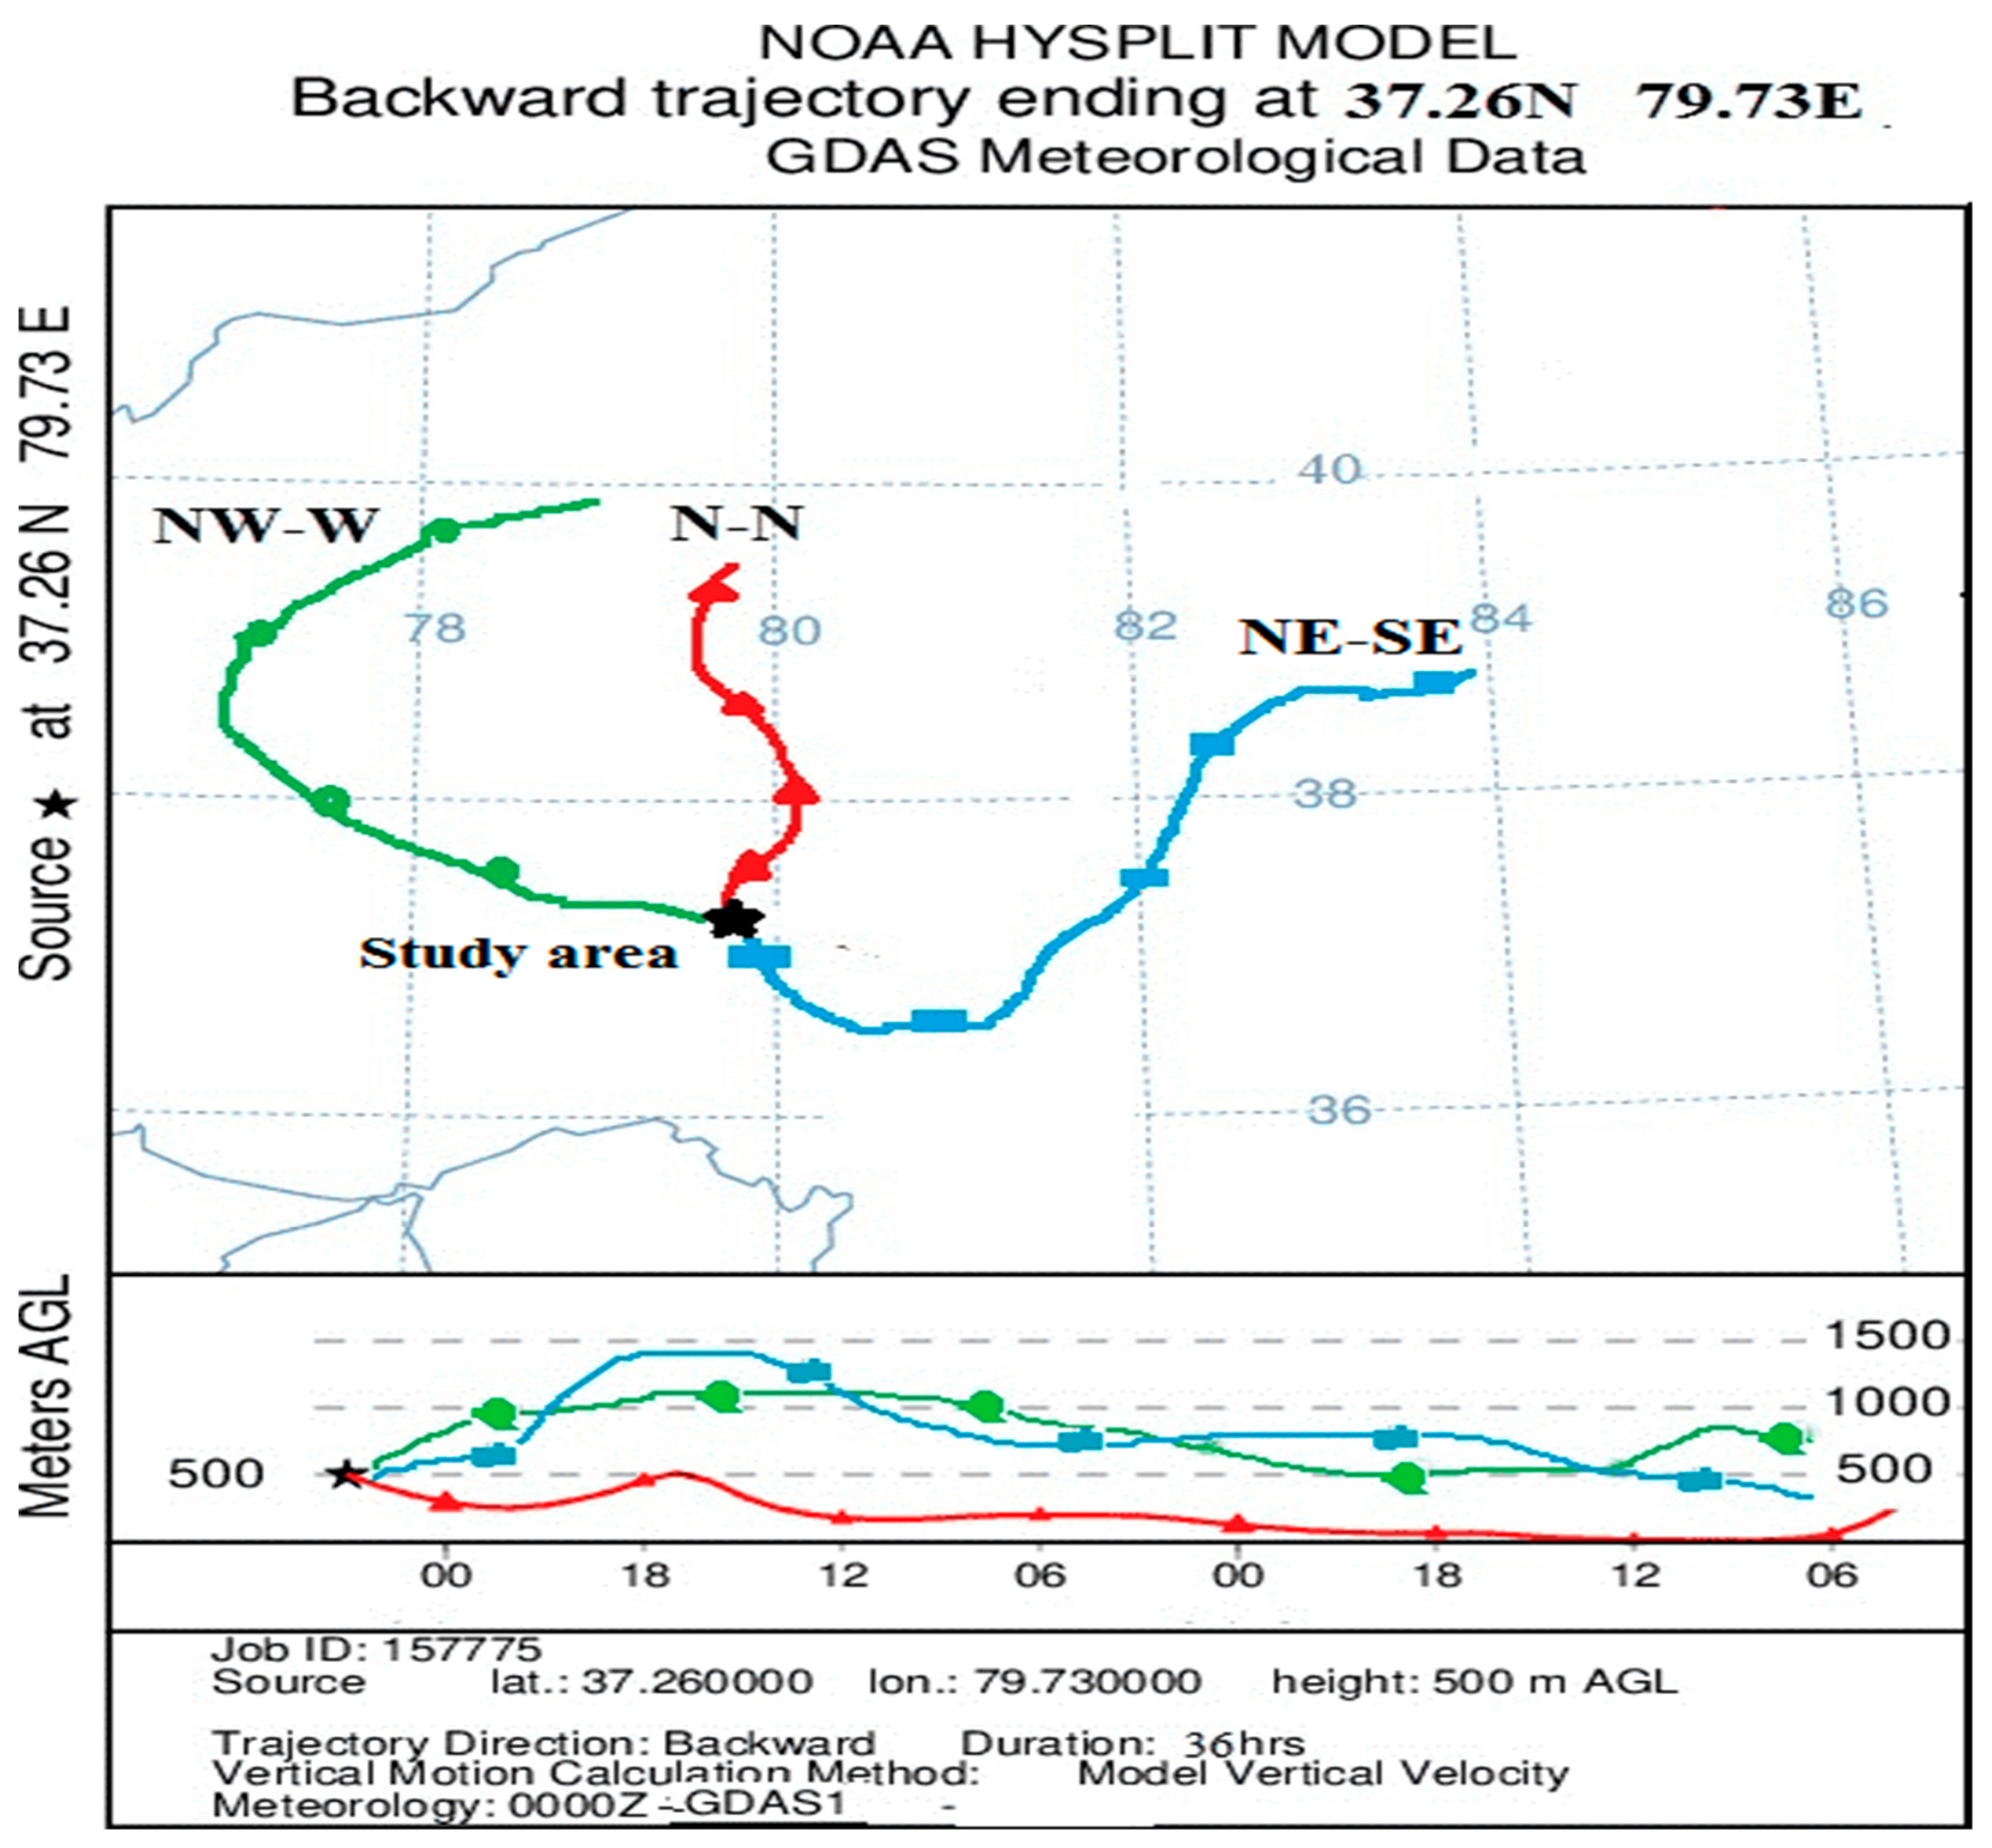
Figure 5.
Classification of HYSPLIT pattern of one day in the dusty season.
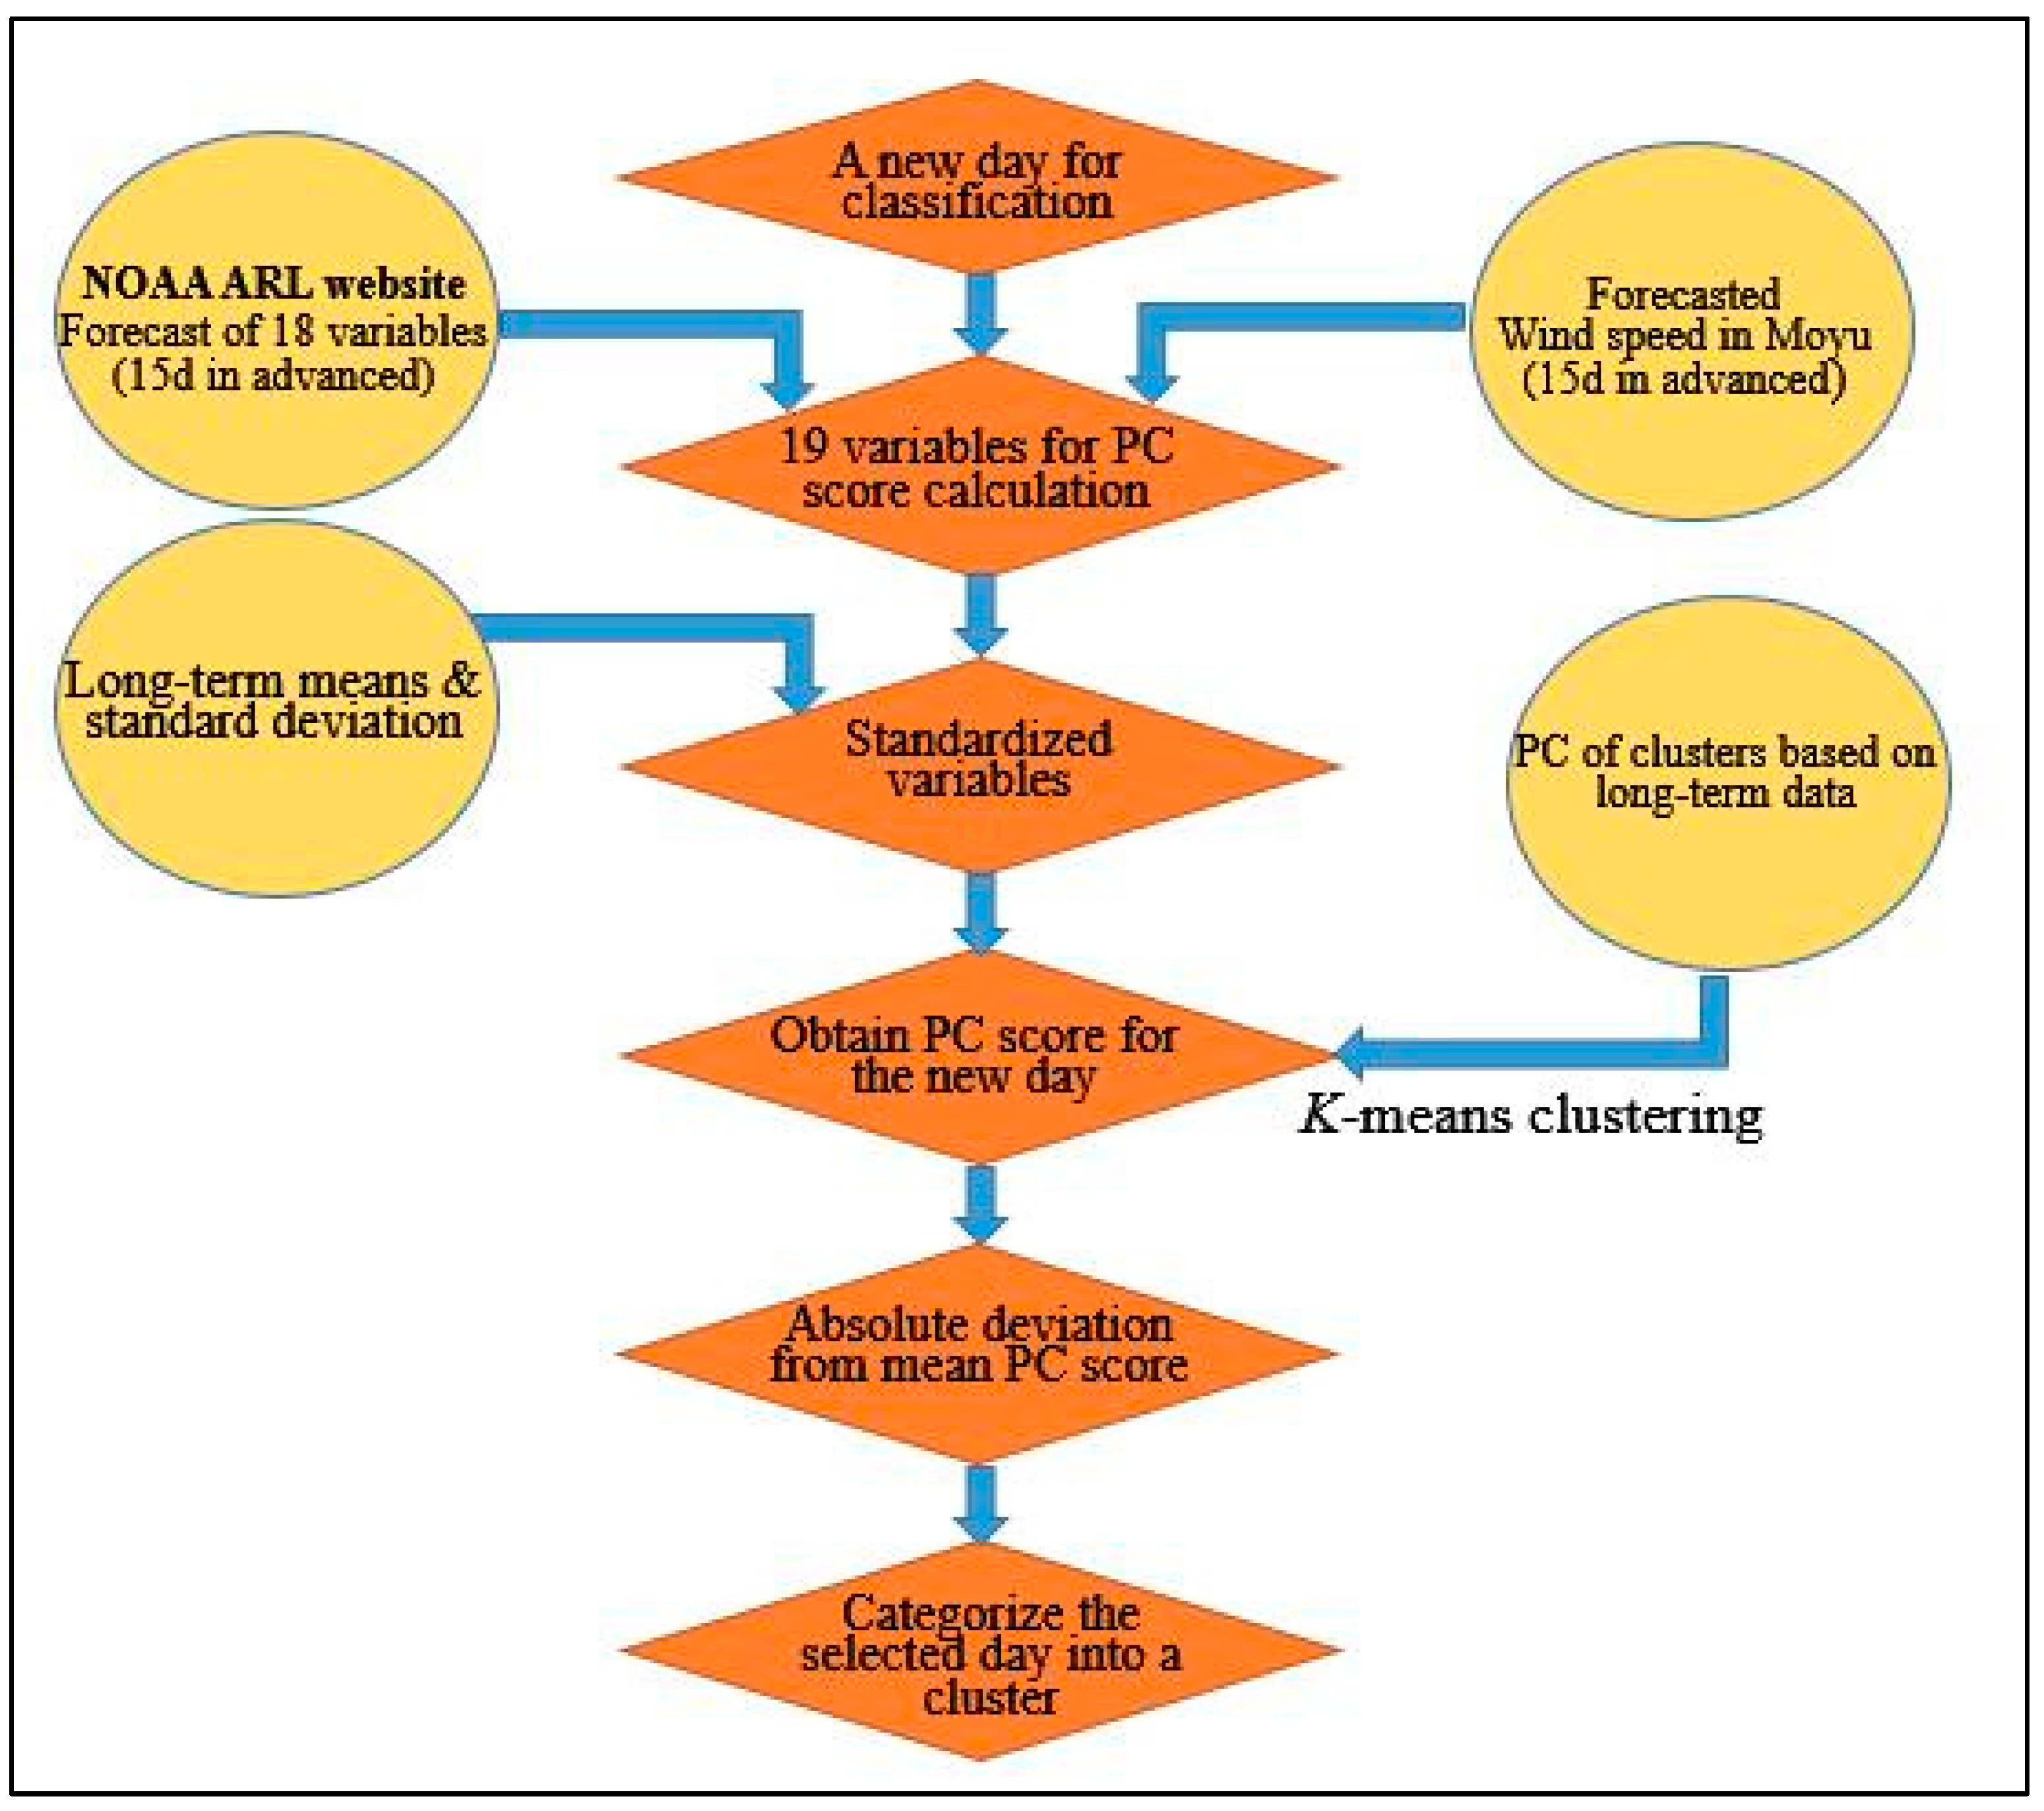
Figure 6.
Warning for dust storm frequency and air pollution levels in different clusters. (Note: SD: suspended dust; BD: blowing dust; SS: sand storm).
Figure 6.
Warning for dust storm frequency and air pollution levels in different clusters. (Note: SD: suspended dust; BD: blowing dust; SS: sand storm).


Table 1.
Frequency and meteorological characteristics of dust storms from different pathways and air pollutant concentrations.
Table 1.
Frequency and meteorological characteristics of dust storms from different pathways and air pollutant concentrations.
| Parameters | Cluster 1 (NE-SE Category) | Cluster 2 (N-N Category) | Cluster 3 (NW-W Category) | |
|---|---|---|---|---|
| Dust storm frequency | Total frequency (d) | 1251 (64.1%) | 215 (11.1%) | 486 (24.8%) |
| Suspended dust (d) | 986 (71.5%) | 118 (8.6%) | 274 (19.9%) | |
| Blowing dust (d) | 233 (57.4%) | 58 (14.3%) | 115 (28.3%) | |
| Sand storm (d) | 32 (19.1%) | 39 (23.1%) | 97 (57.8%) | |
| Non-dusty days (d) | 69(28.3%) | 79 (32.4%) | 96 (39.3%) | |
| Meteorological conditions | Potential temperature (K) | 291.23 ± 23.2 | 297.3 ± 24.7 | 282.46 ± 25.3 |
| Ambient temperature (K) | 276 ± 0.11 | 279 ± 12 | 269 ± 12 | |
| Rainfall (mm/day) | 0.24 | 0.0 | 0.42 | |
| Relative humidity (%) | 26.3 ± 1.4 | 27.1 ± 2.0 | 34.3 ± 3.1 | |
| Mixing layer depth (m) | 1338.52 ± 109 | 1749.89 ± 152 | 1841.55 ± 234 | |
| Downward solar radiation flux (W/m2) | 436.88 ± 47 | 557.17 ± 49 | 592.31 ± 43 | |
| Wind speed (m/s) | 7.6 ± 1.4 | 7.3 ± 1.2 | 8.6 ± 1.7 | |
| Air pollutants concentration | PM10 (μg/m3) | 597.13 | 579.23 | 619.51 |
| PM2.5 (μg/m3) | 502.44 | 479.13 | 539.66 | |
| SO2 (μg/m3) | 39.56 | 35.12 | 31.07 | |
| NO2 (μg/m3) | 41.14 | 38.76 | 31.68 | |
| CO (μg/m3) | 15.89 | 14.24 | 12.04 | |
| O3 (μg/m3) | 30.96 | 31.23 | 29.21 | |
Table 2.
Comparison of early warning development approaches.
| Parameters | Proposed Early Warning Scheme in This Study | An Early Warning System Based on the Dispersion Model | |
|---|---|---|---|
| Approach | Statistical approach | Dispersion modeling (deterministic) | |
| Input data | Emission data | Not used | Need detailed gridded emission data |
| Meteorological data | Use online forecast data available from the NOAA/HYSPLIT website to calculate PC scores and identify the HYSPLIT cluster for the forecast day | Need detailed meteorology data produced by meteorological models | |
| Other data | Long-term average daily air pollutants (SO2, NO2, TSP) for the HYSPLIT cluster identified for the forecast day | Satellite image, PM10 observation data, etc. | |
| Output | Results | The probability of dust storm occurrence and pollutant concentration is based on statistics of the forecasted pattern of the day in Moyu County | Concrete values of PM10 on any grid in the considered domain |
| Warning detail | Warnings could be issued for the day with the probability of occurrence of a dust storm with different degrees of severity. The range of daily pollutants is given | Detailed instructions are given to people to avoid exposure based on the range of PM10 | |
Disclaimer/Publisher’s Note: The statements, opinions and data contained in all publications are solely those of the individual author(s) and contributor(s) and not of MDPI and/or the editor(s). MDPI and/or the editor(s) disclaim responsibility for any injury to people or property resulting from any ideas, methods, instructions or products referred to in the content. |
© 2024 by the authors. Licensee MDPI, Basel, Switzerland. This article is an open access article distributed under the terms and conditions of the Creative Commons Attribution (CC BY) license (https://creativecommons.org/licenses/by/4.0/).
Share and Cite
MDPI and ACS Style
Aili, A.; Waheed, A.; Zhao, X.; Xu, H. Establishing an Early Warning System for Dust Storms in Peri-Desert Regions. Environments 2024, 11, 61. https://doi.org/10.3390/environments11040061
AMA Style
Aili A, Waheed A, Zhao X, Xu H. Establishing an Early Warning System for Dust Storms in Peri-Desert Regions. Environments. 2024; 11(4):61. https://doi.org/10.3390/environments11040061
Chicago/Turabian StyleAili, Aishajiang, Abdul Waheed, Xinfeng Zhao, and Hailiang Xu. 2024. "Establishing an Early Warning System for Dust Storms in Peri-Desert Regions" Environments 11, no. 4: 61. https://doi.org/10.3390/environments11040061
Note that from the first issue of 2016, this journal uses article numbers instead of page numbers. See further details here.