Article

Biosurfactant-Assisted Phytoremediation of Diesel-Contaminated Soil by Three Different Legume Species

by
Rimas Meištininkas
1,
Irena Vaškevičienė
1,
Austra Dikšaitytė
2,
Nerijus Pedišius
1,† and
Jūratė Žaltauskaitė
1,2,*
1
Laboratory of Heat Equipment Research and Testing, Lithuanian Energy Institute, Breslaujos 3, LT44404 Kaunas, Lithuania
2
Department of Environmental Sciences, Vytautas Magnus University, Universiteto 10, LT53361 Akademija, Lithuania
*
Author to whom correspondence should be addressed.
Deceased author.
Environments 2024, 11(4), 64; https://doi.org/10.3390/environments11040064
Submission received: 20 February 2024 / Revised: 18 March 2024 / Accepted: 20 March 2024 / Published: 25 March 2024

Abstract

:
This study aims to assess the impact of HydroBreak PLUS biosurfactant on the phytoremediation of diesel-contaminated soil by three legume plant species: Medicago sativa, Lotus corniculatus, and Melilotus albus. Legumes were grown in soil contaminated with diesel (4.0 g kg−1, 6.0 g kg−1) for 90 days, and the changes in soil diesel and nutrient concentrations, plant growth, and physiological parameters were measured. Diesel negatively affected the biomass production of all legumes, though the reduction in growth rate was observed only in L. corniculatus and M. albus. L. corniculatus had the highest diesel removal rate of 93%, M. albus had the lowest of 87.9%, and unplanted treatments had significantly lower diesel removal rates (up to 66.5%). The biosurfactant mitigated diesel-induced reduction in plant shoot and root weight and an increase in L. corniculatus root biomass (24.2%) were observed at 4.0 g kg−1 diesel treatment. The use of biosurfactant accelerated diesel removal from the soil, though the effect was diesel soil concentration and plant species-dependent. In unplanted treatments, the diesel removal rates increased by 16.4% and 6.9% in the treatments with 4 and 6 mg kg−1, respectively. The effect of biosurfactants on diesel removal by plants was less pronounced and reached 4.6% and 3.2% in the treatments with 4 and 6 mg kg−1, respectively. The study revealed that the phytoremediation efficiency could not be directly linked to plant physiological parameters as only M. sativa changes in plant growth corresponded well with photosystem II performance. Implementation of legumes and biosurfactants has a positive effect on soil quality by its enrichment with inorganic P and soluble phenols, while no enrichment in NO3 and NH4+ was observed.

1. Introduction

Petroleum hydrocarbons are the essential building blocks of petroleum and natural gas. These versatile compounds play an important role in our daily lives, serving as fuels, lubricants, and raw materials for producing industrial chemicals, plastics, fibres, rubbers, solvents, and explosives. Hydrocarbon combustion is the primary energy source for generating electricity, heating homes, and powering transportation [1].
Global wide use of petroleum fossil fuels presents a considerable threat to environmental contamination with petroleum hydrocarbons. These substances can cause severe harm to ecosystems by disrupting food chains, damaging habitats, and harming wildlife [2]. During oil drilling, extraction, refining, storage, loading, and transportation processes, petroleum hydrocarbons enter the soil environment and significantly impact soil quality and soil-dwelling biota. Petroleum hydrocarbons can affect the physical and chemical properties of the soil and alter the microbial community, leading to a reduction in soil fertility. This pollution can hinder plant growth development and decrease productivity [3]. Because petroleum hydrocarbons are persistent, tend to accumulate in the environment and living organisms, and have the ability to enter the food chain, they pose a significant human health risk [4,5,6].
Across Europe, there could be up to 2.5 million potentially contaminated sites [7]. More than 40,000 sites in the USA were reported as Superfund sites, of which more than 1300 are listed in the National Priorities List (NPL) [8]. The most significant source of soil pollution varies by region. Industrial pollution poses the biggest problem in Western Europe and North America; farming in Asia, Latin America, and Eastern Europe; and mining in Sub-Saharan Africa [9,10]. Petroleum hydrocarbons are one of the most common pollutants in contaminated soil sites. It is imperative to pay attention to soil pollution caused by petroleum hydrocarbon contaminants, given their toxic effect on human health and the environment [6].
Various techniques could be used to remediate soil contaminated with petroleum hydrocarbons. Some standard physical and chemical remediation methods include using steam, nitrogen, or air to strip out the contaminants, high-pressure water jetting, solvent extraction, and hot or cold water washing. However, these physicochemical treatments can be rather destructive and expensive [11,12]. Currently, biological treatment technologies are widely adopted for the remediation of petroleum hydrocarbon-polluted environments due to their effectiveness and cost-efficiency [13]. Phytoremediation is an up-and-coming eco-friendly technique employing plants to detoxify contaminated sites, offering a sustainable alternative to conventional physicochemical methods [14]. Plant-assisted remediation could be effective in reducing contaminant concentrations in soil but also could contribute to soil health recovery [15]. Therefore, leguminous plants, due to their nitrogen-fixing ability, could reduce the competition for limited soil nitrogen at petroleum-contaminated sites and be effective in soil remediation [16]. There is an emerging interest in applying various additives to enhance petroleum hydrocarbon phytoremediation. One promising approach is to use additional biosurfactants as phytoremediation process promoters. Biosurfactants are secondary metabolites produced by microorganisms, and they can enhance the rate of bioremediation of petroleum hydrocarbons by reducing surface tension, promoting emulsification, and micelle formation, making hydrocarbons bioavailable for microbial breakdown [9,17]. Biosurfactants are advantageous over chemical surfactants due to their simple chemical structure, biodegradability, low toxicity, and environmental compatibility [18,19]. The rhizosphere is a dynamic environment that significantly influences the plant’s nutritional status and growth. It also has a diverse microbial community that can effectively produce biosurfactants. While biosurfactants are naturally produced during phytoremediation, supplementary biosurfactants can also be applied to speed up soil decontamination [20,21]. Legume plants can establish symbiotic interactions with rhizobia and arbuscular mycorrhizal fungi; thus, adding biosurfactants can enhance these interactions, promoting petroleum hydrocarbon degradation in the soil and increasing the abundance of microorganisms [22,23]. Biosurfactants can interact with legume plants and their associated microorganisms in various ways, such as enhancing plant growth, improving stress tolerance, developing disease resistance, improving nutrient uptake, and promoting soil biodiversity [24,25,26]. This research aimed to evaluate the influence of the biosurfactant HydroBreak PLUS on the diesel-contaminated soil phytoremediation efficiency with Medicago sativa, Melilotus albus, and Lotus corniculatus in terms of diesel removal, plant response, and soil quality changes.

2. Materials and Methods

2.1. Plant and Soil Sources

Three legume species from the Fabaceae family were chosen for the experiment: (Medicago sativa L., Melilotus albus L., and Lotus corniculatus L.). These plant species were chosen for their high tolerance to petroleum hydrocarbons in soil, as well as for their phytoremediation potential and low soil fertility requirements. Selected plant species are typically grown as forage legumes not only because of their high nutritive value but also their ability to enrich the soil with nitrogen [27,28,29]. The plant seeds were sourced from the Lithuanian Research Center for Agriculture and Forestry (Akademija, Lithuania).
The natural unpolluted soil samples were collected from an open field near Jonava, located in central Lithuania (108467, 24.241445 WGS). The soil was composed of sandy loam and had a pHKCl of 6.51. The initial soil contained 2.10% soil organic matter (SOM), 734.83 mg kg−1 of NO3, 8.62 mg kg−1 of NH4+, and 108.84 mg kg−1 of inorganic P.

2.2. Experimental Design

The soil was contaminated with diesel (D) at 4.0 and 6.0 g kg−1 levels, representing low contamination levels. Contaminants were added and left for 24 h before the experiment. A short ageing period was chosen due to the experiment’s design to test legume-based soil phytoremediation potential and biosurfactant amendment interactions with fresh diesel contamination. To study the biosurfactant effect on diesel phytoremediation with different legume species, biosurfactant HydroBreak PLUS (BS) at 1 mL/kg−1 was added to the soil prior to homogenization using an electric mixer. HydroBreak PLUS contains fully biodegradable surfactants, plant extracts, and organic acids. It can break down vegetable, animal, mineral, synthetic oils, greases, fats, and many aromatic substances through aerobic means. Additionally, this product promotes microbial activities when used with petroleum and fat-based substances. HydroBreak PLUS is classified as non-harmful. The product is completely miscible with water and has a biodegradability of 97%.
The oval-shaped plastic pots were filled with 4 kg of soil each, with a total of 57 pots used in the experiment. The pots were perforated at the base and were 25 cm deep. The growth chamber with a temperature of 23/14 ± 1 °C (day/night) and a 14/10 h photoperiod was used to conduct the experiment. The photoactive radiation intensity was maintained at ~445 µmol m−2 s−1 using Venture Sunmaster dual-spectrum, high-pressure sodium HPS lamps (3 × 600 W). The relative air humidity (RH) was kept at 55–60%. The experiment was carried out in triplicate.
The following treatments were performed: (i) C control, unpolluted soil; (ii) D4 contaminated soil, diesel concentration 4.0 g kg−1; (iii) D6 contaminated soil, diesel concentration 6.0 g kg−1; (iv) D4BS contaminated soil, diesel concentration 4.0 g kg−1, and 1 mL kg−1 BS additive; (v) D6BS contaminated soil, diesel concentration 6.0 g kg−1, and 1 mL kg−1 BS additive. All five treatments comprised the three selected legume plant species: M. sativa, M. albus, L. corniculatus, and unplanted treatments. Each pot was sown with 15 plant seeds. After germination, the seedlings were thinned, and five plants were left in each pot. In order to avoid potential differences in temperature and light intensity in the growth chamber, the pots were randomly rotated every day.
The height of plant shoots was measured every two weeks, and 90 days after sowing (90 DAS), the plants were harvested. The plant’s shoots and roots were dried in an oven at a temperature of 70 °C until they reached a constant weight. The tolerance index (TI) was calculated by taking the ratio of the plant’s dry aboveground biomass in diesel-contaminated soil with the dry aboveground biomass of the plants in control soil [30]. The 90-day experimental period was thoughtfully selected to ensure that the chosen plant species had ample time to mature, flower, and develop their root system.
Soil samples for diesel concentration determination were collected at the beginning of the experiment and after 45 and 90 days. Gas chromatography was used (Shimadzu GC-2010) (Kyoto, Japan) for quantitative analysis of diesel in soil, following the ISO 16703:2004 standard for detecting petroleum hydrocarbons (C10–C40) in soil [31]. The removal efficiency of diesel was calculated using the following formula: [(initial diesel concentration − diesel concentration after treatment)/initial diesel concentration] × 100.
Soil samples for nutrient (NO3, NH4+, and inorganic P) and soluble phenol chemical analysis were taken after the plant harvest and stored at a temperature of 4 °C.
The soil was sieved with a 1 mm sieve and dried at 70 °C to a constant weight before being extracted (1:10 w/w with distilled water). To determine the concentration of nitrate, the Griess method [32] was used, and the Berthelot reaction [33] was used to determine the concentration of ammonium. Concentrations of water-soluble phenols were determined using the Folin–Ciocalteau reagent [34], and the Malachite green method [35] was used to determine the concentration of inorganic phosphorus. Soluble phenols, nitrate, ammonium, and inorganic phosphorus were measured spectrophotometrically (SPECTROstar Nano, Ortenberg, Germany) at wavelengths of 725 nm, 540 nm, 660 nm, and 630 nm, respectively.
Chlorophyll fluorescence measurements were conducted with the Plant Efficiency Analyser, PEA (Hansatech Instruments, Ltd., King’s Lynn, UK). Chlorophyll fluorescence is the most commonly used method for monitoring and screening plant stress tolerance due to its high sensitivity to alterations in the photosynthetic system, particularly photosystem II [36]. Healthy top intact leaves of plants were used for the measurements. The leaves were dark-adapted using leaf clips for about 15 min. The dark-adapted leaf samples of 4 mm diameter within each clip were illuminated with a saturating ultra-bright red-light pulse of 660 nm light at 1800 μmol m−2 s−1 for 1 s.

2.3. Statistical Analysis

Statistical analyses were performed using STATISTICA 12 software. Fisher’s Least Significant Difference (LSD) test compared the significant means of plant growth and soil parameters. The strength of diesel and biosurfactant effects between different treatments was compared using the Analysis of Variance (ANOVA) F-test. The results were deemed significant if p ≤ 0.05.
Correlation analysis was performed to determine the relationship between the biomass production of plants and the removal rate of diesel. The results were deemed significant if p ≤ 0.05.
The plant growth rate is the change (cm week−1) in plant growth over time, measured against a baseline period. To determine the plant shoot growth rate, a linear regression was used to predict the growth rate (cm week−1) by calculating the slope of the curve (b). It provides valuable information about plant growth and is a useful tool for comparing and analysing plant growth patterns in different treatments. To analyse the significance of the difference between different plant species’ growth rates, a Z-test was performed. Differences in growth rates were significant (p < 0.05) if the Z-test exceeded 1.96.
Various biophysical parameters derived from OJIP transients were calculated using JIP-test equations [37,38] based on data from 1 s measurements. JIP-test is a mathematical model developed as a biophysical tool for assessing the cascade of chloroplast redox reactions at microsecond or millisecond scales [39] based on energy flow theory across thylakoid membranes. The JIP test converts the shape changes in the OJIP transient curve to quantitative changes in numerous parametric data [37]. Table A1 provides descriptions and equations for the calculated JIP-test parameters, showing how to calculate each biophysical parameter using the initial fluorescence measurements [37,38,39,40,41,42,43,44,45,46,47,48,49].

3. Results

3.1. Estimation of Plant Biomass and Growth Rate

All three legume plant species (M. sativa, M. albus, and L. corniculatus) survived under all diesel and BS treatments (D4, D6, D4BS, and D6BS) during the whole remediation experiment. Diesel soil pollution had a significant adverse impact on all the tested legume plant species, and the inhibitory effect was more pronounced under higher diesel concentrations. The most considerable negative effect on shoot biomass production was observed in the D4 and D6 treatments with M. albus (ANOVA, F = 50.7, p > 0.05). In the D6 treatment of M. albus, there was a 64.5% reduction in shoot dry weight compared to the control. Diesel soil contamination also had a significant effect on the shoot biomass of L. corniculatus (ANOVA, F = 28.99, p > 0.05), though experienced inhibitory effect was less pronounced (up to 35.6%). Among all the plant species tested, M. sativa was the most resistant to diesel contamination (ANOVA, F = 12.74, p > 0.05), with only a 34.5% shoot weight loss in D6 treatment (Figure 1A). Tested leguminous plant species differed in their tolerance to diesel soil contamination. The highest tolerance was shown by M. sativa, while M. albus exhibited the lowest tolerance (Table 1).
The BS alleviated adverse diesel impact on the aboveground biomass of all tested plant species at both diesel concentrations. BS significantly (up to 25.0%) diminished the inhibitory effect of diesel on L. corniculatus shoot dry weight in D6BS treatment (Figure 1A), resulting in significantly increased TI (0.52 vs. 0.77, p < 0.05) (Table 1). However, the positive impact of the BS was less pronounced in the case of two other legume species, M. sativa and M. albus, with a decrease in the inhibitory effect of only 12.2% and 13.8%, respectively. In the D4BS treatment, L. corniculatus and M. albus showed similar decreases in negative diesel impact, with reductions of 22.2% and 11.6%, respectively. For M. sativa (D4BS), the addition of the BS had a stimulating effect compared even with the control (C), though it did not reach statistical significance (ANOVA, F = 0.003, p < 0.05).
In comparison to its effect on the aboveground mass of the plant, diesel had a less detrimental impact on the biomass of roots of the plants studied (ANOVA, FMA = 17.71, p > 0.05; FMS = 11.14, p > 0.05; FLC = 8.68, p > 0.05). The highest diesel inhibitory effect on root biomass was recorded for M. albus, whose root biomass in the D6 treatment was 54.5% lower than that in the control treatment, while M. sativa and L. corniculatus lost 39% and 23.9%, respectively, compared to the control.
Soil amendment with BS not only counteracted the harmful diesel effect on the root growth of M. sativa and L. corniculatus but also notably enhanced root growth. The most pronounced increase in root biomass (+24.2%) compared to the control was noticed in L. corniculatus subjected to D4BS treatment. Moreover, BS soil amendment affected L. corniculatus root morphology as more lateral roots were formed, resulting in higher root density, and the principal root was longer and thicker, indicating rooting depth and area of root zone changes (Figure 2). However, in the case of M. albus, the use of BS did not produce any stimulating effects compared to the control group. Additionally, when comparing D6 and D6BS treatments of M. albus, the application of BS resulted in a statistically significant decrease in the root mass of 16.5% (p < 0.05).
Due to their individual susceptibility to pollutants and different biology, certain plants exhibited dissimilar growth patterns. From the 4th week, the growth of M. albus, measured as plant height, grown in clean (control) soil was constantly higher compared to that of plants grown in diesel-contaminated soil (Figure 3, Table 2). The differences in plant growth patterns of M. sativa and L. corniculatus grown in control and diesel-contaminated soil were less expressed. The plant height of plants grown in BS amended diesel contaminated soil was higher than in the treatments without BS amendment. In addition, from the 10th week, the height of M. sativa grown in BS-amended soil was higher than the height of control plants. For M. albus and L. corniculatus, plant height in BS-amended treatment was also higher than in the treatments without BS.
M. sativa exhibited a consistent growth rate across all treatments (Table 2), although the application of BS resulted in growth rate enhancement; however, the increase was not statistically significant (p > 0.05). M. albus was highly susceptible to diesel soil pollution and grew significantly slower than the control group. Although supplemented BS slightly mitigated the inhibitory diesel effect on the growth rate of M. albus, the growth rate remained lower than that of control plants. The growth rate of L. corniculatus in diesel-contaminated soil was reduced by 8.0–13.1% and 2.7–11.8% in the treatments without BS and with BS application, respectively.

3.2. Plant Chlorophyll Fluorescence

The chlorophyll fluorescence (ChlF) of the tested legume species was differentially affected by diesel and biosurfactant. The ChlF changes in M. sativa demonstrated the typical response of photosystem II (PSII) reaction centres (RCs) functionality under stress conditions, with the response increasing with stressor intensity. When a certain part of PSII RCs were inactivated under D6 treatment, M. sativa leaves responded to altered RC functionality by increasing the light energy absorption capacity of the remaining active RCs (increases in (dV/dt)o, ABS/RC, and TRo/RC, and decreases in RC/ABS and RC/SCm) (Figure 4A). However, ineffective energy exploitation within the remaining active RCs led to an increase in non-photochemical dissipation energy (increases in DIo/RC and DIo/CSm) and, therefore, to a decrease in linear electron flow in photosystems and between them (reductions in ETo/CSm, ψEo, φEo, and φRo). This resulted in the diminished structure–function index (SFIabs) that favors photosynthesis, performance indexes (PIabs and PItotl), and overall photosynthetic driving forces (DFabs and DFtotal). The addition of BS significantly (p < 0.05) reduced the rate of RCs’ closure ((dV/dt)o) under D6 treatment (D6BS), increasing the density of active RCs (RC/ABS and RC/CSm) and thus absorption, trapping, and dissipation per active RCs decreased. This finally increased SFIabs, PIabs, and PItotal, which were higher even than those of control plants (p > 0.05).
A non-typical ChlF response was observed for L. corniculatus. Both D4 and D6 treatments affected the ChlF of L. corniculatus to a similar extent (Figure 4C). The rate of PSII RCs’ closure and, thus, excitation energy transfer between the RCs (dVG/dto) increased, reducing the density of active PSII RCs, electron transport (ET) in PSII (ETo/CSm), and between photosystems (ψEo, φEo), and thus SFIabs, PIabs, and DFabs. However, contrary to expectations that a decrease in ET in PSII would further reduce it even more in PSI, as was the case for M. sativa (decreases in φRo and REo/CSm) (Figure 4A), electron flow through PSI appeared to be facilitated in L. conriculatus leaves, allowing PSI to continue functioning at high efficiency. This is evidenced by the electron flow capacity from plastoquinone to the PSI end electron acceptors, as indicated by increases in δRo (p < 0.05 for D6), φRo, REo/RC (p < 0.05 for D6), and REo/CSm, and thus PItotal and DFtotal increased (Figure 4C). BS barely alleviated the diesel effect at 6 g kg−1 but was effective at 4 g kg−1, eliminating the increased rate of PSII RCs closure ((dV/dt)o) and increasing PSII performance (PIabs, SFIabs, and DFabs), which was close to control plants (p > 0.05) (Figure 4C).
M. albus also showed other untypical responses to stress conditions with the most pronounced changes in photosynthetic performance (Figure 4B). Unexpectedly, (dV/dt)o decreased under D6 treatment, decreasing absorption, trapping, and dissipation per active RCs, and thus RC/ABS and RC/CSm increased, enhancing PSII performance (PIabs, SFIabs, and DFabs). However, the ET in PSII and between photosystems did not change under D4 or D6 treatments. At the same time, electron flow from intermediate carriers to PSI final electron acceptors (δRo and φRo) increased, thereby increasing Pitotal and Dftotal (Figure 4B). ChlF in D4BS treatment almost did not differ from control ones (p > 0.05), while increases in performance indexes were observed in D6BS treatment (Figure 4B).

3.3. Removal of Diesel

The implementation of three different legume plants (M. sativa, M. albus, L. corniculatus) for diesel-contaminated soil phytoremediation led to a significant decrease in soil contamination level (p < 0.05). Intermediate laboratory tests were conducted after 45 and 90 days to comprehensively understand pollutant degradation (Figure 5).
The results show that most diesel pollution was decomposed during the first half of the experiment. The efficiency of the diesel removal rate under the D4 treatment spanned from 53.3% in unplanted treatment to a remarkable removal of 87.1% in soil planted with legumes. In the D6 treatment, the removal rate was somewhat lower, reaching 36.3% in unplanted treatments, 80.6% in treatments planted with M. sativa, and 80.4% with M. albus. Only L. corniculatus displayed a higher diesel removal rate of 87.3% in the D6 treatment than in the D4 treatment (Figure 5C).
At the end of the experiment (90 days), diesel degradation in planted D4 treatments varied slightly from 87.9% for M. albus to 93% for L. corniculatus. Very similar values were observed in planted D6 treatments. Meanwhile, the diesel removal rate in unplanted treatments reached only 66.5% and 52.4% in D4 and D6 treatments, respectively (Figure 6B).
The BS addition significantly enhanced the diesel degradation in unplanted treatments: the degradation rose from 66.5% in D4 to 82.8% in D4BS treatment and from 36.3% in D6 to 45.5% in D6BS treatment (LSD, p < 0.05). However, the impact of BS on phytoremediation efficiency in planted treatments was less pronounced. The results varied, ranging from 92.4% in D6BS treatment with M. albus to 97.2% in D4BS with L. corniculatus. Both treatments with M. sativa and L. corniculatus (D4BS, D6BS) demonstrated a significant stimulating effect of BS. It is noteworthy that the samples planted with M. albus did not exhibit any significant influence (LSD, p > 0.05).
Although the application of BS proved to significantly enhance bioremediation efficiency rates, the effect was contaminant-concentration-dependent; at lower diesel soil concentration (4 g kg−1), the BS amendment had a higher stimulatory effect on diesel removal compared to that detected at 6 g kg−1. On average, in the middle of the experiment (45 days) in the D4BS treatment, the diesel removal rates increased by 16.9% in unplanted and 4.9% in planted units compared to the D4 treatment (Figure 6A). In the D6BS treatment, the diesel removal rates were 9.2% and 5.7% higher in unplanted and planted treatments, respectively, than in the D6 treatment. At the end of the experiment (90 days), in the D4BS treatment, the diesel removal rates increased by 16.3% in unplanted treatments and 4.6% in planted treatments compared to the D4 treatment. In the D6BS treatment, the diesel removal rates were 6.9% and 3.2% higher in unplanted and planted treatments, respectively, than in the D6 treatment.

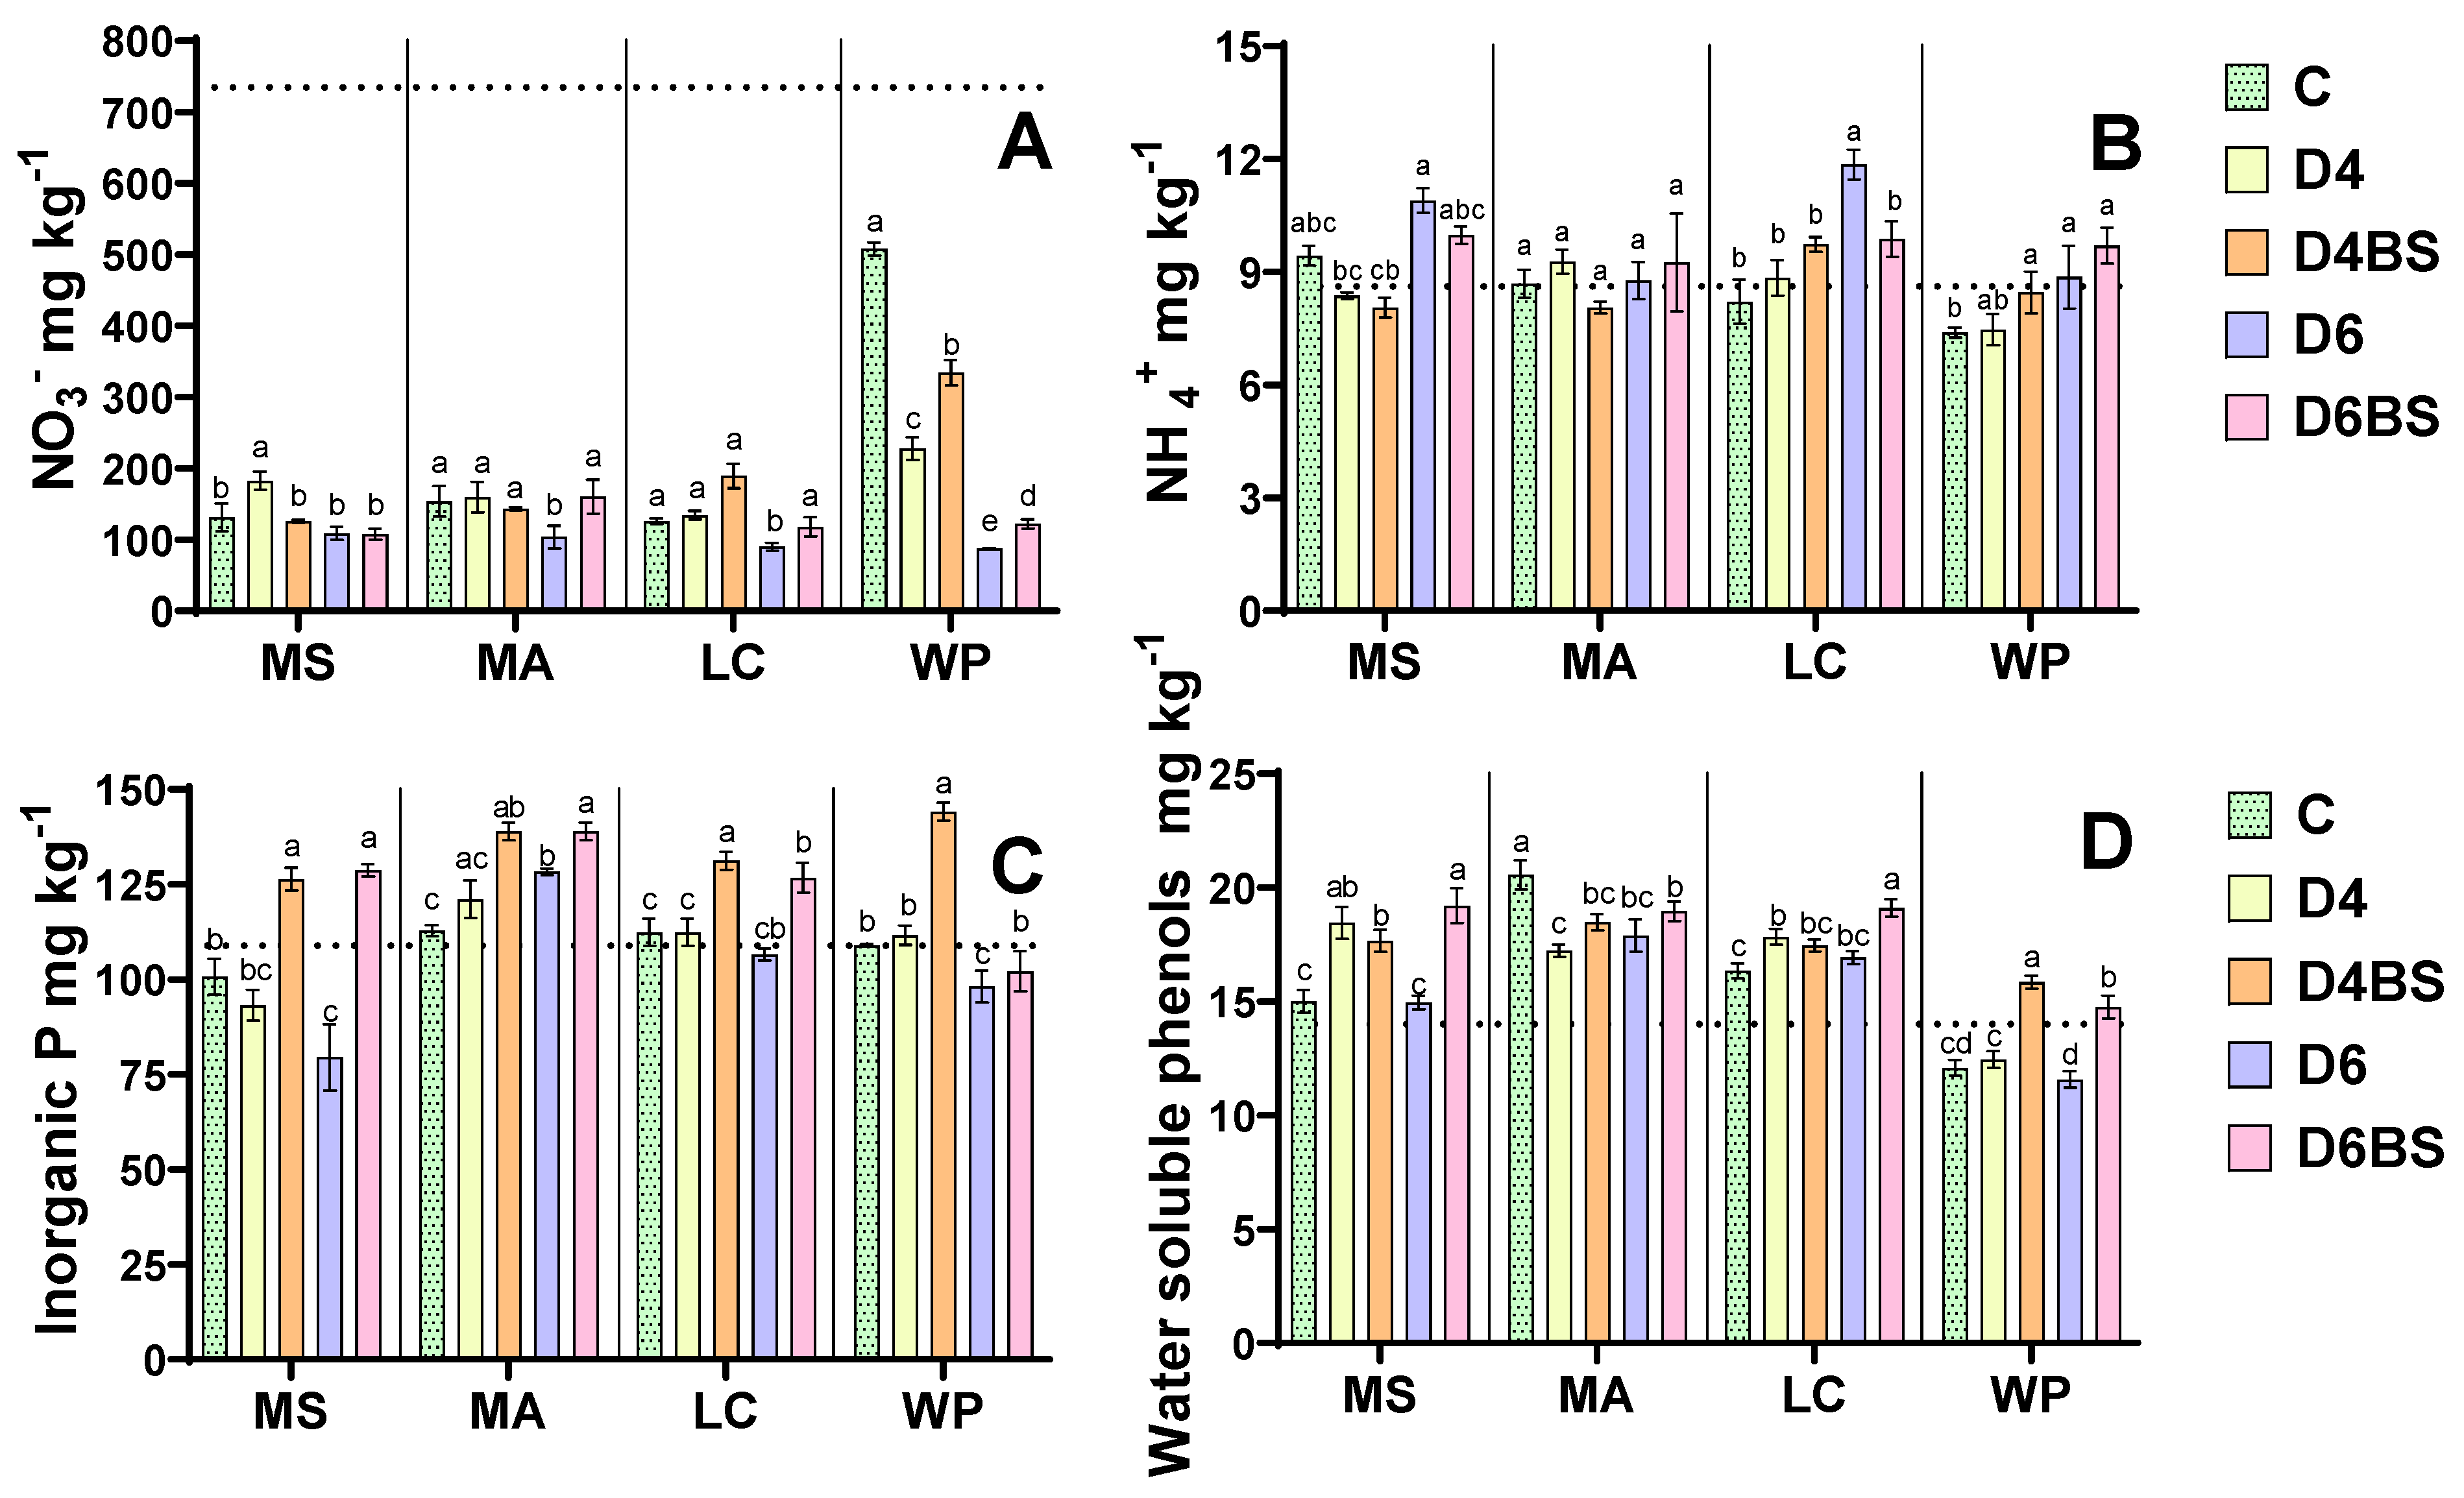
3.4. Soil Nutrients and Soluble Phenols

Nitrate soil concentration significantly decreased during the remediation process of diesel-contaminated unplanted and planted soil compared to the initial concentrations (p < 0.05) (Figure 7A). The highest drop was observed in the soil contaminated with 6 mg kg−1 of diesel in unplanted and planted treatments. There were only negligible differences in nitrates soil concentration among treatments planted with different legume species soil. BS amendment had a positive effect on final nitrates concentration in unplanted treatment and with L. corniculatus planted treatment with a more pronounced effect at lower diesel soil concentrations. BS application had no effect on NO3 concentration in M. sativa treatments, whereas in the soil planted with M. albus, the positive BS effect was detected in the soil with 6 mg kg−1 diesel.
NH4+ concentration in soil ranged from 13.4% below the initial NH4+ concentration up to 37.4% above the initial value (Figure 7B). In most cases, NH4+ concentration in unplanted soil was lower than in the soil where legume plants were grown. In general, the legume plant species had a weak but significant effect on the amount of NH4+ in the soil (ANOVA, F = 3.93, p < 0.05). The most significant increase in NH4+ concentration from the initial values was observed in the D6 treatments planted with L. corniculatus (37.4%) and M. sativa (26.4%). At the same time, the highest reduction in NH4+ amount was recorded in the unplanted and diesel unamended soil (control). BS application led to a higher NH4+ concentration in unplanted soil, though in planted treatment, the effect of BS differed among plant species and diesel concentration. In M. sativa treatment, the BS application lowered NH4+ concentration both at 4 and 6 mg kg−1 diesel levels.
The decisive factor of inorganic P increase in the soil from the initial level was the supplementary addition of biosurfactant (LSD, p < 0.05). A significant increase in inorganic P concentration was observed in all treatments except for the D6BS without plants (Figure 7C). On the other hand, BS application in unplanted soil contaminated with 4 mg kg−1 of diesel resulted in the highest rise in P concentration (32.4%) from the initial value. In the planted treatments, the highest increase in inorganic P was detected in the D6BS treatment with M. albus (27.6%) and M. sativa (18.2%) and in the D4BS treatment with L. corniculatus (20.5%). In the treatments without BS, the inorganic P values remained close to the initial concentration. Only the cultivation of M. albus resulted in an increase in the inorganic P content (LSD, p < 0.05), while the cultivation of L. corniculatus and M. sativa had no significant effect. In contrast, M. sativa did not help to maintain inorganic P levels in the soil, and a clear tendency of decreasing phosphate concentration with increasing diesel concentration in the soil was observed.
All treatments involving legume plants showed a statistically significant increase in water-soluble phenol concentration compared to the initial level (p < 0.05) (Figure 7D). M. sativa and L. corniculatus cultivation generated more water-soluble phenols in all treatments except the control, while in the treatments with M. albus, the highest increase in water-soluble phenols was detected in the control (46.7%). Across all treatments, including the control, the concentration of water-soluble phenols in unplanted treatments decreased from the initial value and was lower than in planted treatments. The addition of biosurfactants in the unplanted D4BS and D6BS treatments resulted in a significant increase in phenol levels compared to the initial concentration and other applications (LSD, p < 0.05). The effect of BS application differed between plant species. The cultivation of L. corniculatus and M. sativa in the soil contaminated with 4 mg kg−1 led to a slight decrease (LSD, p > 0.05) in water-soluble phenols, whereas at 6 mg kg−1 of diesel, an increase in water-soluble phenols was found. A statistically insignificant increase (LSD, p > 0.05) in water-soluble phenol concentration was found in the treatments planted with M. albus regardless of diesel concentration in the soil.

4. Discussion

Legumes could be an excellent option for the phytoremediation of petroleum hydrocarbon-contaminated soil due to their unique properties [16,50,51]. However, the plant’s resistance to contamination is the key determinant of its suitability for phytoremediation. Even low concentrations of diesel can harm plants and soil microorganisms. This is not solely due to the direct toxicity of diesel but also due to the toxic byproducts produced during the microbial breakdown of intermediate hydrocarbons [52,53,54]. When found in soil, diesel can impede the proper functioning of plant cells, resulting in inhibited growth, discolouration, and even death [55]. Consequently, plants cultivated in diesel-polluted soil display noticeable differences compared to those grown in uncontaminated soil. The lethal concentration varies among plant species and depends on various factors such as the type of hydrocarbon, duration of exposure, and specific characteristics of the plant species [56,57].
In this study, two legumes (M. sativa and L. corniculatus) tolerated soil contamination with diesel reasonably well despite its high toxicity. The TI (Tolerance index) of M.sativa varied from 0.78 in D4 to 0.65 in D6 treatments, and the TI of L. corniculatus was 0.64 and 0.52, respectively. M. abus was more sensitive to diesel with TI 0.48 and 0.35 in D4 and D6 treatments, respectively. Plant tolerance to diesel soil contamination corresponded well with plant growth rate. Diesel had only a negligible (3.1%) inhibiting effect on the growth rate of M. sativa, while M. albus in diesel-contaminated soil grew up to 39.9% slower than those in control soil. High L. corniculatus and M. lupulina tolerance to diesel were also confirmed by Pawluśkiewicz et al. (2020) [58], though T. repens showed higher sensitivity. Good M. sativa tolerance to diesel was found in the study by Hawrot-Paw et al. (2015) [59], where 19 plant species’ responses to diesel were analysed.
As plant tolerance to the contaminant is crucial for the success of soil remediation [60], the data on plant growth corresponded well with the diesel removal rate. The effectiveness of diesel removal in planted treatments varied slightly, with the highest efficiency of 93% observed in L. corniculatus and the lowest efficiency of 87.9% observed in the D4 treatment with the most sensitive plant M. albus. In the D6 treatment, the removal efficiency of diesel was slightly lower for M. sativa and L. corniculatus, reaching 88.1% and 90.3%, respectively. Only M. albus achieved slightly higher efficiency in the D6 treatment than D4 and reached 90.6%. The high bioremediation efficiency of M. sativa and L. corniculatus was also confirmed during a 90-day remediation study by Zuzolo et al. (2021) [10], with both species showing high-efficiency rates of 87–89%. Our results show that the most intense diesel degradation is observed during the first 45 days of the experiment, and later, the degradation rate slows.
The close relationship between diesel removal efficiency and plant shoot biomass (r = 0.68, p < 0.05) implies that ensuring better plant performance is essential for efficient contaminant removal from the soil. Several additives are used to stimulate plant growth performance in contaminated soil and enhance petroleum hydrocarbon bioremediation. Many studies have reported successful implementation of biochar, microbiological inocula, urea, compost, etc. [61,62,63,64,65,66]. Various biosurfactants (BS) have recently received considerable attention as bioremediation-promoting agents [67,68,69]. BS, produced by bacteria, yeast, and fungi, are amphiphilic biomolecules that reduce surface tension at air/water and interfacial tension at oil/water interfaces [70,71]. The positive effect of BS HydroBreak PLUS was also confirmed during this study. This amendment not only increased legume plant tolerance to diesel (Table 1) but also contributed to better removal efficiency of diesel (Figure 6) and soil nutrient recovery (Figure 7). However, BS efficiency in diesel removal is dose-dependent and decreases with the dose (Figure 6), suggesting that the highest efficiency of its amendment could be achieved at low soil contamination. According to similar studies, the effect of BS amendment depends on many factors, including applied plant species, type of petroleum hydrocarbons, and selected BS [72,73,74,75].
The effect of BS could be explained in two ways: petroleum hydrocarbons are not easily soluble in water and often become trapped in the soil, hindering microorganisms’ ability to break them down [76]. Firstly, BS molecules can dissolve contaminants, making them more accessible to microorganisms and increasing their bioavailability. Secondly, BS can alter microorganisms’ hydrophobicity, allowing them to adhere to the contaminants directly [70,77]. This helps to promote better contact between the microbes and pollutants, resulting in increased metabolic activity and improved contaminant degradation [78].
The functional state of the photosynthetic apparatus is an important physiological indicator for studying plants’ susceptibility to environmental abiotic stress. ChlF measurements are a quick, non-invasive, and informative method for investigating the structure and function of the photosynthetic apparatus [37] and the JIP test has gained prominence for large-scale stress screening [38]. The JIP test was proven to be an effective tool in studying how photosynthetic apparatus adapts to various stressors, such as nutrient deficiency, salinity, drought, heat, and heavy metal stress [48], as well as oil contamination [79].
Although tested leguminous exhibited good tolerance to soil diesel contamination and high removal efficiency, they showed distinct physiological responses, in terms of chlorophyll fluorescence. M. sativa showed ChlF response when the light energy absorption capacity of the remaining active RCs increased in response to the inactivated part of PSII RCs (Figure 4A), which has been observed in studies with different stressors and plant species [80,81,82,83]. The inactivation of RCs is considered a downregulation mechanism in which the excess of absorbed light is transferred away from photosynthetic electron transport by dissipating it as heat to protect stress-suffered leaves from photo-oxidative damage [84]. However, as indicated by decreases in SFIabs, PIabs, PItotal, DFabs, and DFtotal (Figure 4A), due to this self-protection mechanism, i.e., dissipating excess energy, the excitation energy transferred to the remaining active PSII RCs was inefficiently utilised in photochemical reactions. This was reflected in the significant reduction in shoot biomass (Figure 4A), which was coherent to ChlF parameters under D6 treatment. The lower light use efficiency with higher heat dissipation, resulting in a lower photosynthetic rate and shoot biomass production, was also found in response to the cadmium treatment of Brassica napus in the study of Dikšaitytė et al. (2024) [80] and in the study of Song et al. (2016) [85], who examined the photosynthetic responses of S. baicalensis to future climate change. A reduction in M. sativa photosynthetic performance was also recorded by Agnello et al. (2016) [86] in heavy metal and petroleum hydrocarbon co-contaminated soil. In addition, the transformation of some active PSII RCs into silence in M. sativa and L. corniculatus leaves (Figure 4A,C) could have occurred not only due to their structural changes to ‘heat sinks’ but also due to the inactivation of oxygen-evolving complex (OEC), additionally limiting electron supply to the linear ET chain from the PSII donor side [46,47,84,87]. This was indicated by increases in TRo/RC and Vk/Vj (Figure 4A,C) and a decrease in Fv/Fo (Figure 4A). In addition, considering that TRo/RC followed the ABS/RC, while φPo was not affected, the increases in ABS/RC and Vk/Vj in both M. sativa and L. corniculatus leaves could also mean that the functional antenna, i.e., the antenna that supplies excitation energy to active RCs, increased in size [47,88]. According to Kotakis et al. (2014) [47], it is possible that PSII RCs were degraded earlier than their light-harvesting complex II (LHCII), and the RCs-free LHCII provided excitation energy to the remaining centres.
Partially unlike M. sativa, a similar ChlF response to that of L. corniculatus (Figure 4C) was observed in the study of Kotakis et al. (2014) [47] for E. dendroides during leaf senescence despite decreased chlorophyll concentration. According to Kotakis et al. (2014) [47], given that the electron sink capacities of both CO2 assimilation and photorespiration cycles in senescing leaves have been severely reduced due to extensive Rubisco degradation [89], the evident facilitation of ET from intermediate electron carriers to final acceptors of PSI appears ineffective. Therefore, the authors argued that alternative ET pathways might be activated, as the cyclic electron flow (CEF) through PSI increased significantly in E. dendroides. We did not measure CEF, but we believe it was also possible in diesel-treated L. corniculatus leaves. CEF around the PSI reduces plastoquinone at the expense of stromal electron donors, primarily NADPH and ferredoxin (Fd). The overexpression of Fd stimulates plastoquinone (PQ) reduction, CEF, and non-photochemical energy quenching (NPQ), as well as a small increase in oxidative stress tolerance, but it has little effect on CO2 fixation [90]. In this way, CEF may aid in stress adaptation by adjusting the ATP/NADPH ratio [91,92], developing NPQ [90], and protecting against photo-oxidative stress [93] when absorbed photon energy exceeds CO2 assimilation needs. It has been demonstrated that the cyclic pathway is activated during heat, drought, and high-light and low-temperature stresses [91,94]. Therefore, the higher demand for ATP under diesel stress conditions in L. corniculatus leaves to maintain homeostasis could have been fulfilled by CEF around the PSI favoring NPQ, which could have helped dissipate excess energy to maintain active CO2 fixation. The shift in equilibrium between linear ET and CEF is considered to serve as an important mechanism for plant adaptation to changing environmental conditions [95], and regulating CEF helps photosynthesis tolerate stress [96]. The enhanced PSI functioning (PItotal) in D-treated M. albus leaves (Figure 4B) might also be the result of CEF activation as the adaptation to induced stress. However, other alternative electron transfer pathways, which contribute to PSI or PSII photoinhibition prevention, could also be possible [91] and need future research. As a result of the above-mentioned possible adaptation mechanism to diesel-induced stress conditions, unlike for M. sativa, the PItotal and DFtotal were inversely related to shoot biomass in both L. corniculatus and M. albus at both D4 and D6 treatments, though the correlation was statistically significant only in the case of M. albus at D6 treatment (r = −0.91, p < 0.05). Taking all these into account, the discrepancy between the total performance index of photosynthetic apparatus and plant biomass in the cases of L. corniculatus and M. albus could indicate that the produced energy was used to resist contaminant-induced stress rather than to accumulate biomass. Therefore, while ChlF changes were good enough to explain M. sativa biomass accumulation under D and D+BS treatments, they were not sufficient to clarify the growth and remediation efficiency of L. corniculatus, let alone M. albus. Different ChlF and plant biomass responses to diesel contamination were also observed in other studies. However, diesel inhibited biomass acquisition had no impact on the efficiency of photosystem II of T. repens, L. perenne [60], and B. napus [97].
BS can improve soil quality and act as plant growth promoter by reducing tension, improving plant–microbe interactions, enhancing nutrient exchange, degrading hydrocarbons, eliminating pathogens, and boosting plant immunity [72]. According to the gained result, there was a positive correlation between the biomass production of plants and the removal rate of diesel in the presence of biosurfactant (r = 0.74, p < 0.05). The amendment’s inclusion had a notable impact on the biomass increase in M. Sativa and L. corniculatus, as well as the elimination rate of the pollutant. Moreover, in the case of soil contamination with lower (4 mg kg−1) diesel concentration, M. sativa biomass (aboveground and belowground) production and growth rate and L. corniculatus belowground biomass were higher than those in the control soil, implying hormetic response. The hormetic response of M. sativa biomass production in diesel-contaminated soil was also shown by Eze et al. (2021) [98]. Surfactant addition facilitated M. sativa growth in PAH-contaminated soil through enhanced nutrient uptake [99]. However, BS addition did not ameliorate M. albus aboveground biomass production in diesel-contaminated soil and exacerbated (by 16.58%) root growth at 6 mg kg−1, resulting in a negligible effect on diesel removal efficiency (Figure 6). These controversial results confirm that the effect of biosurfactants on phytoremediation is species-specific and depends on the unique properties of species [100].
Generally, soil contamination negatively affects soil physical structure, lowers nutrient content, leads to unfavourable conditions for plant growth, and negatively affects the fitness of soil-dwelling animals. Therefore, contaminated soil restoration through contaminant removal and soil quality improvement is of high importance in the management of contaminated areas. After decontamination, it should be possible to use the soil again without violating the principles of circular economy and sustainable development. Ideally, biological soil treatment should clean up the soil and restore its physical and chemical properties [101,102]. Legumes have an advantage over non-nitrogen-fixing plants because they can fix nitrogen. This means they do not have to compete with microorganisms and other plants for the limited soil nitrogen reserves in oil-contaminated areas [50]. Moreover, legumes stimulate petroleum-degrading microorganisms in the rhizosphere by providing the necessary nutrients and root exudates into the rhizosphere. This ability makes legumes ideal for planting in areas contaminated by petroleum hydrocarbons [103]. It was observed that the most significant reduction in the main soil nutrients during soil phytoremediation was in the amount of nitrates. This is not surprising since nitrates are used both during plant growth and during the decomposition of petroleum hydrocarbons by microorganisms. This is visible when compared to the non-planted treatments, where the concentration of nitrates decreased to a lesser extent. The most significant reduction was observed in the D6 treatment in all planted and unplanted treatments, ranging from 85.9% with M. sativa to 87.7% with L. corniculatus. The positive impact of BS increasing nitrate concentration was evident in all instances of D4BS and D6BS application.
Soil NH4+ concentrations were similar to the initial levels in most treatments but tended to be higher with increased diesel concentration and using a BS. The direct impact of biosurfactants on nitrogen fixation is not explicitly shown in the literature; it is plausible that they could potentially influence this process. For instance, biosurfactants could enhance the mobility and bioavailability of nitrogen in the soil, thereby promoting the activity of nitrogen-fixing bacteria. The use of biosurfactants can have an impact on the levels of nitrate. They can enhance microbial processes responsible for nitrate loss and nitrous oxide production. By employing biosurfactants, these processes can be executed more effectively [104]. Moreover, some evidence suggests that certain nitrogen-fixing bacteria also produce BS [105]. Regarding the ensurance of sustainability, the use of legumes for phytoremediation contributes to soil health and fertility restoration. Following plant senescence, legumes may help to restore nitrogen balance via the incorporation of plant residues into the soil [106]. Restoration of soil health is crucial in implementing the EU Soil Strategy for 2030.
The addition of BS was the primary factor responsible for increased soil inorganic P concentration in planted and unplanted soil. A statistically significant increase in inorganic P concentration was captured in all treatments containing BS, except in unplanted soil under D6BS treatment [107]. Karamchandani et al. (2022) [108] also found that BS has a positive effect on plant growth by solubilising inorganic phosphates in the soil and making them bioavailable. The concentration of phosphorus and nitrogen compounds in the soil after BS treatment may have increased due to the presence of biodegradable surfactants, plant extracts, and organic acids in the HydroBreak PLUS product.
Plant roots can release soluble phenols. Phenols are essential compounds produced by plant species as a peripheral stimulus or defensive mechanism to regulate different environmental biotic stresses [109]. For instance, a wide range of microorganisms, including plant growth-promoting microbes and petroleum hydrocarbons oxidising microorganisms situated at the rhizosphere, can break down these phenolics, use them as a food source, and enrich soil fertility [110]. In this case, legume plants significantly increased water-soluble phenols in the soil compared to the initial concentration, contributing to better diesel degradation and soil health restoration. M. sativa and L. corniculatus generated more phenols in all treatments except the control, while M. albus showed the opposite trend. In the unplanted treatments, a decrease in water-soluble phenols compared to baseline was observed in treatments without plants (Figure 7D). However, adding BS resulted in a significant increase in phenolics, possibly due to the composition of BS HydroBreak Plus, which contains water-soluble phenols.

5. Conclusions

All three legume species, M. sativa, M. albus, and L. corniculatus, survived in diesel-contaminated soil, but tolerance to diesel varied among species and was concentration-dependent. The legumes effectively removed diesel from the soil, and a strong positive correlation was observed between diesel removal efficiency and plant shoot biomass. However, only for M. sativa, the phytoremediation efficiency could be explained by the changes in photosystem II performance. L. corniculatus showed the highest diesel removal rate, while M. albus had the lowest. It was found that adding biosurfactants to the soil increased the legumes’ tolerance to diesel and also enhanced the contaminant removal efficiency. The effectiveness of the biosurfactant in diesel removal was found to be dose-dependent, which decreased when the diesel dosage was too high. This suggests that the best results in practice using this amendment could be achieved at low levels of soil contamination. The supplementary biosurfactant addition also improved soil nutrient recovery and significantly increased soil inorganic P and water-soluble phenols concentration. According to the study, the biosurfactant can potentially improve the phytoremediation process in soil contaminated with petroleum hydrocarbons.

Author Contributions

Conceptualisation, R.M. and J.Ž.; methodology, R.M.; software, J.Ž.; validation, R.M. and J.Ž.; formal analysis, R.M.; investigation, R.M., A.D. and I.V.; resources, N.P.; data curation, R.M., A.D. and I.V.; writing—original draft preparation, R.M. and A.D.; writing—review and editing, J.Ž.; visualisation, R.M.; supervision, J.Ž.; project administration, N.P.; funding acquisition, N.P. All authors have read and agreed to the published version of the manuscript.

Funding

This research received no external funding.

Data Availability Statement

Dataset available on request from the authors.

Acknowledgments

The authors would like to thank the company GVT LT for its invaluable technical assistance and generous donation of materials and equipment used for this study.

Conflicts of Interest

The authors declare no conflicts of interest.

Appendix A

Table A1. The abbreviations, formulas, and definitions of selected JIP-test parameters derived from data extracted from the fast fluorescence transient O-J-I-P, where O represents the origin (Fo, minimum fluorescence), J and I represent two intermediate levels at 2 ms and 30 ms (FJ and FI), respectively, and P represent peak (FP or Fm) when the fluorescence is maximal. PSI stands for photosystem I, PSII for photosystem II, RC for active PSII reaction centres, CS for the cross-section of PSII (i.e., the surface of the excited photosynthetic sample, which includes the photosynthetic response of both active and inactive RCs), QA for PSII’s first plastoquinone electron acceptor, PQ for plastoquinone, and OEC for oxygen-evolving complex [36,37,38,39,40,41,42,43,44,45,46,47,48] *.
ParametersDefinitionsReferences *
Extracted and technical fluorescence parameters
FoMinimum fluorescence intensity at 50 μs, when all PSII RCs are assumed to be open[40,41,42]
Fm = FPMaximum fluorescence intensity recorded under saturating illumination at the peak P of OJIP, when all PSII RCs are closed[40,41,42,43]
Fv = Fm − FoMaximum variable fluorescence[40,41,42,43,44]
Fv/Fo = kp/kN = (Fm − Fo)/FoThe maximum ratio of quantum yields of photochemical and non-photochemical energy quenching in PSII RC that is related to the maximal efficiency of OEC on the donor side of PSII (the most sensitive link in the photosynthetic chain of electron transport)[40,42,45]
Vk = (F300μs − Fo)/(Fm − Fo)Relative variable fluorescence at 300 μs (K-band)[46,47,48,49]
Vj = (F2ms − Fo)/(Fm − Fo)Relative variable fluorescence at 2 ms[46,47,48,49]
Vk/VjEfficiency of electron flow from OEC to PSII RCs, a relative measure of inactivation of OEC[46,47,48,49]
dVG/dtoExpression of excitation energy transfer between RCs[40,42]
(dV/dt)o = Mo ≈ 4(F0.3ms − F0.05ms)/FvInitial slope (in ms−1) of the O-J fluorescence rise, which corresponds to the maximal rate of the accumulation of the fraction of closed RCs (expresses the rate of the RCs’ closure)[37,40,42,44,45]
tFmTime to reach Fm, in ms[37,38,40,41,43]
NThe turnover number that indicates how many times QA has been reduced in the time span from 0 to tFm (number of QA redox turnovers until Fm is reached)[37,40,41]
AreaThe total complementary area above the OJIP curve between Fo and Fm and the Fm[37,38,40,41,42,43,45]
Sm = Area/FvNormalised area expresses the energy needed to close all RCs during the multiple turnover in the QA reduction (closure of RCs) and is proportional to the pool size of the electron acceptors on the reducing side of PSII and therefore related to the number of electron carriers per electron transport chain[37,38,40,41,42,43,44]
Quantum yields and efficiencies/probabilities
φPo = Fv/Fm = TRo/ABS = 1 − Fo/FmMaximum quantum yield of primary photochemistry reactions in PSII RC[37,38,40,41,42,43,44,45]
ψEo = ETo/TRo = 1 − VJEfficiency/probability that PSII trapped electron moves future than QA (i.e., is transferred from QA to PQ)[37,38,41,42,43,44,45]
φEo = ETo/ABS = φPo × ψEoQuantum yield of electron transport (ET) from QA to PQ[37,38,41,42,43,44,45]
δRo = REo/ETo = (1 − VI)/ψEoEfficiency/probability with which an electron from the intersystem electron carriers is transferred to reduce end electron acceptors at the PSI acceptor side[38,42,43,44,45]
φRo = REo/ABS = φPo × (1 − VI)Quantum yield for reduction of end electron acceptors at the PSI acceptor side[38,42,43,44]
Specific energy fluxes per active (QA reducing) PSII reaction centre (RC)
ABS/RC =(Mo/VJ)/φPoAbsorption flux of antenna Chls per active PSII RC (also a measure of PSII apparent antenna size)[37,38,40,41,42,43,44,45]
TRo/RC =Mo/VJMaximum trapped energy flux leading to QA reduction per active PSII RC[37,38,41,42,43,44,45]
DIo/RC =ABS/RC − TRo/RCDissipated energy flux per active PSII RC in processes other than trapping[37,40,42,44,45]
ETo/RC = (Mo/VJ) × ψEoElectron transport flux further than QA (i.e., from QA to PQ) per active PSII RC[37,38,40,41,42,43,44,45]
REo/RC = (Mo/VJ) × (1 − VI)Electron flux leading to the reduction in the PSI end acceptor per active PSII RC[38,42,43,44]
RC/ABS = φPo × (VJ/Mo) = (ABS/RC)−1Density of active RCs on PSII antenna Chl a basis (reciprocal of ABS/RC)[38,41]
Phenomenological energy fluxes per excited cross-section (CSm, subscript m refers to time Fm) of PSII
ABS/CSm ≈ FmAbsorbed photon flux of antenna Chls per excited CSm of PSII[37,41,44]
TRo/CSm = φPo × ABS/CSmMaximum trapped energy flux leading to QA reduction per excited CSm of PSII[37,41,44]
DIo/CSm = ABS/CSm − TRo/CSmDissipated energy flux per excited CSm of PSII in processes other than trapping[37,41]
ETo/CSm = φEo × ABS/CSmElectron transport flux further than QA (i.e., from QA to PQ) per excited CSm of PSII[37,41,44]
REo/CSm = φRo × ABS/CSmElectron transport flux leading to the reduction in the PSI end acceptor per excited CSm of PSII[44]
RC/CSm = φPo × (VJ/Mo) × FmDensity of active RCs per excited CSm of PSII[37,41,45]
Performance indexes on absorption basis (combination of parameters expressing partial potentials at steps of energy bifurcations of PSII and of specific electron transport reactions)
PIabs = (RC/ABS) × [φPo/(1 − φPo)] × [ψEo/(1 − ψEo)]Performance index (potential) for energy conservation from photons absorbed by PSII antenna to the reduction in intersystem electron acceptors[37,38,40,41,42,43,44,45,46]
PItotal = PIabs × [δRo/(1 − δRo)]Performance index for energy conservation from photons absorbed by PSII antenna to the reduction in PSI end acceptors[38,40,42,43,44]
SFIabs = RC/ABS × φPo × ψEoStructure–function index, which reflects changes that “favor” photosynthesis[44]
Driving forces on an absorption basis
DFabs = log(PIabs)The driving force for the photochemical activity of the processes evaluated by the PIabs[37,40,44]
DFtotal = log(PItotal)The total driving force for the photochemical activity of the processes evaluated by the PItotal[37,44]

References

  1. Eneh, O.C. A review on petroleum: Source, uses, processing, products and the environment. J. Appl. Sci. 2011, 11, 2084–2091. [Google Scholar] [CrossRef]
  2. Kuppusamy, S.; Maddela, N.R.; Megharaj, M.; Venkateswarlu, K. An overview of total petroleum hydrocarbons. In Total Petroleum Hydrocarbons: Environmental Fate, Toxicity, and Remediation; Springer: Cham, Switzerland, 2020; pp. 1–27. [Google Scholar] [CrossRef]
  3. Daâssi, D.; Qabil Almaghribi, F. Petroleum-contaminated soil: Environmental occurrence and remediation strategies. 3 Biotech 2022, 12, 139. [Google Scholar] [CrossRef]
  4. Kuppusamy, S.; Maddela, N.R.; Megharaj, M.; Venkateswarlu, K. Impact of Total Petroleum Hydrocarbons on Human Health. In Total Petroleum Hydrocarbons: Environmental Fate, Toxicity, and Remediation; Springer: Cham, Switzerland, 2022; pp. 139–165. [Google Scholar] [CrossRef]
  5. Marinescu, M.; Toti, M.; Tanase, V.; Carabulea, V.; Plopeanu, G.; Calciu, I. An assessment of the effects of crude oil pollution on soil properties. Ann. Food Sci. Technol. 2010, 11, 94–99. [Google Scholar] [CrossRef]
  6. Adipah, S. Introduction of petroleum hydrocarbons contaminants and its human effects. J. Environ. Sci. Public Health 2019, 3, 1–9. [Google Scholar] [CrossRef]
  7. Panagos, P.; Van Liedekerke, M.; Yigini, Y.; Montanarella, L. Contaminated sites in Europe: Review of the current situation based on data collected through a European network. J. Environ. Sci. Public Health 2013, 2013, 158764. [Google Scholar] [CrossRef] [PubMed]
  8. EPA. Available online: https://www.epa.gov/environmental-topics/land-waste-and-cleanup-topics (accessed on 11 January 2024).
  9. Zahed, M.A.; Matinvafa, M.A.; Azari, A.; Mohajeri, L. Biosurfactant, a green and effective solution for bioremediation of petroleum hydrocarbons in the aquatic environment. Discov. Water 2022, 2, 5. [Google Scholar] [CrossRef]
  10. Zuzolo, D.; Guarino, C.; Tartaglia, M.; Sciarrillo, R. Plant-Soil-Microbiota Combination for the Removal of Total Petroleum Hydrocarbons (TPH): An In-Field Experiment. Front. Microbiol. 2021, 11, 621581. [Google Scholar] [CrossRef] [PubMed]
  11. Ite, A.E.; Harry, T.A.; Obadimu, C.O.; Asuaiko, E.R.; Inim, I.J. Petroleum hydrocarbons contamination of surface water and groundwater in the Niger Delta region of Nigeria. J. Environ. Pollut. Hum. Health 2018, 6, 51–61. [Google Scholar] [CrossRef]
  12. Dos Santos, E.V.; Bezerra Rocha, J.H.; de Araújo, D.M.; de Moura, D.C.; Martínez-Huitle, C.A. Decontamination of produced water containing petroleum hydrocarbons by electrochemical methods: A minireview. Environ. Sci. Pollut. Res. 2014, 21, 8432–8441. [Google Scholar] [CrossRef] [PubMed]
  13. Shahsavari, E.; Poi, G.; Aburto-Medina, A.; Haleyur, N.; Ball, A.S. Bioremediation Approaches for Petroleum Hydrocarbon-Contaminated Environments. In Enhancing Cleanup of Environmental Pollutants; Anjum, N., Gill, S., Tuteja, N., Eds.; Springer: Cham, Switzerland, 2017; Volume 1, pp. 21–41. [Google Scholar] [CrossRef]
  14. Latif, A.; Abbas, A.; Iqbal, J.; Azeem, M.; Asghar, W.; Ullah, R.; Chen, Z. Remediation of Environmental Contaminants Through Phytotechnology. Water Air Soil Pollut. 2023, 234, 139. [Google Scholar] [CrossRef]
  15. Pardo, T.; Bernal, M.P.; Clemente, R. Efficiency of soil organic and inorganic amendments on the remediation of a contaminated mine soil: I. Effects on trace elements and nutrients solubility and leaching risk. Chemosphere 2014, 107, 121–128. [Google Scholar] [CrossRef]
  16. Collins, C.D. Implementing Phytoremediation of Petroleum Hydrocarbons. In Phytoremediation; Willey, N., Ed.; Methods in Biotechnology; Humana Press: Totowa, NJ, USA, 2007; Volume 23. [Google Scholar] [CrossRef]
  17. Bhuyan, B.; Kotoky, R.; Pandey, P. Impacts of rhizoremediation and biostimulation on soil microbial community, for enhanced degradation of petroleum hydrocarbons in crude oil-contaminated agricultural soils. Environ. Sci. Pollut. Res. Int. 2023, 30, 94649–94668. [Google Scholar] [CrossRef]
  18. Santos, D.K.F.; Rufino, R.D.; Luna, J.M.; Santos, V.A.; Salgueiro, A.A.; Sarubbo, L.A. Synthesis and evaluation of biosurfactant produced by Candida lipolytica using animal fat and corn steep liquor. J. Pet. Sci. Eng. 2013, 105, 43–50. [Google Scholar] [CrossRef]
  19. Franzetti, A.; Gandolfi, I.; Raimondi, C.; Bestetti, G.; Banat, I.M.; Smyth, T.J.; Papacchini, M.; Cavallo, M.; Fracchia, L. Environmental fate, toxicity, characteristics and potential applications of novel bioemulsifiers produced by Variovorax paradoxus 7bCT5. Bioresour. Technol. 2012, 108, 245–251. [Google Scholar] [CrossRef]
  20. Kapadia, S.G.; Yagnik, B.N. Current trend and potential for microbial biosurfactants. Asian J. Exp. Biol. Sci. 2013, 4, 1–8. [Google Scholar]
  21. Mulligan, C.N. Sustainable Remediation of Contaminated Soil Using Biosurfactants. Front. Bioeng. Biotechnol. 2021, 9, 635196. [Google Scholar] [CrossRef]
  22. Canon, F.; Nidelet, T.; Guédon, E.; Thierry, A.; Gagnaire, V. Understanding the Mechanisms of Positive Microbial Interactions That Benefit Lactic Acid Bacteria Co-cultures. Front. Microbiol. 2020, 11, 2088. [Google Scholar] [CrossRef] [PubMed]
  23. Sharma, J.; Sundar, D.; Srivastava, P. Biosurfactants: Potential Agents for Controlling Cellular Communication, Motility, and Antagonism. Front. Mol. Biosci. 2021, 11, 727070. [Google Scholar] [CrossRef] [PubMed]
  24. Aguirre-Ramírez, M.; Silva-Jiménez, H.; Banat, I.M.; Díaz De Rienzo, M.A. Surfactants: Physicochemical interactions with biological macromolecules. Biotechnol. Lett. 2021, 43, 523–535. [Google Scholar] [CrossRef] [PubMed]
  25. Hajabbasi, M.A. Importance of soil physical characteristics for petroleum hydrocarbons phytoremediation: A review. Afric. J. Environ. Scien. Tech. 2016, 10, 394–405. [Google Scholar] [CrossRef]
  26. Osam, M.U.; Wegwu, M.O.; Ayalogu, E.O. Soil pH, moisture content and some macro non-metallic elements in crude oil contaminated soils remediated by some wild-type legumes. Inter. J. Eng. Sci. Invent. 2013, 2, 54–59. [Google Scholar]
  27. Gilan, R.S.; Parvizi, Y.; Pazira, E.; Rejali, F. Bioremediation of petroleum-contaminated soil in arid region using different arid-tolerant tree, shrub, and grass plant species with bacteria. Int. J. Environ. Sci. Technol. 2022, 19, 11879–11890. [Google Scholar] [CrossRef]
  28. Venugopalan, V.K.; Nath, R.; Sengupta, K.; Nalia, A.; Banerjee, S.; Chandran, M.A.S.; Hossain, A. The response of lentil (Lens culinaris Medik.) to soil moisture and heat stress under different dates of sowing and foliar application of micronutrients. Front. Plant Sci. 2021, 12, 679469. [Google Scholar] [CrossRef] [PubMed]
  29. Zabala, J.M.; Marinoni, L.; Giavedoni, J.A.; Schrauf, G.E. Breeding strategies in Melilotus albus Desr., a salt-tolerant forage legume. Euphytica 2018, 214, 22. [Google Scholar] [CrossRef]
  30. Dhaliwal, S.S.; Sharma, V.; Kaur, J.; Shukla, A.K.; Singh, J.; Singh, P. Cadmium phytoremediation potential of Brassica genotypes grown in Cd spiked Loamy sand soils: Accumulation and tolerance. Chemosphere 2022, 302, 134842. [Google Scholar] [CrossRef]
  31. ISO 16703:2004; ISO 2004 Soil Quality—Determination of Content of in the Range C10—C40 by Gas Chromatography. International Organization for Standardization: Geneva, Switzerland, 2004.
  32. Hood-Nowotny, R.; Umana, N.H.N.; Inselbacher, E.; Oswald-Lachouani, P.; Wanek, W. Alternative Methods for Measuring Inorganic, Organic, and Total Dissolved Nitrogen in Soil. Soil Sci. Soc. Am. J. 2010, 74, 1018–1027. [Google Scholar] [CrossRef]
  33. Kandeler, E.; Gerber, H. Short-term assay of soil urease activity using colorimetric determination of ammonium. Biol. Fertil. Soils 1988, 6, 68–72. [Google Scholar] [CrossRef]
  34. Cheema, S.A.; Khan, M.I.; Tang, X.; Zhang, C.; Shen, C.; Malik, Z.; Chen, Y. Enhancement of phenanthrene and pyrene degradation in rhizosphere of tall fescue (Festuca arundinacea). J. Hazard. Mater. 2009, 166, 1226–1231. [Google Scholar] [CrossRef]
  35. Fernández, J.A.; Niell, F.X.; Lucena, J. A rapid and sensitive automated determination of phosphate in natural waters 1. Limnol. Oceanogr. 1985, 30, 227–230. [Google Scholar] [CrossRef]
  36. Mehta, P.; Jajoo, A.; Mathur, S.; Bharti, S. Chlorophyll a fluorescence study revealing effects of high salt stress on Photosystem II in wheat leaves. Plant Physiol. Biochem. 2010, 48, 16–20. [Google Scholar] [CrossRef]
  37. Strasser, R.J.; Srivastava, A.; Tsimilli-Michael, M. The fluorescence transient as a tool to characterize and screen photosynthetic samples. Probing Photosynth. Mech. Regul. Adapt. 2000, 25, 445–483. [Google Scholar]
  38. Strasser, R.J.; Tsimilli-Michael, M.; Qiang, S.; Goltsev, V. Simultaneous in vivo recording of prompt and delayed fluorescence and 820-nm reflection changes during drying and after rehydration of the resurrection plant Haberlea rhodopensis. Biochim. Biophys. Acta Bioenerg. 2010, 1797, 1313–1326. [Google Scholar] [CrossRef]
  39. Kalaji, H.M.; Jajoo, A.; Oukarroum, A.; Brestic, M.; Zivcak, M.; Samborska, I.A.; Cetner, M.D.; Łukasik, I.; Goltsev, V.; Ladle, R.J. Chlorophyll a fluorescence as a tool to monitor physiological status of plants under abiotic stress conditions. Acta Physiol. Plant. 2016, 38, 102. [Google Scholar] [CrossRef]
  40. Samborska, I.A.; Kalaji, H.M.; Sieczko, L.; Borucki, W.; Mazur, R.; Kouzmanova, M.; Goltsev, V. Can just one-second measurement of chlorophyll a fluorescence be used to predict sulphur deficiency in radish (Raphanus sativus L. sativus) plants? Curr. Plant Biol. 2019, 19, 100096. [Google Scholar] [CrossRef]
  41. Kumar, D.; Singh, H.; Raj, S.; Soni, V. Chlorophyll a fluorescence kinetics of mung bean (Vigna radiata L.) grown under artificial continuous light. Biochem. Biophys. Rep. 2020, 24, 100813. [Google Scholar] [CrossRef]
  42. Esmaeilizadeh, M.; Malekzadeh Shamsabad, M.R.; Roosta, H.R.; Dąbrowski, P.; Rapacz, M.; Zieliński, A.; Kalaji, H.M. Manipulation of light spectrum can improve the performance of photosynthetic apparatus of strawberry plants growing under salt and alkalinity stress. PLoS ONE 2021, 16, e0261585. [Google Scholar] [CrossRef] [PubMed]
  43. Stirbet, A. On the relation between the Kautsky effect (chlorophyll a fluorescence induction) and photosystem II: Basics and applications of the OJIP fluorescence transient. J. Photochem. Photobiol. B Biol. 2011, 104, 236–257. [Google Scholar] [CrossRef] [PubMed]
  44. Stirbet, A.; Lazár, D.; Kromdijk, J.; Govindjee. Chlorophyll a fluorescence induction: Can just a one-second measurement be used to quantify abiotic stress responses? Photosynthetica 2018, 56, 86–104. [Google Scholar] [CrossRef]
  45. Kalaji, H.M.; Rastogi, A.; Živčák, M.; Brestic, M.; Daszkowska-Golec, A.; Sitko, K.; Cetner, M.D. Prompt chlorophyll fluorescence as a tool for crop phenotyping: An example of barley landraces exposed to various abiotic stress factors. Photosynthetica 2018, 56, 953–961. [Google Scholar] [CrossRef]
  46. Kalachanis, D.; Manetas, Y. Analysis of fast chlorophyll fluorescence rise (O-K-J-I-P) curves in green fruits indicates electron flow limitations at the donor side of PSII and the acceptor sides of both photosystems. Physiol. Plant. 2010, 139, 313–323. [Google Scholar] [CrossRef] [PubMed]
  47. Kotakis, C.; Kyzeridou, A.; Manetas, Y. Photosynthetic electron flow during leaf senescence: Evidence for a preferential maintenance of photosystem I activity and increased cyclic electron flow. Photosynthetica 2014, 52, 413–420. [Google Scholar] [CrossRef]
  48. Swoczyna, T.; Łata, B.; Stasiak, A.; Stefaniak, J.; Latocha, P. JIP-test in assessing sensitivity to nitrogen deficiency in two cultivars of Actinidia arguta (Siebold et Zucc.) planch. ex miq. Photosynthetica 2019, 57, 646–658. [Google Scholar] [CrossRef]
  49. Swoczyna, T.; Kalaji, H.M.; Bussotti, F.; Mojski, J.; Pollastrini, M. Environmental stress—What can we learn from chlorophyll a fluorescence analysis in woody plants? A review. Front. Plant Sci. 2022, 13, 1048582. [Google Scholar] [CrossRef] [PubMed]
  50. Riskuwa-Shehu, M.L.; Ijah, U.J.J.; Manga, S.B.; Bilbis, L.S. Evaluation of the use of legumes for biodegradation of petroleum hydrocarbons in soil. Int. J. Environ. Sci. Technol. 2017, 14, 2205–2214. [Google Scholar] [CrossRef]
  51. Hatami, E.; Abbaspour, A.; Dorostkar, V. Phytoremediation of a petroleum-polluted soil by native plant species in Lorestan Province, Iran. Environ. Sci. Pollut. Res. 2019, 26, 24323–24330. [Google Scholar] [CrossRef] [PubMed]
  52. Korneykova, M.V.; Myazin, V.A.; Fokina, N.V.; Chaporgina, A.A. Bioremediation of soil of the kola peninsula (Murmansk region) contaminated with diesel fuel. Geogr. Environ. Sustain. 2021, 14, 171–176. [Google Scholar] [CrossRef]
  53. Hawrot-Paw, M.; Koniuszy, A.; Zając, G.; Szyszlak-Bargłowicz, J. Ecotoxicity of soil contaminated with diesel fuel and biodiesel. Sci. Rep. 2020, 10, 16436. [Google Scholar] [CrossRef] [PubMed]
  54. Burdová, H.; Nebeská, D.; Al Souki, K.S.; Pilnaj, D.; Kwoczynski, Z.; Kříženecká, S.; Trögl, J. Miscanthus × giganteus stress tolerance and phytoremediation capacities in highly diesel contaminated soils. J. Environ. Manag. 2023, 344, 118475. [Google Scholar] [CrossRef]
  55. Adam, G.; Duncan, H. Effect of Diesel Fuel on Growth of Selected Plant Species. Environ. Geochem. Health 1999, 21, 353–357. [Google Scholar] [CrossRef]
  56. Adam, G.; Duncan, H. The Effect of Diesel Fuel on Common Vetch (Vicia sativa L.) Plants. Environ. Geochem. Health 2023, 25, 123–130. [Google Scholar] [CrossRef]
  57. Rafique, H.M.; Khan, M.Y.; Asghar, H.N.; Ahmad Zahir, Z.; Nadeem, S.M.; Sohaib, M.; Al-Barakah, F.N. Converging alfalfa (Medicago sativa L.) and petroleum hydrocarbon acclimated ACC-deaminase containing bacteria for phytoremediation of petroleum hydrocarbon contaminated soil. Int. J. Phytoremediation 2023, 25, 717–727. [Google Scholar] [CrossRef]
  58. Pawluśkiewicz, B.; Gnatowski, T.; Janicka, M. The influence of soil contamination with diesel oil on germination dynamics and seedling development of selected species of the Fabaceae family. J. Ecol. Eng. 2020, 21, 210–218. [Google Scholar] [CrossRef]
  59. Hawrot-Paw, M.; Wijatkowski, A.; Mikiciuk, M. Influence of diesel and biodiesel fuel-contaminated soil on microorganisms, growth and development of plants. Plant Soil Environ. 2015, 61, 189–194. [Google Scholar] [CrossRef]
  60. Barrutia, O.; Garbisu, C.; Epelde, L.; Sampedro, M.C.; Goicolea, M.A.; Becerril, J.M. Plant tolerance to diesel minimizes its impact on soil microbial characteristics during rhizoremediation of diesel-contaminated soils. Sci. Total Environ. 2011, 409, 4087–4093. [Google Scholar] [CrossRef]
  61. Han, T.; Zhao, Z.; Bartlam, M.; Wang, Y. Combination of biochar amendment and phytoremediation for hydrocarbon removal in petroleum-contaminated soil. Environ. Sci. Pollut. Res. 2016, 23, 21219–21228. [Google Scholar] [CrossRef]
  62. Hussain, F.; Hussain, I.; Khan, A.H.A.; Muhammad, Y.S.; Iqbal, M.; Soja, G.; Yousaf, S. Combined application of biochar, compost, and bacterial consortia with Italian ryegrass enhanced phytoremediation of petroleum hydrocarbon contaminated soil. Environ. Exp. Bot. 2018, 153, 80–88. [Google Scholar] [CrossRef]
  63. Dike, C.C.; Hakeem, I.G.; Rani, A.; Surapaneni, A.; Khudur, L.; Shah, K.; Ball, A.S. The co-application of biochar with bioremediation for the removal of petroleum hydrocarbons from contaminated soil. Sci. Total Environ. 2022, 849, 157753. [Google Scholar] [CrossRef] [PubMed]
  64. Liu, Z.; Li, Z.; Chen, S.; Zhou, W. Enhanced phytoremediation of petroleum-contaminated soil by biochar and urea. J. Hazard. Mater. 2023, 453, 131404. [Google Scholar] [CrossRef] [PubMed]
  65. Deebika, P.; Merline Sheela, A.; Ilamathi, R. Biochar and compost-based phytoremediation of crude oil contaminated soil. Indian J. Sci. Technol. 2021, 14, 220–228. [Google Scholar] [CrossRef]
  66. Veerapagu, M.; Jeya, K.R.; Sankaranarayanan, A. Role of plant growth-promoting microorganisms in phytoremediation efficiency. In Plant-Microbe Interaction-Recent Advances in Molecular and Biochemical Approaches; Academic Press: Cambridge, MA, USA, 2023; pp. 45–61. [Google Scholar] [CrossRef]
  67. Ambust, S.; Das, A.J.; Kumar, R. Bioremediation of petroleum contaminated soil through biosurfactant and Pseudomonas sp. SA3 amended design treatments. Curr. Res. Microb. Sci. 2021, 2, 100031. [Google Scholar] [CrossRef] [PubMed]
  68. Islam, N.F.; Patowary, R.; Sarma, H. Biosurfactant-assisted phytoremediation for a sustainable future. In Assisted Phytoremediation; Elsevier: Amsterdam, The Netherlands, 2022; pp. 399–414. [Google Scholar] [CrossRef]
  69. Ambaye, T.G.; Chebbi, A.; Formicola, F.; Rosatelli, A.; Prasad, S.; Gomez, F.H.; Vaccari, M. Ex-situ bioremediation of petroleum hydrocarbon contaminated soil using mixed stimulants: Response and dynamics of bacterial community and phytotoxicity. J. Environ. Chem. Eng. 2022, 10, 108814. [Google Scholar] [CrossRef]
  70. Markande, A.R.; Patel, D.; Varjani, S. A review on biosurfactants: Properties, applications and current developments. Bioresour. Technol. 2021, 330, 124963. [Google Scholar] [CrossRef] [PubMed]
  71. Crouzet, J.; Arguelles-Arias, A.; Dhondt-Cordelier, S.; Cordelier, S.; Pršić, J.; Hoff, G.; Dorey, S. Biosurfactants in plant protection against diseases: Rhamnolipids and lipopeptides case study. Front. Bioeng. Biotechnol. 2020, 8, 1014. [Google Scholar] [CrossRef]
  72. Memarian, R.; Ramamurthy, A.S. Effects of surfactants on rhizodegradation of oil in a contaminated soil. J. Environ. Sci. Health A J. 2012, 47, 1486–1490. [Google Scholar] [CrossRef]
  73. Silva, R.D.C.F.S.; Almeida, D.G.; Rufino, R.D.; Luna, J.M.; Santos, V.A.; Sarubbo, L.A. Applications of Biosurfactants in the Petroleum Industry and the Remediation of Oil Spills. Int. J. Mol. Sci. 2014, 15, 12523–12542. [Google Scholar] [CrossRef]
  74. Ptaszek, N.; Pacwa-Płociniczak, M.; Noszczyńska, M.; Płociniczak, T. Comparative study on multiway enhanced bio-and phytoremediation of aged petroleum-contaminated soil. Agronomy 2020, 10, 947. [Google Scholar] [CrossRef]
  75. Almansoory, A.F.; Hasan, H.A.; Idris, M.; Abdullah, S.R.S.; Anuar, N. Potential application of a biosurfactant in phytoremediation technology for treatment of gasoline-contaminated soil. Ecol. Eng. 2015, 84, 113–120. [Google Scholar] [CrossRef]
  76. Wang, J.; Bao, H.; Pan, G.; Zhang, H.; Li, J.; Li, J.; Wu, F. Combined application of rhamnolipid and agricultural wastes enhances PAHs degradation via increasing their bioavailability and changing microbial community in contaminated soil. J. Environ. Manag. 2021, 294, 112998. [Google Scholar] [CrossRef] [PubMed]
  77. Bao, J.; Lv, Y.; Liu, C.; Li, S.; Yin, Z.; Yu, Y.; Zhu, L. Performance evaluation of rhamnolipids addition for the biodegradation and bioutilization of petroleum pollutants during the composting of organic wastes with waste heavy oil. iScience 2022, 25, 104403. [Google Scholar] [CrossRef]
  78. Sima, N.A.K.; Ebadi, A.; Reiahisamani, N.; Rasekh, B. Bio-based remediation of petroleum-contaminated saline soils: Challenges, the current state-of-the-art and future prospects. J. Environ. Manag. 2019, 250, 109476. [Google Scholar] [CrossRef]
  79. Gao, Q.T.; Tam, N.F.Y. Growth, photosynthesis and antioxidant responses of two microalgal species, Chlorella vulgaris and Selenastrum capricornutum, to nonylphenol stress. Chemosphere 2011, 82, 346–354. [Google Scholar] [CrossRef]
  80. Dikšaitytė, A.; Kniuipytė, I.; Žaltauskaitė, J.; Abdel-Maksoud, M.A.; Asard, H.; AbdElgawad, H. Enhanced Cd phytoextraction by rapeseed under future climate as a consequence of higher sensitivity of HMA genes and better photosynthetic performance. Sci. Total Environ. 2024, 908, 168164. [Google Scholar] [CrossRef]
  81. Fghire, R.; Anaya, F.; Ali, O.I.; Benlhabib, O.; Ragab, R.; Wahbi, S. Physiological and photosynthetic response of quinoa to drought stress. Chilean J. Agricu. Res. 2015, 75, 174–183. [Google Scholar] [CrossRef]
  82. Gupta, R. Tissue specific disruption of photosynthetic electron transport rate in pigeonpea (Cajanus cajan L.) under elevated temperature. Plant Signal. Behav. 2019, 14, 1601952. [Google Scholar] [CrossRef]
  83. Liu, X.; Zhang, H.; Wang, J.; Wu, X.; Ma, S.; Xu, Z.; Zhou, T.; Xu, N.; Tang, X.; An, B. Increased CO2 concentrations increasing water use efficiency and improvement PSII function of mulberry seedling leaves under drought stress. J. Plant Interact. 2019, 14, 213–223. [Google Scholar] [CrossRef]
  84. Kalaji, H.M.; Oukarroum, A.; Alexandrov, V.; Kouzmanova, M.; Brestic, M.; Zivcak, M.; Samborska, I.A.; Cetner, M.D.; Allakhverdiev, S.I.; Goltsev, V. Identification of nutrient deficiency in maize and tomato plants by in vivo chlorophyll a fluorescence measurements. Plant Physiol. Biochem. 2014, 81, 16–25. [Google Scholar] [CrossRef]
  85. Song, X.; Zhou, G.; Xu, Z.; Lv, X.; Wang, Y. A self-photoprotection mechanism helps Stipa baicalensis adapt to future climate change. Sci. Rep. 2016, 6, 25839. [Google Scholar] [CrossRef]
  86. Agnello, A.C.; Bagard, M.; van Hullebusch, E.D.; Esposito, G.; Huguenot, D. Comparative bioremediation of heavy metals and petroleum hydrocarbons co-contaminated soil by natural attenuation, phytoremediation, bioaugmentation and bioaugmentation-assisted phytoremediation. Sci. Total Environ. 2016, 563, 693–703. [Google Scholar] [CrossRef] [PubMed]
  87. Janeeshma, E.; Kalaji, H.M.; Puthur, J.T. Differential responses in the photosynthetic efficiency of Oryza sativa and Zea mays on exposure to Cd and Zn toxicity. Acta Physiol. Plant. 2021, 43, 12. [Google Scholar] [CrossRef]
  88. Yusuf, M.A.; Kumar, D.; Rajwanshi, R.; Strasser, R.J.; Tsimilli-Michael, M.; Sarin, N.B. Overexpression of γ-tocopherol methyl transferase gene in transgenic Brassica juncea plants alleviates abiotic stress: Physiological and chlorophyll a fluorescence measurements. Biochim. Biophys. Acta-Bioenerg. 2010, 1797, 1428–1438. [Google Scholar] [CrossRef] [PubMed]
  89. Hörtensteiner, S.; Feller, U. Nitrogen metabolism and remobilization during senescence. J. Exp. Bot. 2002, 53, 927–937. [Google Scholar] [CrossRef]
  90. Yamamoto, H.; Kato, H.; Shinzaki, Y.; Horiguchi, S.; Shikanai, T.; Hase, T.; Endo, T.; Nishioka, M.; Makino, A.; Tomizawa, K.I.; et al. Ferredoxin limits cyclic electron flow around PSI (CEF-PSI) in higher plants—Stimulation of CEF-PSI enhances non-photochemical quenching of chl fluorescence in transplastomic tobacco. Plant. Cell Physiol. 2006, 47, 1355–1371. [Google Scholar] [CrossRef] [PubMed]
  91. Rumeau, D.; Peltier, G.; Cournac, L. Chlororespiration and cyclic electron flow around PSI during photosynthesis and plant stress response. Plant. Cell Environ. 2007, 30, 1041–1051. [Google Scholar] [CrossRef] [PubMed]
  92. Niyogi, K.K. Safety valves for photosynthesis. Curr. Opin. Plant Biol. 2000, 3, 455–560. [Google Scholar] [CrossRef] [PubMed]
  93. Martín, M.; Casano, L.M.; Zapata, J.M.; Guéra, A.; Del Campo, E.M.; Schmitz-Linneweber, C.; Maier, R.M.; Sabater, B. Role of thylakoid Ndh complex and peroxidase in the protection against photo-oxidative stress: Fluorescence and enzyme activities in wild-type and ndhF-deficient tobacco. Physiol. Plant. 2004, 122, 443–452. [Google Scholar] [CrossRef]
  94. Bukhov, N.; Carpentier, R. Alternative photosystem I-driven electron transport routes: Mechanisms and functions. Photosynth. Res. 2004, 82, 17–33. [Google Scholar] [CrossRef] [PubMed]
  95. Johnson, G.N. Physiology of PSI cyclic electron transport in higher plants. Biochim. Biophys. Acta Bioenerg. 2011, 1807, 906–911. [Google Scholar] [CrossRef] [PubMed]
  96. Brestic, M.; Zivcak, M.; Kalaji, H.M.; Carpentier, R.; Allakhverdiev, S.I. Photosystem II thermostability in situ: Environmentally induced acclimation and genotype-specific reactions in Triticum aestivum L. Plant Physiol. Biochem. 2012, 57, 93–105. [Google Scholar] [CrossRef]
  97. Lacalle, R.G.; Gómez-Sagasti, M.T.; Artetxe, U.; Garbisu, C.; Becerril, J.M. Brassica napus has a key role in the recovery of the health of soils contaminated with metals and diesel by rhizoremediation. Sci. Total Environ. 2018, 618, 347–356. [Google Scholar] [CrossRef]
  98. Eze, M.O.; George, S.C.; Hose, G.C. Dose-response analysis of diesel fuel phytotoxicity on selected plant species. Chemosphere 2021, 263, 128382. [Google Scholar] [CrossRef]
  99. Zhang, J.; Yin, R.; Lin, X.G.; Liu, W.W.; Chen, R.R.; Li, X.Z. Interactive effect of biosurfactant and microorganism to enhance phytoremediation for removal of aged polycyclic aromatic hydrocarbons from contaminated soils. J. Health Sci. 2010, 56, 257–266. [Google Scholar] [CrossRef]
  100. Kumar, S.; Kumar, P.; Dubey, R.C. Biosurfactants: Role in Plant Growth Promotion and Disease Management. In Multifunctional Microbial Biosurfactants; Springer: Cham, Switzerland, 2023; pp. 213–229. [Google Scholar] [CrossRef]
  101. Fiorentino, N.; Mori, M.; Cenvinzo, V.; Duri, L.G.; Gioia, L.; Visconti, D.; Fagnano, M. Assisted phytoremediation for restoring soil fertility in contaminated and degraded land. Ital. J. Agron. 2018, 13 (Suppl. S1), 34–44. [Google Scholar]
  102. Banov, M.; Rousseva, S.; Pavlov, P. Sustainable Management and Restoration of the Fertility of Damaged and Contaminated Lands and Soils. In Soil Health Restoration and Management; Meena, R., Ed.; Springer: Singapore, 2020. [Google Scholar] [CrossRef]
  103. Sun, H.; Jiang, S.; Jiang, C.; Wu, C.; Gao, M.; Wang, Q. A review of root exudates and rhizosphere microbiome for crop production. Environ. Sci. Pollut. Res. 2021, 28, 54497–54510. [Google Scholar] [CrossRef] [PubMed]
  104. Sharma, N.; Lavania, M.; Lal, B. Biosurfactant: A next-generation tool for sustainable remediation of organic pollutants. Front. Microbiol. 2022, 12, 821531. [Google Scholar] [CrossRef]
  105. Mir, M.I.; Quadriya, H.; Kumar, B.K.; Adeeb, S.; Ali, M.; Khan, M.Y.; Hameeda, B. 14 Biosurfactants of Nitrogen Fixers and their Potential Applications. In Microbial Surfactants: Volume 2: Applications in Food and Agriculture; CRC Press: Boca Raton, FL, USA, 2022. [Google Scholar] [CrossRef]
  106. Hall, J.; Soole, K.; Bentham, R. Hydrocarbon phytoremediation in the family Fabacea—A review. Int. J. Phytoremediation. 2011, 13, 317–332. [Google Scholar] [CrossRef]
  107. Raza, A.; Zahra, N.; Hafeez, M.B.; Ahmad, M.; Iqbal, S.; Shaukat, K.; Ahmad, G. Nitrogen Fixation of Legumes: Biology and Physiology. In The Plant Family Fabaceae; Hasanuzzaman, M., Araújo, S., Gill, S., Eds.; Springer: Singapore, 2020; pp. 43–74. [Google Scholar] [CrossRef]
  108. Karamchandani, B.M.; Pawar, A.A.; Pawar, S.S.; Syed, S.; Mone, N.S.; Dalvi, S.G.; Satpute, S.K. Biosurfactants’ multifarious functional potential for sustainable agricultural practices. Front. Bioeng. Biotechnol. 2022, 10, 1047279. [Google Scholar] [CrossRef]
  109. Kumar, S.; Abedin, M.M.; Singh, A.K.; Das, S. Role of Phenolic Compounds in Plant-Defensive Mechanisms. In Plant Phenolics in Sustainable Agriculture; Lone, R., Shuab, R., Kamili, A., Eds.; Springer: Singapore, 2020. [Google Scholar] [CrossRef]
  110. Pratyusha, S. Phenolic compounds in the plant development and defense: An overview. In Plant Stress Physiology-Perspectives in Agriculture; IntechOpen: Rijeka, Croatia, 2020; pp. 125–140. [Google Scholar] [CrossRef]
Figure 1. Dry weight of shoot (A) and root (B) of M. sativa (MS), M. albus (MA), L. corniculatus (LC) grown in control (C), diesel-amended soil (D4, D6), and diesel- and BS-amended soil (D4BS, D6BS) for twelve weeks. Different letters specify a significant difference (p < 0.05) between the treatments (LSD test).
Environments 11 00064 g001
Figure 2. The difference in the degree and size of root development of the L. corniculatus grown in control (C), diesel-amended soil (D4, D6), and diesel- and biosurfactant-amended soil (D4BS, D6BS) for twelve weeks.
Environments 11 00064 g002
Figure 3. Shoot height of plant species (M. Sativa (MS), M. albus (MA), L. corniculatus (LC)) grown in control (C), diesel-amended soil (D4, D6) and diesel and biosurfactant amended soil (D4BS, D6BS) for twelve weeks.
Environments 11 00064 g003
Figure 4. Conversion in the shape of the spider plot JIP-test parameters induced by diesel (D) at 4 and 6 g kg−1 (D4 and D6, shown in orange and red, respectively) and biosurfactant (BS) at 4 and 6 g kg−1 diesel treatments (D4BS and D6BS, shown in light and dark green, respectively) applied to M. sativa (A), M. albus (B), and L. corniculatus (C) relative to their control (C), i.e., D- and BS-untreated plant values expressed as 100% (shown in black). Values are means (n = 3). Asterisks (*), denoted by a different colour, mark significant differences between controls and D4- or D6- and BS-treated plants according to the Fisher LSD test at p ≤ 0.05.
Environments 11 00064 g004
Figure 5. Diesel concentration in diesel-amended soil (D4, D6) and diesel- and biosurfactant-amended soil (D4BS, D6BS) after 45 and 90 days in different soil remediation treatments: planted with M. Sativa (MS) (A), M. albus (MA) (B), L. corniculatus (LC) (C), and without plants (WP) (D).
Environments 11 00064 g005
Figure 6. Diesel removal efficiency (%) after 45 (A) and 90 days (B) from the diesel-amended soil (D4, D6) and diesel- and biosurfactant-amended soil (D4BS, D6BS) planted with M. Sativa (MS), M. albus (MA), L. corniculatus (LC), and unplanted soil (WP) in control (C).
Environments 11 00064 g006
Figure 7. The final concentrations of nitrates (NO3) (A), NH4+ (B), inorganic phosphorus (C), and water-soluble phenols (D) in the soil where three plant species (M. Sativa (MS), M. albus (MA), and L. corniculatus (LC)) grown and without plants (WP) in control (C), diesel-amended soil (D4, D6), and diesel- and biosurfactant-amended soil (D4BS, D6BS) for twelve weeks. The dotted lines show the initial concentration before treatments. Different letters specify a significant difference (p < 0.05) among the treatments (LSD test) for each plant species.
Environments 11 00064 g007
Table 1. Tolerance index (TI) of legume plants (M. sativa (MS), M. albus (MA), and L. corniculatus (LC)) in different soil treatments (D4—4 g kg−1 diesel, D6—6 g kg−1 diesel, D4BS—4 g kg−1 diesel + BS, and D6BS—6 g kg−1 diesel + BS).
Treatment
Plant SpeciesD4D4BSD6D6BS
MS0.782 ± 0.065 b1.008 ± 0.093 a0.654 ± 0.022 b0.776 ± 0.043 b
MA0.487 ± 0.020 a0.603 ± 0.061 a0.354 ± 0.052 a0.493 ± 0.061 a
LC0.644 ± 0.046 b0.867 ± 0.097 a0.521 ± 0.040 b0.771 ± 0.074 a
Different letters specify a significant difference (p < 0.05) between the treatments (LSD test) for each species.
Table 2. The calculated growth rate (cm week−1) of plant species (M. Sativa (MS), M. albus (MA), L. corniculatus (LC)) grown in control (C), diesel-amended soil (D4, D6) and diesel and biosurfactant amended soil (D4BS, D6BS) for twelve weeks.
Treatment
Plant SpeciesCD4D4BSD6D6BS
MS5.260 a5.096 a5.796 a5.119 a5.636 a
MA6.150 a3.757 b4.187 b3.689 b4.414 b
LC4.043 a3.513 b3.886 ab3.721 ab3.931 a
Different letters specify a significant difference (p < 0.05) between the treatments (determined by Z-test) for each species.
Disclaimer/Publisher’s Note: The statements, opinions and data contained in all publications are solely those of the individual author(s) and contributor(s) and not of MDPI and/or the editor(s). MDPI and/or the editor(s) disclaim responsibility for any injury to people or property resulting from any ideas, methods, instructions or products referred to in the content.

