


Impacts on Urban VOCs and PM2.5 during a Wildfire Episode


Air Quality Section, Environmental Health Laboratory, Center for Lab Science, California Department of Public Health, Richmond, CA 94804, USA
*
Author to whom correspondence should be addressed.
Environments 2024, 11(4), 63; https://doi.org/10.3390/environments11040063
Submission received: 30 November 2023
/
Revised: 14 March 2024
/
Accepted: 17 March 2024
/
Published: 24 March 2024
(This article belongs to the Special Issue Air Pollution in Urban and Industrial Areas II)
Abstract
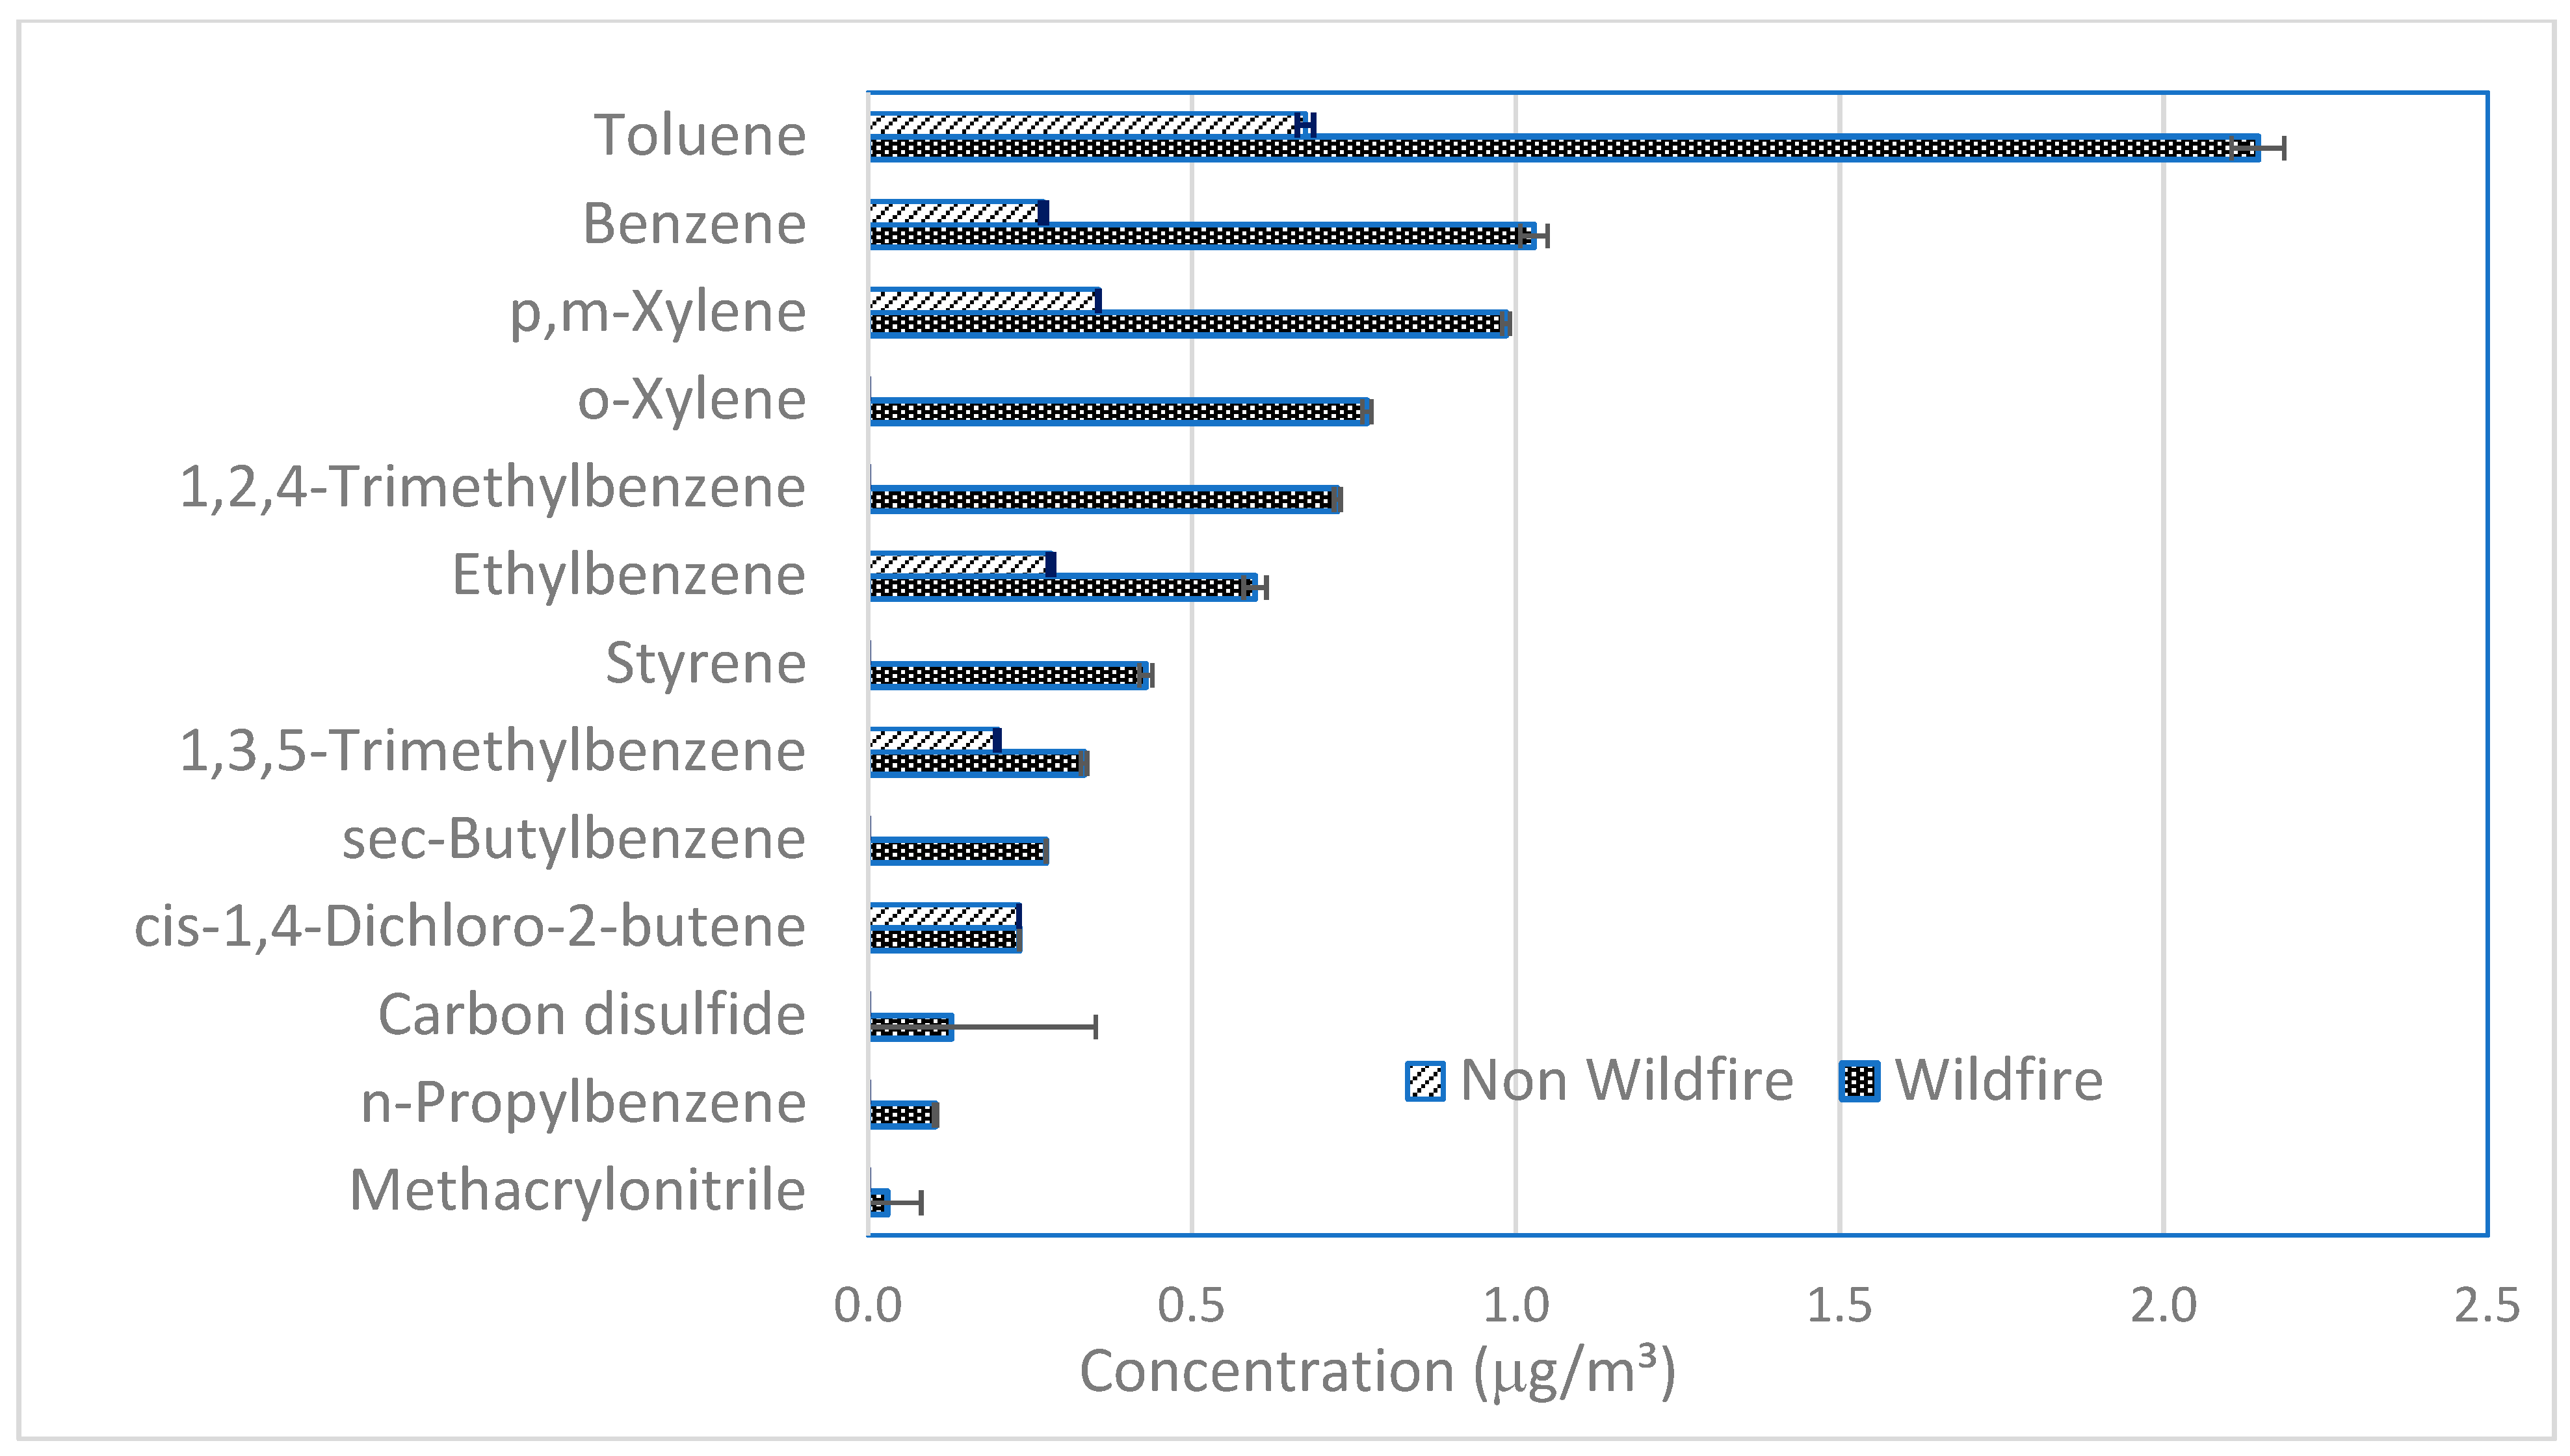
:This study focuses on the impact of wildfire smoke emissions on regional, urban air quality during a wildfire event. We measured volatile organic compounds (VOCs) and fine particulate matter (PM2.5) in the San Francisco Bay Area to assess air quality during a wildfire event and compared them to those in a later non-wildfire period. VOCs were collected using thermal desorption tubes and quantified using thermal desorption-gas chromatography/mass spectrometry (TD-GC/MS). Elevated concentrations of VOCs such as 1,3,5-trimethylbenzene (0.33 ± 0.01 µg/m3), benzene (1.03 ± 0.02 µg/m3), toluene (2.15 ± 0.04 µg/m3), ethylbenzene (0.60 ± 0.02 µg/m3), and m, p-xylene (0.77 ± 0.07 µg/m3) were observed in the wildfire event. Compared with that in the non-wildfire season, the toluene concentration during the wildfire period was more than three times the non-wildfire concentration. Similarly, the benzene concentration during the wildfire was almost four times higher, and that of p, m-xylene was three times higher. The higher wildfire levels were statistically significant for sec-butylbenzene, 1,2,4-trimethylbenzene, n-propylbenzene, o-xylene, styrene, 1,3,5-trimethylbenzene, benzene, toluene, ethylbenzene, and p,m-xylene (p < 0.00001). These higher VOC levels compared with those for the non-fire period may potentially pose a public health concern. Open face passive sampler (OFPS)-collected PM was analyzed using scanning electron microscopy/energy dispersive X-ray spectroscopy (SEM/EDS) and revealed organic carbon tar balls. The highest daily average beta-attenuation-monitored PM2.5 during the fire period was 200 µg/m3 and the highest hourly average was 270 µg/m3. Monitoring gas phase species in addition to PM concentrations is useful during wildfire season to inform public health guidance.
Keywords:
wildfire; climate change; urban air pollution; air quality; VOCs; tar ball; c/o ratio; combustion aerosol; BTEX1. Introduction
Interest in wildfire smoke and its health effects has sharply increased in recent years [1,2]. Estimates have suggested that anthropogenic climate change caused the cumulative geographic land area impacted by forest fires to double between 1970 and 2016 [3]. The state of California has seen impacts of a warmer, drier climate in the form of yearly fire seasons. The worst single incident of the 2018 fire season was the Camp Fire in Butte County, California [4], which burned 620.53 km2 and resulted in 5 firefighters being injured, 89 civilian deaths, 12 civilians being injured, 18,804 structures being destroyed, and 564 structures being damaged [5]. The increased frequency and size of such wildfires represents a notable source of airborne particulate matter (PM) and volatile organic compounds (VOCs) [6,7]. The United States Environmental Protection Agency (US EPA) has named wildfires as one of the important climate change indicators [8]. Wildfire smoke currently accounts for 40% of the total PM emitted in the US [9].
The World Health Organization (WHO) estimated that at least 250,000 deaths will occur every year due to wildfires and other aspects of climate change [10]. The US EPA and the United States Center for Disease Control and Prevention (US CDC) have indicated that the smoke from wildfires can cause respiratory tract irritation and more serious disorders, including reduced lung function [11], bronchitis, an exacerbation of asthma and heart failure, and premature death [12,13]. Children, pregnant women, and the elderly are especially vulnerable to smoke exposure [14,15]. When a wildfire impacts residential or industrial areas, burning building materials such as painted furniture, polymer flooring, electronic products, and vehicles can release large amounts of harmful VOCs, carbon monoxide (CO), polycyclic aromatic hydrocarbons (PAHs) [16,17], nitrogen oxides (NOx), and PM, all of which could have acute and/or chronic human health implications [9,15,18,19].
Fine PM2.5 in general has great potential to impact human health due to its ability to reach the thoracic and alveolar regions of the respiratory system [20,21]. The Global Burden of Disease Comparative Risk Assessment conducted by WHO reports that in 2005, PM2.5 was globally responsible for 3% of cardiopulmonary disease mortality. These figures amount to 0.8 million premature deaths and 6.4 million years of life lost (YLL) worldwide [22].
The black carbon (BC) or soot component of wildfire PM2.5 is an important contributor to climate change [23,24]. Studies have shown that the increased soot and organic carbon emitted from wildfires could lead to further climate change [25]. Previous studies have reported measurements of BC and UV-absorbing organic carbon PM (UVPM) in the San Francisco Bay Area for different scenarios [26,27,28]. To control wildfire smoke exposure more effectively and better protect public health, a further characterization of wildfire smoke is necessary [6,12,27].
Wildfires can also generate toxic VOCs and PAHs from burning plants, furniture, plastics, and building materials in the fire area [29,30,31,32]. The VOCs released from wildfires are associated with serious health effects [33,34,35], and they can participate in complex photochemical reactions and create harmful ultrafine aerosols [36,37]. Many VOCs are mutagenic and/or carcinogenic themselves, presenting a long-term risk of cancer to those exposed. Acute exposure to high concentrations of VOCs causes sensory irritation, especially to the eyes, skin, and respiratory system.
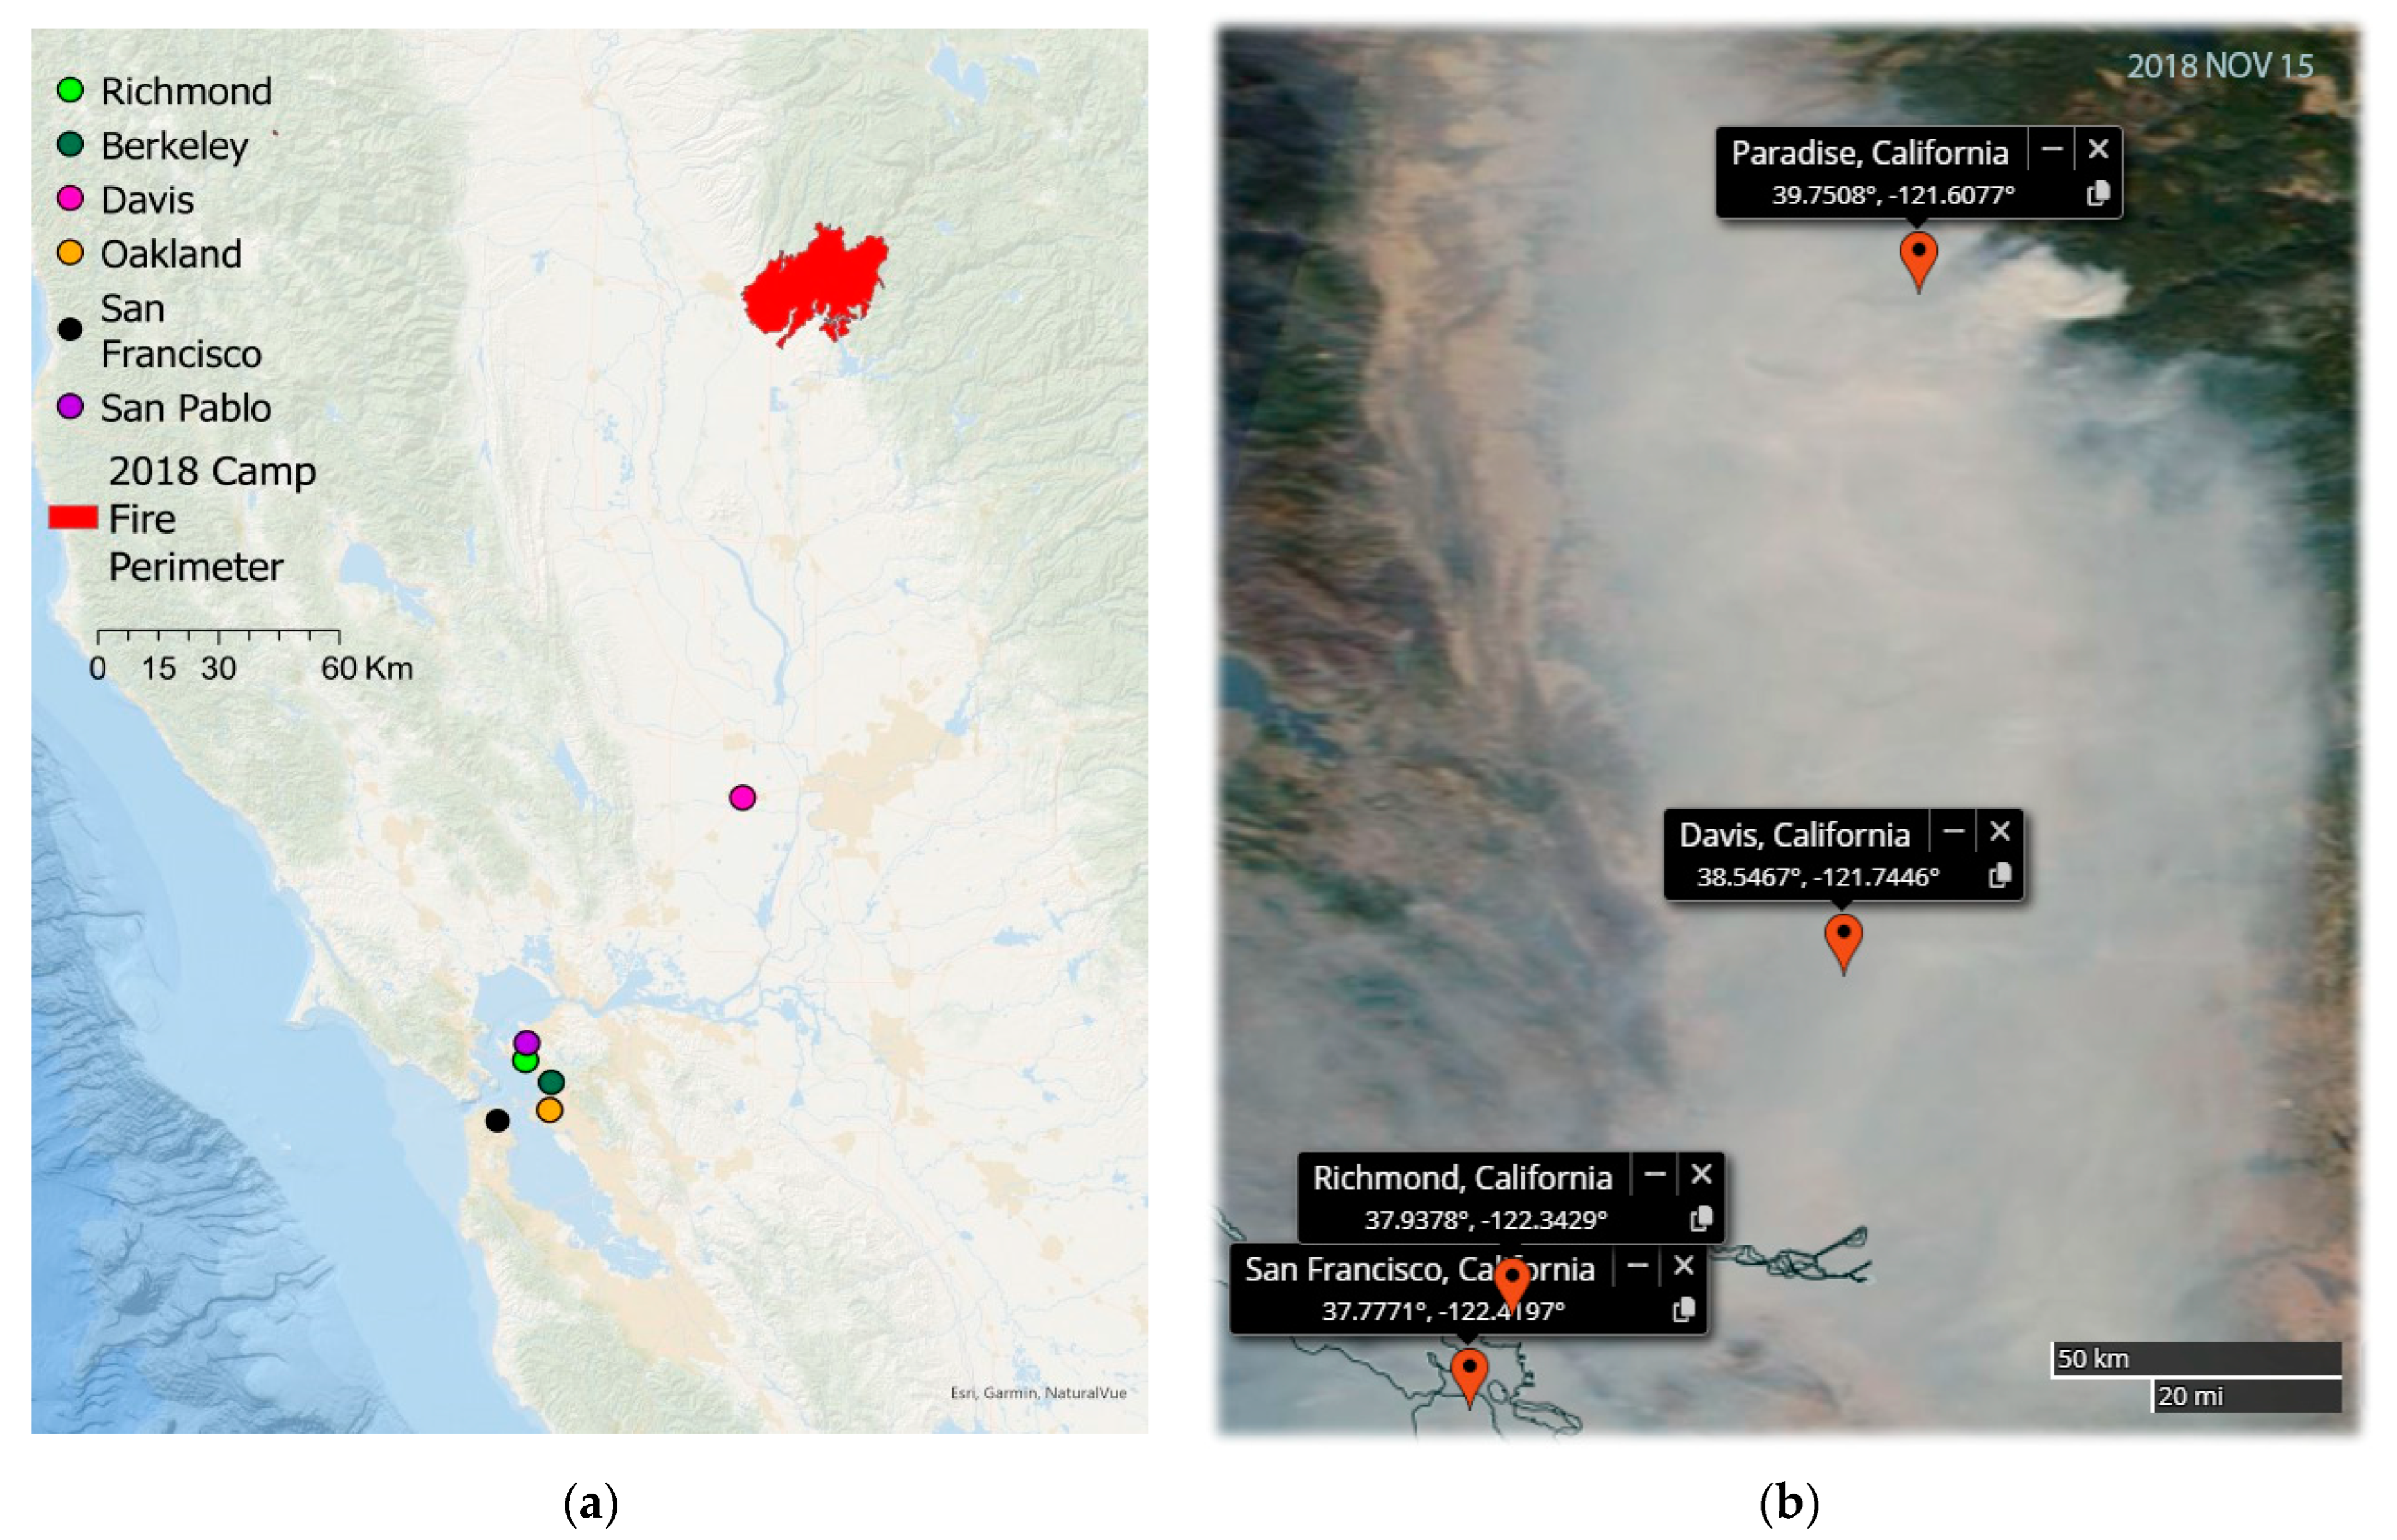
Depending on fire size, location, and weather conditions, PM and VOCs may potentially be transported across long distances from the burning area to more densely populated areas. The 2018 Camp Fire led to severe air quality deterioration throughout the region. Residents of the San Francisco Bay Area 240 km away experienced strong odors, high PM concentrations, and poor visibility until the fire was fully contained [4]. After the initial transport of smoke to the Bay Area, low winds and a stable inversion resulted in a stagnant system that trapped smoke there for weeks [38]. Figure 1a shows the Camp Fire location and the air monitoring site locations in this study. Figure 1b is a NASA satellite image from 15 November 2018 that shows smoke during the Camp Fire period extending south down along Sacramento Valley and then west to the Bay Area.
The objective of the current study is to characterize a range of particle and gas-phase species before, during, and after this fire event to better understand the impacts of the wildfire smoke emissions on the regional air quality in an urban area distant from the fires.
2. Materials and Methodology
2.1. VOC Assessment
2.1.1. TD-GC/MS Analysis
VOCs were collected onto stainless steel Tenax Sorbent Tubes measuring 3½-inch long x ¼-inch o.d. (C1-AAXX-5003, Markes International Inc., Llantrisant, UK) using small, battery-powered pumps (Model 210-1002C, SKC Inc., Eighty Four, PA USA) at 100 mL/min for 2 h (total sampled air volume = 12 L per tube). All the sampling tubes, including field blanks, were cleaned before air sampling using a heated TC-20 tube conditioning system (Markes Inc., Llantrisant, UK) with high-purity nitrogen flow using the manufacturer’s recommended temperature and time. Any contaminants or interferences were required to be ≤0.2 parts-per-billion-volume before use. Air samples were collected on the rooftop (12 m above ground) of the California Department of Public Health (CDPH) laboratory in Richmond, California from 2:45–4:50 PM on 20 November 2018 during the wildfire period (8–25 November 2018) (Figure 2). Non-wildfire samples were taken on 12 December 2018, which was 17 days after the wildfire episode ended. For each sampling period, three pumps with tubes were co-located to calculate standard deviations. The sampling pumps were calibrated using mini-BUCK Calibrator M-5 (A.P. Buck Inc., Orlando, FL, USA) before and after sampling. Flow rates (103.4 ± 3.1, 106.3 ± 6, 106.1 ± 3.1, mL/min for the three sampling pumps) were averaged for calculations. Field blank samples were also collected by taking sealed tubes to the sampling site but not pumping any air through them. After sample collection, the Tenax tubes were tightly sealed and stored in a closed, emission-free container at 4 °C in a refrigerator until analysis, which was conducted within one week of sampling.
VOCs were analyzed using a thermal desorption-gas chromatography/mass spectrometry (TD-GC/MS) method adopted from EPA TO-17 [41]. The tubes were directly analyzed using TD-100 (Markes International Inc., Llantrisant, UK) coupled with a GC 7890/MS 5977 (Agilent Technologies Inc., Santa Clara, CA, USA) for VOC analysis. Briefly, VOCs trapped in the Tenax tubes were transferred to TD-100 at 300 °C for 10 min under high-purity helium (5N grade; no inlet split flow). The compounds were re-concentrated on a cold/sorbent trap (U-T 15 ATA-2S, cold trap—Air Toxic Analyzer from Markes International Inc.) at 23 °C. The cold trap was rapidly heated to 300 °C over 3 min while passing a helium flow for VOC transfer to an uncoated and deactivated fused-silica capillary transfer line (the internal and outer diameters of 0.25 and 0.35 mm, respectively) heated at 150 °C. The helium gas (with a 10 mL/min split flow) delivered the volatiles to the GC/MS system for analysis. The GC was equipped with an Agilent J&W VF-5ms capillary column (length: 30 m; I.D.: 0.25 mm; Film thickness: 1.0 µm). Helium was the carrier gas at a flow of 1.2 mL/min (constant flow mode). The GC oven temperature program started at 32 °C (holding time 5 min), then increased to 150 °C at 7 °C/min and to 280 °C at 30 °C/min, and held for 5 min. The GC/MS transfer line was heated to 230 °C. The MS source and quadrupole temperatures were 230 °C and 150 °C, respectively. The detector was in full-scan mode between 30 and 450 amu with electron impact ionization at 70 eV. The 76 VOC compounds listed in EPA Method 8260B [42] were selected and quantified by comparing them with standard chemicals. The calibration curve for each chemical compound was created by spiking 7 different levels with 10, 20, 50, 100, 200, 300, and 500 ng of pure standards onto the clean tubes. Three gas-phase chemical compounds, bromoflurobenzene, chlorobenzene-d5, 1,4-diflurobenzene, were automatically injected into each adsorbent tube through the TD-100 as internal standards. The method detection limit (MDL) for this assay was 0.42–4.68 ng/tube (corresponding to 0.04–0.39 µg/m3) for the 75 analytes, except that for 1,1,2-Trichlorotrifluoroethane (CFC-113) was 10.22 ng/tube, or 0.85 µg/m3. The limit of quantitation was 10 ng/tube (or 0.83 µg/m3) for all analytes. Table 1 gives the method detection limit for the major chemicals detected in this study.
2.1.2. VOC Data Analysis and Processing
Target VOC compound identifications and amounts were determined using MSD ChemStation Data Analysis software (Agilent Technologies Inc., Santa Clara, CA, USA) based on the retention time (RT), mass spectrum, and selected ions (one quantifier ion and two additional qualifier ions for each compound). VOC concentrations were reported as the mean value of the triplicate air sample measurement results, along with their standard deviations. The quantified VOC results during the wildfire event were compared with those after the Camp Fire period. An integrated NIST 11 mass spectral database in MassHunter qualitative analysis from Agilent was used for the identification of other unknown peaks. The tentatively identified chemical compounds with a NIST mass library match score ≥ 80 are reported without further confirmation using chemical standards.
2.2. PM Assessment
2.2.1. PM2.5 Continuous Measurement during the Fire Season
PM2.5 levels (µg/m3) were measured during the Camp Fire between 10 and 30 November 2018 using a beta-attenuation monitor (E-BAM, Met One Instruments Inc., Grants Pass, OR, USA) on the CDPH rooftop, as shown in Figure 2. Met-One E-BAM is a non-regulatory method that is useful for fast deployment and for measuring temporal trends. The unit was calibrated and serviced by the manufacturer before the fire episode. The flow rate was also calibrated onsite using a lab-calibrated rotary flow meter. The measured time resolution was 10 min, with the data exported as hourly averages.
The measured November 2018 wildfire data were compared to measurements made at the same sampling site during November 2015, when there were no fires. To compare our E-BAM PM2.5 values to other regional data, PM2.5 data were obtained from Bay Area Air Quality Management District (BAAQMD). Data from two beta-attenuation (BAM-1020, Met One Instruments Inc. a federal equivalent method (FEM) instrument) monitoring stations (San Pablo (5.6 km north of Richmond) and Berkeley (9.5 km southeast)) were downloaded and compared with the CDPH E-BAM values.
Black carbon data were also obtained from BAAQMD, which were measured at a community site in Richmond, CA, using an aethalometer (Magee Scientific AE33, Berkeley, CA, USA).
2.2.2. Passive PM Sampling and SEM/EDS Particle Analysis
During the wildfire episode, open-face passive samplers (OFPS) [43] were placed out on the CDPH roof (Figure 3), and in a residential backyard in Albany, CA (7.2 km south of the Richmond campus, 2 m in height). Samplers with copper (Ted Pella, prod # 16072) and carbon substrates (Ted Pella, Product # 16084 and GE polycarbonate 0.01-micron filter on the top) were deployed side by side at the same time; copper tape was used for the optimal detection of the carbon content in the aerosols during the wildfire season. The samplers were analyzed using scanning electron microscopy/energy dispersive X-ray spectroscopy (SEM/EDS) for morphology and elemental chemistry. A Tescan MIRA3 field emission scanning electron microscope (FESEM) in high-vacuum mode with a BSE detector was used for imaging, and elemental chemistry was analyzed with a Bruker Quantax energy-dispersive x-ray spectroscope.
3. Results and Discussion
3.1. VOCs Detected during the Wildfire Period
Figure 4 is an example of a GC/MS chromatogram from an air sample collected during the wildfire event showing the retention times for the major VOCs detected in our 76-target compound list. Compounds tentatively identified with a NIST library match score > 80 also can be seen in the figure and are marked by asterisks. However, many other visible peaks were not identified.
Figure 5 shows a comparison of the major quantified VOCs for samples collected on 20 November and 12 December. VOCs for which the concentration dropped to a lower concentration on 12 December were attributed to wildfires. Some VOCs that had similar concentrations on 12 December, such as cis-1,4-dichloro-2-butene, were likely created by a non-wildfire regional source such as local factory emissions, motor vehicle exhaust, solvent use, painting, or cooking [44]. Other VOCs such as sec-butylbenzene, 1,2,4-trimethylbenzene, n-propylbenzene, o-xylene, styrene, and methacrylonitrile were detected during the wildfire period, but not in the non-fire period. Additional VOCs, such as 1,3,5-trimethylbenzene, benzene, toluene, ethylbenzene, and p,m-xylene (BTEX) were detected in the non-fire period, but their concentrations were much higher during the wildfire period. Notably, the toluene concentration during the wildfire period was more than three times the non-wildfire concentration. Similarly, the benzene concentration during the wildfire was almost four times higher, and that of p,m-xylene was three times higher. These higher wildfire levels were statistically significant for sec-butylbenzene, 1,2,4-trimethylbenzene, n-propylbenzene, o-xylene, styrene, and, 1,3,5-trimethylbenzene, benzene, toluene, ethylbenzene, and p,m-xylene (p < 0.00001). Wildfire levels were not statistically higher for carbon disulfide, methacrylonitrile, or cis-1,4-dichloro-2-butene (p > 0.05).
Dickinson et al. [31] reported increased concentrations of BTEX in ground-level wildfire smoke, with that of benzene ranging from 0.04 to 25 ppbv (0.13 to 79.87 µg/m3). They calculated the ratio of benzene/toluene (B/T) to distinguish wildfire emissions from other emission sources ranging from 0.57 to 3 in different wildfire scenarios. In this work, B/T during the wildfire period was 0.56 (<1). Various factors such as fire fuels, air sample aging, and weather conditions could affect this value.
Simms et al. [45] also measured BTEX during the 2018 Camp Fire in Davis, California, which is about 100 km northeast of Richmond. Their study reported 19 detected VOCs, while our study reported 13 quantified VOCs that did not include VOCs not in our method list or under our detection limits. The most abundant VOCs measured by Simms et al. were benzene and toluene, with average concentrations of 4.7 and 15.1 µg/m3, respectively, which are around 4.3 (4.7/1.0) and 6.9 (15.1/2.2) times the present work’s benzene (1.03 ± 0.02 µg/m3) and toluene (2.15 ± 0.04 µg/m3) levels, respectively. In general, our major detected VOC compounds are similar to those of Simms et al., but have lower concentrations. This is not surprising since Davis is much closer to the fire center than Richmond, and toluene reacts with species like OH more quickly than benzene does. Besides the dilution effect over greater distances, the location difference and the different oxidation conditions may have also resulted in some differences in the final species. The oxidation of aromatics such as benzene, styrene, and toluene can form other oxygenated compounds, such as phenols, cresols, and benzaldehyde [31,32,45]. In this study, we detected phenol (Figure 4), but did not quantify it because it was not on our target compound list. Other possible explanations for the differences between these studies include differing sampling methods and temporal variability; for example, Simms et al. [45]’s toluene measurements varied from 4.1 µg/m3 to 40.6 µg/m3 on different sampling days.
During the same 2018 Camp Fire episode, Ivancic M. et al. [46] studied the aging of organic carbon (OC) and investigated how the characteristics of carbonaceous aerosols evolved over the course of the fire event at Berkeley (9.5 km southeast to our VOC monitoring site). They observed a higher fraction of secondary carbonaceous aerosols in the later phase of the fire, where smoldering and spot fires were more typical, a phase that coincides with our VOC sample collection period. This suggests the possible formation of oxygenated aromatics such as phenols, cresols, and benzaldehydes from their primary parent VOCs, benzene, toluene, and styrene, directly emitted from the wildfire [47]. However, due to the lack of VOC measurements closer to the fire, and the fact that most of the oxygenated aromatics were not quantified in this investigation, it is difficult to distinguish the originally emitted compounds from those formed via chemical evolution during the aging of the fire plume.
Compared to OEEHA’s 8 h reference exposure levels [48], most of the VOCs measured in San Francisco Bay Area were relatively low. For example, the measured benzene concentration (1.03 ± 0.02 µg/m3) is 3 times lower, that of 1,3,5-trimethylbenzene (0.33 ± 0.01 µg/m3) is about 26 times lower, and that of toluene (2.15 ± 0.04 µg/m3) is 400 times lower. Nevertheless, communicating any major increase in VOC concentrations could be of potential benefit to the public, especially for regions closer to a fire that could have much higher VOC concentrations. For example, the investigators in Davis closer to the Camp Fire [45] reported measured benzene (4.7 µg/m3) levels that were higher than OEEHA’s 8 h exposure limit (3 µg/m3). In, addition, because this wildfire episode was approximately three weeks long, people may have experienced much longer exposure times than 8 h, which could also have led to potentially different health concerns.
The greater abundance of VOCs in the wildfire samples compared with those in non-wildfire samples suggests potential gas-phase health risks associated with wildfires and the burning of natural and man-made materials. Particularly, methacrylonitrile is highly toxic and poisonous upon inhalation and can cause tearing and skin reactions externally [49]. Benzene is known to cause dizziness and confusion in the short term and can further lead to autoimmune disorders or cancer in the long term [30,31]. Finally, toluene, which was measured in the largest concentration during the wildfire, can cause dizziness and headaches as well as permanent incoordination upon exposure [50]. BTEXs are well known hazardous air pollutants predominately through emissions from motor vehicles, aircrafts, manufacture processing, and tobacco smoking. Our results show that wildfires are another potentially important emission source of these chemicals. BTEXs can readily move through air, contaminated groundwater, and soils, thus affecting air quality and water resources. The US EPA maintains guidelines for the emission of these chemicals in drinking water and air [33]. Although this work represents a limited number of air samples for VOC analysis, our results suggest that future work should measure VOCs in air at multiple locations throughout a wildfire-impacted region. Note that the method used in this study was limited by the 76 compounds in our target list. Different wildfire fuel types can generate other VOCs [7,51], which were not detectable with this method. Future work will expand our methods and detection lists for the better characterization of wildfire-generated VOCs.
There are several limitations to this study. We only measured very limited numbers of gas-phase VOCs. Some important VOCs that are known to be emitted by wildfires, including methanol, acrolein, formaldehyde, acetaldehyde, acetic acid, hydrogen cyanide, phenols, and PAHs, were not quantified. In addition, although observations of VOCs emitted by wildfires are likely to be both spatially and temporally dependent due to chemical transformations, secondary oxidation products of parent VOCs were not distinguishable in this study. More gas-phase monitoring during wildfire events is needed to better understand the impact of wildfires on local and regional air quality.
3.2. Comparing PM2.5 Values during the Wildfire and Non-Fire Periods
E-BAM data from the fire period and data from a non-fire period at the same site in 2015 are shown in Figure 6. The wildfire-period measurements demonstrated much higher PM2.5, with an hourly average peak value of approximately 270 µg/m3. The PM2.5 daily average during the fire period was 101.6 µg/m3, compared with the 2015 average PM2.5 of 12.7 µg/m3. The PM2.5 data acquired 25 days after the fire episode demonstrated a similar PM2.5 concentration to the 2015 non-fire concentrations (12 µg/m3).
Figure 7 shows a PM2.5 comparison between the CDPH E-BAM, a regional BAAQMD BAM (Berkeley) during the fire episode, and BAAQMD BAM (Berkeley) during a non-fire period for the same month in 2017. The E-BAM measurement demonstrated a similar trend to that of BAAQMD’s measurement at Berkeley. The peak PM2.5 concentrations during the fire period were almost 10-fold higher than the PM2.5 concentrations in the same month of 2017. The highest daily peak value reached approximately 200 µg/m3. Poor air quality (PM2.5 above 150 µg/m3) lasted for many days, as shown in Figure 6 and Figure 7. The observation and measurement here were also consistent with early BlueSky modeling results [52].
These data are consistent with the heavy visible haze observed during the fire period within the Bay Area, as shown in Figure 2. That picture, taken on 12 November 2018, demonstrates near darkness during daylight hours. Other qualitative observations during this period include frequently smoky odors and visible, macroscopic ash.
Figure 8 shows that the CDPH-measured E-BAM PM2.5 values had a high correlation (R2 = 0.97) with the PM2.5 data reported for nearby regional BAAQMD (average of San Pablo, 5.4 km north, and Berkeley, 9.5 km south) stations. This suggests that the wildfire PM impacts in this region were relatively spatially homogeneous. This homogeneity may have been caused by the extended trapping of the smoke from the Camp Fire within an inversion layer over the San Francisco Bay Area [52,53].
3.3. PM Morphology and Elemental Profiles
Carbonaceous PM and inorganic dust and ash collected using the OFPS were analyzed using SEM to examine particle morphology and elemental composition to help understand any unique types of particles collected during the wildfire period. Figure 9 shows typical low-magnification images of particles collected using the OFPS. As expected, a wide range of particle sizes were present, with visible particles or ash suspended in the air during the wildfire episode. The EDS analysis of the suspended largest particles (Figure 9a) showed that besides carbon, over 90% of these particles’ compositions comprised inorganic components, such as aluminum, silicon, and iron, as shown in the spectrum and the normalized mass concentration table. Although these inorganic elements are consistent with ash, they also are common elements in road dust or PM from building construction and demolition.
Examined under a higher magnification, the samples collected during the fire episode contained an abundant number of spherical particles consistent with organic carbon tar balls [27], as shown in Figure 10. Different sizes (250 nm–3 µm) of spherical particles and agglomerates are shown in Figure 10, and most of them had carbon as their major constituent. It is possible that some of the larger, super-micron spheres were biogenic rather than tar balls. Besides individual tar balls, the last two images in Figure 10 appear to be large agglomerates of tar balls, indicating that many different sizes of smoke particles co-existed in the air due to agglomeration.
In addition to carbon and oxygen (Figure 11), some tar balls also included sulfur (S), as shown in Figure 11c. This is reasonable since sulfur is also present in wood and grass [54]. For the small tar ball that only contained carbon and oxygen (Figure 11b), the measured molar ratio of carbon to oxygen was 8, which is different from the value of 6 previously reported [55]. We repeated the measurement multiple times on many different particles and obtained values between 7.1 and 8.4, with an average value of 7.9 and a standard deviation of ±0.57. Note that since copper substrates were used for this measurement, there was no carbon substrate effect on the carbon concentration calculation, a potentially more accurate and reliable method for carbon content determination [43].
To construct an elemental profile of the wildfire episode PM, over 100 spherical particles were randomly selected and analyzed using EDS, and the overall average element compositions are shown in Figure 12. Carbon and oxygen were the dominant elements, including tar balls and other carbon-rich particles. The other major elements in the wildfire-generated particles included silicon, calcium, aluminum, iron, magnesium, and sulfur. Minor elements included potassium, chloride, sodium, titanium, phosphorus, barium, and zinc, as shown in Figure 13.
In comparison, the total carbon percentage of ambient PM under normal conditions has been reported in other urban regions to be 12–18% [56], while the elemental analysis of PM sampled during non-fire season in the San Francisco Bay Area showed that it was 14% [43]. The higher carbon content of 38.76% detected in the wildfire PM during the Camp Fire period likely indicates enhanced incomplete combustion products.
3.4. Black Carbon Enrichment during the Wildfire Episode
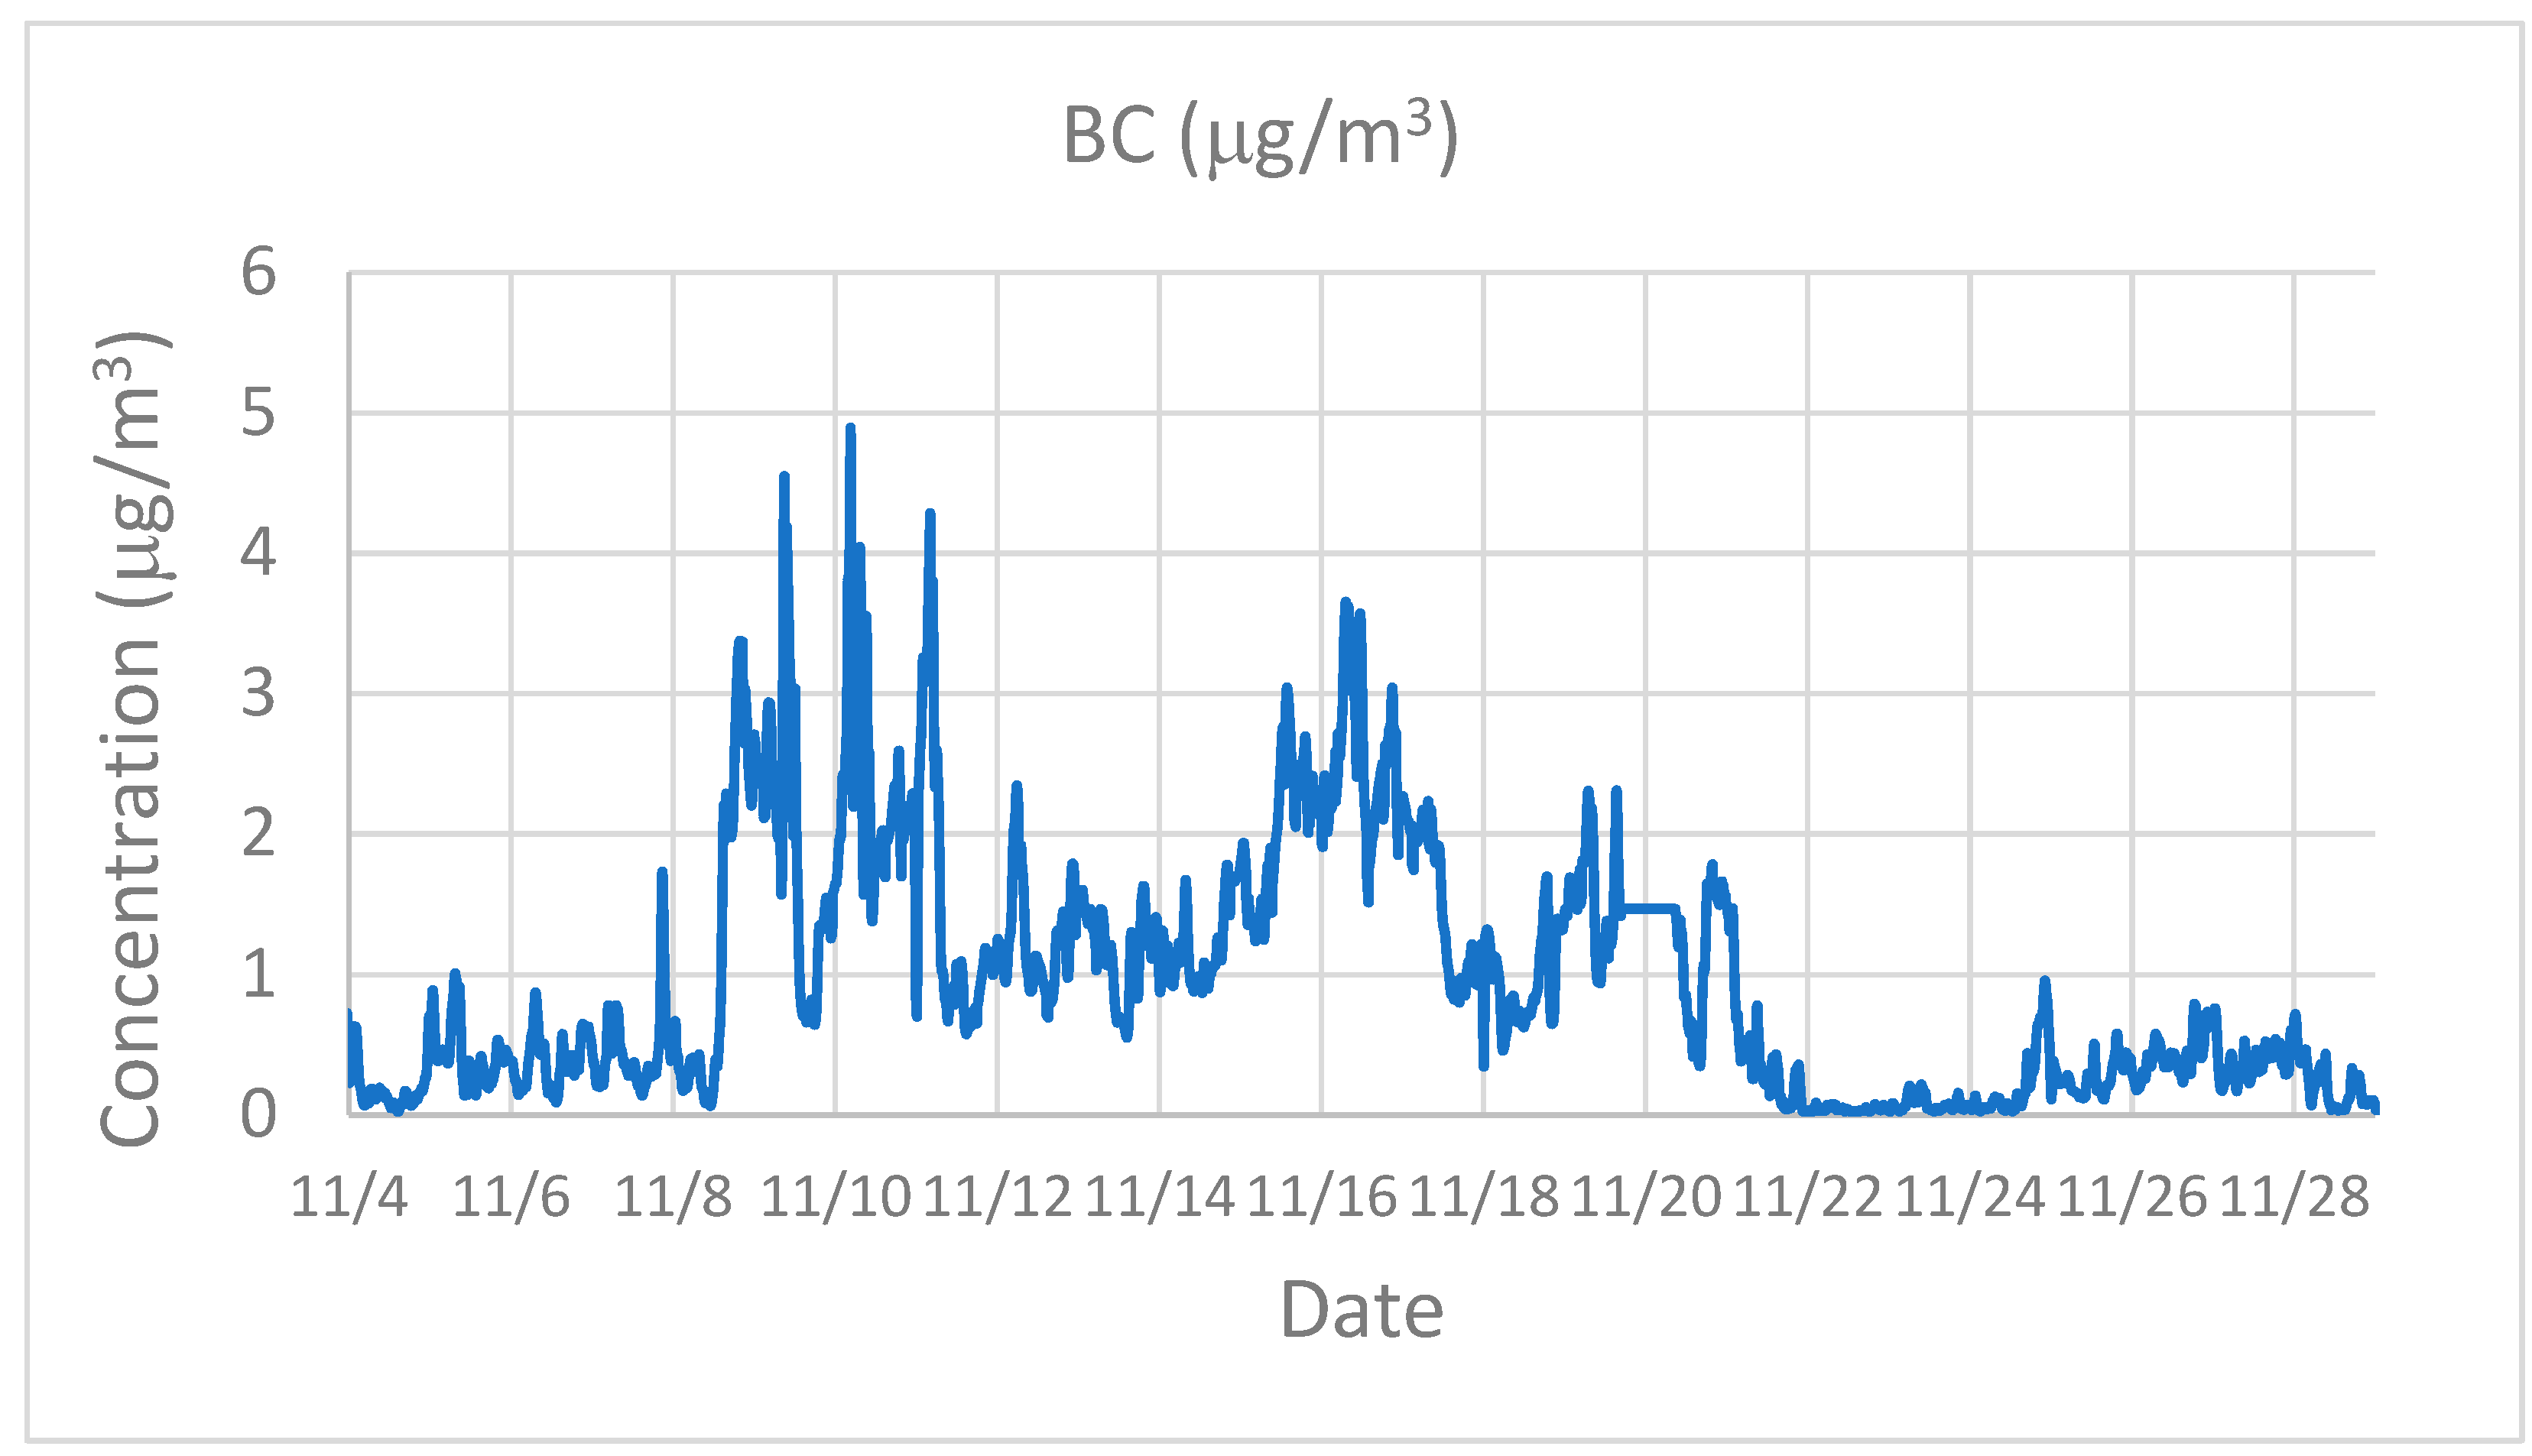
Black carbon (BC) is a product of the incomplete combustion of organic materials and wildfire-generated PM [57]. Figure 14 shows the data from BAAQMD’s Richmond site measurements.
In non-fire conditions, the average black carbon concentration in Richmond was 0.38 µg/m3. In contrast, the average black carbon concentration during the Camp Fire was 1.33 µg/m3, which is approximately 3.5 times higher. As shown in Figure 14, the highest black carbon peak value was above 4.9 µg/m3 during the Camp Fire, which is about 13 times higher than typical background peaks. Sustained, high levels of black carbon could potentially cause health impacts for both humans and plants [58,59].
4. Conclusions
Air measurements conducted in an urban area during a wildfire episode yielded high PM and VOC concentrations even though the fire was located over 240 km away. Several toxic VOCs not detected in non-fire samples were identified in the wildfire period, including sec-butylbenzene, 1,2,4-trimethylbenzene, n-propylbenzene, o-xylene, and styrene. Other VOCs such as 1,3,5-trimethylbenzene, ethylbenzene, toluene, and benzene were present in the non-fire air, but they were found in increased concentrations during the wildfire episode. BTEX concentrations were several times higher during wildfires. The increased VOC concentrations measured during the wildfire are potentially hazardous to human health and are known to cause skin irritation and asthma-like symptoms upon inhalation. Due to the limitations of our target compound list, the reported VOCs in this study may not represent all VOCs emitted during the Camp Fire, including even more toxic oxygenated VOCs. More wildfire gas-phase monitoring methodologies need to be developed in the future to better characterize VOCs directly emitted from wildfires and their transformation in the atmosphere.
The highest daily average PM2.5 value during the fire period approached 200 µg/m3, and the highest hourly average was approximately 270 µg/m3. The daily average PM2.5 concentrations in the Bay Area during the entire fire episode was 102 µg/m3. SEM analyses revealed that the PM included a high concentration of particles consistent with organic carbon tar balls. These results suggest the necessity to measure and monitor not only PM but also gas phase composition during wildfire season to inform public health. The detailed chemistry of wildfire smoke from different combustible fuels, locations, and temperature profiles needs to be studied further [32]. Different conditions may result in different compounds [37,51], especially for the oxygenated, aged smoke carried over long distances and throughout long fire seasons into heavily populated, urban areas [10].
Author Contributions
Conceptualization, Z.-M.W.; methodology, Z.-M.W.; formal analysis, Z.-M.W. and P.W.; investigation, Z.-M.W. and P.W.; resources, Z.-M.W., P.W., J.W. and K.K.; data curation, Z.-M.W. and P.W.; writing—original draft preparation, Z.-M.W.; writing—review and editing, Z.-M.W., P.W., J.W. and K.K.; visualization, Z.-M.W., P.W. and J.W. All authors have read and agreed to the published version of the manuscript.
Funding
This research received no external funding and was supported by California Department of Public Health.
Data Availability Statement
Data are contained within the article.
Acknowledgments
The authors would like to acknowledge the Bay Area Air Quality Management District for allowing the use of their monitoring data.
Conflicts of Interest
The authors declare no conflict of interest.
References
- Marlon, J.R.; Bartlein, P.J.; Walsh, M.K.; Harrison, S.P.; Brown, K.J.; Edwards, M.E.; Higuera, P.E.; Power, M.J.; Anderson, R.S.; Briles, C.; et al. Wildfire responses to abrupt climate change in North America. Proc. Natl. Acad. Sci. USA 2009, 106, 2519–2524. [Google Scholar] [CrossRef] [PubMed]
- US-EPA. Climate Impacts on Ecosystems. 2021. Available online: https://19january2017snapshot.epa.gov/climate-impacts/climate-impacts-ecosystems_.html (accessed on 30 August 2021).
- Abatzoglou, J.T.; Williams, A.P. Impact of anthropogenic climate change on wildfire across western US forests. Proc. Natl. Acad. Sci. USA 2016, 113, 11770–11775. [Google Scholar] [CrossRef] [PubMed]
- CalFire. Camp Fire Incident Update. 2018 10/24/2022. 2024. Available online: https://www.fire.ca.gov/incidents/2018/11/8/camp-fire/ (accessed on 16 March 2024).
- Wikipedia. 2018 California Wildfires. 2023. Available online: https://en.wikipedia.org/wiki/2018_California_wildfires#:~:text=It%20was%20also%20the%20largest,100%20million%20acres%20of%20land (accessed on 14 August 2023).
- Black, C.; Tesfaigzi, Y.; Bassein, J.A.; Miller, L.A. Wildfire smoke exposure and human health: Significant gaps in research for a growing public health issue. Environ. Toxicol. Pharmacol. 2017, 55, 186–195. [Google Scholar] [CrossRef] [PubMed]
- Jin, L.; Permar, W.; Selimovic, V.; Ketcherside, D.; Yokelson, R.J.; Hornbrook, R.S.; Apel, E.C.; Ku, I.-T.; Collett, J.L., Jr.; Sullivan, A.P.; et al. Constraining emissions of volatile organic compounds from western US wildfires with WE-CAN and FIREX-AQ airborne observations. Atmos. Meas. Technol. 2023, 23, 5969–5991. [Google Scholar] [CrossRef]
- US-EPA. Climate Change Indicators: Wildfires. April 2021. Available online: https://www.epa.gov/climate-indicators/climate-change-indicators-wildfires (accessed on 30 August 2021).
- US-EPA. Health Effects Attributed to Wildfire Smoke. 2022. Available online: https://www.epa.gov/wildfire-smoke-course/health-effects-attributed-wildfire-smoke (accessed on 19 May 2022).
- WHO. Climate Change and Health. 2021. Available online: https://www.who.int/news-room/fact-sheets/detail/climate-change-and-health (accessed on 30 August 2021).
- Reid, C.E.; Brauer, M.; Johnston, F.H.; Jerrett, M.; Balmes, J.R.; Elliott, C.T. Critical Review of Health Impacts of Wildfire Smoke Exposure. Environ. Health Perspect. 2016, 124, 1334–1343. [Google Scholar] [CrossRef]
- US-EPA. Wildland Fire Research to Protect Health and the Environment. 2021. Available online: https://www.epa.gov/air-research/wildland-fire-research-protect-health-and-environment (accessed on 30 August 2021).
- US-CDC. Climate Effects on Health: Wildfires. 2021. Available online: https://www.cdc.gov/climateandhealth/effects/wildfires.htm (accessed on 30 August 2021).
- US-EPA. Wildland Fire Research: Health Effects Research. Available online: https://www.epa.gov/air-research/wildland-fire-research-health-effects-research#:~:text=The%20effects%20of%20smoke%20from,especially%20vulnerable%20to%20smoke%20exposure (accessed on 10 February 2022).
- Holm, S.M.; Miller, M.D.; Balmes, J.R. Health effects of wildfire smoke in children and public health tools: A narrative review. J. Expo. Sci. Environ. Epidemiol. 2021, 31, 1–20. [Google Scholar] [CrossRef]
- Ghetu, C.C.; Rohlman, D.; Smith, B.W.; Scott, R.P.; Adams, K.A.; Hoffman, P.D.; Anderson, K.A. Wildfire Impact on Indoor and Outdoor PAH Air Quality. Environ. Sci. Technol. 2022, 56, 10042–10052. [Google Scholar] [CrossRef]
- Fent, K.W.; Toennis, C.; Sammons, D.; Robertson, S.; Bertke, S.; Calafat, A.M.; Pleil, J.D.; Wallace, M.A.G.; Kerber, S.; Smith, D.; et al. Firefighters’ absorption of PAHs and VOCs during controlled residential fires by job assignment and fire attack tactic. J. Expo. Sci. Environ. Epidemiol. 2020, 30, 338–349. [Google Scholar] [CrossRef]
- Aguilera, R.; Corringham, T.; Gershunov, A.; Benmarhnia, T. Wildfire smoke impacts respiratory health more than fine particles from other sources: Observational evidence from Southern California. Nat. Commun. 2021, 12, 1493. [Google Scholar] [CrossRef]
- Yu, Y.; Zou, W.W.; Jerrett, M.; Meng, Y.Y. Acute Health Impact of Convectional and Wildfire-related PM2.5: A narrative review. Environ. Adv. 2022, 12, 100179. [Google Scholar] [CrossRef]
- Valavanidis, A.; Fiotakis, K.; Vlachogianni, T. Airborne particulate matter and human health: Toxicological assessment and importance of size and composition of particles for oxidative damage and carcinogenic mechanisms. J. Environ. Sci. Health Part C 2008, 26, 339–362. [Google Scholar] [CrossRef]
- Reponen, T.; Grinshpun, S.A.; Trakumas, S.; Martuzevicius, D.; Wang, Z.-M.; LeMasters, G.; Lockey, J.E.; Biswas, P. Concentration gradient patterns of aerosol particles near interstate highways in the Greater Cincinnati airshed. J. Environ. Monit. 2003, 5, 557–562. [Google Scholar] [CrossRef]
- Cohen, A.J.; Anderson, H.R.; Ostro, B.; Pandey, K.D.; Krzyzanowski, M.; Künzli, N.; Gutschmidt, K.; Pope, A.; Romieu, I.; Samet, J.M.; et al. The global burden of disease due to outdoor air pollution. J. Toxicol. Environ. Health Part A 2005, 68, 1301–1307. [Google Scholar] [CrossRef]
- Lee, J.E.; Gorkowski, K.; Meyer, A.G.; Benedict, K.B.; Aiken, A.C.; Dubey, M.K. Wildfire Smoke Demonstrates Significant and Predictable Black Carbon Light Absorption Enhancements. Geophys. Res. Lett. 2022, 49, e2022GL099334. [Google Scholar] [CrossRef]
- Ditas, J.; Ma, N.; Zhang, Y.; Assmann, D.; Neumaier, M.; Riede, H.; Karu, E.; Williams, J.; Scharffe, D.; Wang, Q.; et al. Strong impact of wildfires on the abundance and aging of black carbon in the lowermost stratosphere. Proc. Natl. Acad. Sci. USA 2018, 115, E11595–E11603. [Google Scholar] [CrossRef] [PubMed]
- Tollefson, J. Soot a major contributor to climate change. Nature 2013, 15, 10–38. [Google Scholar] [CrossRef]
- Caubel, J.J.; Cados, T.E.; Preble, C.V.; Kirchstetter, T.W. A Distributed Network of 100 Black Carbon Sensors for 100 Days of Air Quality Monitoring in West Oakland, California. Environ. Sci. Technol. 2019, 53, 7564–7573. [Google Scholar] [CrossRef] [PubMed]
- Sparks, T.L.; Wagner, J. Composition of particulate matter during a wildfire smoke episode in an urban area. Aerosol Sci. Technol. 2021, 55, 734–747. [Google Scholar] [CrossRef]
- Gaspar, F.W.; Maddalena, R.; Williams, J.; Castorina, R.; Wang, Z.-M.; Kumagai, K.; McKone, T.E.; Bradman, A. Ultrafine, fine, and black carbon particle concentrations in California child-care facilities. Indoor Air 2017, 28, 102–111. [Google Scholar] [CrossRef] [PubMed]
- Turner, M.C.; Andersen, Z.J.; Baccarelli, A.; Diver, W.R.; Gapstur, S.M.; Pope, C.A.; Prada, D.; Samet, J.; Thurston, G.; Cohen, A.; et al. Outdoor air pollution and cancer: An overview of the current evidence and public health recommendations. CA A Cancer J. Clin. 2020, 70, 460–479. [Google Scholar] [CrossRef] [PubMed]
- Korsiak, J.; Pinault, L.; Christidis, T.; Burnett, R.T.; Abrahamowicz, M.; Weichenthal, S. Long-term exposure to wildfires and cancer incidence in Canada: A population-based observational cohort study. Lancet Planet. Health 2022, 6, e400–e409. [Google Scholar] [CrossRef]
- Dickinson, G.N.; Miller, D.D.; Bajracharya, A.; Bruchard, W.; Durbin, T.A.; McGarry, J.K.P.; Moser, E.P.; Nuñez, L.A.; Pukkila, E.J.; Scott, P.S.; et al. Health Risk Implications of Volatile Organic Compounds in Wildfire Smoke During the 2019 FIREX-AQ Campaign and Beyond. GeoHealth 2022, 6, e2021GH000546. [Google Scholar] [CrossRef]
- Liang, Y.; Weber, R.J.; Misztal, P.K.; Jen, C.N.; Goldstein, A.H. Aging of Volatile Organic Compounds in October 2017 Northern California Wildfire Plumes. Environ. Sci. Technol. 2022, 56, 1557–1567. [Google Scholar] [CrossRef]
- US-EPA. Technical Overview of Volatile Organic Compounds; United States Environmental Protection Agency: Washington, DC, USA, 2017; p. 12.
- Li, A.J.; Pal, V.K.; Kannan, K. A review of environmental occurrence, toxicity, biotransformation and biomonitoring of volatile organic compounds. Environ. Chem. Ecotoxicol. 2021, 3, 91–116. [Google Scholar] [CrossRef]
- Da Silva, F.C., Jr.; Felipe, M.B.M.C.; de Castro, D.E.F.; Araújo, S.C.D.S.; Sisenando, H.C.N.; de Medeiros, S.R.B. A look beyond the priority: A systematic review of the genotoxic, mutagenic, and carcinogenic endpoints of non-priority PAHs. Environ. Pollut. 2021, 278, 116838. [Google Scholar] [CrossRef]
- Wang, Z.-M.; Wagner, J.; Wall, S. Characterization of Laser Printer Nanoparticle and VOC Emissions, Formation Mechanisms, and Strategies to Reduce Airborne Exposures. Aerosol Sci. Technol. 2011, 45, 1060–1068. [Google Scholar] [CrossRef]
- Wang, Z.-M.; Biswas, P. Nickel Speciation and Aerosol Formation During Combustion of Kerosene Doped with Nickel Nitrate Aerosol in a Premixed Burner. Aerosol Sci. Technol. 2000, 33, 525–535. [Google Scholar] [CrossRef]
- Rooney, B.; Wang, Y.; Jiang, J.H.; Zhao, B.; Zeng, Z.-C.; Seinfeld, J.H. Air quality impact of the Northern California Camp Fire of November 2018. Atmos. Meas. Technol. 2020, 20, 14597–14616. [Google Scholar] [CrossRef]
- CalFire. California_Fire_Perimeters_1878–2019. California Department of Forestry and Fire Protection Fire and Resource Assessment Program 2024. Available online: https://services.arcgis.com/jIL9msH9OI208GCb/arcgis/rest/services/California_Fire_Perimeters_1878_2019/FeatureServer (accessed on 19 January 2024).
- NASA. Wordview Service Home Page. Available online: https://worldview.earthdata.nasa.gov/ (accessed on 13 March 2024).
- Woolfenden, E.A.; McClenny, W.A. Compendium Method TO-17. Determination of Volatile Organic Compounds in Ambient Air Using Active Sampling onto Sorbent Tubes; US EPA: Cincinnati, OH, USA, 1999.
- US-EPA. Method 8260B, Volatile Organic Compounds by Gas Chromatography/Mass Spectrometry (GC/MS). 1996. Available online: https://19january2017snapshot.epa.gov/sites/production/files/2015-12/documents/8260b.pdf (accessed on 16 March 2024).
- Wang, Z.-M.; Zhou, Y.; Gaspar, F.W.; Bradman, A. Using low cost open-face passive samplers to sample PM concentration and elemental composition in childcare facilities. Environ. Sci. Process Impacts 2020, 22, 1502–1513. [Google Scholar] [CrossRef] [PubMed]
- WHO. Indoor air quality: Organic pollutants. Environ. Technol. Lett. 1989, 10, 855–858. [Google Scholar] [CrossRef]
- Simms, L.A.; Borras, E.; Chew, B.S.; Matsui, B.; McCartney, M.M.; Robinson, S.K.; Kenyon, N.; Davis, C.E. Environmental sampling of volatile organic compounds during the 2018 Camp Fire in Northern California. J. Environ. Sci. 2020, 103, 135–147. [Google Scholar] [CrossRef]
- Ivančič, M.; Rigler, M.; Alföldy, B.; Lavrič, G.; Brecelj, I.J.; Gregorič, A. Highly Time-Resolved Apportionment of Carbonaceous Aerosols from Wildfire Using the TC–BC Method: Camp Fire 2018 Case Study. Toxics 2023, 11, 497. [Google Scholar] [CrossRef]
- Majdi, M.; Sartelet, K.; Lanzafame, G.M.; Couvidat, F.; Kim, Y.; Chrit, M.; Turquety, S. Precursors and formation of secondary organic aerosols from wildfires in the Euro-Mediterranean region. Atmos. Meas. Technol. 2019, 19, 5543–5569. [Google Scholar] [CrossRef]
- OEHHA. All OEHHA Acute, 8-Hour and Chronic Reference Exposure Levels (RELs) as of Augus; California Office of Environmental Health Hazard Assessment, Ed.; 2020. Available online: https://oehha.ca.gov/air/general-info/oehha-acute-8-hour-and-chronic-reference-exposure-level-rel-summary (accessed on 3 August 2023).
- New-Jersey-Department-of-Health. Methacrylonitrile. Hazardous Substance Fact Sheet 2000. Available online: https://nj.gov/health/eoh/rtkweb/documents/fs/1220.pdf (accessed on 2 August 2022).
- Agency-for-Toxic-Substances-and-Disease-Registry. Medical Management Guidelines for Toluene. 2014. Available online: https://www.atsdr.cdc.gov/MHMI/mmg56.pdf (accessed on 3 August 2022).
- Sekimoto, K.; Coggon, M.M.; Gkatzelis, G.I.; Stockwell, C.E.; Peischl, J.; Soja, A.J.; Warneke, C. Fuel-Type Independent Parameterization of Volatile Organic Compound Emissions from Western US Wildfires. Environ. Sci. Technol. 2023, 57, 13193–13204. [Google Scholar] [CrossRef]
- Chow, F.K.; Yu, K.A.; Young, A.; James, E.; Grell, G.A.; Csiszar, I.; Tsidulko, M.; Freitas, S.; Pereira, G.; Giglio, L.; et al. High-Resolution Smoke Forecasting for the 2018 Camp Fire in California. Bull. Am. Meteorol. Soc. 2022, 103, E1531–E1552. [Google Scholar] [CrossRef]
- Brewer, M.J.; Clements, C.B. The 2018 Camp Fire: Meteorological Analysis Using In Situ Observations and Numerical Simulations. Atmosphere 2019, 11, 47. [Google Scholar] [CrossRef]
- Kaiser, E.R. The Sulfur Balance of Incinerators. J. Air Pollut. Control. Assoc. 1968, 18, 171–174. [Google Scholar] [CrossRef]
- Tóth, A.; Hoffer, A.; Nyirő-Kósa, I.; Pósfai, M.; Gelencsér, A. Atmospheric tar balls: Aged primary droplets from biomass burning? Atmos. Chem. Phys. 2014, 14, 6669–6675. [Google Scholar] [CrossRef]
- Hussein, T.; Li, X.; Bakri, Z.; Alastuey, A.; Arar, S.; Al-Hunaiti, A.; Viana, M.; Petäjä, T. Organic and Elemental Carbon in the Urban Background in an Eastern Mediterranean City. Atmosphere 2022, 13, 197. [Google Scholar] [CrossRef]
- Bond, T.C.; Doherty, S.J.; Fahey, D.W.; Forster, P.M.; Berntsen, T.; DeAngelo, B.J.; Flanner, M.G.; Ghan, S.; Kärcher, B.; Koch, D.; et al. Bounding the role of black carbon in the climate system: A scientific assessment. J. Geophys. Res. Atmos. 2013, 118, 5380–5552. [Google Scholar] [CrossRef]
- WHO. Health Effects of Black Carbon; WHO Regional Office for Europe: Copenhagen, Denmark, 2012.
- Janssen, N.A.H.; Hoek, G.; Simic-Lawson, M.; Fischer, P.; Van Bree, L.; ten Brink, H.; Keuken, M.; Atkinson, R.W.; Anderson, H.R.; Brunekreef, B.; et al. Black Carbon as an Additional Indicator of the Adverse Health Effects of Airborne Particles Compared with PM10 and PM2.5. Environ. Health Perspect. 2011, 119, 1691–1699. [Google Scholar] [CrossRef] [PubMed]
Figure 1.
(a) 2018 Camp Fire perimeter and locations of samples acquired in Richmond, Berkeley, Oakland, and San Pablo. The map was generated using ArcGIS Pro (ESRI, Redlands, CA, USA) and wildfire perimeter data [39]. (b) NASA satellite image for Camp Fire smoke [40].

Figure 2.
The E-Bam set up for PM2.5 (left), and the adsorption tube set up for VOCs (right).
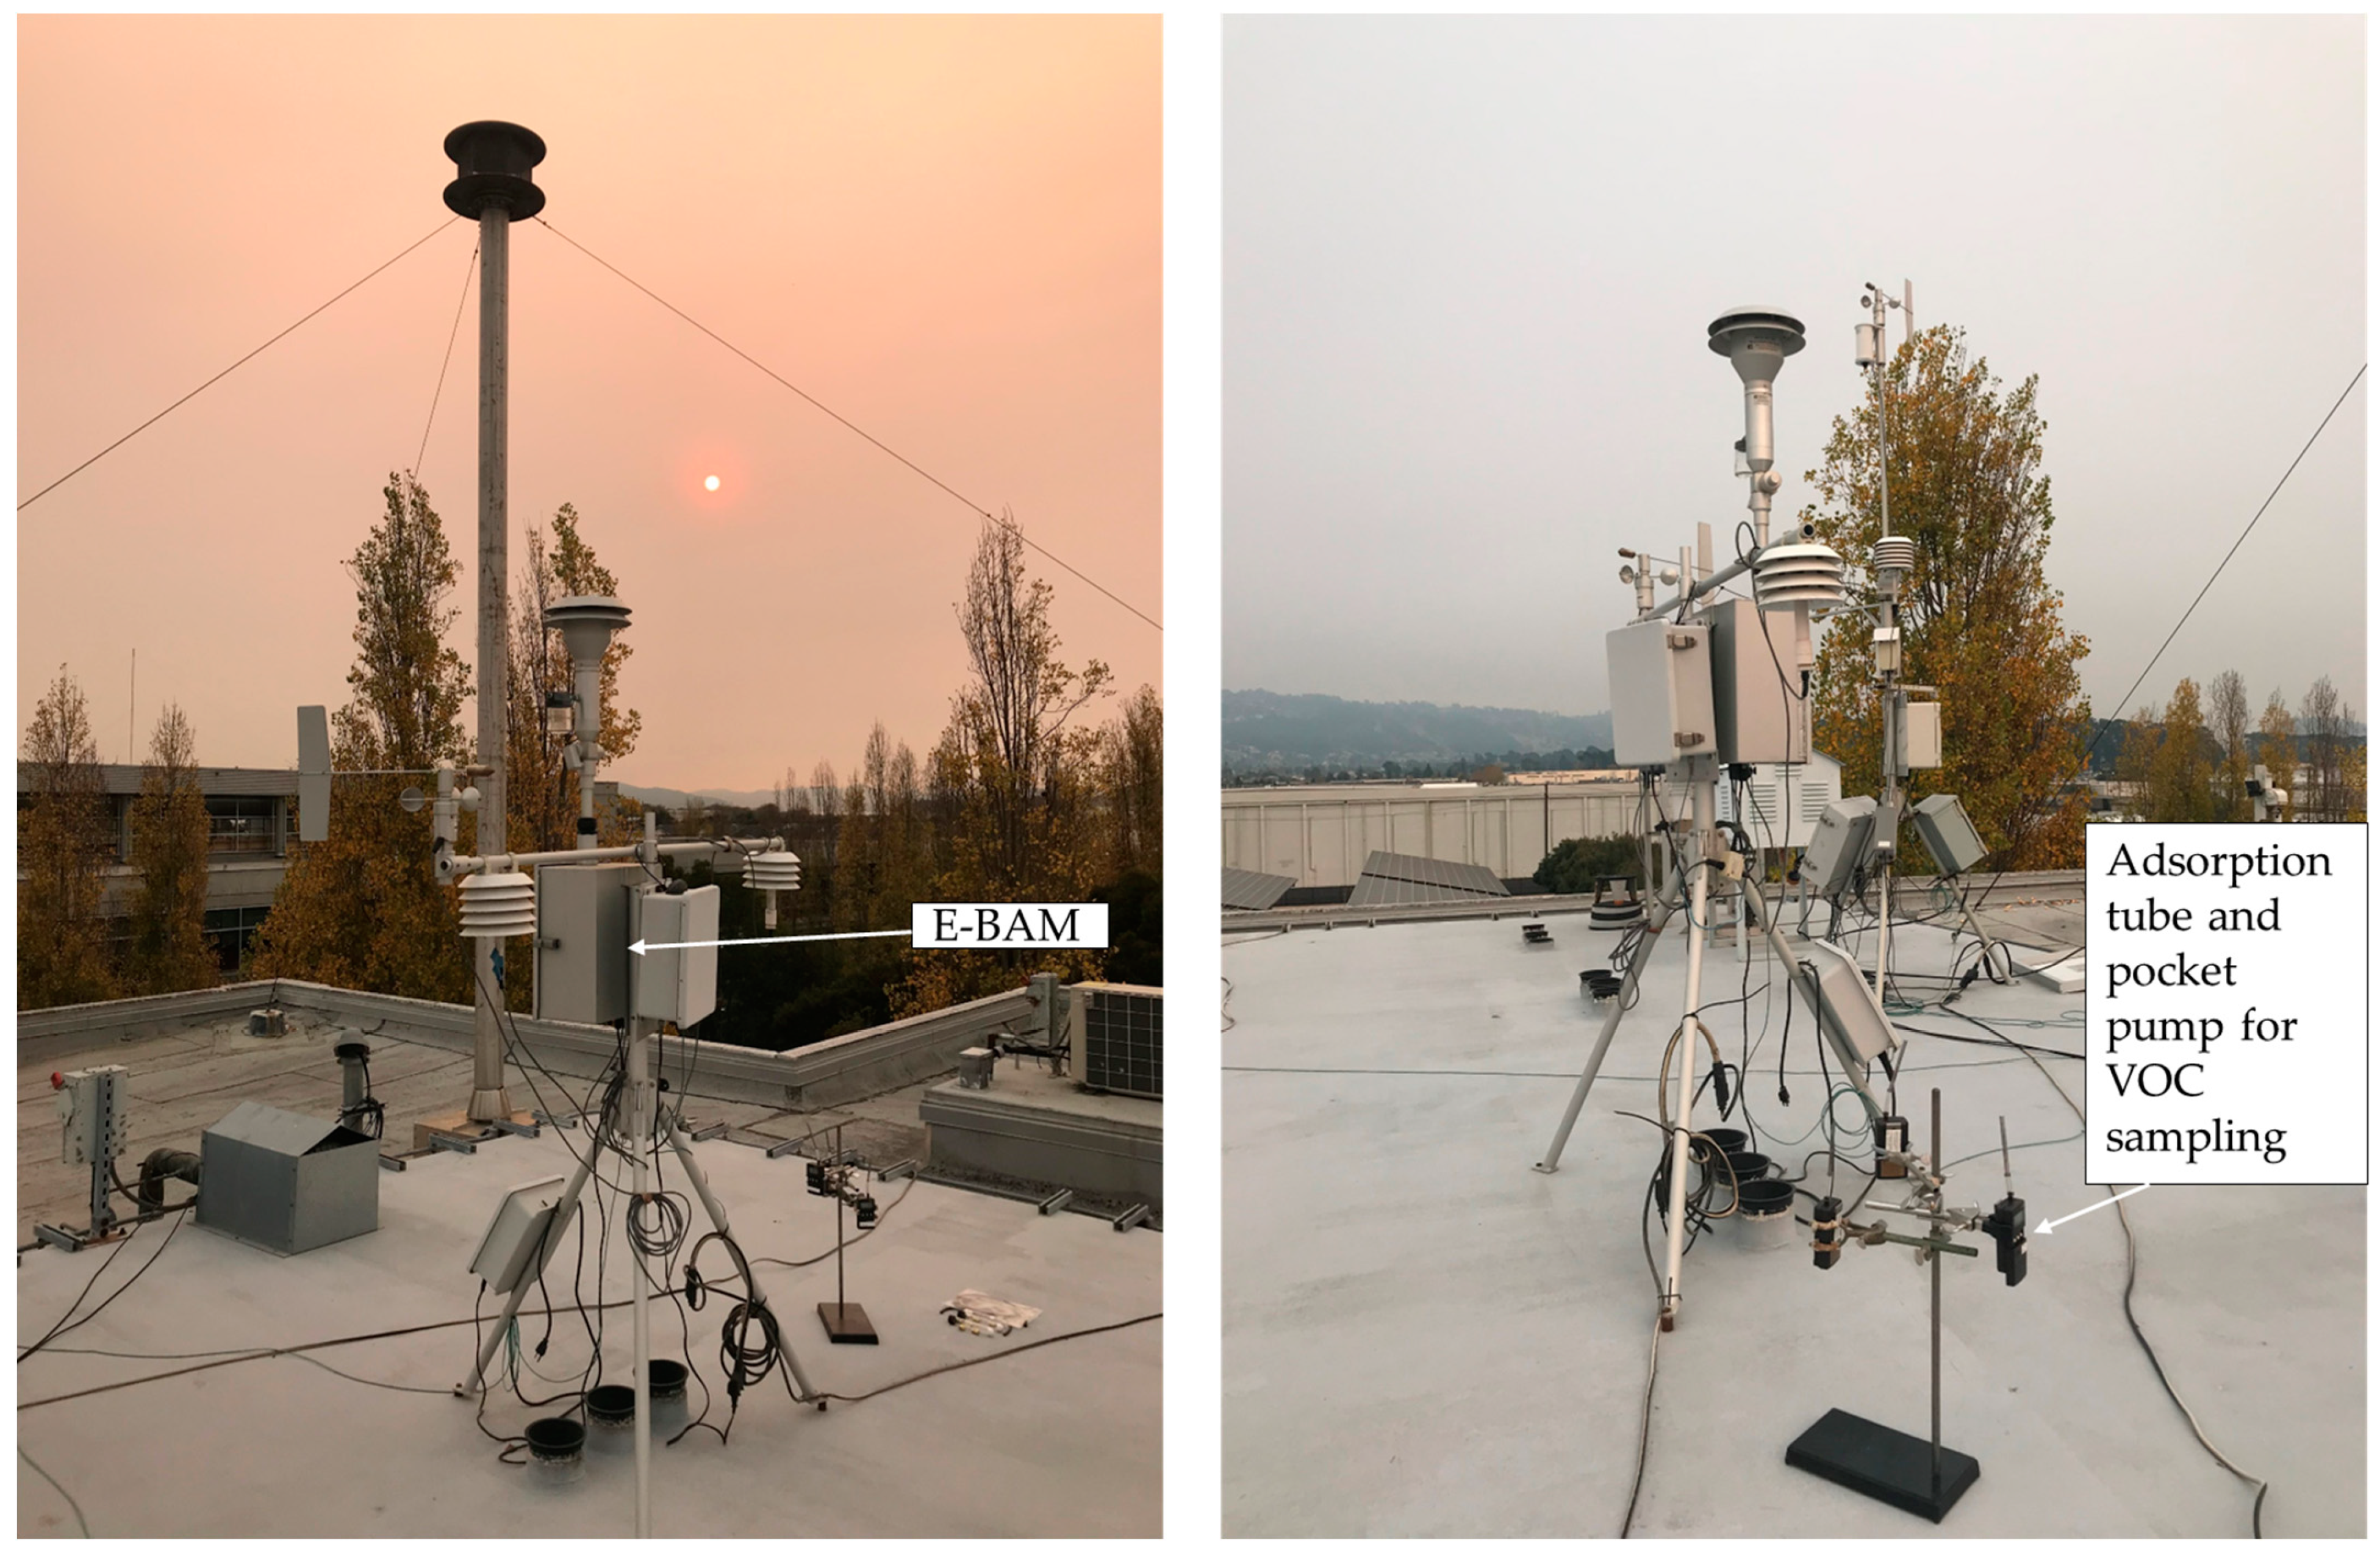
Figure 3.
Open-face passive sampler with polycarbonate or copper substrate.
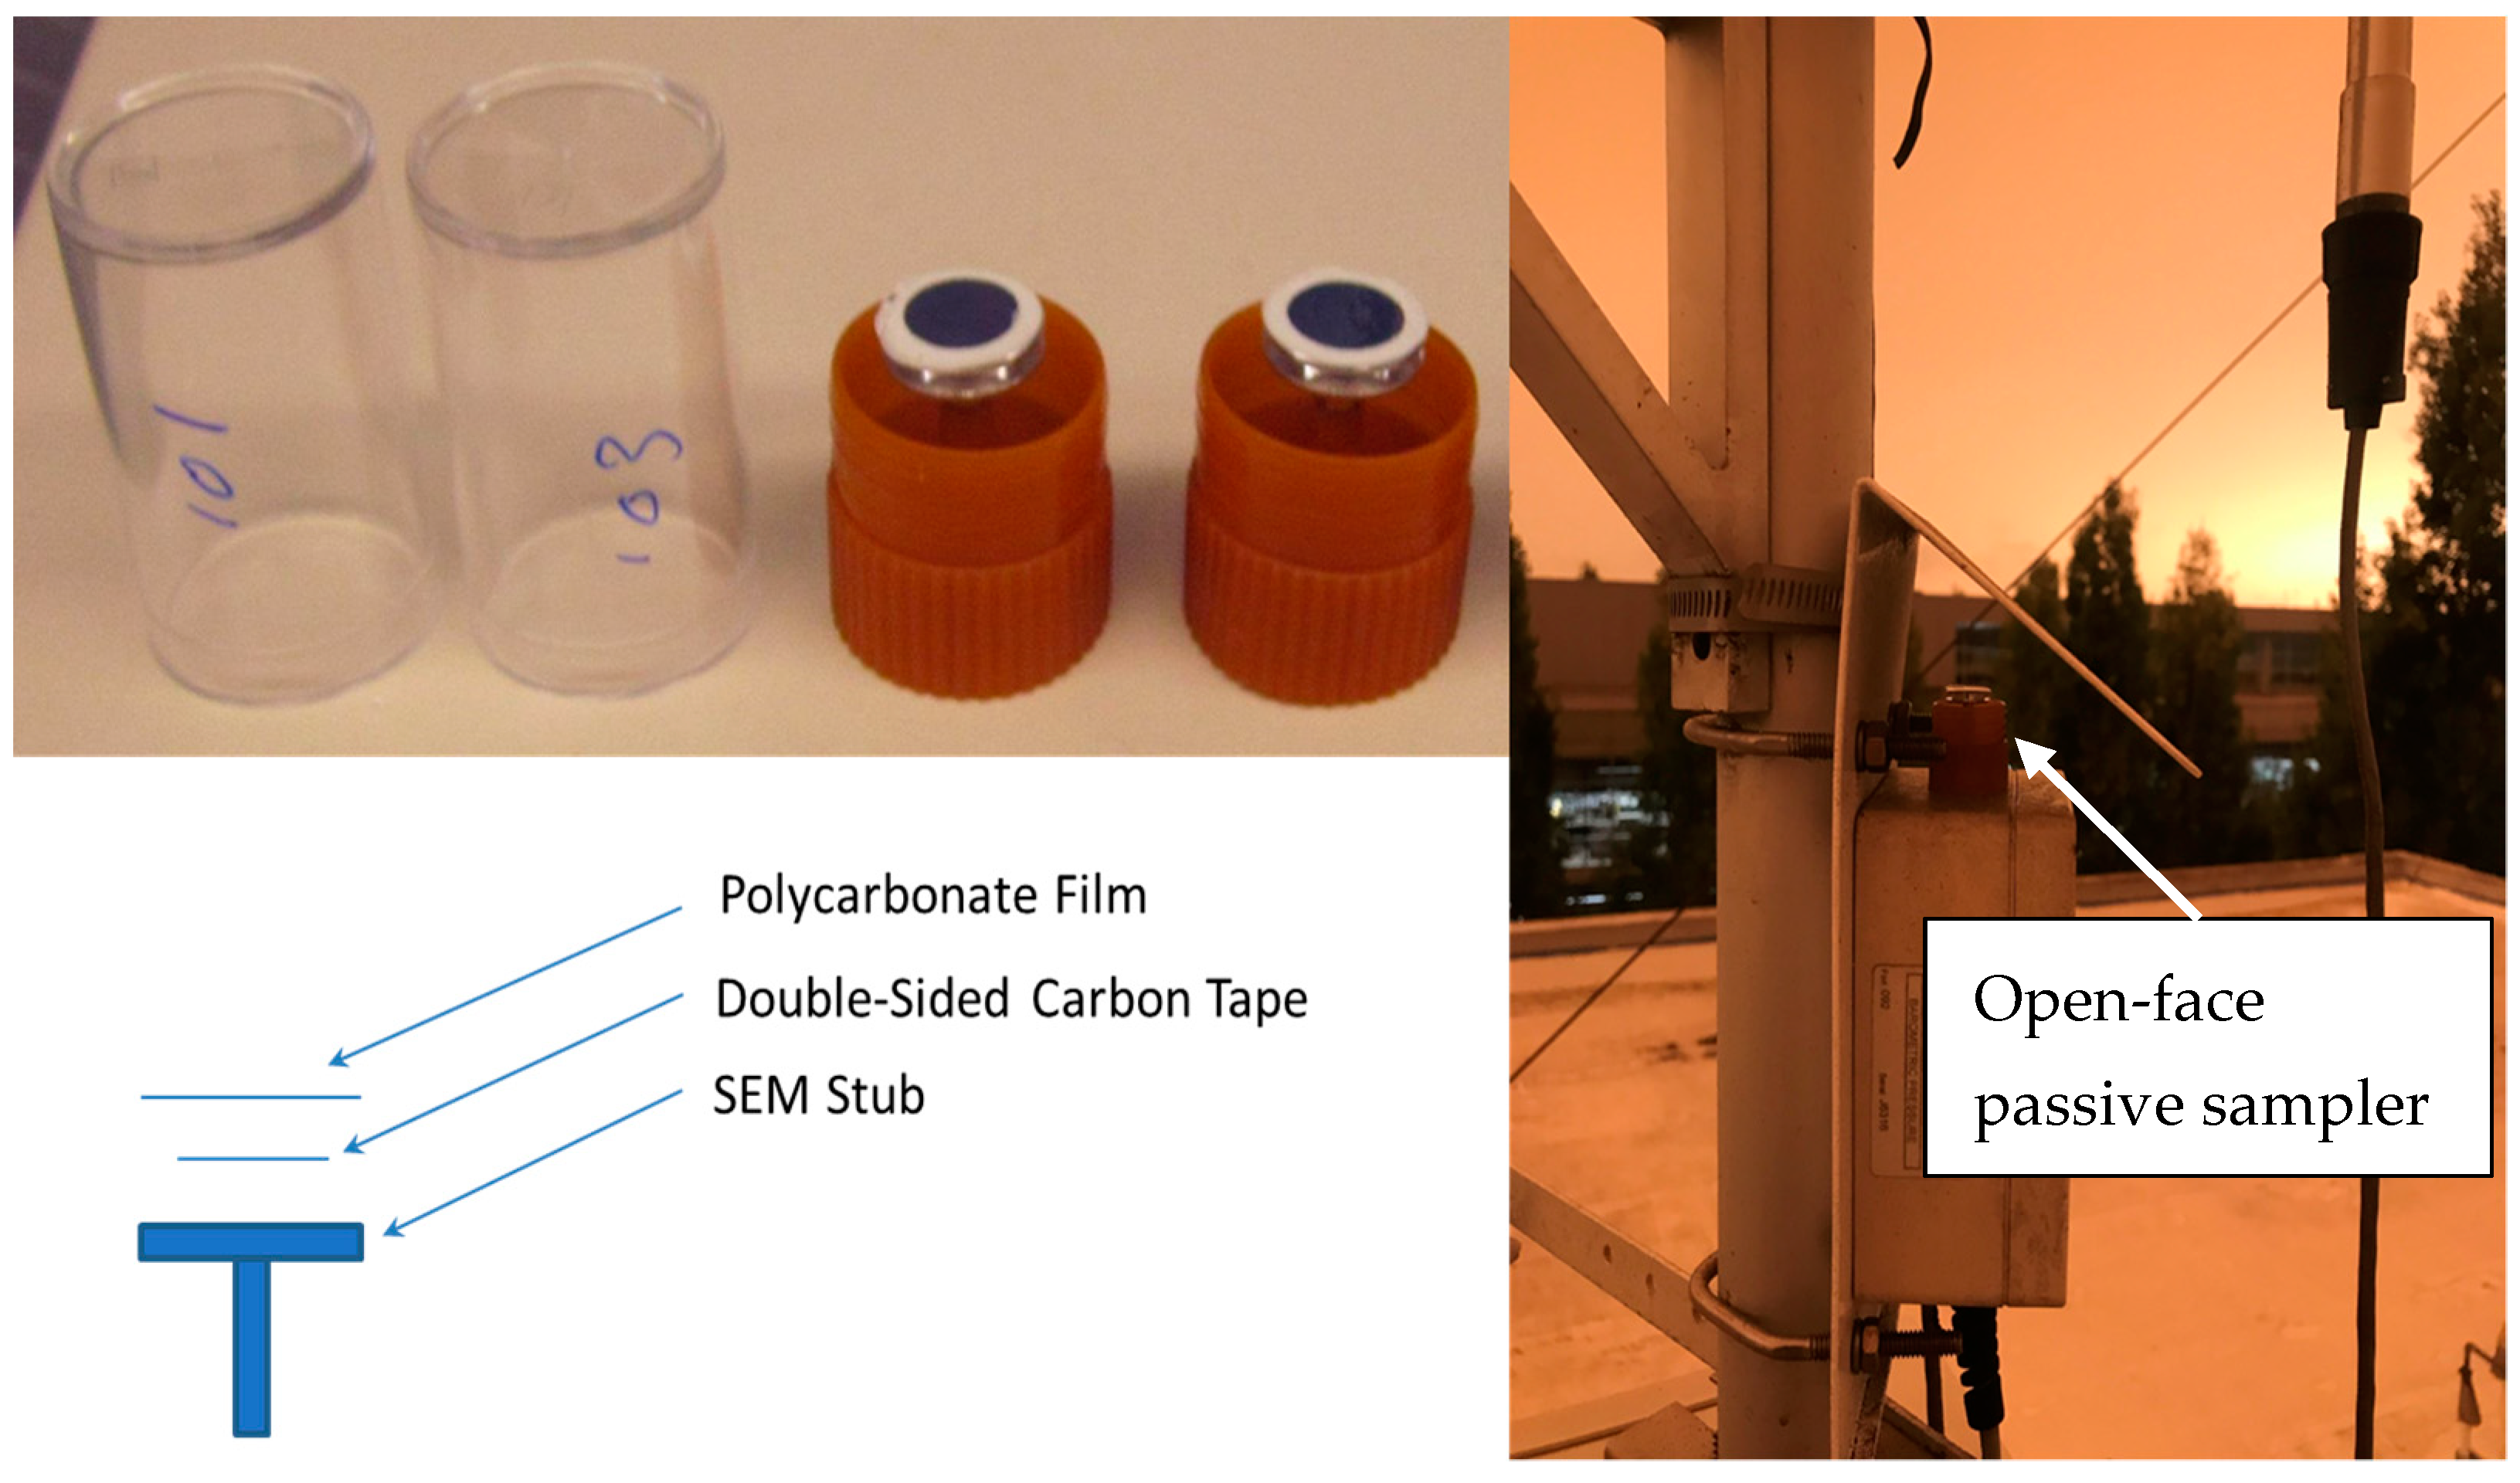
Figure 4.
An example GC/MS chromatogram of the air sample collected during the wildfire event. (*: not confirmed with standard chemical; NIST library match score > 80. IS: added internal standard.).
Figure 4.
An example GC/MS chromatogram of the air sample collected during the wildfire event. (*: not confirmed with standard chemical; NIST library match score > 80. IS: added internal standard.).

Figure 5.
Mean concentrations of major detected VOCs compared between wildfire and non-wildfire periods. (Some standard deviation error bars are too small to be seen).
Figure 5.
Mean concentrations of major detected VOCs compared between wildfire and non-wildfire periods. (Some standard deviation error bars are too small to be seen).

Figure 6.
Comparison of the Richmond hourly average PM2.5 (µg/m3) during the November 2018 fire period with that in a non-fire November in 2015 from the same site, and with that in the San Pablo site in November 2019.
Figure 6.
Comparison of the Richmond hourly average PM2.5 (µg/m3) during the November 2018 fire period with that in a non-fire November in 2015 from the same site, and with that in the San Pablo site in November 2019.
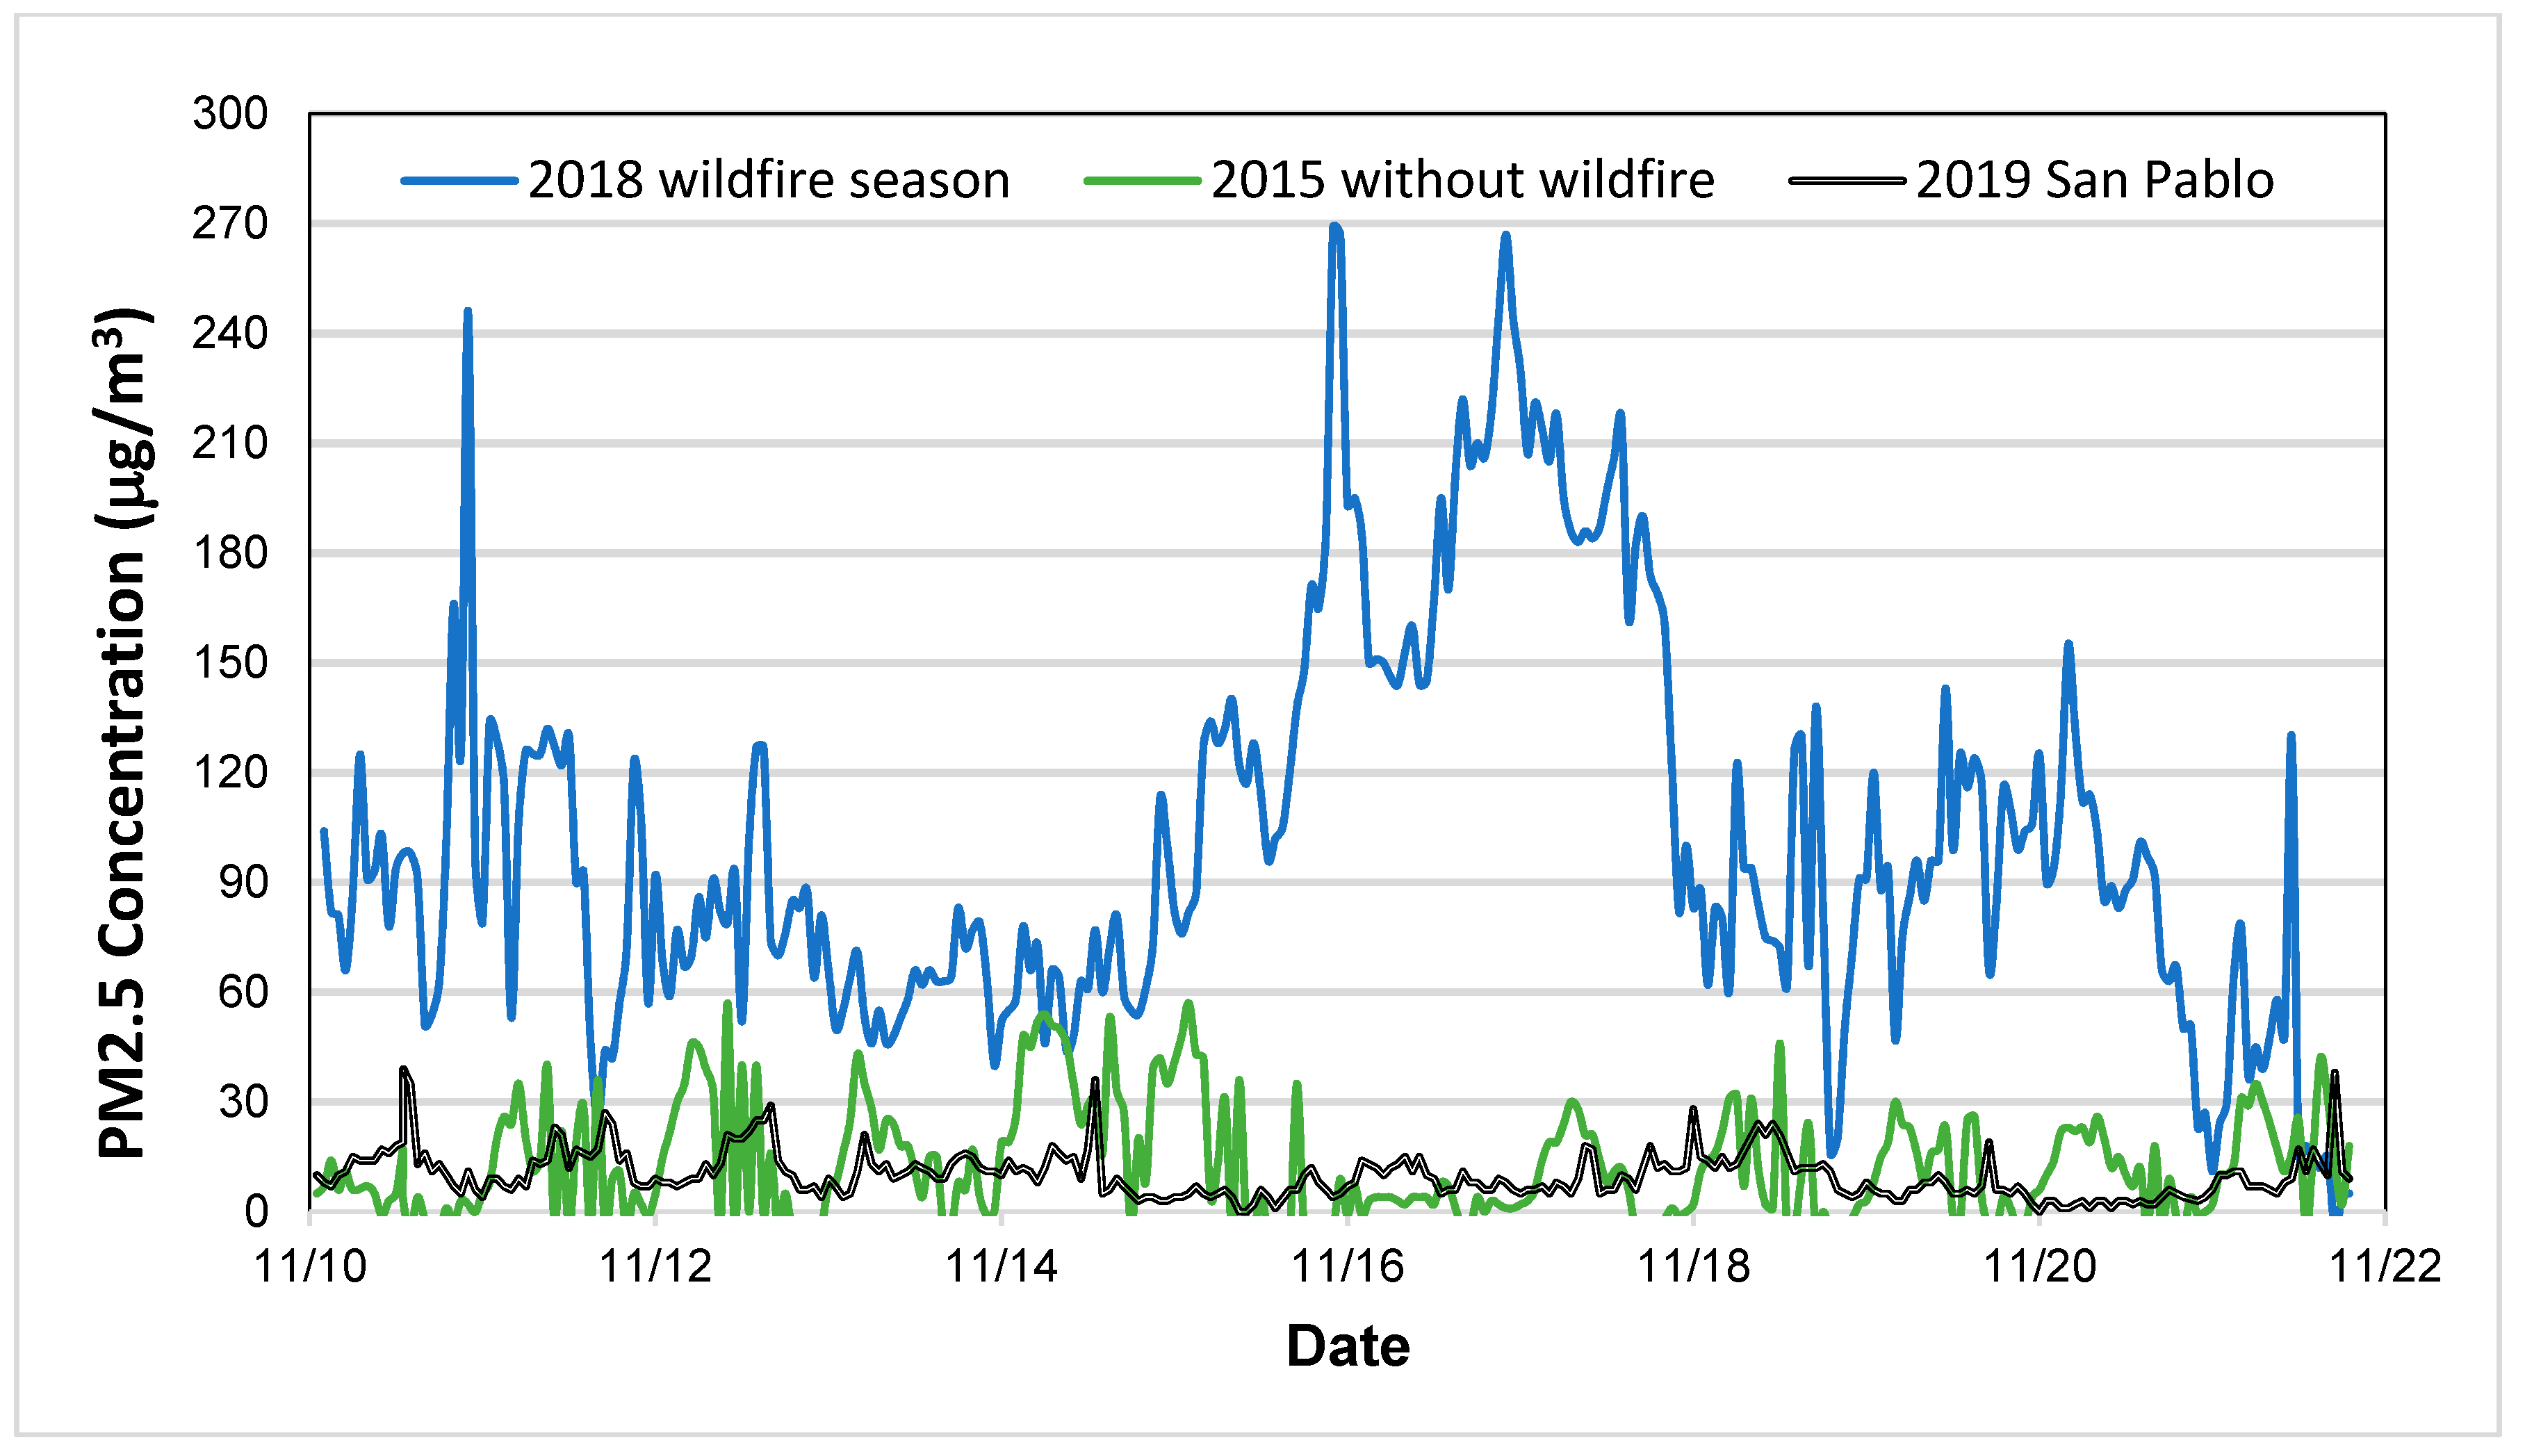
Figure 7.
Comparison of November PM2.5 concentrations from the Richmond E-BAM with those from the BAM at BAAQMD Berkeley station during the 2018 Camp Fire, and with the BAAQMD Berkeley PM2.5 from November 2017 with no fires.
Figure 7.
Comparison of November PM2.5 concentrations from the Richmond E-BAM with those from the BAM at BAAQMD Berkeley station during the 2018 Camp Fire, and with the BAAQMD Berkeley PM2.5 from November 2017 with no fires.
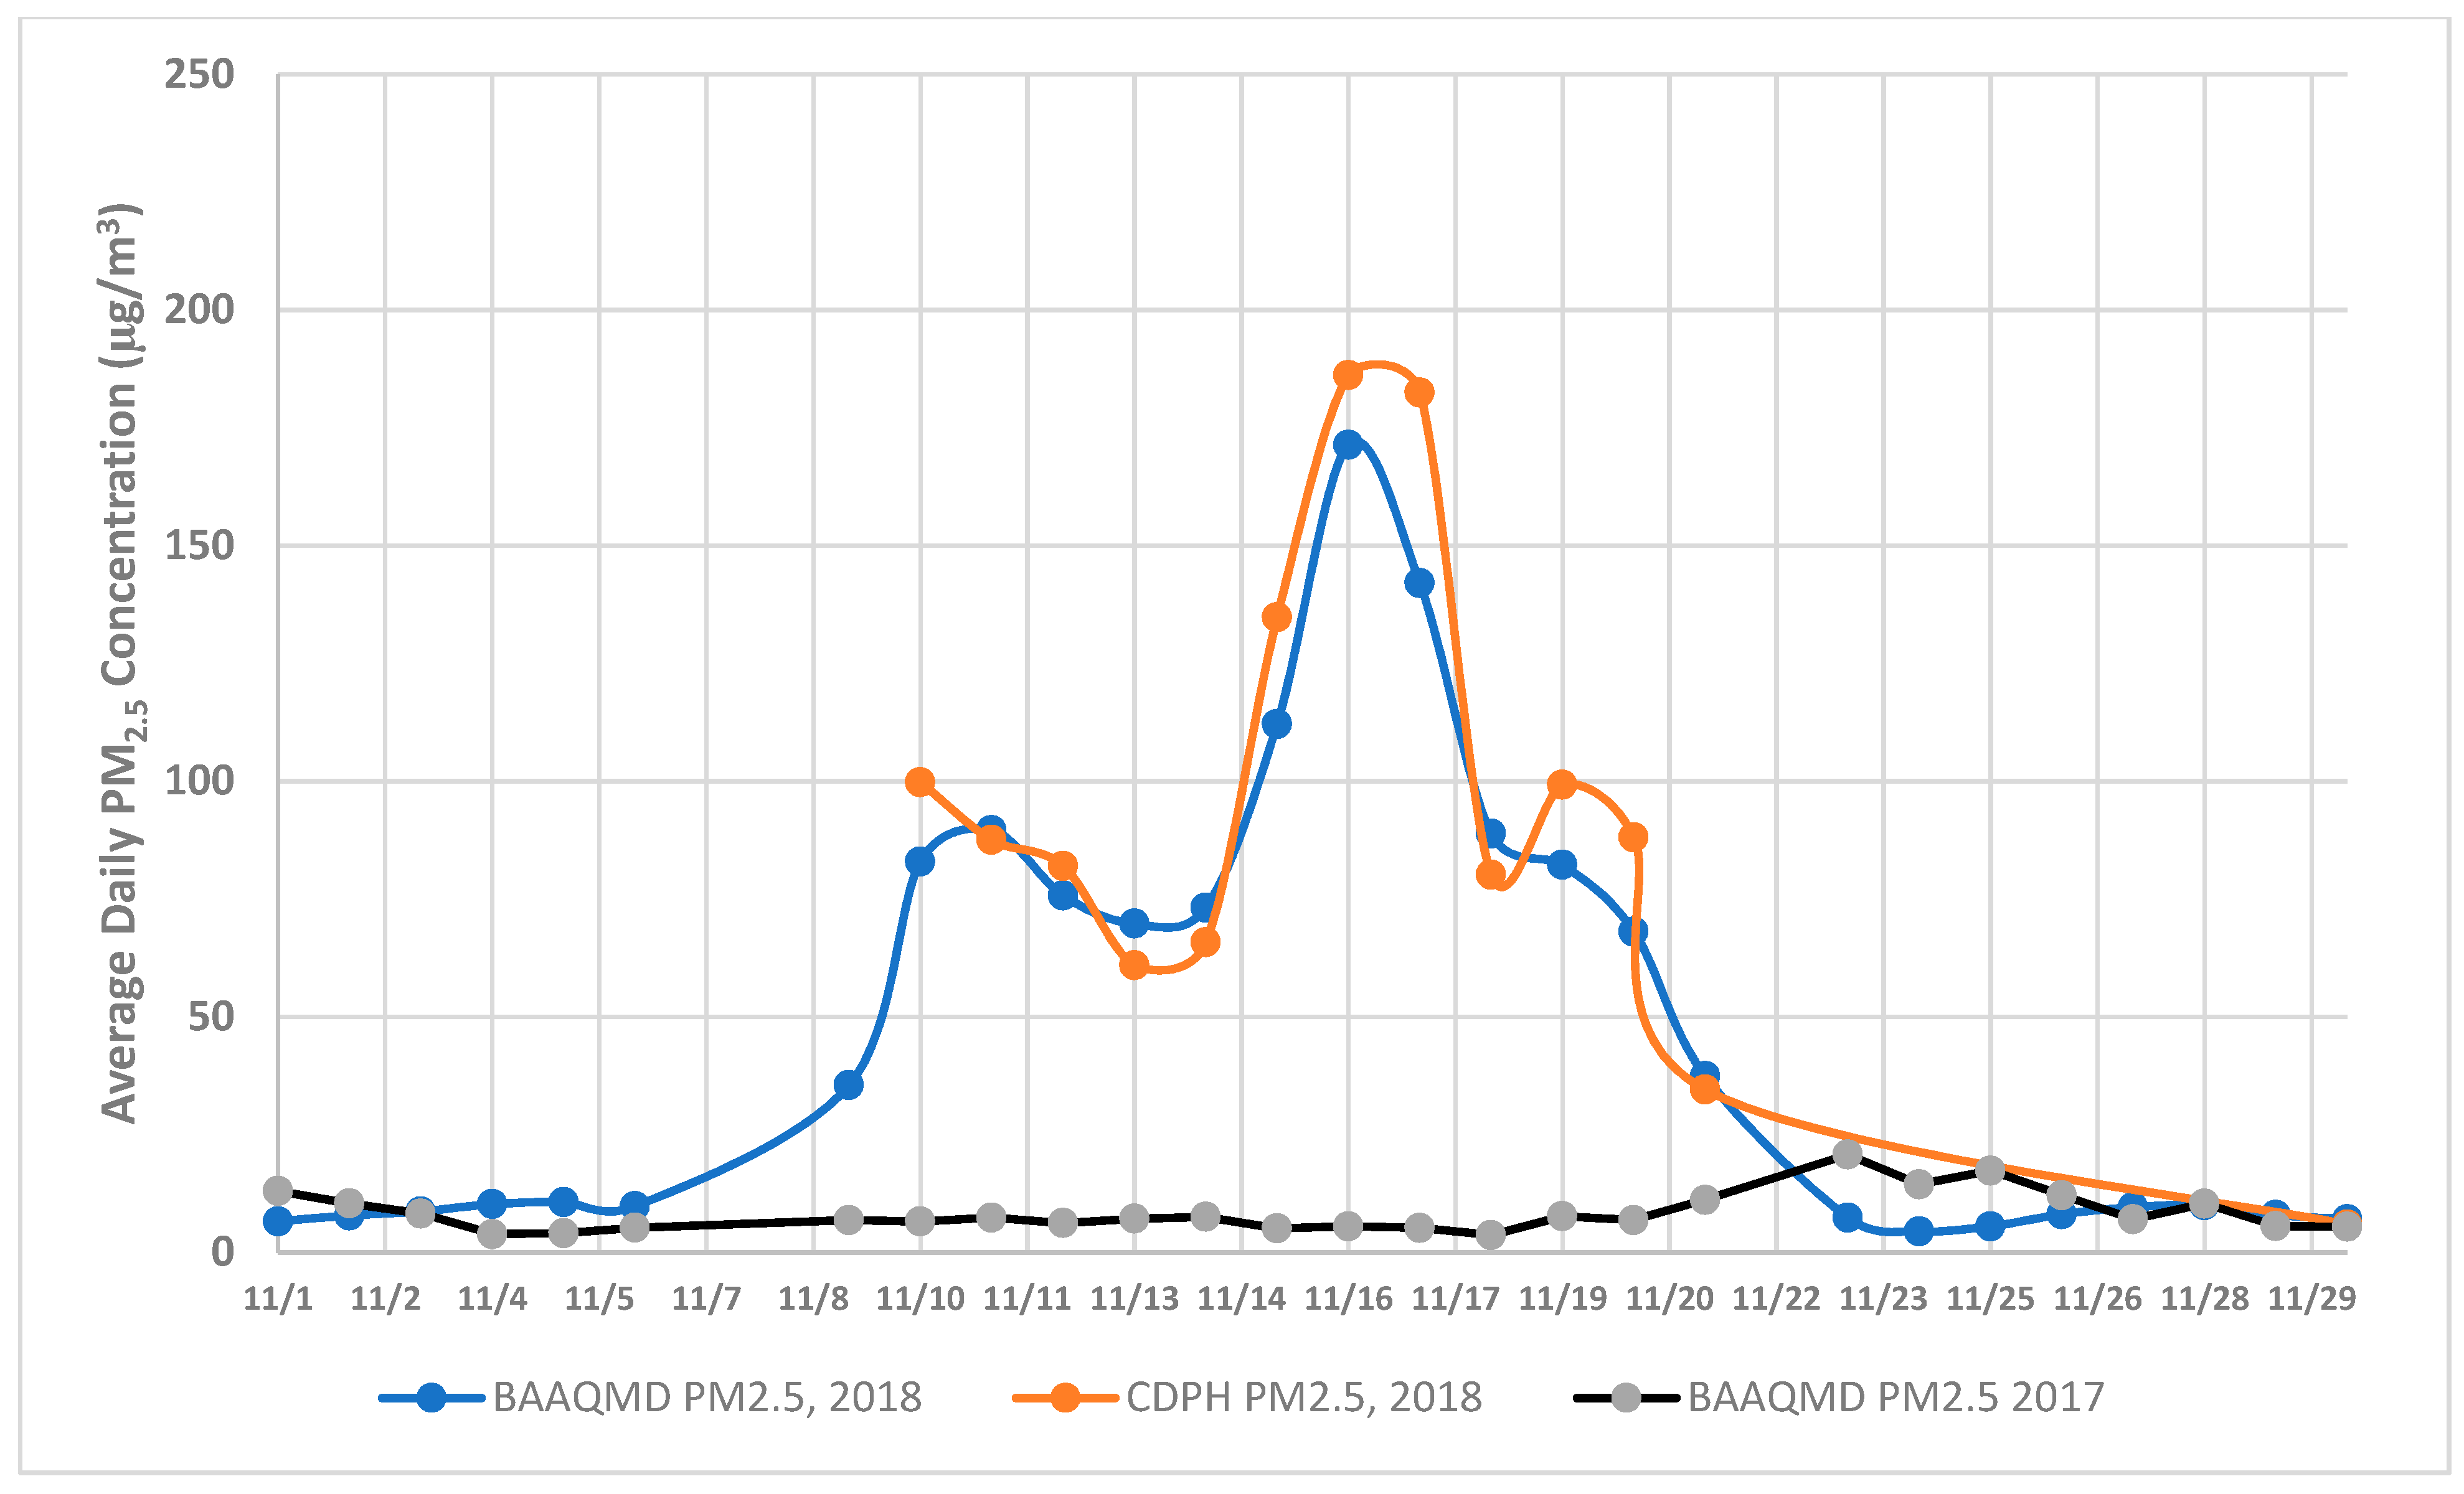
Figure 8.
Comparison of E-BAM data with BAAQMD measurements. (The orange dot line is the diagonal line).
Figure 8.
Comparison of E-BAM data with BAAQMD measurements. (The orange dot line is the diagonal line).
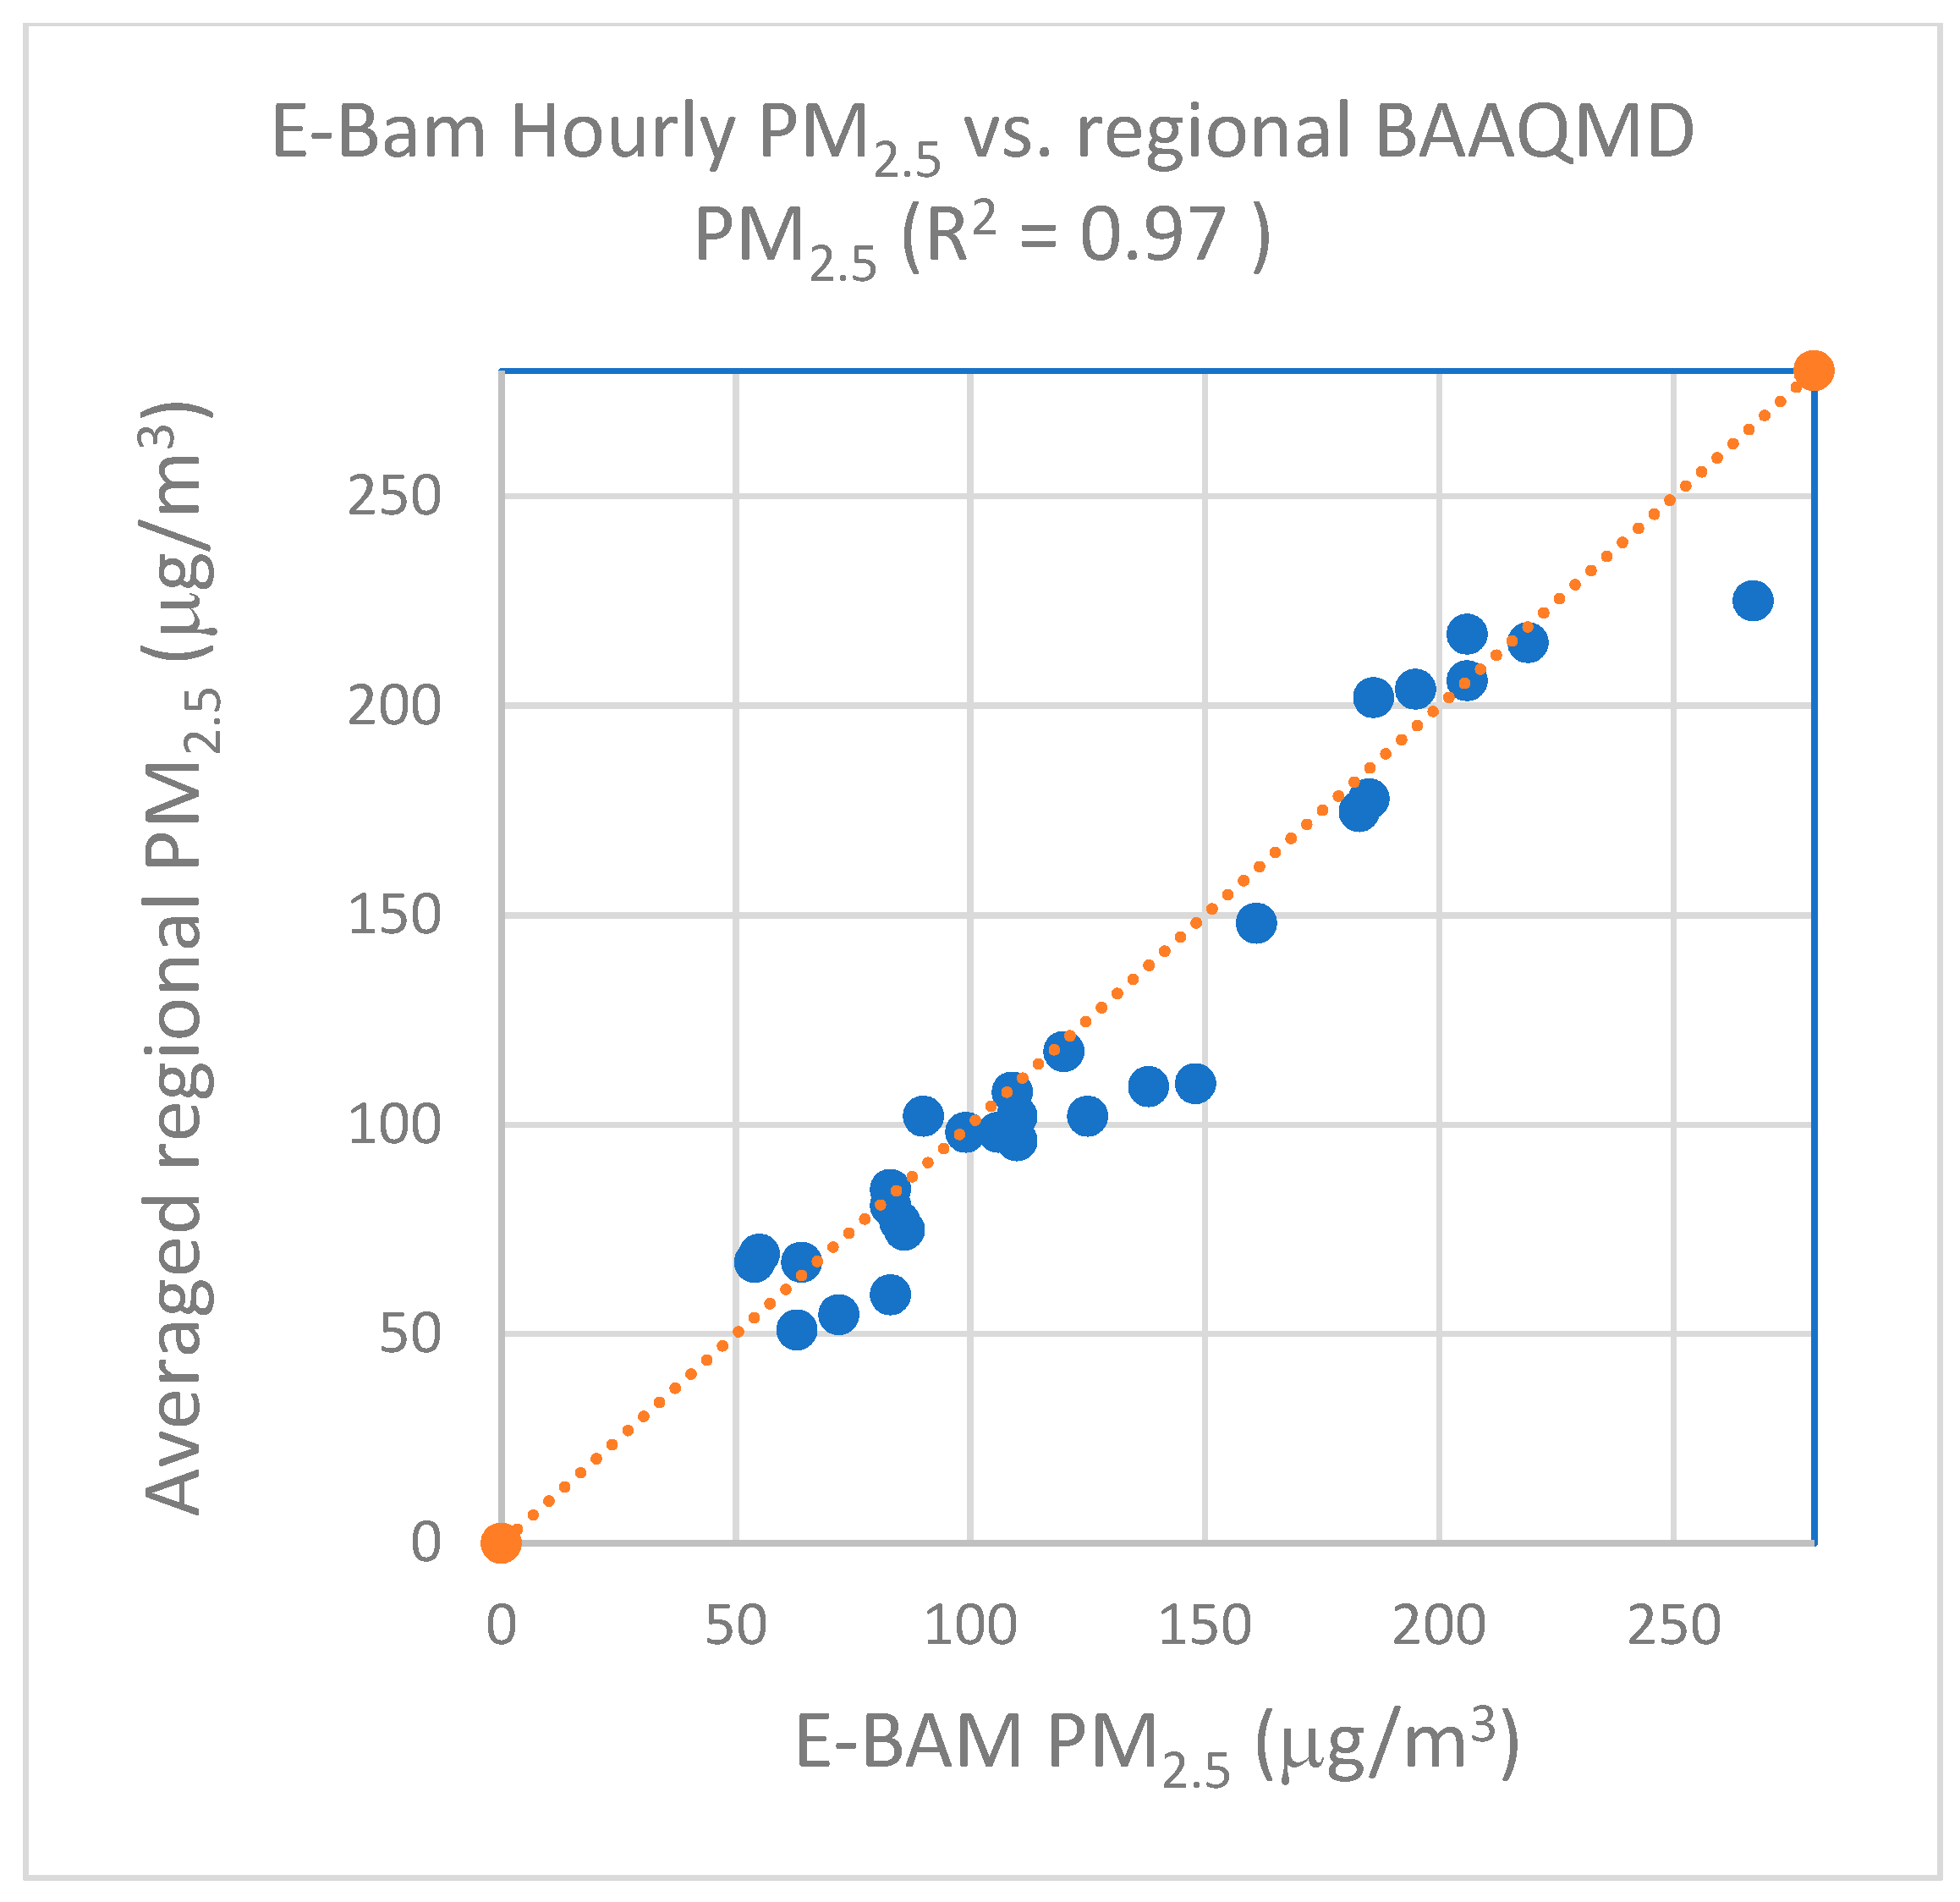
Figure 9.
(a,b) SEM images of large particles collected using the open-face passive sampler during the fire event at different magnifications; (c) elemental compositions for the measured particles in (a). Note: the copper was mainly from the copper tape substrate.
Figure 9.
(a,b) SEM images of large particles collected using the open-face passive sampler during the fire event at different magnifications; (c) elemental compositions for the measured particles in (a). Note: the copper was mainly from the copper tape substrate.

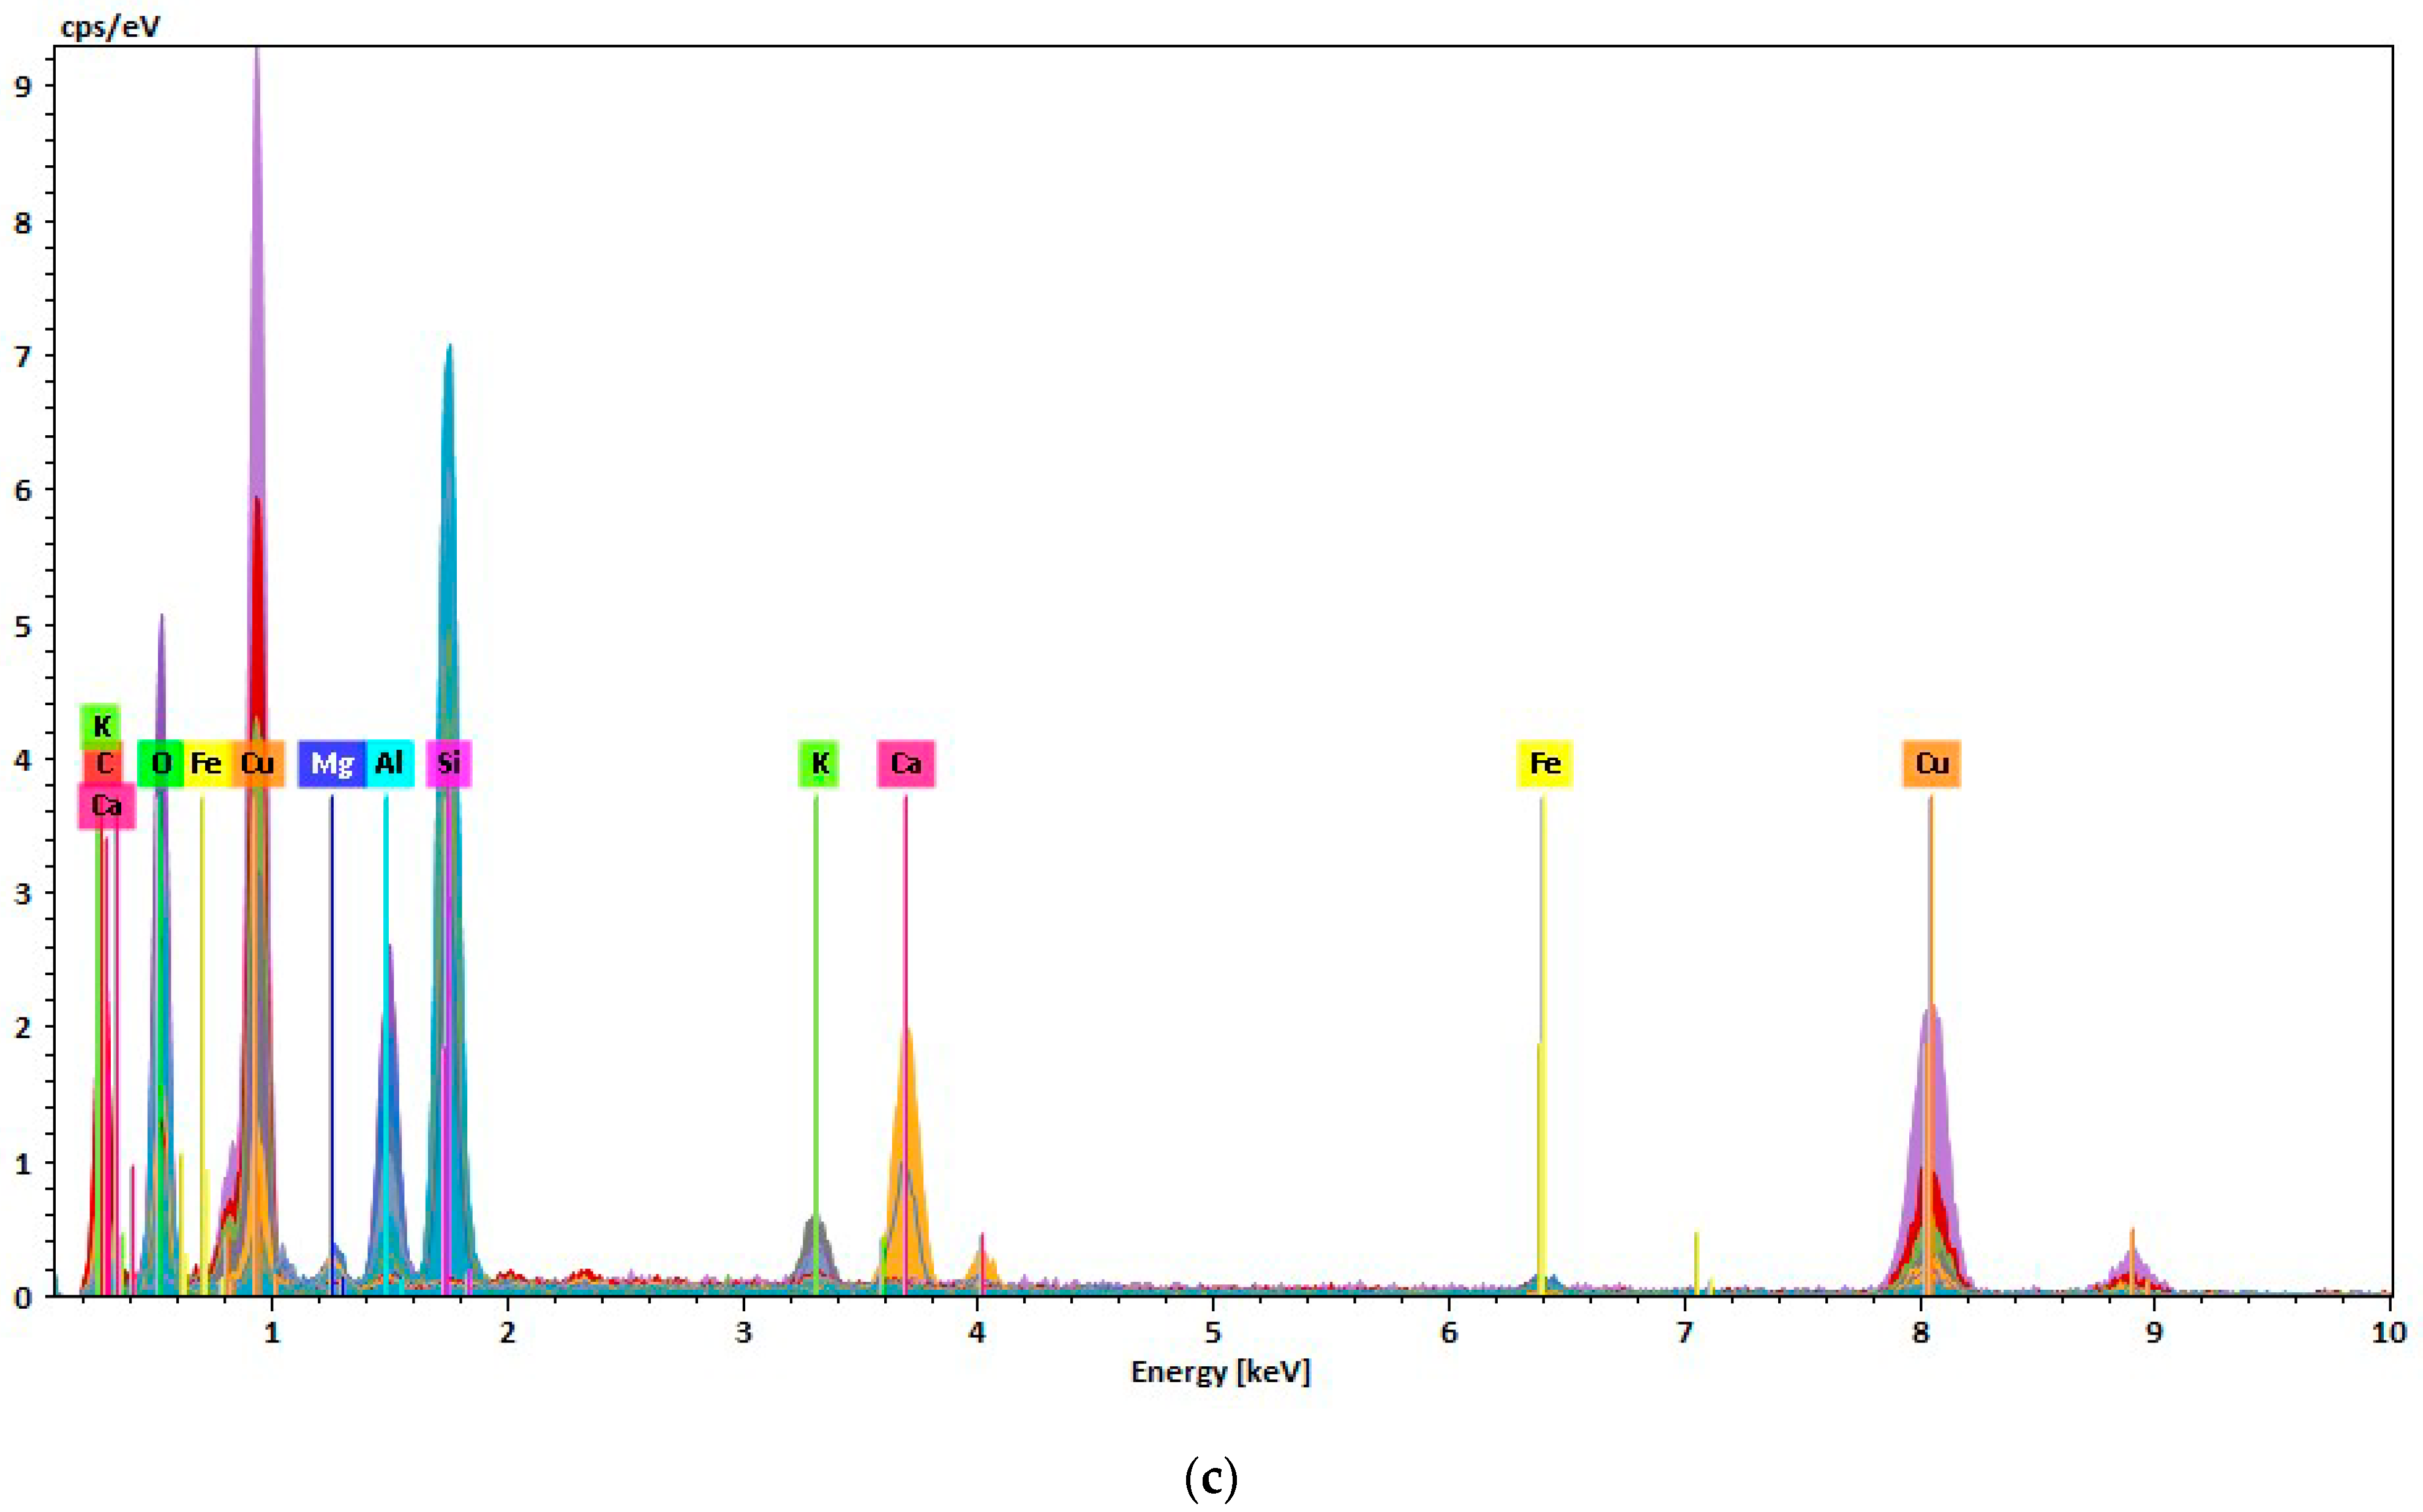
Figure 10.
SEM images of spherical particles collected using OFPS.

Figure 11.
Typical elemental images, spectra, and profiles of tar balls. (a) Only carbon and oxygen were detected for small tar balls. (b) Carbon/oxygen ratio calculation for tar ball. (c) Sulfur had been detected for some tar balls. Note: Cu was from the substrates.
Figure 11.
Typical elemental images, spectra, and profiles of tar balls. (a) Only carbon and oxygen were detected for small tar balls. (b) Carbon/oxygen ratio calculation for tar ball. (c) Sulfur had been detected for some tar balls. Note: Cu was from the substrates.
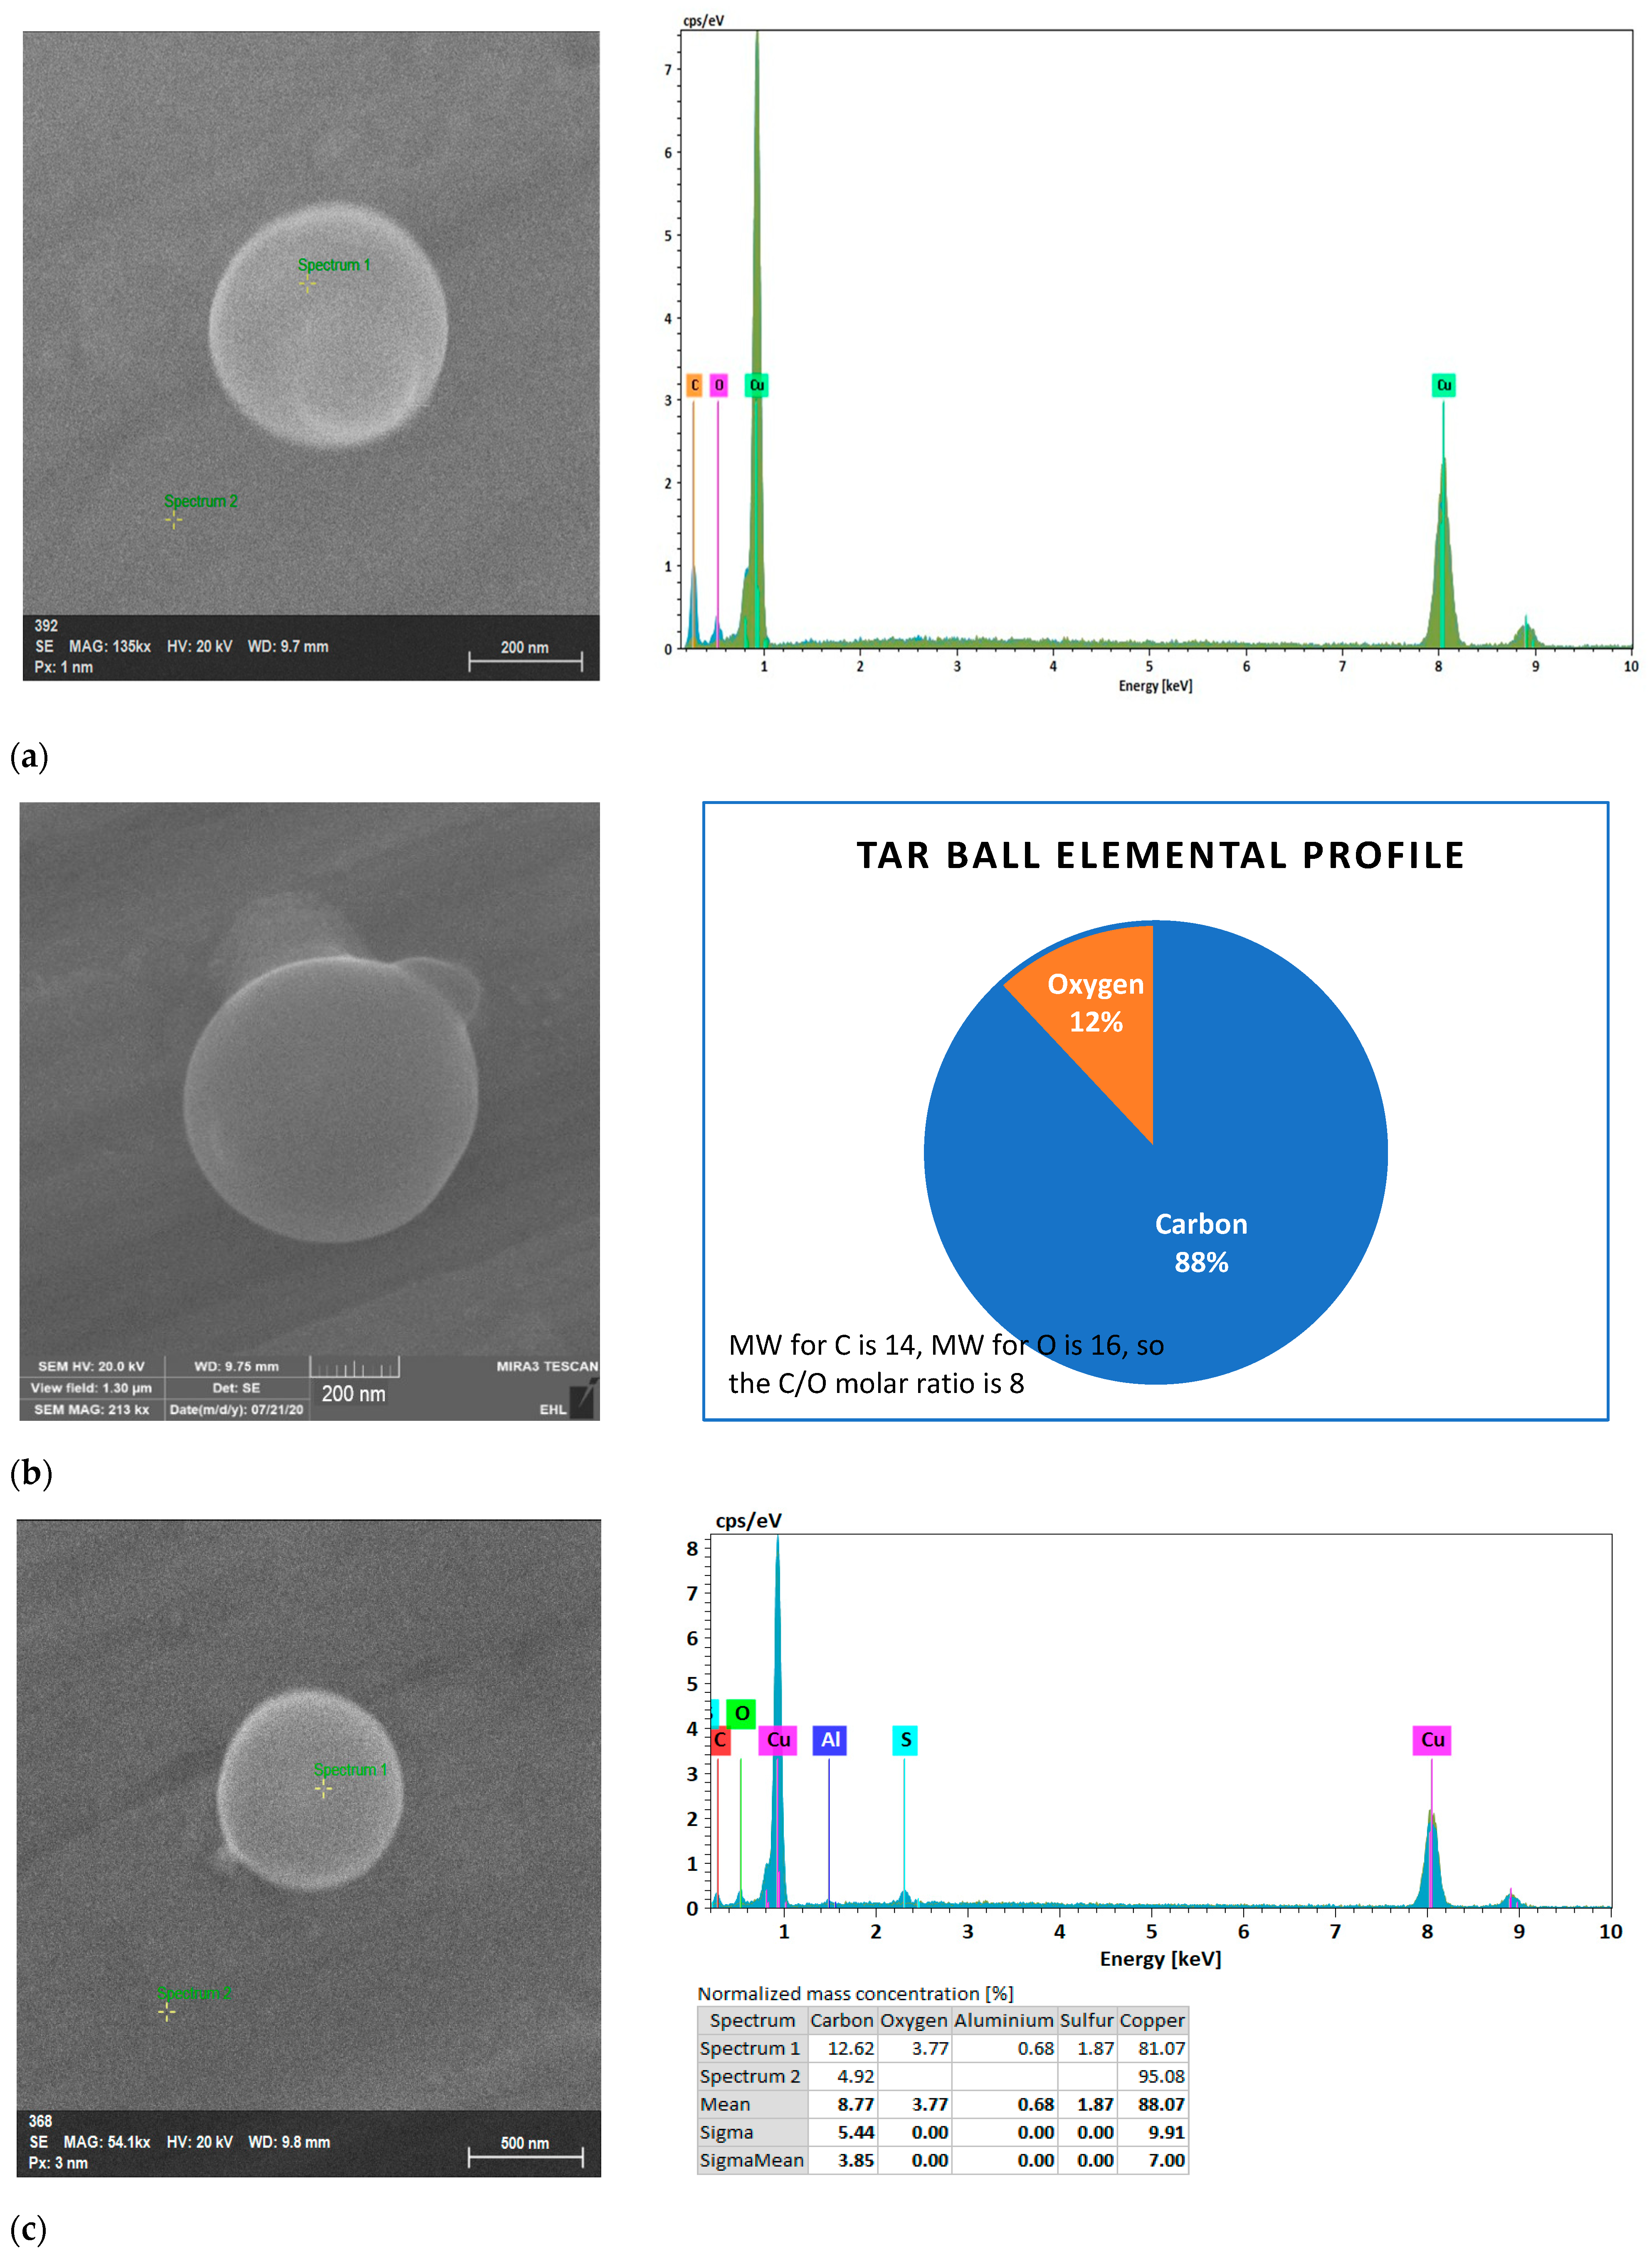
Figure 12.
Elemental profile of tar balls during the wildfire episode and example tar ball image.

Figure 13.
Overall particulate matter elemental profile during the wildfire episode.

Figure 14.
Black carbon concentration in Richmond during the Camp Fire.


Table 1.
Method detection limits (MDL) for major gas-phase chemicals.
| Compound | Name | Retention Time (RT), min | MDL, μg/m3 |
|---|---|---|---|
| 1 | carbon disulfide | 3.948 | 0.39 |
| 2 | methylacrylonitrile | 5.726 | 0.08 |
| 3 | benzene | 8.113 | 0.10 |
| 4 | toluene | 11.975 | 0.12 |
| 5 | ethylbenzene | 15.017 | 0.08 |
| 6 | m-xylene | 15.28 | 0.05 |
| 7 | p-xylene | 15.28 | 0.18 |
| 8 | styrene | 15.951 | 0.07 |
| 9 | o-xylene | 15.986 | 0.11 |
| 10 | cis-1,4-dichloro-2-butene | 16.921 | 0.08 |
| 11 | benzene, propyl- | 17.698 | 0.17 |
| 12 | benzene, 1,3,5-trimethyl- | 18.097 | 0.08 |
| 13 | 1,2,4-trimethylbenzene | 18.804 | 0.08 |
| 14 | sec-butylbenzene | 19.203 | 0.05 |
Disclaimer/Publisher’s Note: The statements, opinions and data contained in all publications are solely those of the individual author(s) and contributor(s) and not of MDPI and/or the editor(s). MDPI and/or the editor(s) disclaim responsibility for any injury to people or property resulting from any ideas, methods, instructions or products referred to in the content. |
© 2024 by the authors. Licensee MDPI, Basel, Switzerland. This article is an open access article distributed under the terms and conditions of the Creative Commons Attribution (CC BY) license (https://creativecommons.org/licenses/by/4.0/).
Share and Cite
MDPI and ACS Style
Wang, Z.-M.; Wang, P.; Wagner, J.; Kumagai, K. Impacts on Urban VOCs and PM2.5 during a Wildfire Episode. Environments 2024, 11, 63. https://doi.org/10.3390/environments11040063
AMA Style
Wang Z-M, Wang P, Wagner J, Kumagai K. Impacts on Urban VOCs and PM2.5 during a Wildfire Episode. Environments. 2024; 11(4):63. https://doi.org/10.3390/environments11040063
Chicago/Turabian StyleWang, Zhong-Min, Ping Wang, Jeff Wagner, and Kazukiyo Kumagai. 2024. "Impacts on Urban VOCs and PM2.5 during a Wildfire Episode" Environments 11, no. 4: 63. https://doi.org/10.3390/environments11040063
Note that from the first issue of 2016, this journal uses article numbers instead of page numbers. See further details here.