

Dryland Soil Carbon and Nitrogen Stocks in Response to Cropping Systems and Nitrogen Fertilization


United States Department of Agriculture (USDA), Agricultural Research Service, Northern Plains Agricultural Research Laboratory, Sidney, MT 59270, USA
Environments 2024, 11(4), 70; https://doi.org/10.3390/environments11040070
Submission received: 28 February 2024
/
Revised: 27 March 2024
/
Accepted: 30 March 2024
/
Published: 2 April 2024
(This article belongs to the Special Issue Soil Organic Carbon Assessment, 2nd Edition)
Abstract
:Innovative management practices are needed to mitigate greenhouse gas (GHG) emissions from the agricultural sector by enhancing soil carbon (C) and nitrogen (N) stocks, which serve as major reservoirs of C and N in the terrestrial ecosystem. The effect of cropping systems and N fertilization rates were examined on soil organic C (SOC) and soil total N (STN) stocks at the 0–120 cm depth from 2011 to 2018 in a dryland farm in the US northern Great Plains. Cropping systems were no-till continuous spring wheat (Triticum aestivum L.) (NTCW), no-till spring wheat–pea (Pisum sativum L.) (NTWP), no-till spring wheat–fallow (NTWF), and conventional till spring wheat–fallow (CTWF) and N fertilization rates were 0, 50, 100, and 150 kg N ha−1 applied to spring wheat. The SOC and STN were greater for NTWP than other cropping systems at most N fertilization rates and depth layers. Increasing N fertilization rate increased SOC at 0–30 cm for NTWP and NTCW, but had a variable effect on STN for various cropping systems and soil depths. The NTWP with 50–100 kg N ha−1 can enhance SOC and STN at 0–30 cm compared to other cropping systems and N fertilization rates in the US northern Great Plains.
1. Introduction
Global warming due to significant production of greenhouse gases (GHG), such as carbon dioxide (CO2) and nitrous oxide (N2O), from the agricultural sector is a major concern [1,2]. Mineralization of soil organic matter due to agricultural activities, such as tillage and fallow, can enhance both CO2 and N2O emissions and excessive application of N fertilizers beyond crops’ need can accelerate N2O emissions [3,4,5]. Innovative management strategies are needed to mitigate GHG emissions by enhancing C and N sequestrations by increasing soil C and N stocks. Dryland soils typically produce lower crop biomass, returned to the soil as crop residue due to limited precipitation than irrigated soils and occupy about 47% of the earth’s surface [6]. There is a tremendous potential for C and N sequestration in dryland soils by employing improved management practices, such as no-tillage and crop rotation, which can also improve soil health and crop yields and mitigate GHG emissions [7].
The traditional cropping system of conventional till crop fallow has not only reduced soil C and N stocks by enhancing mineralization of soil organic matter, but also reduced crop yields in the US northern Great Plains [8,9,10]. Tillage can accelerate the mineralization of organic matter by breaking down soil aggregates and incorporating crop residues into the soil [11,12]. Similarly, fallow can increase the mineralization of soil organic C (SOC) and soil total N (STN) by increasing microbial activity through increased soil temperature and water content and by reducing plant C and N inputs [9,13,14]. Because of lower crop residue C and N inputs than irrigated soils, there is a greater challenge to enhance SOC and STN stocks in dryland soils [10,15]. As a result, it takes a longer time to enhance C and N sequestrations in dryland soils [14,16].
Adoption of improved management practices can increase SOC and STN stocks in dryland soils. Numerous researchers [5,10,14,17,18] have demonstrated that no-till continuous cropping can increase SOC and STN stocks compared to conventional till crop fallow by enhancing the amount of crop residue returned to the soil in dryland cropping systems. The effect of N fertilization on SOC and STN had been variable. Some studies [11,19,20,21] showed that N fertilization increased SOC and STN at the surface soil layer (0–30 cm) compared to no N fertilization. Nitrogen fertilization increased STN but not SOC compared to no N fertilization [22,23]. Bremer et al. [24] reported that N fertilization increased SOC in continuous spring wheat more than spring wheat–fallow or spring wheat–pea rotation compared to no N fertilization. Schemer et al. [17] observed that crop rotation had a greater effect on SOC and STN than N fertilization. Other researchers [12,25], however, did not find significant effect of N fertilization on SOC and STN.
The SOC and STN can also be variable with years of experimentation. The SOC and STN increased with year due to enhanced C and N sequestration rates stemming from greater crop residue returned to the soil [11,17,25]. However, some researchers [10,18,26,27] have reported that SOC and STN declined with year from their original stocks due to inadequate amount of crop residue retuned to dryland soils in long-term experiments, regardless of cropping systems and N fertilization rates. Nitrogen fertilization, however, reduced the rate of decline in SOC and STN compared to no N fertilization [26,28]. Several researchers [14,22] showed that around 5 Mg ha−1 of crop residue returned to the soil is required to maintain SOC and STN stocks in dryland crop production.
As most studies have reported changes in SOC and STN stocks due to management practices at surface soil layers (0–30 cm), studies at deep soil layers are rare [29,30]. Because roots, that are important C and N inputs, grow more than 1 m depth, studies that account for SOC and STN stocks at deep soil layers at different depth intervals are required to evaluate the effect of management practices on C and N sequestration rates [29,30,31,32]. Variability in SOC and STN stocks, however, can be higher in subsoil than surface soil layers that could result in nonsignificant differences in SOC and STN among treatments in the subsoil layers [14,29,30]. Skadell et al. [31] reported that 79% of difference in SOC among treatments occur at 0–30 cm, 19% at 30–50 cm, and 30% at 50–100 cm.
This study focused on SOC and STN stocks to a depth of 120 cm as affected by cropping system and N fertilization rate from 2011 to 2018 in the US northern Great Plains. The research question was if no-till continuous cropping with reduced N fertilization rate can enhance SOC and STN stocks compared to conventional till crop fallow with recommended N fertilization rate in dryland cropping systems. We hypothesized that no-till spring wheat–pea with 50 kg N ha−1 would increase SOC and STN stocks compared to conventional till spring wheat–fallow with 100-150 kg N ha−1. The objectives of this study were to (1) determine the amount of crop residue C and N returned to soil after grain harvest and (2) evaluate the effect of cropping system and N fertilization rate on SOC and STN stocks at 0–120 cm from 2011 to 2018 in the US northern Great Plains.
2. Materials and Methods
2.1. Experimental Details
The field experiment was performed from 2011 to 2018 in Sidney, Montana, USA (48°33′ N, 104°50′ W). The soil at study site was a Williams loam (fine-loamy, mixed, superactive, frigid, Typic Argiustolls) having sand, silt, and clay concentrations of 350, 325, and 325 g kg−1 respectively, pH 7.2, and SOC concentration 13.2 g C kg−1 at the 0–20 cm depth at the initiation of the experiment in October 2011. The site had average monthly air temperature of 8 °C and total annual precipitation (30-year average) of 341 mm, 77% of which occurs during the crop growing season (April–August) (Table 1). The growing season and annual precipitations were greater in 2013 and lower in 2017 than the 30-year average. The previous cropping system was the conventional till spring wheat–fallow rotation.
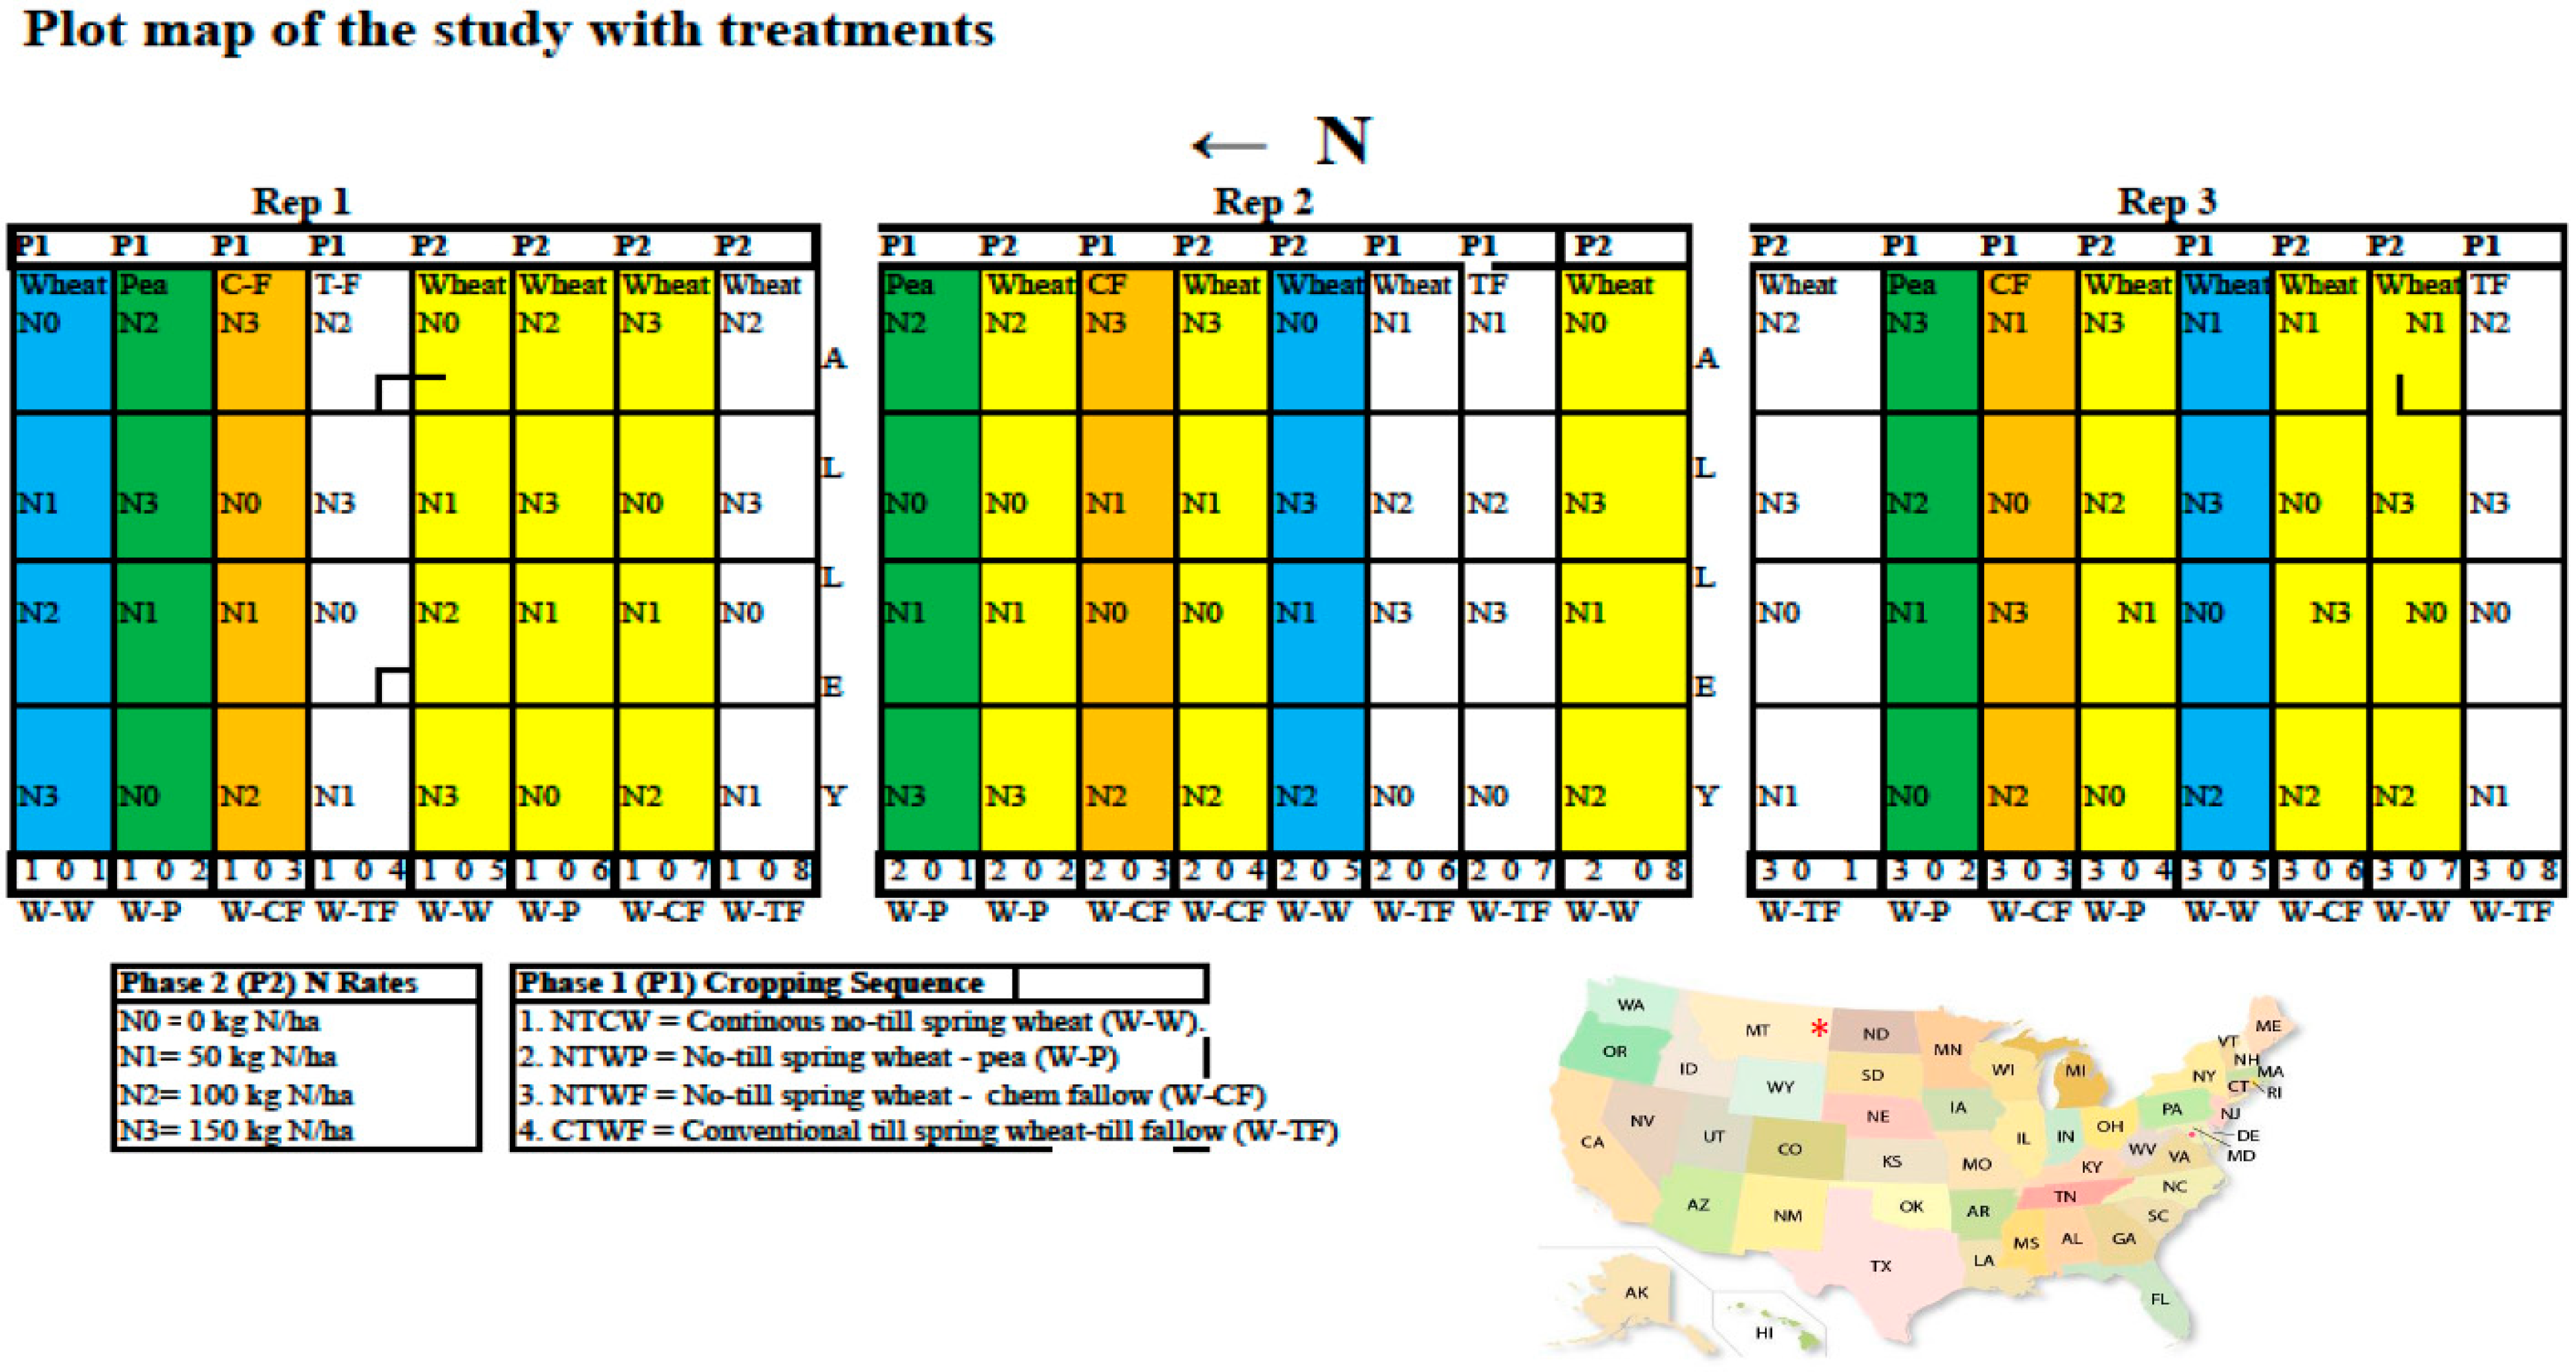
The study had four cropping systems as the main-plot and four N fertilization rates as the split-plot treatments laid out in a randomized block design with three replications (Figure 1). Cropping systems were conventional till spring wheat–fallow (CTWF), no-till spring wheat–fallow (NTWF), no-till spring wheat–pea (NTWP), and no-till continuous spring wheat (NTCW). The CTWF was the traditional cropping system where plots were tilled to a depth of 10 cm using a field cultivator equipped with C-shanks and 45-cm wide sweeps to control weeds and prepare seed bed. Plots in other cropping systems were not tilled. The NTCW is a 1-year rotation, while other cropping systems were 2-year rotations with each crop phase of the rotation appearing in every year. Nitrogen fertilization rates were 0, 50, 100, and 150 kg N ha−1 applied only to the spring wheat phase. Pea and fallow phases did not receive N fertilizer. The 100 kg N ha−1 is the recommended N fertilization rate for spring wheat around the study area. Nitrogen fertilization rates were adjusted to soil NO3-N content to a depth of 60 cm measured in the autumn of the previous year. Therefore, N fertilization rates included both soil and fertilizer N and are considered as soil-available N to plant, in order to reduce excessive N fertilization rates for crops and N loss to the environment. The plot size for the main treatment was 48 m × 6 m and the split treatment was 12 m × 6 m.
In late April of every year from 2012 to 2018, using a no-till drill, spring wheat was sown at 80 kg ha−1 and pea at 90 kg ha−1. Pea seeds were inoculated with proper Rhizobium sp. before sowing. At the same time, P fertilizer as triple super phosphate at 11 kg P ha−1 and K fertilizer as muriate of potash at 27 kg K ha−1 were banded to spring wheat and pea at 5 cm to the side and 5 cm below seeds. Nitrogen fertilizer as urea at designated rates was broadcast to spring wheat, a week after sowing. The fallow treatment did not receive any P and K fertilizers. Crops were grown in the dryland condition and were not irrigated. Spring wheat and pea received proper herbicides and pesticides to control weeds and pests. Two days before grain harvest in late July to mid-August every year, plants were cut using a knife from an area of 0.4 m2 at a height of 2 cm above the ground from two locations outside yield rows within a plot and composited within a plot. After removing grains, crop residue (stems and leaves) yield was determined by oven drying the residue at 70 °C for 3 d. Grain yield was determined by harvesting grains from an area of 11.0 m × 1.5 m and oven drying a sample at 70 °C for 7 d. After grain harvest, crop residue was returned to the soil.
2.2. Crop and Soil Sample Collection and Analysis
For determining crop residue C and N contents, oven-dried crop residue was ground to 1 mm. The C and N concentrations in the residue were determined using a C and N analyzer on a portion of composited ground residue (Model CN 928, LECO, St. Joseph, MI, USA). Crop residue C and N contents were determined by multiplying the residue yield by C and N concentrations.
In October 2011, 2013, 2015, and 2018, soil samples were collected at the 0–120 cm depth using a hydraulic probe (3.5 cm inside diameter) mounted in a truck from five locations within a split plot. The soil core was separated into six depth intervals (0–5, 5–10, 10–30, 30–60, 60–90, and 90–120 cm), composited within a depth, air-dried, ground, and sieved to 2 mm. A sample (10 g) of the soil was oven dried at 105 °C for 24 h. Soil bulk density was determined by dividing the weight of the oven-dried soil by the volume of the core. A sample of air-dried soil was further ground to 0.5 mm and pretreated with 6 M HCl to remove inorganic C. The SOC and STN concentrations in the pretreated soil was determined using a C and N analyzer as above. The SOC and STN stocks at each depth interval were determined by multiplying SOC and STN concentrations by the bulk density and the thickness of the soil layer and adjusted for each treatment using the equivalent soil mass method [33]. Total SOC and STN stocks at 0–120 cm were calculated by adding stocks from individual depth layers.
2.3. Statistical Analysis of Data
Crop residue C and N and SOC and STN stocks at a depth were analyzed using the SAS-MIXED model [34]. The main-plot treatment was cropping system, split-plot treatment was N fertilization rate, and repeated measure variable was year. The fixed effects were cropping system, N fertilization rate, and cropping system × N fertilization rate interaction and random effects were replication and replication × cropping system interaction. For data analysis, crop residue C and N for 2-year rotations were calculated by averaging residue C and N of each crop phase within a rotation in every year. In the calculation, residue C and N for the fallow phase were considered zero due to the absence of crops during the fallow period. The means and interactions were separated by using the least-square means test [34] when significant. Because N fertilization rate was a quantitative variable, regression analysis was used to determine the relationship between N fertilization rate and SOC and STN stocks for each cropping system. Similarly, regression analysis was used to determine the relationship between year and SOC and STN stocks after considering that 2011, 2013, 2015, and 2018 represented year 0, 2, 4, and 7, respectively. Statistical significance was evaluated at p ≤ 0.05, unless stated otherwise.
3. Results
3.1. Crop Residue Carbon and Nitrogen
Crop residue C and N returned to the soil were significantly affected by cropping system, N fertilization rate, and year, but treatment interactions were not significant (Table 2). Both crop residue C and N, averaged across N fertilization rates and years, were 11–49% greater for NTWP than NTCW, CTWF, and NTWF and 26–32% greater for NTCW than CTWF and NTWF. Averaged across cropping systems and years, crop residue C was 18–20% greater for 100 and 150 than 0 kg N ha−1. Crop residue N was 19–30% greater for 50, 100, and 150 than 0 kg N ha−1. Averaged across cropping systems and N fertilization rates, crop residue C and N were greater in 2016 than other years.
3.2. Soil Bulk Density
Soil bulk density was significantly affected by cropping system at 90–120 cm and by N fertilization rate at 5–10, 10–30, 30–60, and 90–120 cm (Table 3). The cropping system × N fertilization rate interaction was significant at all depth layers. Averaged across years, soil bulk density varied among cropping systems and N fertilization rates at various depth intervals (Figure 2). However, bulk density was usually greater for CTWF and NTWF than NTCW and NTWP at most N fertilization rates and soil depths. Lack of crops and root growth during the fallow period may have increased bulk density for CTWF and NTWF because increased root growth reduces bulk density [35]. Bulk density, however, showed variable trends with N fertilization rates for various cropping systems and soil depths. It is expected that variations in bulk density will affect SOC and STN stocks among cropping systems and N fertilization rates at different depth layers in various years.
3.3. Soil Organic Carbon
The SOC was affected by N fertilization rate at 5–10, 60–90, and 90–120 cm and by year at 10–30 and 60–90 cm (Table 3). The cropping system × N fertilization rate interaction was significant for SOC at all soil depths. Averaged across years, SOC at 0–5 cm was greater for NTWF than NTWP and NTCW at 0 kg N ha−1, and greater for NTWP than CTWF at 50 and 150 kg N ha−1 (Figure 3). At 5–10 cm, SOC was greater for CTWF than NTWP at 0 kg N ha−1, greater for NTWP than NTWF or NTCW at 50 and 150 kg N ha−1, and greater for NTWF than NTWP at 100 kg N ha−1. At 10–30 cm, SOC was greater for NTWP than other cropping systems at 100 and 150 kg N ha−1. At 30–60 cm, SOC was greater for NTWP than other cropping systems at 0 and 100 kg N ha−1, and greater for CTWF than NTCW and NTWP at 50 kg N ha−1.
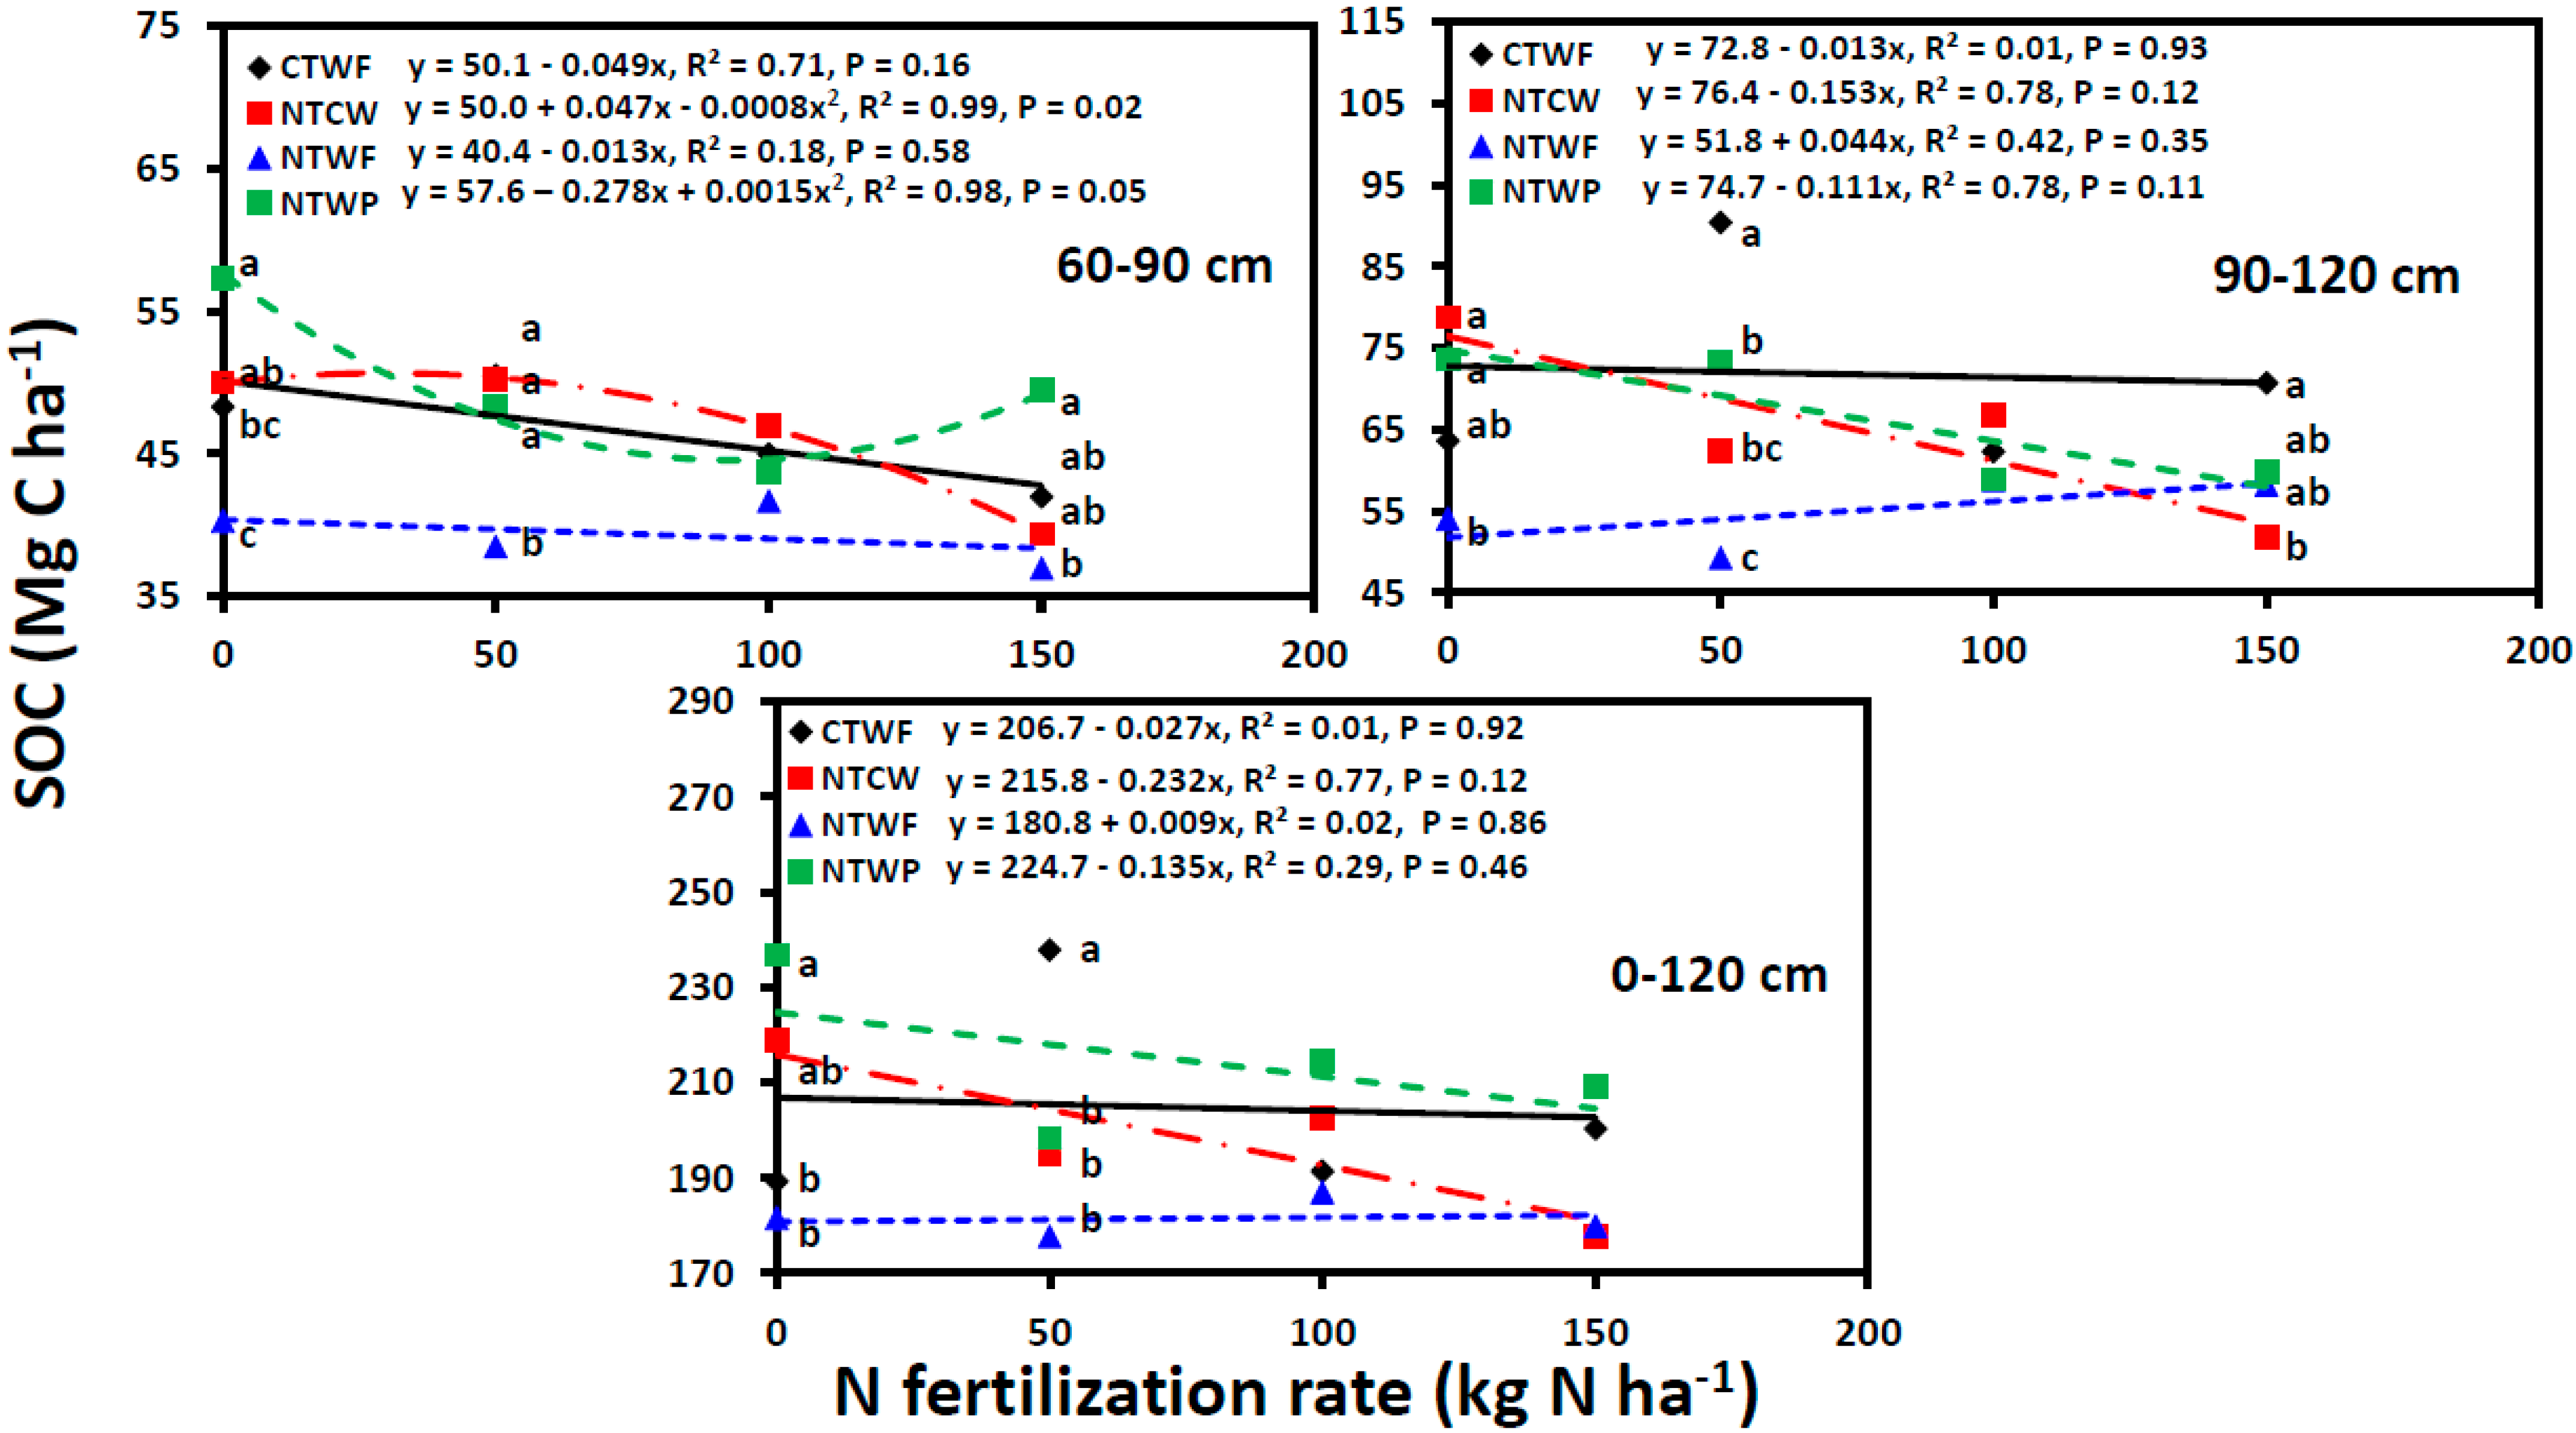
At 60–90 cm, SOC was greater for NTWP than CTWF or NTWF at 0 and 150 kg N ha−1, and greater for NTCW, NTWP, and CTWF than NTWF at 50 kg N ha−1 (Figure 4). At 90–120 cm, SOC was greater for NTCW and NTWP than NTWF at 0 kg N ha−1, and greater for CTWF than NTWP, NTCW, or NTWF at 50 and 150 kg N ha−1. At 0–120 cm, SOC was greater for NTWP than CTWF and NTWF at 0 kg N ha−1, and greater for CTWF than other cropping systems at 50 kg N ha−1.
Increasing N fertilization rate tended to increase SOC at 0–5, 5–10, and 10–30 cm, but tended to decrease at 30–60, 90–120, and 0–120 cm for NTWP (Figure 3 and Figure 4). Similarly, increasing N fertilization rate tended to increase SOC at 0–5 cm, but tended to decrease at 60–90, 90–120, and 0–120 cm for NTCW. For CTWF and NTWF, changes in SOC with increasing N fertilization rate were minor, except for NTWF at 5–10 cm, where SOC tended to increase with increasing N fertilization rate. Significant nonlinear relationships occurred between SOC and N fertilization rate for NTWF at 0–5 and 30–60 cm, for NTCW at 5–10, 10–30, and 60–90 cm, and for NTWP at 60–90 cm.
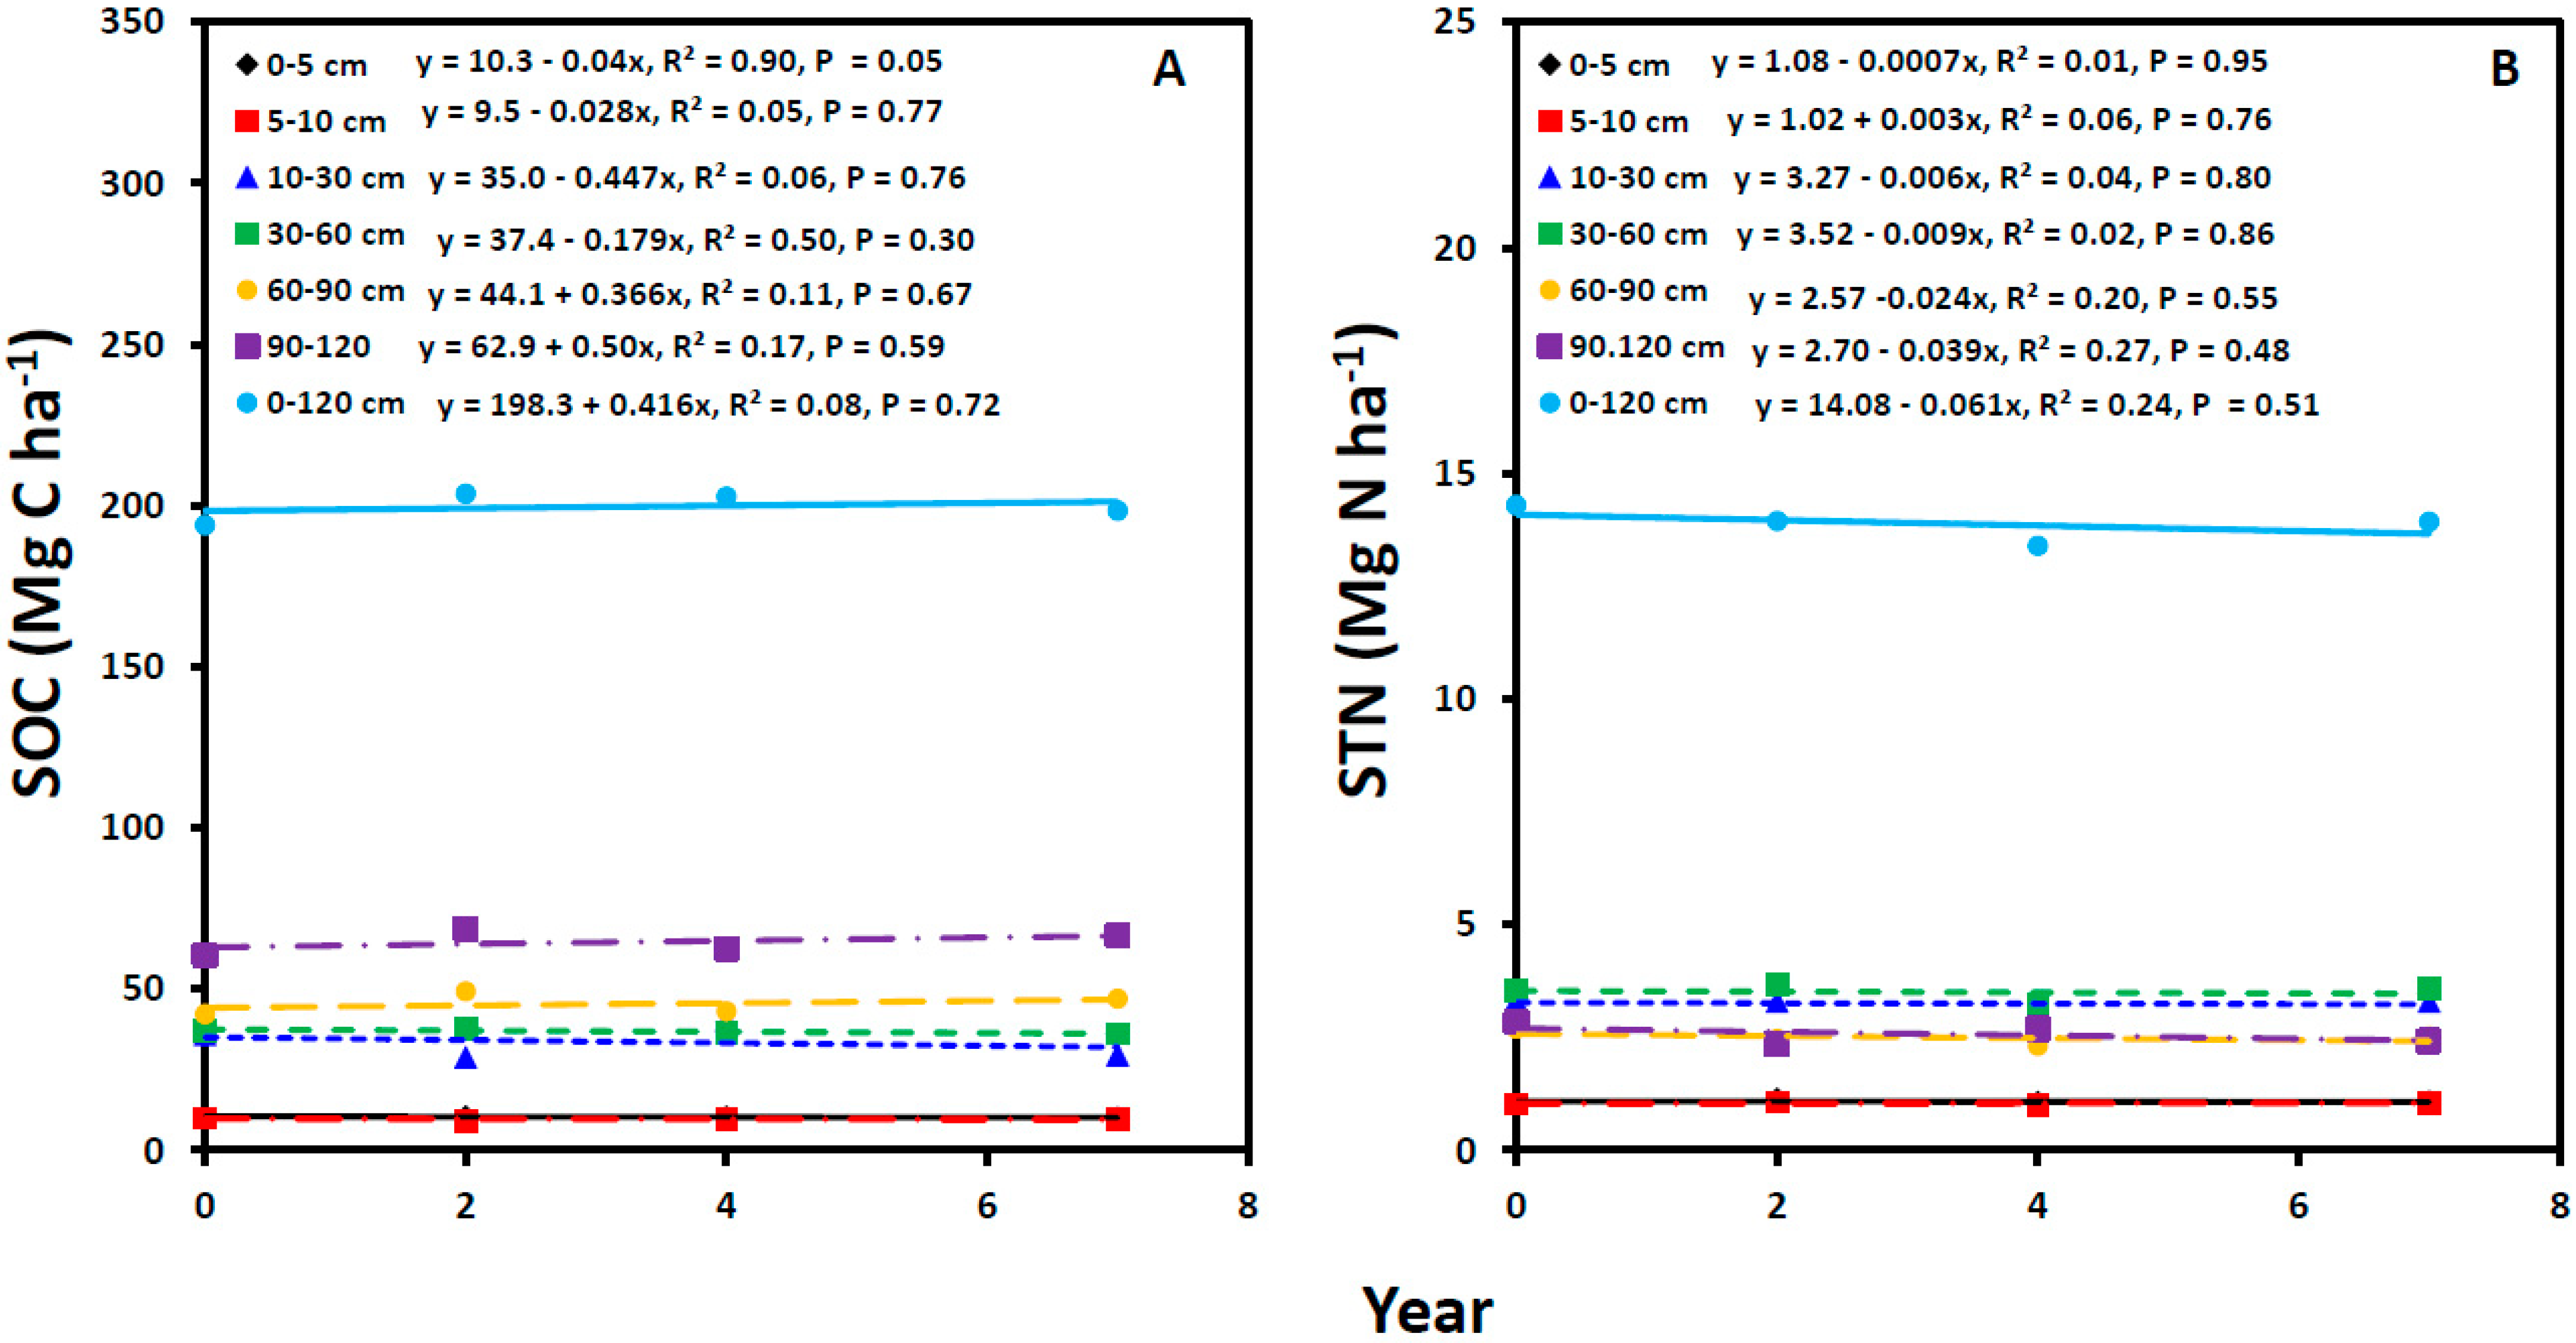
Averaged across cropping systems and N fertilization rates, SOC tended to decrease with year at 0–5, 5–10, 10–30, and 30–60 cm, but tended to increase at 60–90, 90–120, and 0–120 cm (Figure 5A). A significant linear relationship between SOC and year occurred only at 0–5 cm, where SOC decreased by 0.04 Mg C ha−1 year−1. A significant nonlinear relationship between SOC and crop residue C occurred at 0–5 cm where SOC was greater at 0.7 and 1.3 Mg C ha−1 of crop residue C, but lower at 1.0 Mg C ha−1 of residue C (Figure 6A). There was no significant relationship between SOC and crop residue C at other soil depths.
3.4. Soil Total Nitrogen
The STN was significantly affected by N fertilization rate at 5–10 and 30–60 cm and by year at all soil depths, except at 0–5 cm (Table 3). The cropping system × N fertilization rate interaction was significant at all soil depths. The STN at 0–5 cm, averaged across years, was greater for NTWF and CTWF than NTCW at 0 kg N ha−1, and greater for NTWP than CTWF or NTCW at 50 and 100 kg N ha−1 (Figure 7). At 5–10 cm, STN was greater for CTWF than NTWF at 0 kg N ha−1, greater for NTWP and NTCW than other cropping systems at 50 kg N ha−1, and greater for NTWF than CTWF, NTWP, or NTCW at 100 and 150 kg N ha−1. At 10–30 cm, STN was greater for NTWP than CTWF or NTCW at 0 and 100 kg N ha−1, and greater for CTWF than NTCW or NTWP at 50 and 150 kg N ha−1. At 30–60 cm, STN was greater for NTWF, NTWP, and NTCW than CTWF at 0 kg N ha−1. At 60–90 cm, STN was greater for NTWP than NTCW, CTWF, or NTWF at 0 and 150 kg N ha−1, and greater for NTWF and CTWF than NTCW at 50 kg N ha−1 (Figure 8). At 90–120 cm, STN was greater for NTWP than NTWF, CTWF, or NTCW at all N fertilization rates. At 0–120 cm, STN was also greater for NTWP than NTCW or CTWF at 0 and 50 kg N ha−1.
Increasing N fertilization rate tended to increase SON at 5–10, 10–30, 30–60, and 0–120 cm for CTWF, and at 5–10 and 10–30 cm for NTWF, but tended to decrease at 90–120 cm for NTWF (Figure 7 and Figure 8). Similarly, increasing N fertilization rate tended to increase STN at 0–5, 30–60, 60–90, and 120 cm for NTCW, and at 60–90 cm for NTWP, but tended to decrease at 10–30, 30–60, 90–120, and 0–120 cm for NTWP. Significant linear relationship between STN and N fertilization rate occurred for NTCW at 30–60 cm where an increase in N fertilization rate by 1 kg N ha−1 increased STN by 0.002 Mg N ha−1. A significant nonlinear relationship between STN and N fertilization rate occurred for NTWP at 0–5 and 5–10 cm, for NTWF at 10–30 and 60–90 cm, and for NTCW at 90–120 cm. Averaged across cropping systems and N fertilization rates, STN tended to decrease with year at all depths, except at 5–10 cm which tended to increase (Figure 5B). There was no relationship between STN and crop residue N returned to the soil at any soil depth (Figure 5B).
4. Discussion
4.1. Crop Residue Carbon and Nitrogen
Presence of crops every year resulted in greater crop residue C and N returned to the soil for NTCW and NTWP than CTWF and NTWF (Table 2). In NTWF and CTWF, no crops were present during the fallow period, which reduced the average amount of crop residue C and N, although the fallow period enhances yields of grain and crop residue of succeeding crops due to soil water conservation by fallow [36,37]. The greater crop residue C and N for NTWP than NTCW was probably due to the benefit of pea, a legume, on spring wheat in the rotation. These benefits are (1) greater N supplied by pea residue due to its higher N concentration from biological N fixation than spring wheat, (2) lower water use by pea due to its earlier maturity than spring wheat, thereby resulting in more water available for succeeding spring wheat, and (3) reduced weed and pest pressure in the crop rotation compared to monocropping [37,38,39]. The nonsignificant difference in crop residue C and N between CTWF and NTWF suggests that tillage had no effect on residue C and N.
It is not unusual to observe greater crop residue C and N for 50, 100, and 150 than 0 kg N ha−1 (Table 2) because N fertilization enhances biomass yield and crop production compared to no N fertilization due to increased N availability [40,41]. However, nonsignificant differences in crop residue C and N among 50, 100, and 150 kg N ha−1 suggest that low N fertilization rate produces similar crop residue C and N as high N fertilization rates, which could be excessive to produce sustainable amount of crop residue C and N. Growing season (April–August) precipitation (265 mm) close to the 30-year average (262 mm) and its evenly distribution during the crop growth may have produced higher crop residue C and N in 2016 than other years (Table 1 and Table 2). Although precipitation was higher in 2013 and 2014, most of it fell either during the early or late part of the crop growth, rendering less water available during active crop growth in June and July and decreasing crop residue C and N.
4.2. Soil Organic Carbon
The greater amount of crop residue C returned to the soil (Table 2) likely increased SOC for NTWP than other cropping systems at most N fertilization rates and soil depths (Figure 3 and Figure 4). Increased SOC due to greater crop residue returned to the soil has been reported by many researchers [5,10,14,17,18]. Schmer et al. [17] reported that crop rotation increased SOC compared to monocropping due to greater crop residue C returned to the soil. Lower crop residue C due to the absence of crops during the fallow period likely reduced SOC for CTWF and NTWF at most soil depths. However, there was no linear relationship between crop residue C and SOC, rather the relationship was nonlinear at 0–5 cm (Figure 6). The reasons for lower SOC at 1 Mg C ha−1 of crop reside C were not known. It may be possible that the priming effect of fresh crop residue that enhances the mineralization of native SOC reduced SOC at 1 Mg ha−1 of crop residue C [13,22]. Because of the nonsignificant difference in SOC between CTWF and NTWF at most N fertilization rates at surface soil layers (0–30 cm), tillage had no effect on SOC in dryland cropping systems. Furthermore, the amount of crop residue C returned to the soil was similar between CTWF and NTWF (Table 2). Shallow tillage to a depth of 10 cm probably had limited impact on SOC in dryland soils.
The increased tendency of SOC with increasing N fertilization rate for NTWP, NTCW, and NTWF at 0–5, 5–10, and 10–30 cm (Figure 3) was also probably due to greater crop residue C returned to the soil as well as enhanced C input from root residue, as N fertilization favors both root and shoot biomass growth compared to no N fertilization [42,43]. Nitrogen fertilization clearly increased crop residue C compared to no N fertilization (Table 2). Increased SOC with increasing N fertilization rate at surface soil layers has been reported by numerous researchers [11,19,20,21]. However, little to no response of SOC with increasing N fertilization rate for CTWF was probably due to the nonsignificant effect of N fertilization crop residue C, as tillage and fallow increase soil inorganic N level and N fertilization has little effect on crop yield compared to no N fertilization in this cropping system [14,44]. Bremer et al. [24] showed that N fertilization increased SOC compared to no N fertilization more on continuous spring wheat than spring wheat–fallow or spring wheat–pea rotation. The reasons for decreased tendency of SOC with increasing N fertilization rate for NTWP and NTCW at 30–120 cm were not known. A possible reason may be lower C/N ratio of the soil with increasing N fertilization rate that increases C mineralization at the subsurface layers. This also resulted in decreased tendency of SOC with increasing N fertilization rate for NTWP and NTCW, but not for CTWF and NTWF at 0–120 cm (Figure 4).
The results of this study suggest that NTWP with 50–100 kg N ha−1 can enhance SOC stock at the surface soil layers (0–30 cm) compared to other treatments in dryland cropping systems of the US northern Great Plains. Previous studies on barley also indicated that no-till barley–pea rotation with 40–80 kg N ha−1 increased SOC stock at surface layers (0–30 cm) both in dryland and irrigated cropping systems [44,45]. Liu et al. [46] reported that reducing N fertilization rate by 25% increased SOC at 0–40 cm compared to full N rate (210 kg N ha−1) under dry cropping systems in northern China.
Lack of enough crop residue production in dryland cropping systems may be one of the reasons for decreasing tendency of SOC with year at 0–5, 5–10, 10–30, and 30–60 cm, regardless of cropping system and N fertilization (Figure 5A). Considering that crop residue contains 40% C [22,39,40], the maximum amount of crop residue production in this study would be 3.1 Mg ha−1 for NTWP or 4.8 Mg ha−1 during the favorable weather in 2016 (Table 2). The average crop residue production across all treatments, however, was 2.5 Mg ha−1, which is half of the amount (5 Mg ha−1) of crop residue production required to maintain SOC level in dryland cropping systems [22,40]. Reduced SOC with increased years of experimentation have also been noted by numerous researchers [10,26,27,28]. However, there were increasing tendency of SOC with year at 60–90, 90–120, and 0–120 cm, suggesting that increased C inputs from roots and reduced C mineralization due to less undisturbed soil condition may favor SOC accumulation at the subsurface layers.
4.3. Soil Total Nitrogen
Unlike SOC, STN varied with cropping systems at various N fertilization rates and soil depths. However, greater STN with 50 and 100 kg N ha−1 at 0–5 cm, with 50 kg N ha−1 at 5–10 cm, with 100 kg N ha−1 at 10–30 cm, with 150 kg N ha−1 at 60–90 cm, and with all N fertilization rates at 90–120 and 0–120 cm for NTWP than other cropping systems (Figure 7 and Figure 8) indicate that greater crop residue N returned to the soil increased STN for this cropping system. Crop residue N returned to the soil was greater for NTWP than other cropping systems and greater with than without N fertilization (Table 2). Increased STN for cropping systems with increasing crop residue N returned to the soil has been reported by several researchers [5,10,14,17,18]. As with SOC, similar crop residue N returned to the soil probably resulted in the nonsignificant difference in STN between CTWF and NTWF at most N fertilization rates in surface soil layers (0–30 cm), indicating that tillage had no effect on STN.
Application of N fertilizer every year may have resulted in the increased tendency of STN to occur with increasing N fertilization rate for NTCW at 0–5, 5–10, 30–60, 60–90, and 0–120 cm (Figure 7 and Figure 8). It is likely that part of the applied N fertilizer may have transferred to STN through microbial immobilization. Nitrogen fertilizer was applied to every year in NTCW compared to once in two years in other cropping systems, as pea and fallow did not receive N fertilizer. Several researchers [22,23] showed that N fertilization increased STN more than SOC compared to no N fertilization and that this occurred more in continuous cropping than crop fallow. Increased tendency of STN with increasing N fertilization rate for CTWF and NTWF at several soil depths was also likely due to increased soil N availability, part of which may have transferred into STN through immobilization. However, the decreased tendency of STN with increasing N fertilization rate for NTWP was likely due to increased mineralization of STN, as N fertilization may have decomposed pea residue faster than wheat residue due to higher N concentration.
The decreased tendency of STN with year at all soil depths, except at 5–10 cm (Figure 5B), was probably due to reduced crop residue N input returned to the soil in dryland cropping systems, a fact that was similar to that observed for SOC. Although N fertilizer was applied to increase crop yields, inadequate amount of precipitation received during the growing season may have reduced crop yields and residue N input, because precipitation is a limiting factor for crop production in dryland cropping systems [38,39,44]. The fact that STN tended to decline year by year at subsoil layers while SOC tended to incline could be due to lower N input compared to C input from roots. This indicates that SOC and STN can behave differently in subsoil layers with cropping systems, N fertilization rates, and years under dryland cropping systems of the US northern Plains. However, similar to SOC, NTWP with 50–100 kg N ha−1 can enhance STN at surface layers (0–30 cm) compared to other cropping systems and N fertilization rates.
5. Conclusions
The results of the study indicate that NTWP with 50–100 kg N ha−1 can enhance SOC and STN stocks to a depth of 30 cm due to the greater amount of crop residue C and N returned to the soil compared to other cropping systems and N fertilization rates in dryland cropping systems of the US northern Great Plains. Tillage had limited impact on SOC and STN. Because of the inadequate amount of crop residue C and N returned to the soil as a result of limited precipitation that reduced crop yields, both SOC and STN declined with year, especially at the surface soil layers, regardless of cropping systems and N fertilization rates. The SOC and STN behaved differently with cropping systems, N fertilization rates, and years at subsoil layers. Because of the high spatial variability, further long-term studies may be needed to obtain consistent trends of SOC and STN in the whole soil profile as affected by cropping system and N fertilization rates in this region.
Funding
This research received no external funding.
Data Availability Statement
The original contributions presented in the study are included in this article, further inquiries can be directed to the corresponding author.
Acknowledgments
I sincerely acknowledge for the field assistance provided by Michael Johnson, Mark Gaffri, Lyn Solberg, Rene Francis, and Dale Spracklin for plot management and collection of soil samples and for laboratory assistance provided by Chloe Turner and James Allen for preparation and analysis of the samples.
Conflicts of Interest
The author declares that there are no conflicts of interest and had no competing financial interests or personal relationships that could influence the work reported in the study.
References
- Paustian, K.; Andren, O.; Janzen, H.H.; Lal, R.; Smith, P.; Tian, G.; Tiessen, H.; van Noordwjik, M.; Woomer, P.L. Agricultural soils as a sink to mitigate CO2 emissions. Soil Use Manag. 1997, 13, 230–244. [Google Scholar] [CrossRef]
- Schlesinger, W.H. Biogeochemistry. In An Analysis of Global Change; Academic Press: San Diego, CA, USA, 1997. [Google Scholar]
- Mosier, A.R.; Halvorson, A.D.; Reule, C.A.; Liu, X.J. Net global warming potential and greenhouse gas intensity in irrigated cropping systems in northeastern Colorado. J. Environ. Qual. 2006, 35, 1584–1598. [Google Scholar] [CrossRef] [PubMed]
- Sey, B.K.; Whalen, J.K.; Gregorich, E.G.; Rochette, P.; Cue, R.I. Carbon dioxide and nitrous oxide content in soils under corn and soybean. Soil Sci. Soc. Am. J. 2008, 72, 931–938. [Google Scholar] [CrossRef]
- Sainju, U.M.; Caesar-TonThat, Y.; Caesar, A.J. Comparison of soil carbon dioxide flux measurements by static and portable chambers in various management practices. Soil Tillage Res. 2012, 118, 123–131. [Google Scholar] [CrossRef]
- United States Environmental Protection Agency (USEPA). Inventory of U.S. Greenhouse Gas Emissions and Sinks: 1990–2009; EPA 430-R-11-605; USEPA, Office of Atmospheric Programs: Dallas, TX, USA, 2011. [Google Scholar]
- Food and Agricultural Organization (FAO). Carbon Sequestration in Dryland Soils; World Soil Resources Report 102; FAO: Rome, Italy, 2004. [Google Scholar]
- Peterson, G.A.; Halvorson, A.D.; Havlin, J.L.; Jones, O.R.; Lyon, D.G.; Tanaka, D.L. Reduced tillage and increasing cropping intensity in the Great Plains conserve soil carbon. Soil Tillage Res. 1998, 47, 207–218. [Google Scholar] [CrossRef]
- Campbell, C.A.; Zenter, R.P.; Liang, B.C.; Roloff, G.; Gregorich, E.C.; Blomert, B. Organic carbon accumulation in soil over 30 yr in semiarid southwestern Saskatchewan: Effect of crop rotations and fertilizers. Can. J. Soil Sci. 2000, 80, 170–192. [Google Scholar] [CrossRef]
- Sainju, U.M.; Allen, B.L.; Caesar-TonThat, T.; Lenssen, A.W. Dryland soil carbon and nitrogen after thirty years of tillage and cropping sequence. Agron. J. 2015, 107, 1822–1830. [Google Scholar] [CrossRef]
- Morell, F.J.; Cantero-Martinez, C.; Lamporlanes, J.; Plaza-Bonilla, D.; Alvaro-Fuentes, J. Soil carbon dioxide flux and organic matter content: Effects of tillage and nitrogen fertilization. Soil Sci. Soc. Am. J. 2011, 75, 1874–1884. [Google Scholar] [CrossRef]
- Lopez-Bedillo, R.; Forton, M.J.; Lopez-Bedillo, F.J.; Lopez-Bedillo, R. Carbon sequestration by tillage, rotation, and nitrogen fertilization. Agron. J. 2010, 102, 310–318. [Google Scholar] [CrossRef]
- Black, A.L.; Tanaka, D.L. A conservation tillage cropping system study in the northern Great Plains of the United States. In Soil Organic Matter in Temperate Agroecosystems: Long-Term Experiments in North America; Paul, E.A., Ed.; CRC Press: Boca Raton, FL, USA, 1997; pp. 335–342. [Google Scholar] [CrossRef]
- Halvorson, A.D.; Wienhold, B.J.; Black, A.L. Tillage, nitrogen, and cropping system effects on soil carbon sequestration. Soil Sci. Soc. Am. J. 2002, 66, 906–912. [Google Scholar] [CrossRef]
- Aase, J.K.; Pikul, J.L., Jr. Crop and soil responses to long-term tillage practices in the northern Great Plains. Agron. J. 1995, 87, 652–656. [Google Scholar] [CrossRef]
- Sherrod, L.A.; Peterson, G.A.; Westfall, D.G.; Ahuja, A.R. Cropping intensity enhances soil organic carbon and nitrogen in a no-till agroecosystem. Soil Sci. Soc. Am. J. 2003, 67, 1533–1543. [Google Scholar] [CrossRef]
- Schmer, M.M.; Jin, V.L.; Wienhold, B.J.; Becker, S.M.; Varvel, G.E. Long-term rotation diversity and nitrogen effects on soil organic carbon and nitrogen stocks. Agrosyst. Geosci. Environ. 2020, 3, e20055. [Google Scholar] [CrossRef]
- Norton, J.B.; Mukhwana, E.J.; Norton, U. Loss and recovery of soil organic carbon and nitrogen in a semiarid ecosystem. Soil Sci. Soc. Am. J. 2012, 76, 505–514. [Google Scholar] [CrossRef]
- Obour, A.K.; Holman, J.D.; Simon, L.M.; Assefo, Y. No-tillage and nitrogen fertilization on soil chemical properties under dryland wheat-sorghum-fallow rotation. Agrosyst. Geosci. Environ. 2023, 6, e20330. [Google Scholar] [CrossRef]
- Zhao, G.; Bryon, B.A.; King, D.; Luo, Z.; Wang, E.; Song, X.; Yu, Q. Impact of agricultural management practices on soil organic carbon: Simulation of Austrian wheat systems. Glob. Chang. Biol. 2013, 19, 1589–1597. [Google Scholar] [CrossRef] [PubMed]
- Cao, B.; Qu, C.; Guo, X.; Liu, C.; Liang, C.; Jiao, Y.; Shi, J.; Tian, X. Long-term nitrogen and straw application improves wheat production and soil organic carbon sequestration. J. Soil Sci. Plant Nutri. 2022, 22, 3364–3376. [Google Scholar] [CrossRef]
- Rasmussen, P.E.; Rhode, C.R. Long-term tillage and nitrogen fertilization effects on organic nitrogen and carbon in a semiarid soil. Soil Sci. Soc. Am. J. 1988, 52, 1114–1117. [Google Scholar] [CrossRef]
- Jantalia, C.P.; Halvorson, A.D. Nitrogen fertilizer effects on irrigated conventional tillage corn yields and soil carbon and nitrogen pools. Agron. J. 2011, 103, 871–878. [Google Scholar] [CrossRef]
- Bremer, E.; Janzen, H.H.; McKenzie, R.H. Carbon, nitrogen, and greenhouse gas balances in an 18-year cropping system study on the northern Great Plains. Soil Sci. Soc. Am. J. 2011, 75, 1493–1502. [Google Scholar] [CrossRef]
- Melchiori, R.J.M.; Novelli, L.E.; Viviana, C.G.; Caviglia, O.P. Stover quality and soil organic carbon in long-term nitrogen-fertilized maize. Agron. J. 2014, 106, 1709–1716. [Google Scholar] [CrossRef]
- Ladha, J.K.; Reddy, C.K.; Padre, A.T.; van Kissel, C. Role of nitrogen fertilization in sustaining organic matter in cultivated soils. J. Environ. Qual. 2011, 40, 1756–1766. [Google Scholar] [CrossRef] [PubMed]
- Miles, R.J.; Brown, J.R. The Sanborn field experiment: Implications for long-term soil organic carbon levels. Agron. J. 2011, 103, 268–278. [Google Scholar] [CrossRef]
- Nafziger, E.D.; Dunker, R.E. Soil organic carbon trends over 100 years in the Morrow plots. Agron. J. 2011, 103, 261–267. [Google Scholar] [CrossRef]
- Kravchennko, A.N.; Robertson, G.P. Whole-profile soil carbon stocks: The danger of assuming too much from analyses of too little. Soil Sci. Soc. Am. J. 2011, 75, 235–2040. [Google Scholar] [CrossRef]
- Syswerda, S.P.; Corbin, A.T.; Mokma, D.J.; Kravchenko, A.N.; Robertson, G.P. Agricultural management and soil carbon storage in surface vs. deep layers. Soil Sci. Soc. Am. J. 2011, 75, 92–101. [Google Scholar] [CrossRef]
- Skadell, L.E.; Schneider, F.; Gocke, M.L.; Guigel, J.; Amelung, W.; Banke, S.L.; Siebert, S.; Honermeier, B.; Barkusky, B.; Hobley, E.U.; et al. Twenty percent of agricultural management effects on organic carbon stocks occur in subsoils: Results of ten long-term experiments. Agric. Ecosystem. Environ. 2023, 356, 108619. [Google Scholar] [CrossRef]
- VandenBygaart, A.J.; Bremer, E.; McConkey, B.G.; Ellert, B.H.; Angers, D.A.; Carter, M.R.; Drury, C.F.; Lafond, G.P.; McKenzie, R.H. Impact of sampling depth on differences in soil carbon stocks in long-term agroecosystem experiments. Soil Sci. Soc. Am. J. 2011, 75, 226–234. [Google Scholar] [CrossRef]
- Ellert, B.H.; Bettany, J.R. Calculation of organic matter and nutrients stored in soils under contrasting management regimes. Can. J. Soil Sci. 1995, 75, 529–838. [Google Scholar] [CrossRef]
- Littell, R.C.; Milliken, G.A.; Stroup, W.W.; Wolfinger, R.D.; Schabenberger, O. SAS for Mixed Models, 2nd ed.; SAS Institute Inc.: Cary, NC, USA, 2006. [Google Scholar]
- Box, J.E., Jr. Modern methods of root investigation. In Plant Roots: The Hidden Half, 2nd ed.; Waisel, Y., Eshel, A., Kafkafi, V., Eds.; Marcel Dekker: New York, NY, USA, 1996; pp. 193–237. [Google Scholar]
- Aase, J.K.; Schaefer, G.M. Economics of tillage practices and spring wheat and barley crop sequence in northern Great Plains. J. Soil Water Conserv. 1996, 51, 167–170. [Google Scholar]
- Sainju, U.M.; Caesar-TonThat, T.; Lenssen, A.W.; Evans, R.G. Dryland crop yields and soil organic matter as influenced by long-term tillage and cropping sequence. Agron. J. 2009, 101, 243–251. [Google Scholar] [CrossRef]
- Lenssen, A.W.; Johnson, G.D.; Carlson, G.R. Cropping sequence and tillage system influence annual crop production and water use in semiarid Montana. Field Crops Res. 2007, 100, 32–43. [Google Scholar] [CrossRef]
- Lenssen, A.W.; Sainju, U.M.; Jabro, J.D.; Iversen, W.M.; Allen, B.G.; Evans, R.G. Crop diversification, tillage, and management system influence spring wheat yield and water use. Agron. J. 2014, 106, 1445–1454. [Google Scholar] [CrossRef]
- Halvorson, A.D.; Reule, C.A. Irrigated no-till corn and barley response to nitrogen in northern Colorado. Agron. J. 2007, 99, 1521–1529. [Google Scholar] [CrossRef]
- Abeledo, L.G.; Calderini, D.F.; Slater, G.L. Nitrogen economy in old and modern malting barleys. Field Crops Res. 2008, 106, 171–178. [Google Scholar] [CrossRef]
- Power, J.F. Seasonal changes in smooth bromegrass top and root growth and fate of fertilizer nitrogen. Agron. J. 1988, 80, 740–745. [Google Scholar] [CrossRef]
- Heggenstaller, A.H.; Moore, K.J.; Liebman, M.; Anex, R.P. Nitrogen influences biomass and nutrient partitioning by perennial warm-season grasses. Agron. J. 2009, 101, 1363–1371. [Google Scholar] [CrossRef]
- Sainju, U.M. Tillage, cropping sequence, and nitrogen fertilization influence dryland soil nitrogen. Agron. J. 2013, 105, 1253–1263. [Google Scholar] [CrossRef]
- Sainju, U.M.; Stevens, W.B.; Caesar-Tonthat, T. Soil carbon and crop yields affected by irrigation, tillage, crop rotation, and nitrogen fertilization. Soil Sci. Soc. Am. J. 2014, 78, 936–948. [Google Scholar] [CrossRef]
- Liu, Z.; Sun, K.; Liu, W.; Gao, T.; Li, G.; Han, H.; Ning, T. Responses of soil carbon, nitrogen, and wheat and maize productivity to 10 years of decreased nitrogen fertilizer under contrasting tillage systems. Soil Tillage Res. 2020, 196, 104444. [Google Scholar] [CrossRef]
Figure 1.
Plot map of the study with treatments. Cropping systems are CTWF, conventional till spring wheat–fallow; NTCW, no-till continuous spring wheat; NTWF, no-till spring wheat–fallow; and NTWP, no-till spring wheat–pea. N0, N1, N2, and N3 represents 0, 50, 100, and 150 kg N ha−1 of N fertilization rates applied to spring wheat. The US map at the bottom shows the location of site (with a red asterisk) in eastern Montana (MT), USA.

Figure 2.
Soil bulk density at 0–5, 5–10, 10–30, 30–60, 60–90, and 90–120 cm depths, averaged across years, as affected by cropping system and N fertilization rate. Cropping systems are CTWF, conventional till spring wheat–fallow; NTCW, no-till continuous spring wheat; NTWF, no-till spring wheat–fallow; and NTWP, no-till spring wheat–pea. Markers followed by different letters are significantly different among cropping systems at an N fertilization rate.

Figure 3.
Soil organic C (SOC) stock at 0–5, 5–10, 10–30, and 30–60 cm depths, averaged across years, as affected by cropping system and N fertilization rate. Cropping systems are CTWF, conventional till spring wheat–fallow; NTCW, no-till continuous spring wheat; NTWF, no-till spring wheat–fallow; and NTWP, no-till spring wheat–pea. Markers followed by different letters are significantly different among cropping systems at an N fertilization rate.

Figure 4.
Soil organic C (SOC) stock at 60–90, 90–120, and 0–120 cm depths, averaged across years, as affected by cropping system and N fertilization rate. Cropping systems are CTWF, conventional till spring wheat–fallow; NTCW, no-till continuous spring wheat; NTWF, no-till spring wheat–fallow; and NTWP, no-till spring wheat–pea. Markers followed by different letters are significantly different among cropping systems at an N fertilization rate.

Figure 5.
Relationship between (A) soil organic C (SOC) stock and year and between (B) soil total N (STN) stock and year at 0–5, 5–10, 10–30, 30–60, 60–90, 90–120, and 0–120 cm depths. Values were averaged across cropping systems and N fertilization rates.
Figure 5.
Relationship between (A) soil organic C (SOC) stock and year and between (B) soil total N (STN) stock and year at 0–5, 5–10, 10–30, 30–60, 60–90, 90–120, and 0–120 cm depths. Values were averaged across cropping systems and N fertilization rates.

Figure 6.
Relationship between (A) soil organic C (SOC) stock and crop residue C and between (B) soil total N (STN) stock and crops residue N at the 0–5 cm depth. Mean values of four replications were averaged across years.
Figure 6.
Relationship between (A) soil organic C (SOC) stock and crop residue C and between (B) soil total N (STN) stock and crops residue N at the 0–5 cm depth. Mean values of four replications were averaged across years.

Figure 7.
Soil total N (STN) stock at 0–5, 5–10, 10–30, and 30–60 cm depths, averaged across years, as affected by cropping system and N fertilization rate. Cropping systems are CTWF, conventional till spring wheat–fallow; NTCW, no-till continuous spring wheat; NTWF, no-till spring wheat–fallow; and NTWP, no-till spring wheat–pea. Markers followed by different letters are significantly different among cropping systems at an N fertilization rate.

Figure 8.
Soil total N (STN) stock at 60–90, 90–120, and 0–120 cm depths, averaged across years, as affected by cropping system and N fertilization rate. Cropping systems are CTWF, conventional till spring wheat–fallow; NTCW, no-till continuous spring wheat; NTWF, no-till spring wheat–fallow; and NTWP, no-till spring wheat–pea. Markers followed by different letters are significantly different among cropping systems at an N fertilization rate.


Table 1.
Monthly total precipitation from 2012 to 2018 at the study site. The April–August precipitation is the crop growing season precipitation and the January–December precipitation is the total annual precipitation.
Table 1.
Monthly total precipitation from 2012 to 2018 at the study site. The April–August precipitation is the crop growing season precipitation and the January–December precipitation is the total annual precipitation.
| Month | 2012 | 2013 | 2014 | 2015 | 2016 | 2017 | 2018 | 30-Year Average |
|---|---|---|---|---|---|---|---|---|
| January | 0 | 0 | 1 | 0 | 0 | 3 | 2 | 3 |
| February | 0 | 1 | 0 | 2 | 0 | 1 | 3 | 1 |
| March | 0 | 2 | 1 | 1 | 1 | 2 | 0 | 2 |
| April | 36 | 60 | 35 | 6 | 88 | 8 | 15 | 30 |
| May | 52 | 149 | 90 | 32 | 53 | 12 | 92 | 61 |
| June | 28 | 105 | 28 | 102 | 36 | 32 | 63 | 71 |
| July | 69 | 24 | 12 | 49 | 69 | 15 | 46 | 67 |
| August | 20 | 104 | 131 | 33 | 19 | 37 | 26 | 33 |
| September | 1 | 13 | 29 | 61 | 67 | 47 | 31 | 41 |
| October | 48 | 27 | 2 | 10 | 15 | 24 | 10 | 27 |
| November | 1 | 0 | 2 | 4 | 5 | 0 | 2 | 3 |
| December | 0 | 1 | 0 | 1 | 1 | 4 | 2 | 2 |
| April–August | 205 | 442 | 296 | 222 | 265 | 104 | 242 | 262 |
| January–December | 255 | 486 | 331 | 301 | 354 | 185 | 292 | 341 |
Table 2.
Crop residue C and N returned to the soil as affected by cropping system, N fertilization rate, and year.
Table 2.
Crop residue C and N returned to the soil as affected by cropping system, N fertilization rate, and year.
| Cropping System a | N Fertilization Rate (kg N ha−1) | Year | Crop Residue C (Mg C ha−1) | Crop Residue N (kg N ha−1) |
|---|---|---|---|---|
| CTWF | 0.81c b | 28.4c | ||
| NTCW | 1.11b | 38.2b | ||
| NTWF | 0.78c | 25.9c | ||
| NTWP | 1.25a | 51.1a | ||
| 0 | 0.85b | 28.7b | ||
| 50 | 0.99ab | 35.5a | ||
| 100 | 1.04a | 38.2a | ||
| 150 | 1.06a | 41.2a | ||
| 2012 | 0.71cd | 29.2cd | ||
| 2013 | 0.65d | 22.6d | ||
| 2014 | 1.14b | 33.2c | ||
| 2015 | 0.83cd | 49.8b | ||
| 2016 | 1.91a | 68.5a | ||
| 2017 | 0.90c | 31.1c | ||
| 2018 | 0.78cd | 2.70c | ||
| Significance | p values | |||
| Cropping system (C) | <0.001 | 0.003 | ||
| N fertilization rate (F) | <0.001 | 0.022 | ||
| C × F | 0.725 | 0.863 | ||
| Year (Y) | <0.001 | <0.001 | ||
| C × Y | 0.108 | 0.357 | ||
| F × Y | 0.970 | 0.999 | ||
| C × F × Y | 1.000 | 1.000 | ||
a Cropping systems are CTWF, conventional till spring wheat–fallow; NTCW, no-till continuous spring wheat; NTWF, no-till spring wheat–fallow; and NTWP, no-till spring wheat–pea. b Numbers followed by different letters within a column in a set are significantly different at p ≤ 0.05 by the least square means test.
Table 3.
Analysis of variance for soil bulk density, soil organic C (SOC), and soil total N (STN) stocks at various intervals of the 0–120 cm depth, with sources of variance as cropping system (C), N fertilization rate (F), and year (Y).
Table 3.
Analysis of variance for soil bulk density, soil organic C (SOC), and soil total N (STN) stocks at various intervals of the 0–120 cm depth, with sources of variance as cropping system (C), N fertilization rate (F), and year (Y).
| Source | Depth Intervals | ||||||
|---|---|---|---|---|---|---|---|
| 0–5 cm | 5–10 cm | 10–30 cm | 30–60 cm | 60–90 cm | 90–120 cm | 0–120 cm | |
| p values | |||||||
| Bulk density | |||||||
| C | 0.339 | 0.338 | 0.079 | 0.488 | 0.873 | <0.001 a | ND b |
| F | 0.108 | <0.001 | 0.001 | 0.027 | 0.067 | <0.001 | ND |
| C × F | <0.001 | <0.001 | <0.001 | <0.001 | <0.001 | <0.001 | ND |
| Y | 0.587 | 0.680 | 0.237 | 0.158 | 0.328 | 0.327 | ND |
| C × Y | 0.729 | 0.719 | 0.725 | 0.357 | 0.425 | 0.482 | ND |
| F × Y | 0.751 | 0.523 | 0.329 | 0.289 | 0.720 | 0.702 | ND |
| C × F × Y | 0.251 | 0.925 | 0.357 | 0.998 | 0.921 | 0.805 | ND |
| SOC | |||||||
| C | 0.104 | 0.967 | 0.436 | 0.632 | 0.375 | 0.138 | 0.281 |
| F | 0.996 | 0.008 | 0.063 | 0.222 | 0.044 | 0.032 | 0.212 |
| C × F | 0.002 | <0.001 | 0.009 | <0.001 | 0.046 | <0.001 | 0.003 |
| Y | 0.836 | 0.131 | <0.001 | 0.940 | 0.034 | 0.091 | 0.516 |
| C × Y | 0.768 | 0.611 | 0.643 | 0.845 | 0.954 | 0.999 | 0.931 |
| F × Y | 0.995 | 0.767 | 0.830 | 0.994 | 0.987 | 0.909 | 1.000 |
| C × F × Y | 0.999 | 0.979 | 0.968 | 0.999 | 0.995 | 1.000 | 1.000 |
| STN | |||||||
| C | 0.533 | 0.802 | 0.282 | 0.515 | 0.406 | 0.270 | 0.671 |
| F | 0.942 | 0.004 | 0.092 | 0.045 | 0.602 | 0.712 | 0.173 |
| C × F | <0.001 | <0.001 | <0.001 | 0.026 | 0.014 | 0.016 | 0.027 |
| Y | 0.071 | 0.033 | 0.006 | <0.001 | <0.001 | 0.001 | 0.001 |
| C × Y | 0.793 | 0.965 | 0.927 | 0.812 | 0.160 | 0.098 | 0.290 |
| F × Y | 0.974 | 0.990 | 0.787 | 0.869 | 0.572 | 0.990 | 0.984 |
| C × F × Y | 1.000 | 1.000 | 0.989 | 0.970 | 0.857 | 0.963 | 0.999 |
a Bold numbers indicate significant p values. b Not determinable.
Disclaimer/Publisher’s Note: The statements, opinions and data contained in all publications are solely those of the individual author(s) and contributor(s) and not of MDPI and/or the editor(s). MDPI and/or the editor(s) disclaim responsibility for any injury to people or property resulting from any ideas, methods, instructions or products referred to in the content. |
© 2024 by the author. Licensee MDPI, Basel, Switzerland. This article is an open access article distributed under the terms and conditions of the Creative Commons Attribution (CC BY) license (https://creativecommons.org/licenses/by/4.0/).
Share and Cite
MDPI and ACS Style
Sainju, U.M. Dryland Soil Carbon and Nitrogen Stocks in Response to Cropping Systems and Nitrogen Fertilization. Environments 2024, 11, 70. https://doi.org/10.3390/environments11040070
AMA Style
Sainju UM. Dryland Soil Carbon and Nitrogen Stocks in Response to Cropping Systems and Nitrogen Fertilization. Environments. 2024; 11(4):70. https://doi.org/10.3390/environments11040070
Chicago/Turabian StyleSainju, Upendra M. 2024. "Dryland Soil Carbon and Nitrogen Stocks in Response to Cropping Systems and Nitrogen Fertilization" Environments 11, no. 4: 70. https://doi.org/10.3390/environments11040070
Note that from the first issue of 2016, this journal uses article numbers instead of page numbers. See further details here.