
Cold Ironing and the Study of RES Utilization for Maritime Electrification on Lesvos Island Port

Energy Management Laboratory, Department of Environment, University of the Aegean, University Hill, GR-81100 Mytilini, Greece
*
Author to whom correspondence should be addressed.
Environments 2024, 11(4), 84; https://doi.org/10.3390/environments11040084
Submission received: 12 December 2023
/
Revised: 17 April 2024
/
Accepted: 18 April 2024
/
Published: 19 April 2024
(This article belongs to the Special Issue Environmental Science and Technologies for the Management of Natural Ecosystems and the Sustainable Development of Urban Areas II)
Abstract
:The maritime industry is addressing environmental issues, and “cold ironing” offers a promising solution. This method involves supplying ships at port with energy, reducing fossil fuel dependence and emissions, and aiding in global climate change efforts. It is especially important for islands like Lesvos, which suffer from high energy costs and environmental issues due to imported fossil fuel reliance. However, research gaps exist in using renewable energy sources (RES) for cold ironing, mainly due to insufficient data on power needs and lack of monitoring for precise calculations and the very limited applications for the case of non-interconnected islands. This study uses real data from the port of Lesvos to evaluate power requirements for cold ironing and assesses the viability of a wind power park for an electrified port with the novelty and uniqueness of developing the application on a non-interconnected island. It also examines potential CO2 emission reductions. Data from Marine Traffic S.A. were used, considering factors like ship arrivals, hoteling duration, and engine types. This study also includes a simulation using RETScreen software for a 20 MW wind park intended for port operations. The findings show that the monthly energy demand at Mytilene port is around 6118 MWh, with an average power demand of 8.2 MW. The simulated wind park could supply about 72,080 MWh yearly, with a significant surplus (14,956 MWh annually) exportable to the grid. However, demand fluctuations mean the port might need an extra 924 MWh from the main grid. This underscores the need for additional strategies like energy storage and demand–response practices to fully transition to 100% RES-powered operations.
1. Introduction
The maritime sector plays a crucial role in global trade by facilitating the movement of goods and commodities via seas and oceans. However, it also contributes significantly to environmental issues, such as air pollution and greenhouse gas emissions. As the global community focuses on fighting climate change and reducing environmental impacts, the marine industry is under pressure to adopt sustainable practices [1]. Maritime electrification, particularly “cold ironing” (also known as shore power or alternative maritime power), is emerging as a solution [2]. Cold ironing involves providing power to docked ships from the shore, allowing them to turn off their generators and engines, thus reducing reliance on fossil fuels and decreasing emissions. This paper discusses cold ironing, covering its best practices, ongoing and future developments, and its transformative potential for the maritime industry. By connecting to onshore power grids, cold ironing substantially reduces greenhouse gas emissions and air pollutants like sulfur and nitrogen oxides, improving local air quality and contributing to global climate change mitigation efforts. This makes it a prime example of environmental best practice in the maritime field [3]. Cold ironing plays a pivotal role in mitigating port emissions by enabling docked ships to utilize electricity from the shore instead of relying on their auxiliary engines. This technology significantly reduces emissions such as NOx, SOx, and particulate matter from cruise ships during hoteling, contributing to cleaner air in port areas [4]. A prominent example of its effectiveness is observed in the Copenhagen cruise ship pier, where cold ironing has demonstrated substantial socio-economic advantages by lowering health-related costs from air pollution [5]. By aligning with both maritime and land-based environmental regulations, cold ironing not only substantially diminishes harmful emissions but also underscores the importance of sustainable practices in port operations. Although the initial investment for setting up cold ironing infrastructure is considerable, the long-term environmental and health benefits strongly advocate for its broader implementation in ports worldwide [6].
In addition to its considerable environmental advantages, cold ironing offers financial benefits for ship operators. Operating onboard generators powered by diesel or heavy fuel oil can be more expensive and energy-intensive than accessing electricity from the shore. Cold ironing proves to be a financially and environmentally desirable option due to its effectiveness, leading to significant cost savings and improved operational efficiency for vessel owners. Traditional shipboard generators often consume more fuel than onshore power sources [7]. By eliminating the need for ships to burn fuel for power generation, cold ironing reduces operating costs and decreases reliance on fossil resources. As a result, ship owners can enjoy lower fuel costs, especially during extended port calls where ships would otherwise continuously remain idle and burn fuel. Cold ironing emerges as a mutually beneficial solution for the marine industry and the environment, delivering economic and environmental benefits [8]. An area of active research and development is the incorporation of alternative energy sources into cold ironing systems. Using solar, wind, and battery storage systems can help ships when they are in port run more sustainably and environmentally, supporting international efforts to switch to greener energy sources and lowering the carbon footprint of the sector [9]. Setting a new benchmark for maritime electrification and demonstrating the industry’s commitment to a more sustainable and ecologically conscious future, cold ironing represents hope for cleaner port operations [10].
A point of interest is the development of cold ironing on islands that are non-interconnected and rely on primarily diesel engines to cover their electricity demand [11]. In these cases, the focus on deploying and embracing renewable energy sources (RES) has intensified due to concerns about addressing climate change, decreasing reliance on fossil fuels, and ensuring energy security [12]. For islands, the transition to renewable energy is crucial as they heavily rely on imported liquid fossil fuels to meet their energy needs. This dependency leads to negative consequences such as high energy costs, supply vulnerabilities, environmental degradation, and adverse impacts on local economies [13]. Despite these challenges, many islands recognize RES as a feasible and sustainable alternative. RES technologies provide benefits like abundant resource availability, potential cost savings, and positive environmental effects. However, the successful adoption of RES on islands depends on various factors unique to each case. In the case of Lesvos, the island’s isolated grid and dependence on a diesel power plant make its energy production carbon-intensive, costly, and reliant on external resources. This highlights the potential of RES as a viable and sustainable alternative for Lesvos, with opportunities and barriers that need careful consideration [14]. Lesvos is the third biggest island in Greece and is located in the North Aegean. The island has significant opportunities in energy transition, including the potential for energy independence using local resources and reducing reliance on imported fossil fuels. This not only enhances energy security but also addresses environmental concerns by mitigating climate change and reducing air pollution and greenhouse gas emissions. As mature technologies like photovoltaic, wind power, and certain biomass applications become economically viable, there is an opportunity for cost savings compared to traditional energy sources [15]. Additionally, Lesvos can capitalize on its agricultural and food industry by repurposing organic waste for renewable energy, creating economic opportunities and reducing the environmental impact of energy production [16]. The energy transition also offers social benefits, fostering the development of energy communities that enable local generation, storage, and distribution of energy, encouraging active participation, social cohesion, and renewable energy production [17].
In the framework of the above-mentioned information, a research gap has been identified in the field of RES development for the support of cold ironing operations on non-interconnected islands. There is a lack of specific data for the power demand that is necessary for such operations and—to date—studies have not provided monitoring data that would allow such calculations. In addition, there are limitations of small-scale grids that need to be assessed prior to the electric transition of ports and transportation [18]. The scope of this study is the utilization of real monitoring data from the port of Lesvos in order to assess the power demand of a potential cold ironing application in order to provide a blueprint for the green transition of ports. On a second level, this study aims to analyze the deployment of a wind power park for covering the energy requirements of an electric port and assess the reduction of CO2 emissions.
2. Materials and Methods
2.1. Available Data from Shipping Routes
The data of shipping routes to and from Mytilene were obtained by utilizing the database of Marine Traffic S.A. This database played a crucial role in providing comprehensive information, including the number of arrivals per ship, deadweight tonnage (DWT), draught, distance traveled, and ship types. Additionally, publicly available data were used in this study to identify the engines employed by each shipping vessel. The data depicted in Figure 1 show the arrivals at the Mytilene port categorized by deadweight tonnage (DWT). Passenger ships, specifically those with a DWT of 6148, represent a notable portion, with 36 arrivals recorded in June. Smaller passenger vessels operating on short-sea international routes, within the range of 50 to 180 DWT, contribute to a total of 151 arrivals, predominantly servicing the MJT-AYK international route. Other passenger ships with relatively higher DWT, such as those measuring 3348 DWT (28 arrivals) and 7622 DWT (31 arrivals) in June 2019, also play a substantial role in the overall arrival figures. Passenger ships dominate the total arrivals, accounting for 42.4%, followed by ro-ro/passenger vessels at 33.9%, and ro-ro cargo ships at approximately 3.5% of the total arrivals. These three categories, operating on regular schedules, collectively constitute around 80% of the arrivals. Additionally, there are other vessels engaged in vital supply services, including the transportation of heavy fuel oil and cement to the island. It is worth noting that Figure 1 excludes military vessels and other non-scheduled shipping practices that could impact the total arrival count.
The calculation of the in-port utilized energy per ship relied on the number of arrivals, the hoteling time, and the engine type of the ships. The nominal engine power of each shipping vessel was adjusted using data from Table 1 and Table 2. It is important to note that main engines are minimally utilized during hoteling, operating only 5% of the time. Although some studies recommend a 0% usage during hoteling, this study adopts the values from the EMEP/EEA report while recognizing the validity of the alternative argument [19]. Table 1 was employed in order to convert the nominal power of engines for each ship into adjusted values corresponding to specific actions such as cruising, maneuvering, and hoteling. To offer numerical insights while maintaining the anonymity of the shipping vessels, it can be noted that passenger ships have an average main engine power of 7668 KW, ro-ro cargo ships have an average main engine power of 11,600 KW, and small (short-sea) passenger ships have an average main engine power of 1300 KW. The auxiliary engine output power ranges from 27% to 39% of the main engine output power for each case. The values for power output and operation hours are adjusted for each action in alignment with the information in Table 1.
Table 2 provides the time required for various actions, with a focus on data from the summer (June 2019), accounting for reduced hoteling–idling times. During winter, hoteling–idling times range from 14 to 15 h for passenger and ro-ro cargo ships, but during summer, they are reduced to approximately 6 h, coinciding with a significant increase in arrival frequency. Maneuvering times remain consistent throughout the year but only the hoteling–idling times play a crucial role in calculating the in-port energy demand [20].
By utilizing the above-mentioned data, this study will present the power of the main and auxiliary engines of the ships that have hoteling–idling times in the port of Mytilene. Part of the main scope of the study is the calculation of the power demand for supporting in-port activities in order to present an electrification scenario that could be partially supported by renewable energy technologies in the framework of green transition.
With Ht as hoteling time, Ep as engine power (of a given engine), % ME as main engine load factor, and % AE as auxiliary engine load factor, the total energy produced for the hoteling of each ship can be seen in Equation (1).
Total energy per ship: Ht × [(Ep × % ME) + (Ep × % AE)]
The total energy of all the shipping vessels is subsequently calculated and added in order for the total energy to be assessed. The average power demand is calculated by taking into account the total hoteling time of each shipping vessel and a power demand fluctuation of 80% during the day [21].
2.2. Methodology and Software for the In-Port Energy Demand Analysis
The energy analysis utilized RETScreen, which is free software that was launched by Canada’s Ministry of the Environment. It is developed in a Microsoft Excel environment and is designed for (among other uses) assessing energy production from potential projects involving renewable energy sources. RETScreen not only provides information about emissions but also evaluates the economic aspects and risks associated with specific projects [22]. This tool is valuable for decision-making, assessing the feasibility of future renewable energy projects, and identifying additional solutions for profitable energy production. The energy analysis component evaluates the generated energy from the proposed energy system. The cost analysis estimates the initial and annual costs for the project. The emission analysis assesses the reduction in greenhouse gas emissions resulting from the development of renewable energy sources. Lastly, the financial analysis calculates the net present value of the project, offering insights into its overall economic sustainability. In this framework, this study considers the development of a 20 MW wind park that can electrify the in-port operations of Mytilene port. Figure 2 utilizes the real average wind data of Lesvos island as it has been presented by the publicly available data provided by HEDNO S.A., i.e., the Hellenic Electricity Distribution Network Operator [23]. The average wind speed data of the existing operating wind parks are considered as a baseline for our analysis. On the one hand, the exact geolocation for the installation of the wind park exceeds the scope of this study, and on the other hand, it cannot be assumed that any new installations will be vastly different than the already-operating ones.
As mentioned above, RETScreen’s uniqueness lies in its ability to evaluate not only emissions data but also the financial aspects and associated risks of specific renewable energy initiatives. Such features render it an essential asset for making informed decisions, determining the viability of prospective renewable energy projects, and identifying profitable energy production opportunities. The software’s capabilities encompass several critical areas. Firstly, the energy analysis component is tasked with measuring the energy output from proposed renewable energy systems. In parallel, the cost analysis module provides estimates of both the upfront costs and ongoing yearly expenses tied to the project. Overall, RETScreen serves not just as a tool but as a comprehensive solution for assessing and progressing renewable energy projects, ensuring their environmental and economic feasibility. In this case, RETScreen is used for the design and analysis of a 20 MW wind park, and the operation of the software assists with not only the energy analysis but also the extrapolation of a robust set of wind speeds that can be used reliably for modeling purposes.
The two-parameter Weibull distribution is the method of choice for wind energy assessments due to its proven ability to represent the skewness more accurately in wind speed distributions compared to other statistical functions. The two-parameter Weibull distribution incorporates a scale parameter “c” (in wind speed units) defining the wind speed distribution’s horizontal scale, and a dimensionless shape parameter “k”, which indicates the distribution’s breadth. The software calculates wind fluctuations using the Weibull distribution, where the default setting for the Weibull K factor is 2. This approach enables precise modeling of wind variability, essential for accurate wind energy assessment. The wind turbine output is calculated with Equations (2)–(4):
where
F(v) = (k/c) × (v/C)k−1 × [−(v/c)k] × exp (v > 0; k, c > 0)
Uhub = Uanem × [(ln (Zhub⁄Z0))/(ln (Zanem⁄Z0))]
- Uanem: wind speed at anemometer height,
- Zhub: height of the wind turbine,
- Zanem: height of the anemometer,
- Z0: surface roughness length.
The power output of a wind turbine is calculated based on its power curve, initially computed for standard air density and then adjusted to reflect the actual air density conditions. This approach ensures a more precise measurement of the turbine’s energy generation capabilities under varying atmospheric conditions.
where
P = (ρ/ρ0) × PSTP
- ρ: actual air density,
- ρo: air density at standard air density,
- PSTP: wind power output at standard air density.
Table 3 presents the characteristics of the wind turbine ENERCON—48–76m, which has been selected as the wind turbine that could potentially be installed in the framework of this analysis. The design and operational characteristics have been extracted by the product database of the software RETScreen. The software has also incorporated the power curve of the wind turbine, and the wind fluctuation has been calculated by means of a Weibull distribution, with the default setting of the Weibull K factor at 2. Analyzing power curve data aids in selecting suitable turbine models for specific locations, considering the prevailing wind conditions. It also facilitates the development of effective control strategies to enhance energy capture and minimize turbine stress [24]. Ultimately, a comprehensive understanding of power curve data is fundamental for the successful integration and utilization of wind energy, contributing to sustainable and renewable power generation.
3. Results
The power requirements of both main and auxiliary engines are significant considerations for passenger shipping vessels, particularly those with extended hoteling times in the port of Mytilene. The main engines, responsible for propulsion, play a crucial role in providing the necessary power for the vessel’s movement. Simultaneously, auxiliary engines support various onboard functions during hoteling, such as maintaining lighting, air conditioning, and other essential systems. The power capacity of these engines is determined by the vessel’s size, design, and the range of amenities and services offered during hoteling. Understanding and optimizing the power of both main and auxiliary engines are key factors in ensuring the operational efficiency and passenger comfort of these vessels during their extended stays in the port of Mytilene. Figure 3 presents the nominal power of main and auxiliary engines for the passenger shipping vessels with the highest hoteling times in Mytilene port.
The energy requirements of shipping vessels constitute a pivotal element within the maritime sector, encompassing the power needs for propulsion, auxiliary systems, and various onboard functions. Shipping vessels utilize a range of energy sources, including traditional marine fuels like heavy fuel oil (HFO), marine diesel oil (MDO), liquefied natural gas (LNG), and an increasing focus on renewable energy alternatives. The energy demand in shipping is influenced by factors such as the size, type, and operational characteristics of the vessel [5]. Larger vessels, particularly container ships and oil tankers, face substantial power demands to ensure efficient navigation and cargo handling. Ongoing technological advancements, marked by the development of more energy-efficient engines, hybrid propulsion systems, and exploration into alternative fuels, are crucial in addressing the continually evolving energy needs of the industry. With the maritime sector aiming to align with environmental sustainability objectives, there is a growing emphasis on improving energy efficiency, reducing emissions, and transitioning towards cleaner and more sustainable energy solutions for shipping operations. By using equation 1, we can obtain the total energy demand for main and auxiliary engines for the passenger shipping vessels with the highest hoteling times in Mytilene port, as shown in Figure 4. The total energy demand for the month of June (2019) for all shipping vessels in the port of Mytilene has been calculated to be 6118 MWh with an average power demand of 8.2 MW.
The power curve data represent the relationship between the wind speed and the electrical power output generated by a wind turbine. Typically, the power output increases with rising wind speeds, reaching a peak at the turbine’s rated capacity. Beyond this point, the turbine operates at its maximum output. Table 4 shows the power and energy curve data of a simulated 20 MW wind park at Lesvos island and follows exactly the previously described pattern, with the wind turbines not producing any energy for wind speeds lower than 3 m/s and higher than 15 m/s. Each turbine has a simulated gross energy production of 3481 MWh with a specific yield of 1810 kWh/m2.
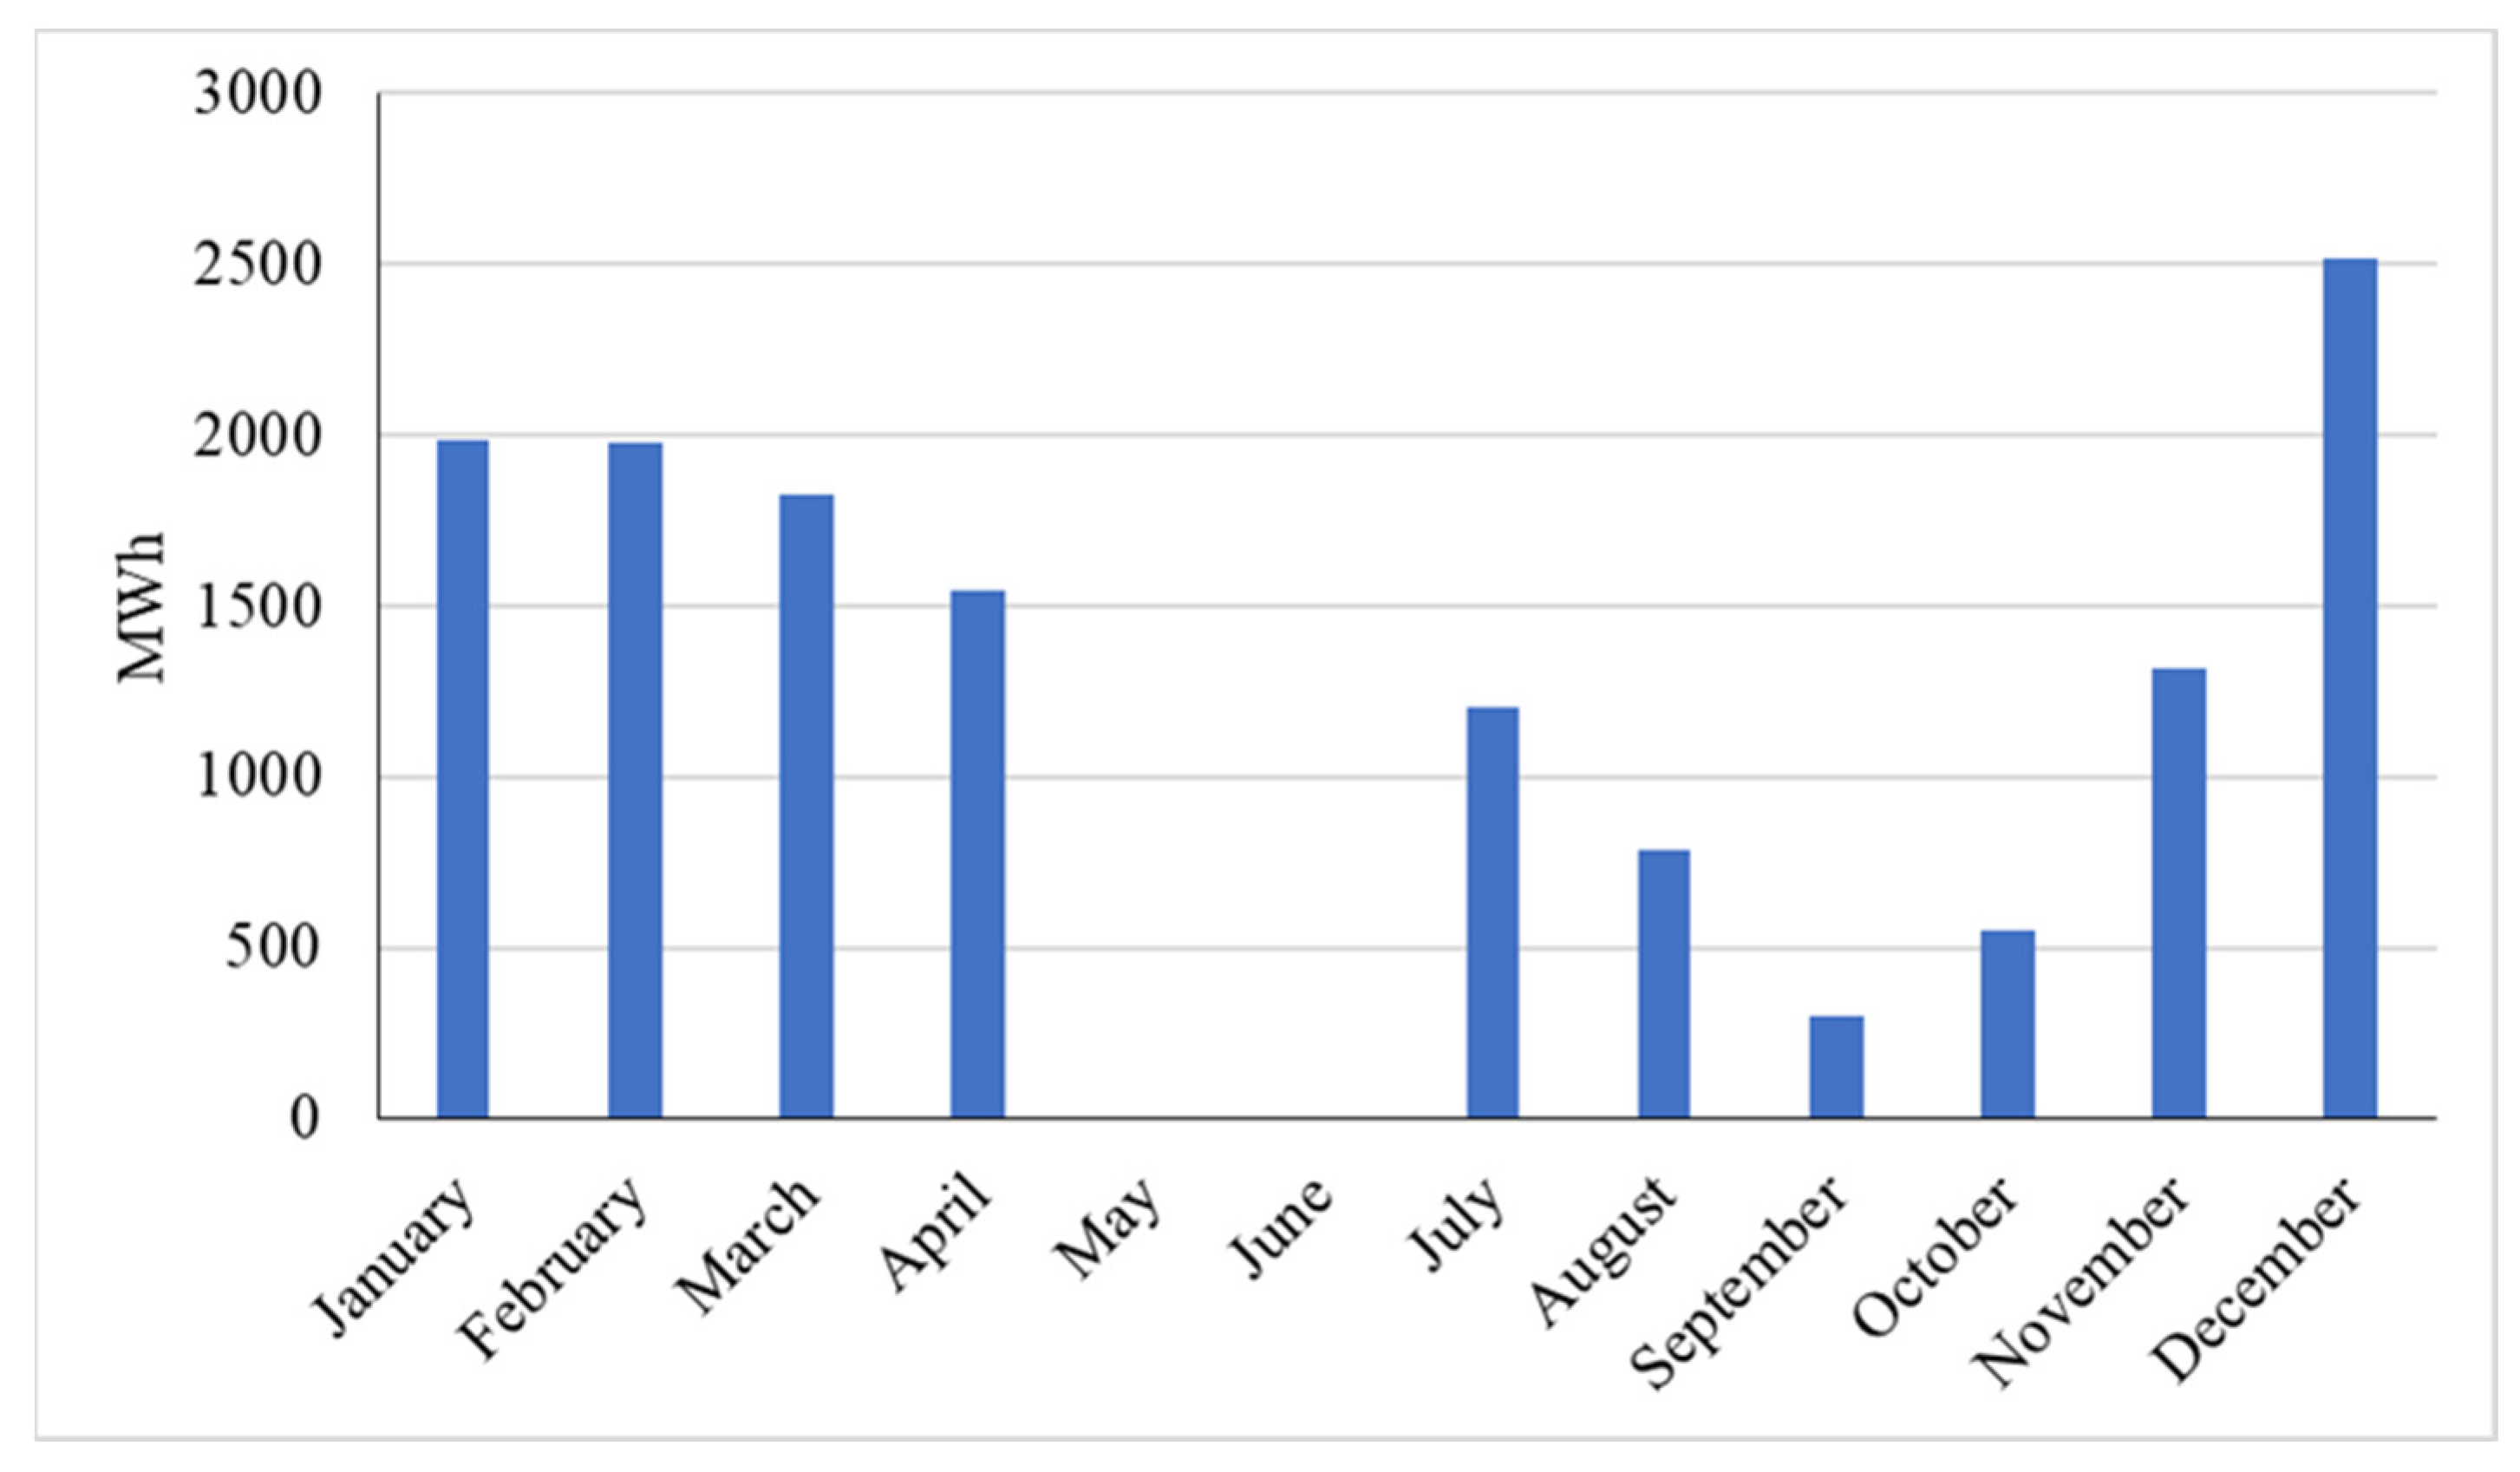
According to the simulation analysis, the electricity delivered annually to the port equals to 72,080 MWh, while a significant part of electricity remains unutilized and is exported to the grid. This amount equals 14,956 MWh annually and the projected monthly fluctuation is presented in Figure 5.
It should be highlighted that due to the fluctuations in demand, the in-port activities require an additional amount of 924 MWh that has to be provided by the main electrical grid. This result shows that although the net balance of the electricity that is required can be covered from the operation of the proposed wind park, other actions need to be implemented to support the gradual transition to 100% RES-powered operations. These practices could include energy storage and demand–response practices, which in the case of ports would entail the adjustment of the incoming and outcoming shipping routes in order not to increase the power demand beyond specific limits. Therefore, this study suggests that future work on cold ironing designs should be conducted with cooperation between the shipping route designers and the energy planners. Additionally, national policies on energy storage, hydrogen production, and net metering legislation will vastly influence the success of cold ironing practices.
4. Discussion
Concerning the energy independence of cold ironing by means of RES installations, a study by Bakar et al. [25] focused on creating a cost-effective, environmentally sustainable hybrid microgrid for seaports. Utilizing solar photovoltaics, wind turbines, and cold ironing facilities, the study’s optimal design significantly decreases reliance on traditional energy sources, with over 80% of electricity demand met through renewables. This approach aligns with maritime industry goals for green energy and sustainability, demonstrating potential for broader application in seaport energy management. Therefore, the case of interconnected ports may have the potential to be flexible in the short term, and this is a very interesting outcome that is in agreement with the outcome of the study by Colarossi et al. [9], where the authors showed that installation of RES in ports could potentially reduce CO2 emissions by up to 87%. Karapidakis et al. [26] explores the implementation of cold ironing at Heraklion port, showing its potential to significantly reduce air pollution by replacing ship-generated emissions with shore-side electricity. The research estimates the energy requirements for ships at berth and evaluates environmental benefits, including substantial reductions in CO2, nitrogen, and sulfur emissions. It concludes that cold ironing is a feasible and environmentally beneficial practice, particularly considering Crete’s high potential for renewable energy sources. The study of Piccolli et al. [27] on cold ironing in the Adriatic Sea examined its implementation in Italy, Croatia, and Greece, highlighting significant environmental benefits through reduced emissions and demonstrating its economic viability with potential for quick paybacks. It explores the alignment of this technology with the EU’s regulatory framework, particularly the Emissions Trading System, and discusses the necessary technical details for implementation. The study emphasizes the importance of coordinated policies and investments among countries to maximize the technology’s environmental and economic advantages. A study by Glavinovic et al. [28] revealed that 40% of these ports currently have high-voltage connections over 1 kV, crucial for effective cold ironing implementation. However, a significant portion, 60%, lacks adequate infrastructure, indicating a need for substantial investment. Surveys among port experts and stakeholders highlighted the varied implementation timelines, with most predicting a 1-to-5-year period for operational readiness. The study underscores the importance of strategic investment and collaboration among government, private sector, and academia to meet environmental goals and enhance maritime safety. Cold ironing, where ships connect to onshore power grids during port stays, effectively reduces emissions and pollution. Enforced by regulations like the IMO’s MARPOL Annex VI, this practice reduces sulfur and nitrogen oxide emissions, improving air quality and meeting environmental standards. It offers multiple benefits including energy efficiency, noise reduction, regulatory compliance, and reduced fuel costs for ship operators. This approach demonstrates the maritime industry’s dedication to sustainability and environmental responsibility [29]. Cold ironing’s global expansion requires significant port infrastructure investment. Ports are enhancing their capacity for cold ironing by developing necessary electrical connections and facilities to cater to more ships. This infrastructure is key to maximizing cold ironing’s environmental benefits. Upgrades include electrical systems, dock renovations, and standardized connectors for various vessel types. These developments are making it feasible for ships of all sizes to use onshore power, aligning with international sustainability goals. Technological advancements, such as wireless charging and automated plug-in systems, are simplifying the process and are expected to further encourage cold ironing adoption, making it a convenient and cost-effective option for ship operators [30].
In relation to the future of cold ironing, the maritime industry is actively embracing sustainability, focusing on integrating renewable energy sources like solar, wind, and battery storage into cold ironing systems for reducing carbon emissions. This eco-friendly initiative enables ships at port to leverage solar and wind energy, supplemented by reliable battery storage, to minimize their environmental impact. Ongoing research and technological innovations, such as automated plug-in procedures and wireless charging, are making these systems more accessible and appealing. Additionally, the concept of smart ports complements cold ironing by using automation and data analytics for efficient energy use and streamlined logistics. This holistic approach enhances not only environmental responsibility but also operational efficiency and security in marine operations. Global standardization efforts, led by organizations like the International Maritime Organization (IMO), are crucial in ensuring the effective implementation of cold ironing across the world. By establishing uniform protocols and technical standards and offering incentives such as financial benefits and tax exemptions, these initiatives are making cold ironing a more feasible option for the industry. Collaboration among stakeholders and educational programs are vital for raising awareness and fostering a comprehensive understanding of cold ironing’s benefits. This collaboration is key to overcoming barriers and promoting the widespread adoption of these sustainable practices. In conclusion, the maritime sector’s journey towards sustainability, spearheaded by the adoption of cold ironing and supported by smart port technologies, has the potential to significantly reduce the industry’s environmental impact and lead global shipping towards a cleaner, more responsible future. In this framework, upcoming work on cold ironing should also co-assess the integration of environmental considerations [31] but also the co-utilization of RES and smart systems [32].
5. Conclusions
This study provides a comprehensive examination of the potential for renewable energy sources (RES) to support cold ironing operations at the port of Mytilene, Lesvos, a non-interconnected island reliant on fossil fuels. The findings underscore the feasibility of integrating a 20 MW wind park to meet the port’s energy demands, demonstrating that RES can significantly enhance maritime electrification while mitigating environmental impacts. The analysis was based on real data from the port and showed that the proposed wind park could produce approximately 72,080 MWh annually, significantly exceeding the port’s monthly demand of 6118 MWh. This surplus energy, approximately 14,956 MWh per year, could be exported to the main grid, illustrating the potential of RES to contribute to broader energy needs beyond maritime operations. Despite these promising results, fluctuations in demand and the inherent variability of wind energy highlight the necessity for supplementary strategies such as energy storage systems and demand–response initiatives. These measures would stabilize supply, enhance grid resilience, and support the transition towards 100% renewable-powered operations. The potential success of cold ironing at Mytilene port could serve as a blueprint for other non-interconnected islands and similar maritime hubs, and could be used to advocate for increased investment in RES to ensure sustainable, efficient, and environmentally friendly maritime operations. Future research should focus on the integration of diverse renewable sources and the optimization of energy storage solutions to fully harness the environmental and economic benefits of maritime electrification. This will not only propel the green transition of ports but also contribute significantly to global efforts in reducing maritime emissions and achieving energy independence.
Author Contributions
Conceptualization, A.K. and S.V.; methodology, A.K., A.D. and S.V.; software, A.D. and S.V.; validation, A.K., A.D. and S.V.; formal analysis, A.K. and S.V.; investigation, A.K. and S.V.; resources D.F.L. and S.V.; data curation, A.K., D.F.L. and S.V.; writing—original draft preparation, S.V.; writing—review and editing, S.V.; visualization, A.K., A.D. and S.V.; supervision, S.V.; project administration, S.V. All authors have read and agreed to the published version of the manuscript.
Funding
This research received no external funding.
Data Availability Statement
The data are unavailable due to privacy restrictions.
Acknowledgments
The authors would like to thank cordially the company Marine Traffic S.A. for providing the data that supported the analysis of this study.
Conflicts of Interest
The authors declare no conflicts of interest.
References
- International Maritime Organization. IMO: Fuel Oil Consumption Data Collection System Enters into Force. 2022. Available online: https://www.imo.org/en/MediaCentre/PressBriefings/Pages/33-GHG-data-collection.aspx (accessed on 14 November 2023).
- European Maritime Safety Agency. Cold Ironing—Alternative Maritime Power (AMP). 2022. Available online: https://www.emsa.europa.eu/operations/maritime-security/cold-ironing-alternative-maritime-power.html (accessed on 14 November 2023).
- European Maritime Safety Agency. Use of Cold Ironing and Electrical Connection for Ships at Berth. 2022. Available online: https://www.emsa.europa.eu/operations/maritime-safety/use-of-cold-ironing.html (accessed on 14 November 2023).
- Kotrikla, A.M.; Lilas, T.; Nikitakos, N. Abatement of air pollution at an Aegean island port utilizing shore side electricity and renewable energy. Mar. Policy 2017, 75, 238–248. [Google Scholar] [CrossRef]
- Martínez-López, A.; Romero, A.; Orosa, J.A. Assessment of Cold Ironing and LNG as Mitigation Tools of Short Sea Shipping Emissions in Port: A Spanish Case Study. Appl. Sci. 2021, 11, 2050. [Google Scholar] [CrossRef]
- Ballini, F.; Bozzo, R. Air pollution from ships in ports: The socio-economic benefit of cold-ironing technology. Res. Transp. Bus. Manag. 2015, 17, 92–98. [Google Scholar] [CrossRef]
- The European Environment Agency. Cleaner Fuels and Energy Sources for Ships Can Lower Environmental Risks. 2022. Available online: https://www.eea.europa.eu/signals/signals-2017-content-list/cleaner-fuels-and-energy-sources (accessed on 14 November 2023).
- Katsaprakakis, D.A.; Proka, A.; Zafirakis, D.; Damasiotis, M.; Kotsampopoulos, P.; Hatziargyriou, N.; Dakanali, E.; Arnaoutakis, G.; Xevgenos, D. Greek Islands’ Energy Transition: From Lighthouse Projects to the Emergence of Energy Communities. Energies 2022, 15, 5996. [Google Scholar] [CrossRef]
- Colarossi, D.; Principi, P. Optimal sizing of a photovoltaic/energy storage/cold ironing system: Life Cycle cost approach and environmental analysis. Energy Convers. Manag. 2023, 291, 117255. [Google Scholar] [CrossRef]
- Genave, A.; Blancard, S.; Garabedian, S. An Assessment of Energy Vulnerability in Small Island Developing States. Ecol. Econ. 2020, 171, 106595. [Google Scholar] [CrossRef]
- Dimou, A.; Vakalis, S. Technoeconomic Analysis of Green Energy Transitions in Isolated Grids: The Case of Ai Stratis—Green Island. Renew. Energy 2022, 195, 66–75. [Google Scholar] [CrossRef]
- Carrasco, J.M.; Franquelo, L.G.; Bialasiewicz, J.T.; Galvan, E.; PortilloGuisado, R.C.; Prats, M.A.M.; Leon, J.I.; Moreno-Alfonso, N. Power-Electronic Systems for the Grid Integration of Renewable Energy Sources: A Survey. IEEE Trans. Ind. Electron. 2006, 53, 1002–1016. [Google Scholar] [CrossRef]
- Katsoulakos, N. An Overview of the Greek Islands’ Autonomous Electrical Systems: Proposals for a Sustainable Energy Future. Smart Grid Renew. Energy 2019, 10, 55–82. [Google Scholar] [CrossRef]
- Barney, A.; Polatidis, H.; Jelić, M.; Tomašević, N.; Pillai, G.; Haralambopoulos, D. Transition towards decarbonisation for islands: Development of an integrated energy planning platform and application. Sustain. Energy Technol. Assess. 2021, 47, 101501. [Google Scholar] [CrossRef]
- Altiparmaki, G.; Vasileiadou, M.A.; Vakalis, S. The effect of excess water on the hydrothermal carbonization of anise waste from ouzo production on Lesvos island. Sustain. Chem. Pharm. 2022, 29, 100831. [Google Scholar] [CrossRef]
- Vasileiadou, M.A.; Altiparmaki, G.; Moustakas, K.; Vakalis, S. Quality of Hydrochar from Wine Sludge under Variable Conditions of Hydrothermal Carbonization: The Case of Lesvos Island. Energies 2022, 15, 3574. [Google Scholar] [CrossRef]
- Barney, A.; Polatidis, H.; Vakalis, S.; Grondin, D.; Benne, M.; Salces, F.S.; Haralambopoulos, D. Energy transition awareness: Can it guide local transition planning on islands? Heliyon 2023, 9, e19960. [Google Scholar] [CrossRef] [PubMed]
- Dimou, A.; Moustakas, K.; Vakalis, S. The Role of Hydrogen and H2 Mobility on the Green Transition of Islands: The Case of Anafi (Greece). Energies 2023, 16, 3542. [Google Scholar] [CrossRef]
- EMEP/EEA. Air Pollutant Emission Inventory Guidebook; Technical report No 21/2016; EEA: Copenhagen, Denmark, 2016. [Google Scholar]
- Tzannatos, E. Ship emissions and their externalities for the port of Piraeus—Greece. Atmos. Environ. 2010, 44, 400–407. [Google Scholar] [CrossRef]
- Kelmalis, A.; Lekkas, D.F.; Moustakas, K.; Vakalis, S. Assessing the Emissions of Short Sea International Shipping: A Case Study of the Mytilini–Ayvalik Route. Environ. Sci. Pollut. Res. 2023, 30, 115496–115505. [Google Scholar] [CrossRef] [PubMed]
- Moya, D.; Paredes, J.; Kaparaju, P. Technical, financial, economic and environmental pre-feasibility study of geothermal power plants by RETScreen—Ecuador’s case study. Renew. Sustain. Energy Rev. 2018, 92, 628–637. [Google Scholar] [CrossRef]
- HEDNO. Report: Issuance of Power Generation Informative Report for the Non-Interconnected Islands. 2023. Available online: https://deddie.gr/en/kentro-enhmerwsis/nea-anakoinwseis/miniaia-deltia-ape-december-2022/ (accessed on 25 October 2023).
- Orfanou, A.; Vakalis, S. Wind Based Hybrid Systems for Increased RES Penetration in Isolated Grids: The Case Study of Anafi (Greece). AIMS Energy 2022, 10, 1046–1058. [Google Scholar] [CrossRef]
- Bakar, N.N.A.; Guerrero, J.M.; Vasquez, J.C.; Bazmohammadi, N.; Othman, M.; Rasmussen, B.D.; Al-Turki, Y.A. Optimal Configuration and Sizing of Seaport Microgrids including Renewable Energy and Cold Ironing—The Port of Aalborg Case Study. Energies 2022, 15, 431. [Google Scholar] [CrossRef]
- Karapidakis, E.; Nikolaidis, E.; Moraitakis, G.; Georgakis, F.; Papadakis, M. Cold ironing feasibility study at the Heraklion Port. J. Phys. Conf. Ser. 2022, 2339, 012016. [Google Scholar] [CrossRef]
- Piccoli, T.; Fermeglia, M.; Bosich, D.; Bevilacqua, P.; Sulligoi, G. Environmental Assessment and Regulatory Aspects of Cold Ironing Planning for a Maritime Route in the Adriatic Sea. Energies 2021, 14, 5836. [Google Scholar] [CrossRef]
- Glavinović, R.; Krčum, M.; Vukić, L.; Karin, I. Cold Ironing Implementation Overview in European Ports—Case Study—Croatian Ports. Sustainability 2023, 15, 8472. [Google Scholar] [CrossRef]
- Zis, T.P.V. Prospects of Cold Ironing as an Emissions Reduction Option. Transp. Res. Part A Policy Pract. 2019, 119, 82–95. [Google Scholar] [CrossRef]
- Arduino, G.; Murillo, D.; Ferrari, C. Key Factors and Barriers to the Adoption of Cold Ironing in Europe. In Proceedings of the Società Italiana di Economia dei Trasporti e della Logistica—XIII Riunione Scientifica, Messina, Italy, 16–17 June 2011. [Google Scholar]
- Martínez-López, A.; Romero-Filgueira, A.; Chica, M. Specific Environmental Charges to Boost Cold Ironing Use in the European Short Sea Shipping. Transp. Res. Part D Transp. Environ. 2021, 94, 102775. [Google Scholar] [CrossRef]
- Iris, Ç.; Lam, J.S.L. Optimal Energy Management and Operations Planning in Seaports with Smart Grid While Harnessing Renewable Energy Under Uncertainty. Omega 2021, 103, 102445. [Google Scholar] [CrossRef]
Figure 1.
Total monthly arrivals at the port of Mytilene sorted by deadweight tonnage (DWT), with passenger ships in green color and short-sea shipping vessels in red color.
Figure 1.
Total monthly arrivals at the port of Mytilene sorted by deadweight tonnage (DWT), with passenger ships in green color and short-sea shipping vessels in red color.

Figure 2.
Average monthly wind speed for Mytilene and the average monthly wind speed of existing wind parks on Lesvos island.
Figure 2.
Average monthly wind speed for Mytilene and the average monthly wind speed of existing wind parks on Lesvos island.
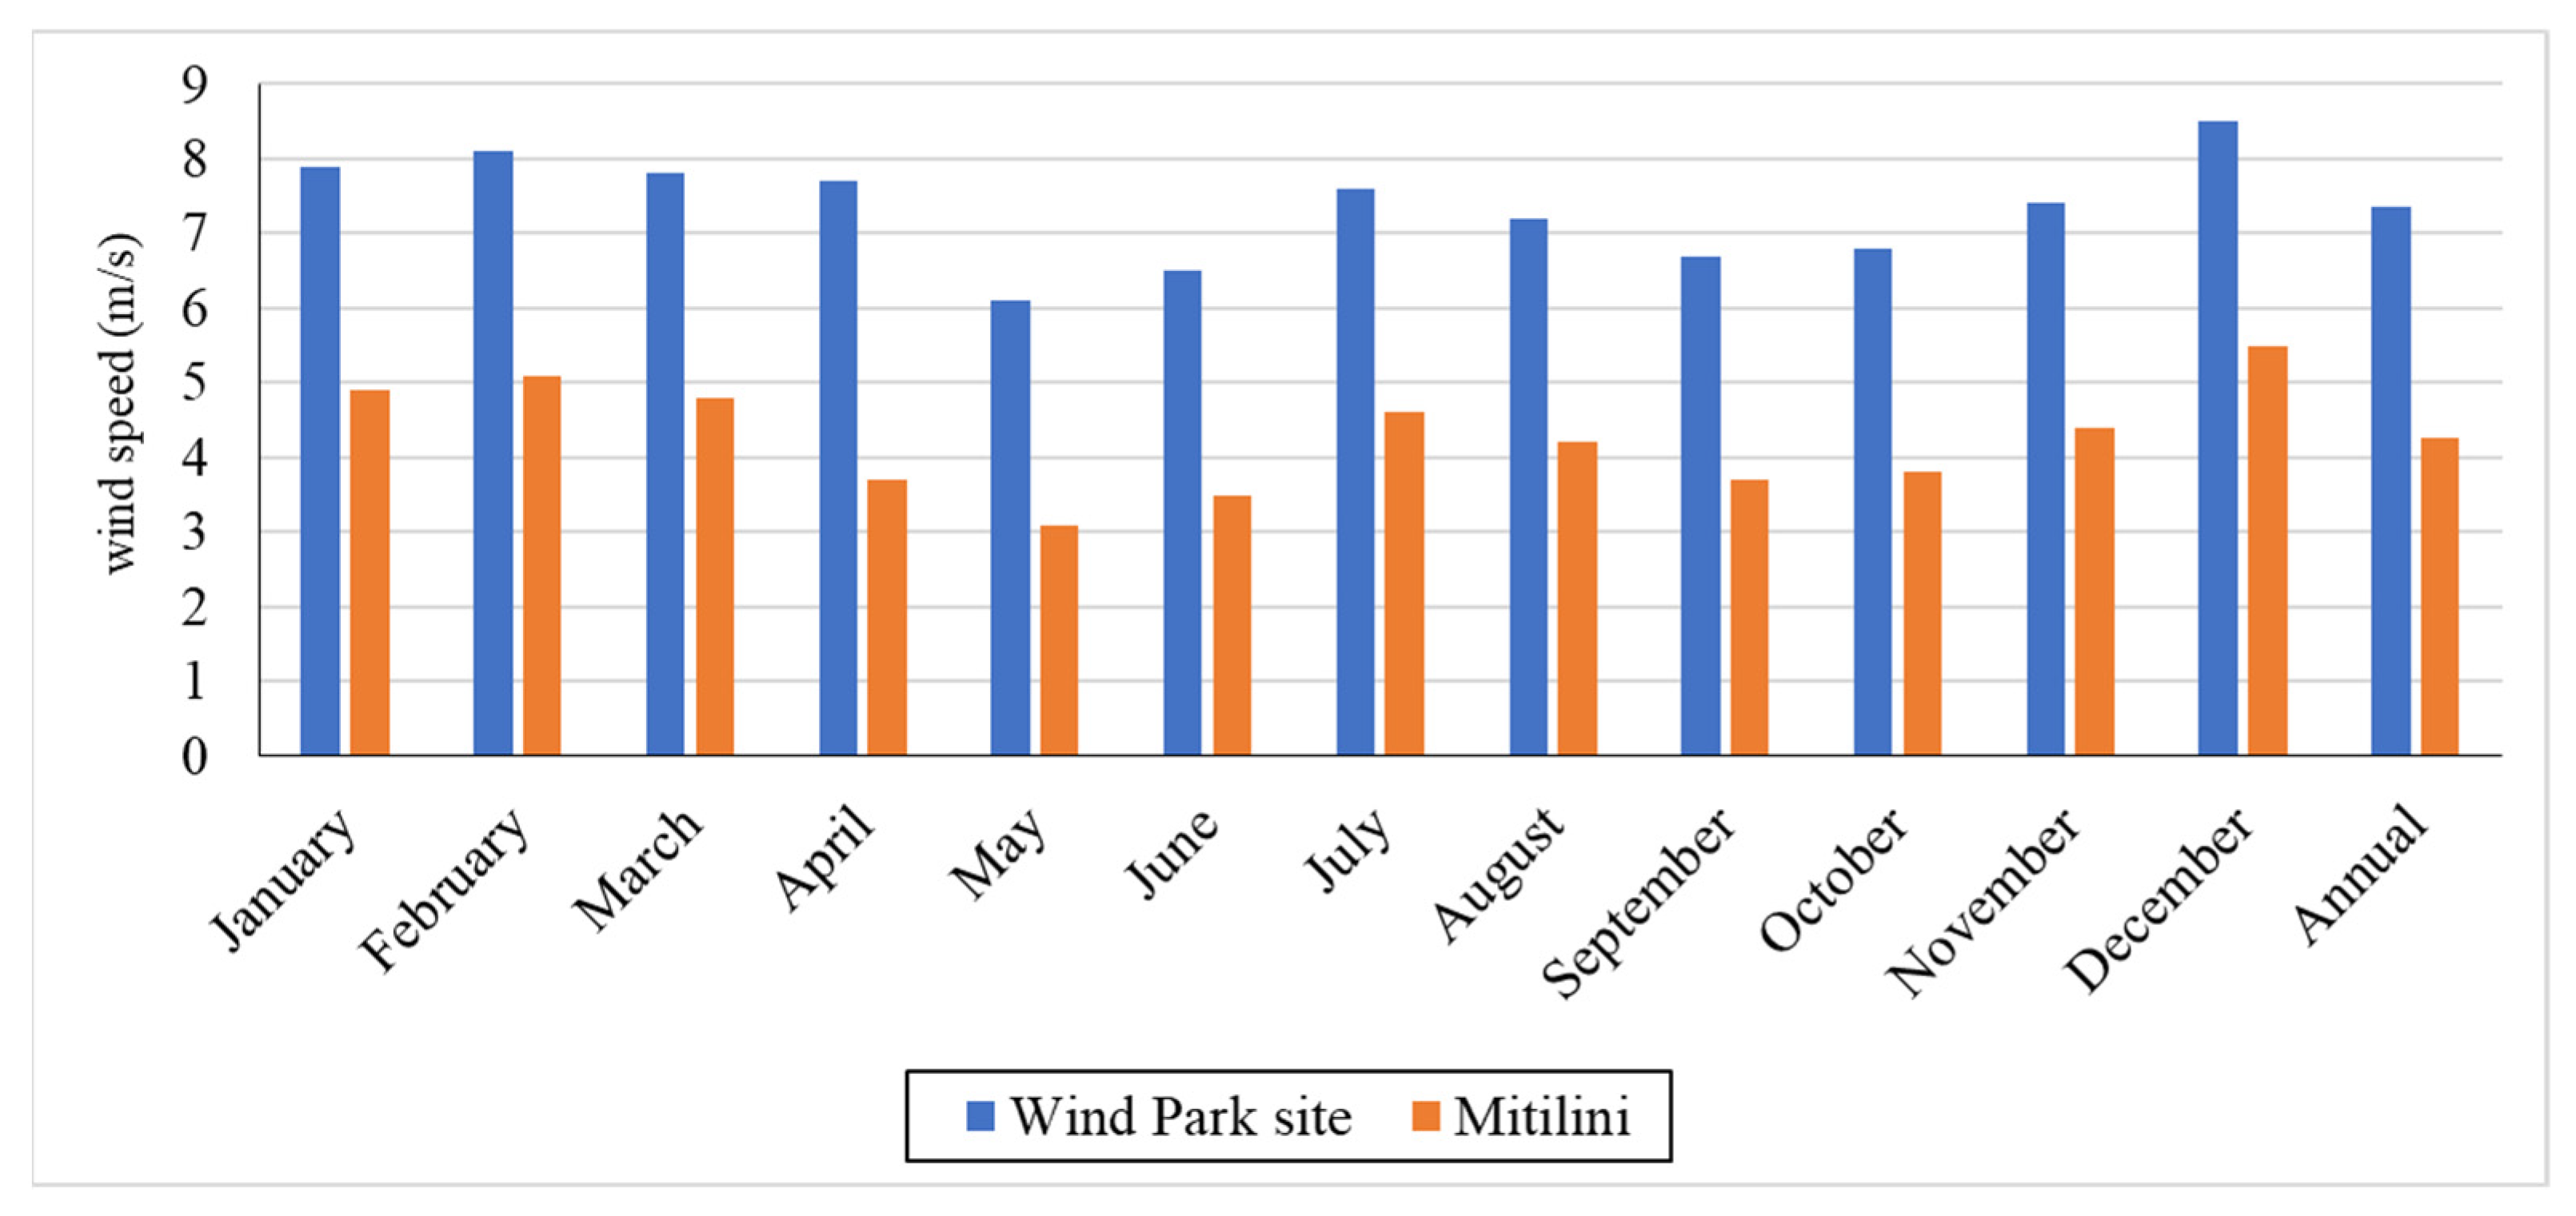
Figure 3.
Power of main and auxiliary engines for the passenger shipping vessels with the highest hoteling times in Mytilene port (June 2019).
Figure 3.
Power of main and auxiliary engines for the passenger shipping vessels with the highest hoteling times in Mytilene port (June 2019).
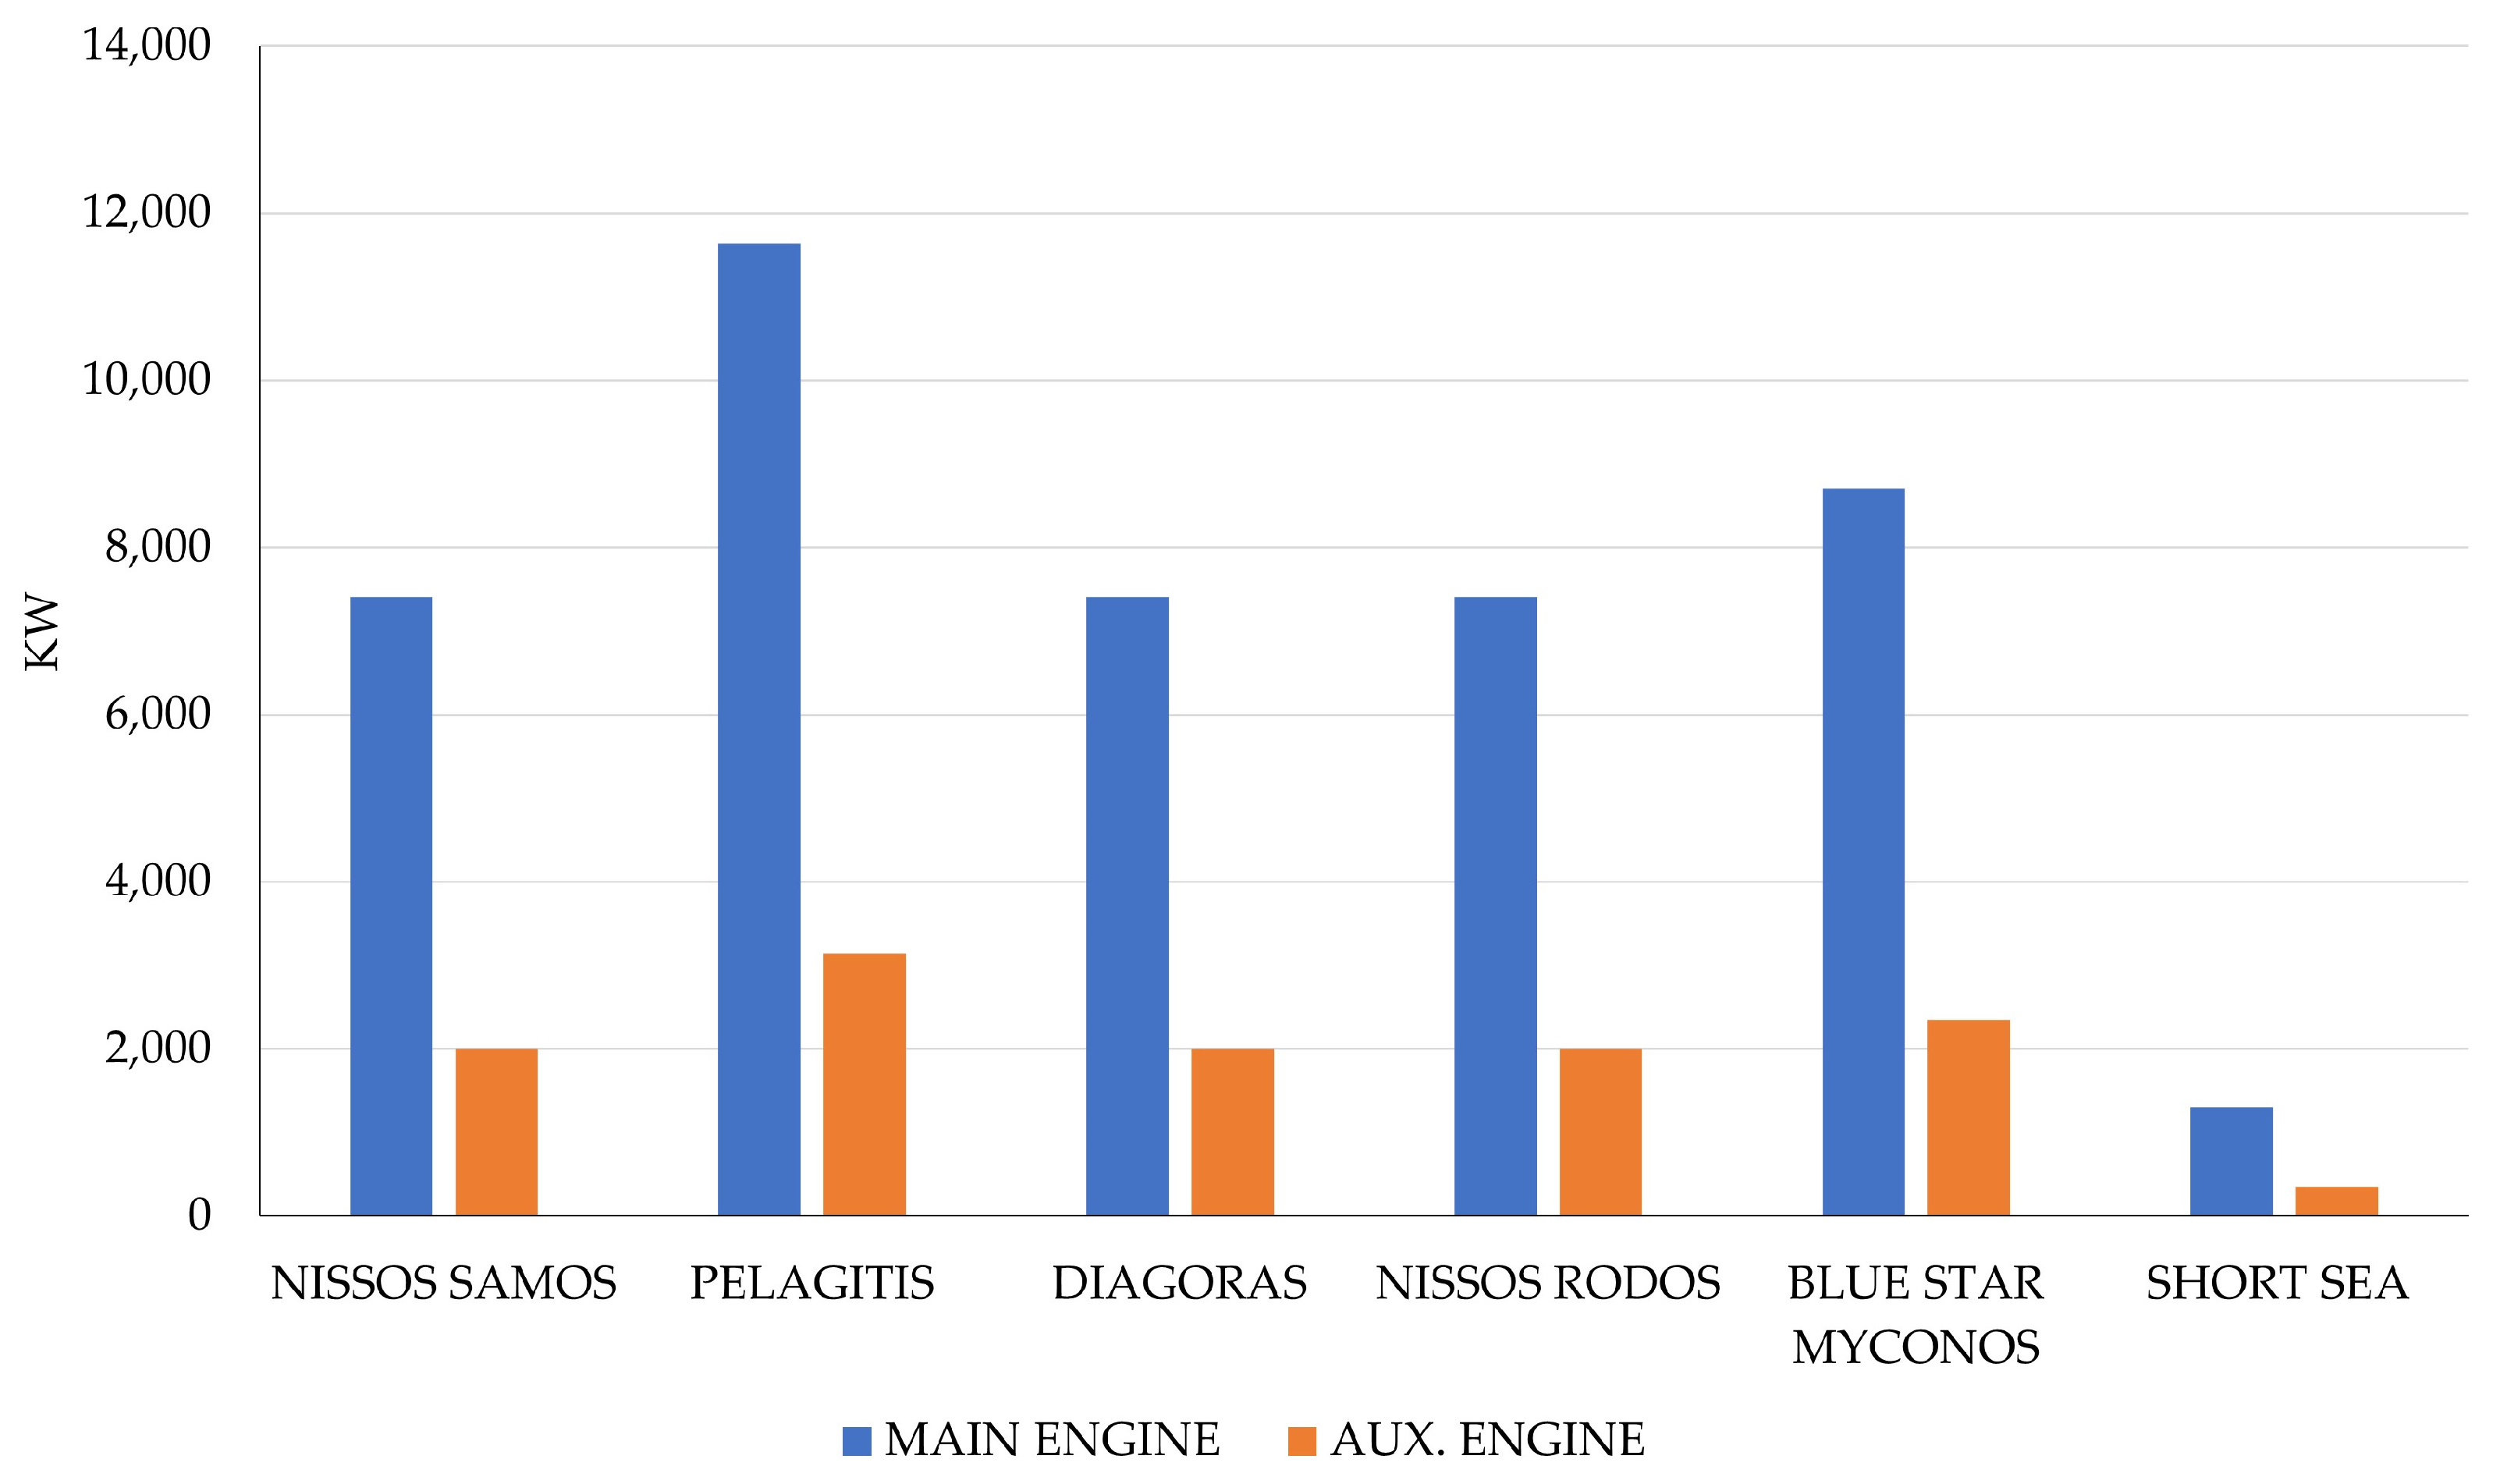
Figure 4.
The total energy demand for main and auxiliary engines for the passenger shipping vessels with the highest hoteling times in Mytilene port (June 2019).
Figure 4.
The total energy demand for main and auxiliary engines for the passenger shipping vessels with the highest hoteling times in Mytilene port (June 2019).

Figure 5.
Monthly excess energy produced by the simulated wind farm that is exported to the main electrical grid.
Figure 5.
Monthly excess energy produced by the simulated wind farm that is exported to the main electrical grid.

Table 1.
Percentage of engines’ operation (ME: main engine, AE: auxiliary engine).
| % Load ME | % Time ME | % Load AE | |
|---|---|---|---|
| Cruise | 80 | 100 | 30 |
| Maneuvering | 20 | 100 | 50 |
| Hoteling | 20 | 5 | 40 |
Table 2.
Parameters for cruising and in-port ship activity.
| Ship Type | Cruise (km/h) | Maneuvering (h) | Hoteling (h) |
|---|---|---|---|
| Ro-ro cargo | 27 | 1 | 6 |
| Passenger | 39 | 0.8 | 6 |
| Passenger (short sea) | 25 | 0.6 | 2 |
Table 3.
Design and operational parameters of the selected wind turbine type.
| Model | ENERCON—48–76 m | |
|---|---|---|
| Parameter | Unit | Value |
| Power capacity per turbine | kW | 800 |
| Number of turbines | 25 | |
| Total power capacity | kW | 20,000 |
| Hub height | m | 76 |
| Rotor diameter per turbine | m | 48 |
| Swept area per turbine | m2 | 1809.6 |
| Air temperature—annual | °C | 17.1 |
| Atmospheric pressure—annual | kPa | 99.6 |
| Wind shear exponent | 0.14 | |
| Shape factor | 2 |
Table 4.
Power and energy curve data of a simulated 20 MW wind park at Lesvos island.
| Wind Speed (m/s) | Power Curve Data (kW) | Energy Curve Data (MWh) |
|---|---|---|
| 0 | 0 | - |
| 1 | 0 | - |
| 2 | 2 | - |
| 3 | 12 | 234.07 |
| 4 | 32 | 575.20 |
| 5 | 66 | 1084.68 |
| 6 | 120 | 1697.24 |
| 7 | 191 | 2330.31 |
| 8 | 284 | 2926.60 |
| 9 | 405 | 3458.51 |
| 10 | 555 | 3916.83 |
| 11 | 671 | 4299.86 |
| 12 | 750 | 4608.18 |
| 13 | 790 | 4843.49 |
| 14 | 810 | 5009.13 |
| 15 | 810 | 5110.46 |
| 15 | 0 | - |
Disclaimer/Publisher’s Note: The statements, opinions and data contained in all publications are solely those of the individual author(s) and contributor(s) and not of MDPI and/or the editor(s). MDPI and/or the editor(s) disclaim responsibility for any injury to people or property resulting from any ideas, methods, instructions or products referred to in the content. |
© 2024 by the authors. Licensee MDPI, Basel, Switzerland. This article is an open access article distributed under the terms and conditions of the Creative Commons Attribution (CC BY) license (https://creativecommons.org/licenses/by/4.0/).
Share and Cite
MDPI and ACS Style
Kelmalis, A.; Dimou, A.; Lekkas, D.F.; Vakalis, S. Cold Ironing and the Study of RES Utilization for Maritime Electrification on Lesvos Island Port. Environments 2024, 11, 84. https://doi.org/10.3390/environments11040084
AMA Style
Kelmalis A, Dimou A, Lekkas DF, Vakalis S. Cold Ironing and the Study of RES Utilization for Maritime Electrification on Lesvos Island Port. Environments. 2024; 11(4):84. https://doi.org/10.3390/environments11040084
Chicago/Turabian StyleKelmalis, Alexandros, Andreas Dimou, Demetris Francis Lekkas, and Stergios Vakalis. 2024. "Cold Ironing and the Study of RES Utilization for Maritime Electrification on Lesvos Island Port" Environments 11, no. 4: 84. https://doi.org/10.3390/environments11040084
Note that from the first issue of 2016, this journal uses article numbers instead of page numbers. See further details here.