Origin and Background Estimation of Sulfur Dioxide in Ulaanbaatar, 2017


1
Environmental Science Department, College of New Energy and Environment, Jilin University, Changchun 130012, China
2
The Air Pollution Reducing Department, Capital City Government Building ‖, Jigjidjav street-9, Chingeltei District, Ulaanbaatar 15100, Mongolia
*
Author to whom correspondence should be addressed.
Environments 2018, 5(12), 136; https://doi.org/10.3390/environments5120136
Submission received: 24 October 2018
/
Revised: 6 December 2018
/
Accepted: 7 December 2018
/
Published: 11 December 2018
(This article belongs to the Special Issue Air Quality Assessment for Environmental Policy Support: Sources, Emissions, Exposures and Health Impacts)
Abstract
:Particulate matter studies have been conducted regularly in the capital city of Mongolia. In contrast, studies related to the source and general estimation of levels of sulfur dioxide (SO2) over whole years are lacking. To explore the yearly trend in SO2, whole-year data of air pollutants were obtained from the Air Pollution Reducing Department. The results showed that the annual average concentration of SO2 was 32.43 µg/m3 at the Amgalan official monitoring station in 2017, which changed from 53 µg/m3 in 2016, representing a reduction of around 40%. The back-trajectory model and the National Oceanic and Atmospheric Administration (NOAA)’s hybrid single particle Lagrangian integrated trajectory model (HYPSLIT) were used to determine the source of SO2. A total of 8760 backward trajectories were divided into eight groups. The results showed that 78.8% of the total trajectories in Ulaanbaatar came from an area inside Mongolia. The results showed that pollutants enter Ulaanbaatar mainly from the northwest and north during the winter season. There are industrial cities, such as Darkhan and Sukhbaatar, in North Mongolia. Air pollutants created in the industrial area traveled into Ulaanbaatar during the winter season.
1. Introduction
The population of Mongolia was around 3 million in 2017, and nearly half of its citizens are densely concentrated in the capital city, Ulaanbaatar. The reason for this crowding is the migration from rural to urban areas that has occurred in recent years [1]. To provide electricity to Mongolia’s citizens, there are three power plants in Ulaanbaatar, which consume about five million tons of coal per year [2]. About half of the total inhabitants of Ulaanbaatar live in “gers”, traditional Mongolian dwellings, which use wood and coal for cooking and heating without any pollution control devices. Huang et al. found that ger areas are a strong predictor for sulfur dioxide (SO2) concentration in both the cold and moderate season [3]. Furthermore, Zheng et al., reported that anthropogenic sources of SO2 include the burning of fossil fuels containing sulfur for domestic heating and power generation of industrial activities [4]. Raw coal is regularly used in stoves for heating traditional ger houses. Organic carbon and other pollutants are derived from coal combustion along with soot [5].
Accurate studies of particulate matter have been ongoing in Mongolia, as the country has been facing air pollution and other related problems. The scientific literature presented the results of air pollution source identification and air particulate mass apportionment based on measurement at two locations in Ulaanbaatar during 2008 and 2009 [6]. Since then, the source apportionment of particulate matter, especially fine particulate matter (PM2.5), has been investigated repeatedly by Mongolian and overseas researchers. In contrast, there is insufficient research linked to SO2. However, Allen et al. has conducted some studies that described SO2 as a major emission from coal and wood combustion [7]. Similarly, Huang et al. and Liu et al. studied the annual concentration patterns of SO2 in Mongolia and China [3,8].
Although a number of studies have reported the use of back-trajectory analyses in foreign territory for determining the long-range transport of air pollution [9,10], another study used back-trajectory analyses for haze periods in China [11]. Another study used the National Oceanic and Atmospheric Administration (NOAA)’s hybrid single particle Lagrangian integrated trajectory model (HYPSLIT) to group transport patterns of each sequential event into clusters [12]. To determine the origin of prevailing air masses, Sateesh et al. used backward trajectories computed with the HYSPLIT model in India [13]. Additionally, Franklin et al. used the Multi-Angle Imaging SpectroRadiometer (MISR) instrument onboard the NASA Terra satellite to reliably estimate ground-level concentrations of PM2.5 and SO2 in Ulaanbaatar, Mongolia [14]. Furthermore, Zheng et al. obtained measurement data from Aura, a sun-synchronous orbit satellite, to describe the long-term spatiotemporal distribution of NO2, SO2, and trace gases, such as HCHO, BrO, and OCIO, in Inner Mongolia [4]. Likewise, Qiao et al. used a community multi-scale air quality model (CMAQ), which is a regional source-oriented chemical transport model, to track emissions of NO, NO2, NH3, and SO2 from different emission sectors or source regions in China [15]. Moreover, Pu et al. used trajectory sector analysis (TSA) to identify locations of sources and the relative contribution of air pollutants, such as SO2, CO, Ox, and PM2.5, in the north of China [16].
Evidence has shown that the inhalation of SO2 through the nose can lead to the formation of sulfate, which can be absorbed into the lining of the airways and initiate a cascade of inflammation [17]. The regression of levels of ambient pollutants against fetal death as a dose-response toxicity curve revealed very strong dose-dependent response correlations for SO2, with r > 0.9 (p < 0.001), in Ulaanbaatar, Mongolia [18]. Although the urinary levels of 1-hydroxypyrene (1-OHP) of Mongolian children have been shown to be associated with polycyclic aromatic hydrocarbons (PAH) co-pollutants, SO2 and NO2 were significantly elevated during the cold season and for those living in ger areas or block brick houses in Ulaanbaatar [19]. Other evidence has shown that increased winter temperature, increased summer drought, and acidic deposition in conjunction with SO2 pose a serious threat to the forest in the vicinity of Ulaanbaatar [20]. SO2 is one of the primary pollutants that play an important role in the aerosol process and influence the acidity of precipitation [21]. To avoid the environmental ruin of Ulaanbaatar and to prevent the increasing trend in respiratory disease, regional sources of SO2 must be defined. However, no previous study has investigated such sources. This paper attempts to show that the HYPSLIT model can be used to determine regional sources of SO2.
2. Materials and Methods
2.1. Sample Collection
The concentrations of ambient air pollutants at the Amgalan official station (47.9 N, 106.9 E), as shown in Figure 1, were obtained from the Air Pollution Reducing Department of Ulaanbaatar. The air pollutant data included species, such as NOx, NO, NO2, O3, and CO, as well as particulate matter, such as PM10, PM2.5, and PM1. These pollutants were observed hourly and calculated by instruments manufactured in Japan and Germany: The APNA-360 (Horiba Corporation, Kyoto, Japan) instrument was used to estimate concentrations of NO, NO2, and NOx; the APSA-360 instrument (Horiba Corporation, Kyoto, Japan) was used to assess concentrations of SO2; and the GRIMM EDM 180 (Grimm Aerosol Technik, Ainring, Germany) instrument was used to estimate the concentrations of particulate matter. The apparatuses employed recorded the hourly variation in the concentrations of air pollutants throughout an entire year (2017).
2.2. Analytics ArcGIS
The illustration of the Amgalan official station on the Ulaanbaatar map was performed using the ArcGIS 10.5 software (Esri, Redlands CA, USA). Some raw data were missing due to apparatus malfunction and severe meteorological conditions, where the minus forty regularly occurred during winter. The data interpolation was performed using the IBM SPSS 20 software (IBM corporate, Armonk NY, USA). Missing data patterns were checked by multiple imputation commands in the program. According to the missing data pattern, 6.35% of the monotone and arbitrary data was missing. To treat the missing values, linear regression was automatically applied using multiple imputation commands in IBM SPSS 20. By reducing the amount of missing values for ambient air pollutants, multiple interpolation were performed using chained equations [22]. In order to exemplify or illustrate hourly variation in SO2 throughout the year, the Surfer 13 software (Golden Software LLC, Golden CO, USA) was used. The yearly trend in SO2 concentration is shown in Figure 2. This method was chosen because it rapidly and clearly illustrates patterns of SO2 concentration.
2.3. Backward Trajectory Using NOAA HYPSLIT and Group Clustering
The HYPSLIT model is a complete system for computing simple air parcel trajectories, complex transport, dispersion, chemical transformation, and deposition simulation. One application of HYPSLIT is a backward-trajectory analysis used to define the origin of air masses. We conducted 48 h backward-trajectories of air parcels arriving at the Amgalan site at a height of 300 m above ground level (AGL) and computed 16 universal times of coordination (UTC). The time zone of Ulaanbaatar, Mongolia is +8 UTC, and the city is located at 1350 m above sea level [1]. The backward trajectories for 2017 were generated by the NOAA HYPSLIT model using 8760 backward trajectory values.
In order to group the trajectories, Euclidian distance and stepwise cluster analysis (SCA) were used. Euclidean distance calculates the ‘as-the-crow-flies’ distance between a point X (X1, X2, etc.) and a point Y (Y1, Y2, etc.) as:
where n is the number of variables and Xi and Yi are the values of the ith variable at points X and Y, respectively [23].
SCA includes several steps: (1) Screening out the major predictors; (2) generating cluster trees through a series of cutting and merging actions; (3) validating the generated cluster trees and selecting the most suitable one; and (4) comparing with other statistical techniques for illustrating the applicability of SCA [24].
3. Results and Discussion
3.1. Missing Data Interpolation
The amount of missing values was reduced from 6.35 to 5.07%. A considerable amount of raw data was missing for carbon dioxide; the values had not been input completely due to the frequency of occurrence of missing-value monotone cases. Other pollutants, such as NO, O3, PM2.5, and PM10, had a monotone trend of missing values almost five times less than that of CO. Having a clear illustration of the SO2 contour chart enabled us to interpolate the data. Only 5.6% of the raw data for SO2 were missing. The arbitrary missing values were interpolated using linear regression, whereas the missing monotone values of SO2 were determined by predictive mean matching. Subsequently, the amount of missing SO2 values was reduced to 0%.
3.2. Mass Concentration of SO2
The hourly variation of SO2 at the Amgalan official station is depicted in Figure 2. The figure shows that SO2 concentration varied in the winter season. The highest concentration of 233.2 µg/m3 was recorded on 2 January 2017 at 11:00 p.m. This figure highlights that very high concentrations of SO2 occurred in December, January, and the start of February. Conversely, the ambient air had low concentrations of SO2 during the summer. Our observation of increased winter SO2 concentration aligns with that of Allen et al., who illustrated monthly SO2 concentrations in 2009 [7]. Our findings are also similar to those of Gunchin et al., who concluded that the coal combustion source profile is dominated by black carbon (BC) and sulfur (most likely present as sulfate species), which is characteristic of high-temperature coal combustion. They also found that the contributions of coal combustion during winter to PM2.5 levels appeared to be increasing annually [6]. We found that the average annual concentration of SO2 was 32.43 µg/m3 at the Amgalan station in 2017; this represents a reduction of around 40% from 2016, when the annual average SO2 concentration at this station was 53 µg/m3 in 2016 [25].
In 2014, there were a total of 31,755 stoves around the Amgalan station area, including 55% of improved stoves and 45% of old stoves [26]. Recently, the Mongolian government has implemented many projects to decrease the levels of toxic air pollutants in Ulaanbaatar. For instance, house stoves have been improved to reduce the use of raw coal for heating, starting in 2013. During the initial period of stove improvement, householders could not use the improved stoves and preferred to use old stoves. To increase understanding about the toxic effect of air pollutants, the Air Pollution Reducing Department of Ulaanbaatar Municipality placed advertisements and provided training for citizens. Subsequently, citizens who were living in suburban areas started to use the improved stoves. According to the Mongolian National Standard (MNS) stove standard MNS5216-1:2011, improved stoves have to emit 3 kW–7 kW of power and a maximum of 285 mg/Net MJ of particulates. Stack stoves must be 0.5 m above the edge of the house roof. According to the maximum acceptable level of toxic elements in the exhaust gas contents listed in the home stove standard MNS 5457:2005, stoves that have heat (Q) less than 0.8 joule (J) should emit at most 800 µg/m3 of SO2 along with soot whereas stoves that have 0.8 < Q < 3.15 should emit at most 600 µg/m3. These results led us to conclude that the annual average SO2 concentration has been slowly decreasing due to the activities undertaken by the government. However, the diurnal average SO2 concentration was not completely compliant with the Mongolian Air Quality Standard; the diurnal concentration of SO2, at 32.27 µg/m3, was higher than the allowable SO2 concentration of 20 µg/m3 set by the MNS4585:2007.
We observed that the SO2 concentration at the Amgalan official station was less than that at the other official station, Bayankhoshuu. The same trend in monthly SO2 variation was recorded at the Amgalan and Bayankhoshuu official stations, as shown in Figure 3. The SO2 concentration at both stations had a U-shaped trend, reaching the highest concentration in January and the lowest concentration in July. The most striking observation was that the SO2 concentration at Bayankhsohuu was 50 µg/m3 higher than at Amgalan in January whereas the SO2 concentration at Amgalan was three times lower than at Bayankhoshuu in August.
The mean concentration of SO2 was compared with those of other pollutants. The mean SO2 concentration (32 ± 1.8 µg/m3) for the whole year was higher than that of NO (26 ± 2.0 µg/m3) and NOx (0.039 ± 0.002 µg/m3), whereas the concentration of SO2 was many times less than that of CO (1061 ± 66.2 µg/m3). The mean NO concentration (35 ± 1.3 µg/m3) was the same as the average SO2 concentration. The correlation between other pollutants was evaluated, as shown in Table 1. The Pearson correlation coefficient (SPSS; bivariate correlation) was used to investigate the relationship between SO2, NOx, CO, O3, and particulate matter [27]. There was a significant positive correlation between SO2 and PM1 (r = 0.876, n = 352), PM2.5 (r = 0.873, n = 352), NO2 (r = 0.844, n = 352), and CO (r = 0.843, n = 318). This implies that the SO2 and the other pollutants were generated by the same source. SO2 plays a key role in the formation of SO42−, which is the main component of PM2.5 [2]. In contrast, SO2 was inversely correlated with O3 (r = −0.469, n = 350). This means that SO2 and O3 likely had different sources. Additionally, there are indoor sources of O3 that are of significance in certain indoor environments, such as printers, photocopies, and many other devices and appliances designed for indoor use [28]. The O3 in indoor areas can penetrate into outdoor air. Moreover, O3 may be formed from methane or volatile organic compounds.
3.3. Meteorological Conditions
During the period of air pollutant data collection, meteorological factors, such as wind speed, wind direction, temperature, humidity, and pressure, were also measured. In 2017, the annual average temperature was 0.47 °C, wind speed was 1.47 m/s, air pressure was 864.35 hPa, and humidity was 56.33%. The relationships between meteorological parameters and SO2 concentration were analyzed to diagnose whether temperature and pressure affected SO2 concentration. The results showed that humidity (r = 0.446, n = 350) and pressure (r = 0.392, n = 350) were positively correlated with SO2, whereas temperature (−r = 0.774, n = 350) and wind speed (r = −0.152, n = 350) were negatively correlated with SO2. If the ambient air pressure increased, the volume of SO2 decreased and the concentration of SO2 would increase. If wind speed was high, SO2 would disperse and the concentration of SO2 would be low.
3.4. Backward Trajectory and Group Clustering Result
The NOAA HYPSLIT model was used to describe the location of the sources of high SO2 concentration. A total of 8760 backward trajectories were generated by the NOAA HYPLSIT model. In this research, the number of clusters (k) was defined as eight using trajectory statistic value (TSV), which is represented in Figure 4.
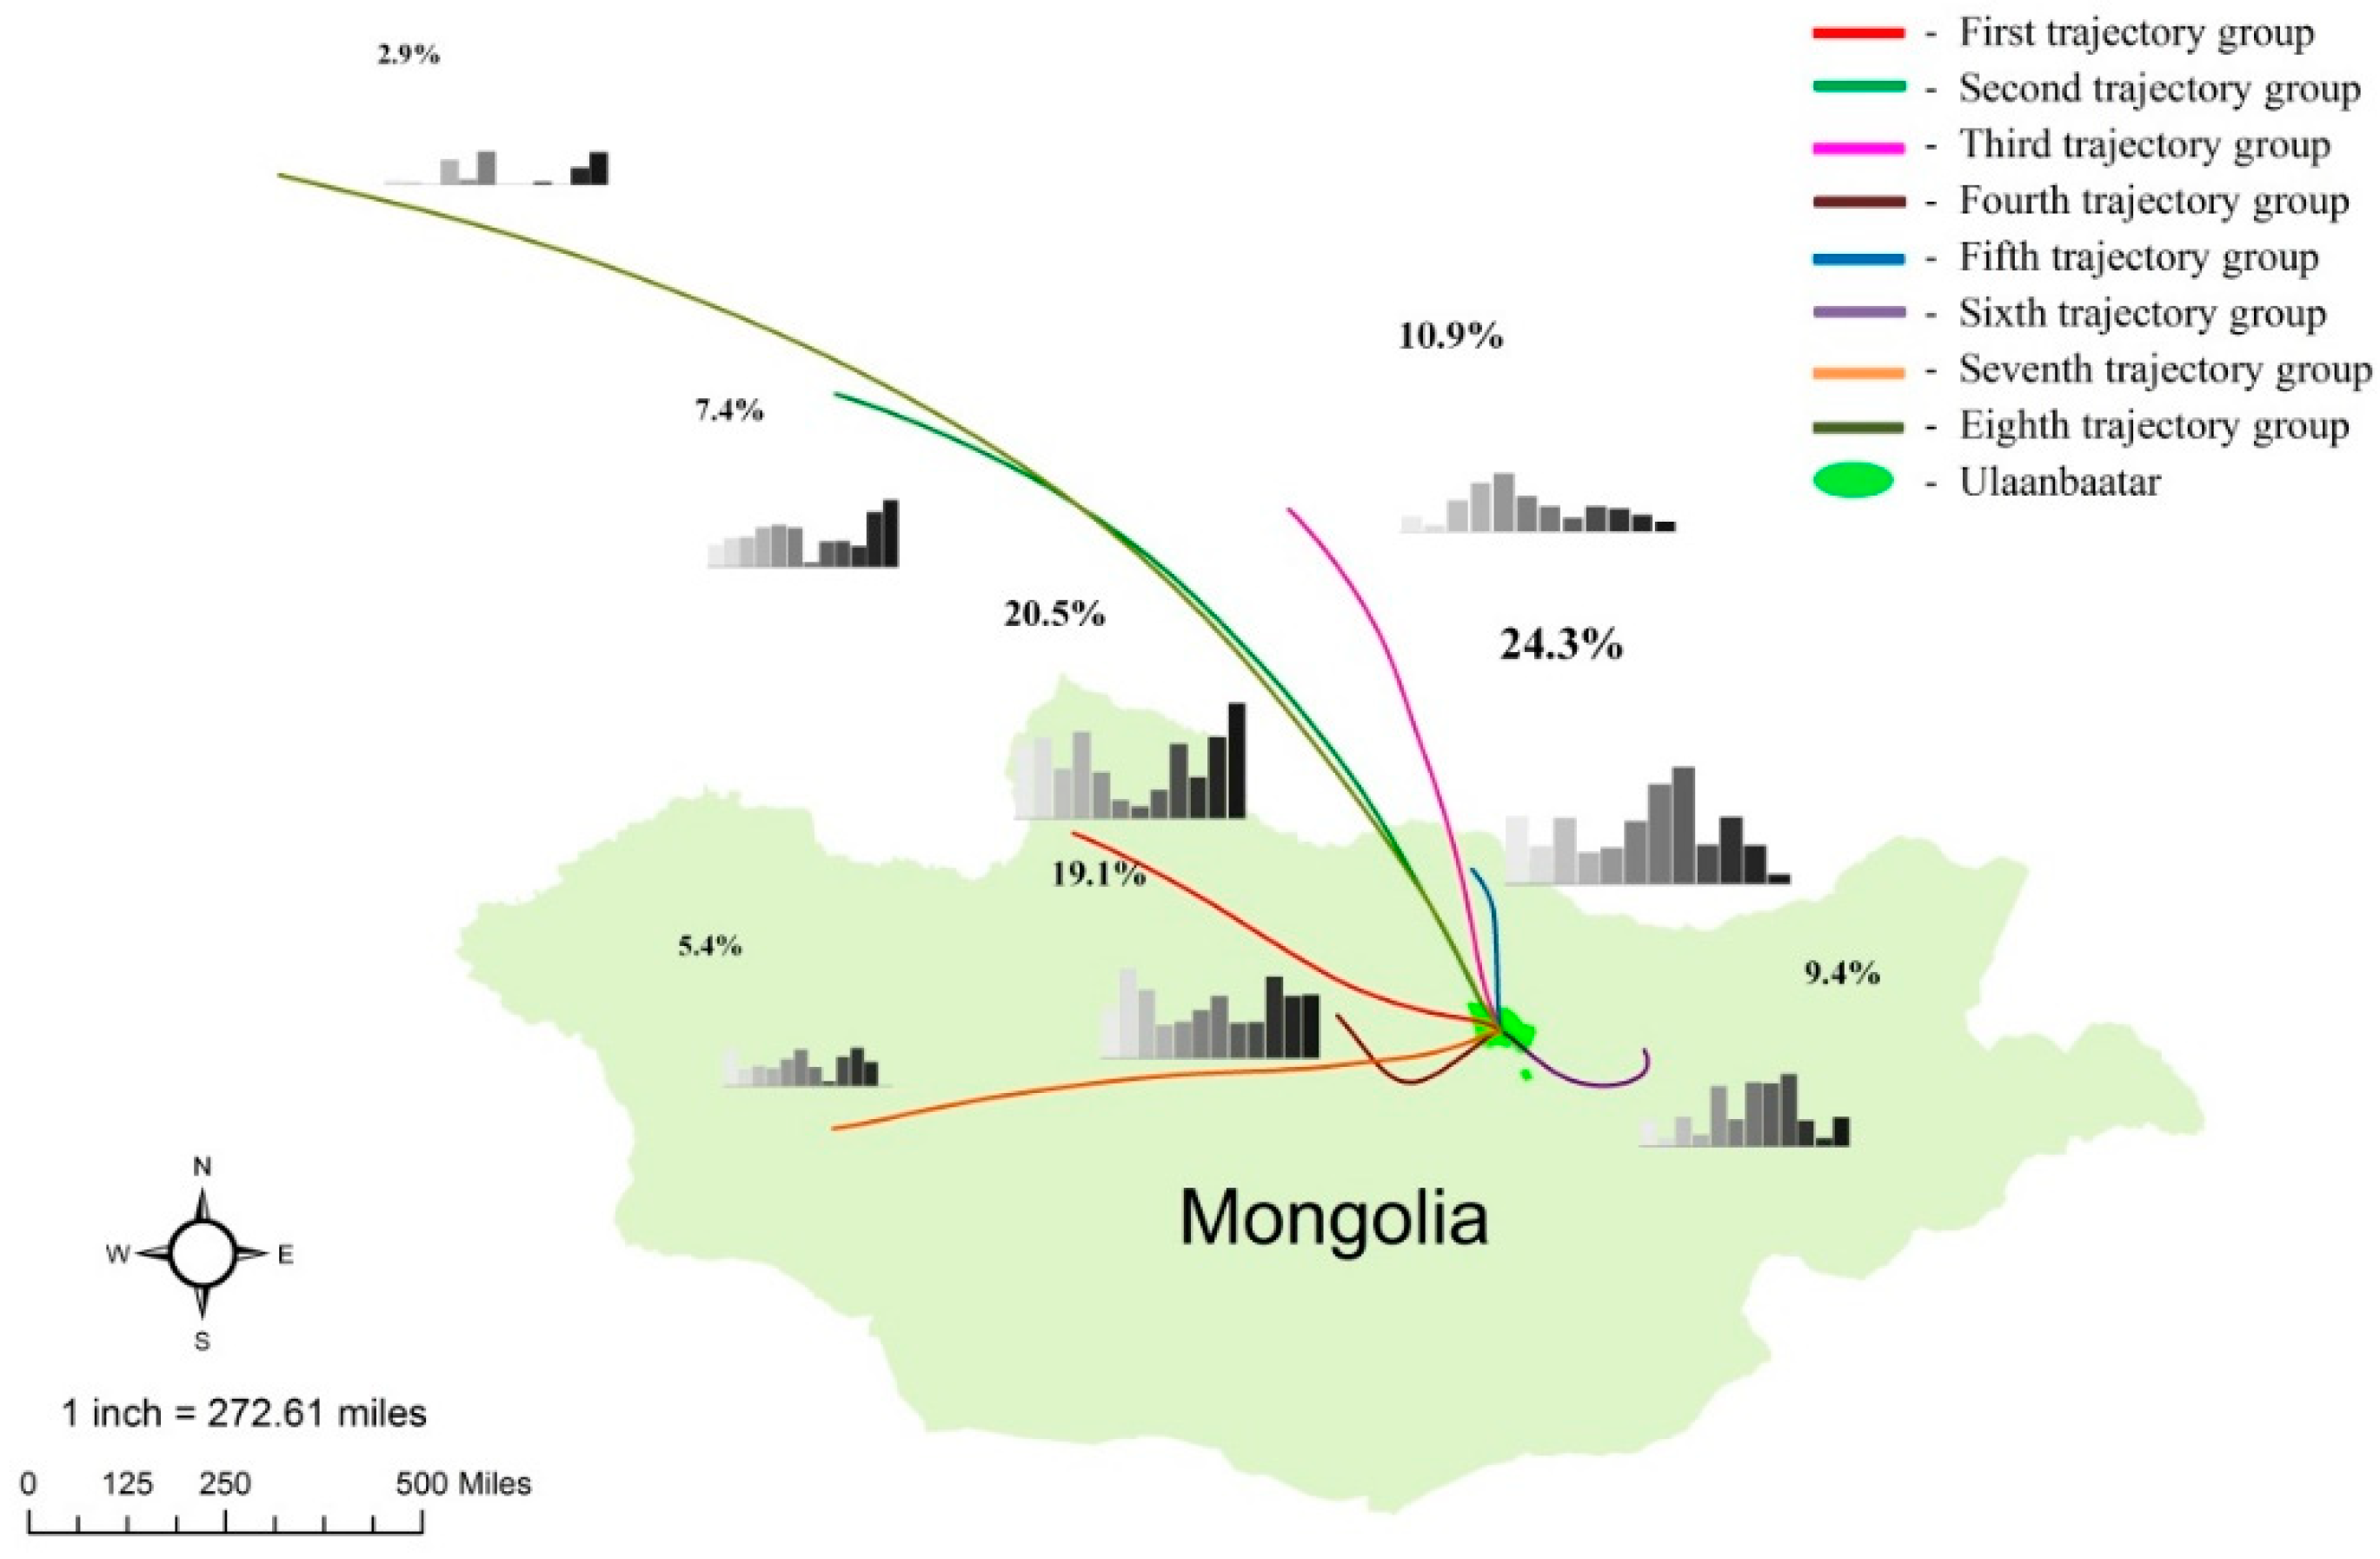
The results showed that 21.2% of total back-trajectories were sourced from foreign territories, whereas 78.8% of total back-trajectories were created inside Mongolia. As shown in Figure 5, the 8760 trajectories were divided into eight groups: The first trajectory group (20.5%), second trajectory group (7.4%), third trajectory group (10.9%), fourth trajectory group (19.1%), fifth trajectory group (24.3%), sixth trajectory group (9.4%), seventh trajectory group (5.4%), and eighth trajectory group (2.9%).
A total of 5088 trajectories were found between October and April, 48.6% of which were sourced from Northwest and Western Mongolia and 21% of which came from the north. This means that pollutants enter Ulaanbaatar mainly from the northwest and north during the winter season. In Mongolia, industrial cities, such as Darkhan and Sukhbaatar, and agricultural areas, such as Khowsgol and Bulgan, are located in the north. Luvsan et al. observed that the steel industry in North Mongolia was emitting a large amount of SO2. The daily SO2 concentration at the second site, which is located near a steel industry company located in nearly Sukhbaatar province, was 37.33 µg/m3. The authors reported a daily SO2 concentration in Ulaanbaatar of 27.3 µg/m3, and concluded that the SO2 level in Ulaanbaatar was high when the wind direction was N and NNW [29]. Air pollutants created in industrial areas traveled to Ulaanbaatar during the heating season. In contrast, few trajectories were generated from Southwest Mongolia and half of them entered Ulaanbaatar during the non-heating season. It is possible that soil particles in the southwestern arid area could affect the particulate matter in the air.
Few studies related to the trajectories of air pollutants in Mongolia have been published. We proved that the SO2 level in Ulaanbaatar is high when wind was coming from the N and NNW [29]. Additionally, Batmunkh et al. investigated the effects of air mass pathway on the characteristics of PM2.5 and mentioned that stagnant air masses originated from Russia and Kazakhstan [2]. Our current results confirmed these previous results. Table 2 shows the names of the source locations determined via back trajectories.
4. Conclusions
In order to assess yearly trends in SO2 concentration and identify the sources of this pollutant, HYPSLIT back-trajectory was used in this study. SO2 concentration was found to be higher during the heating season and was strongly positively correlated with particulate matter, nitrogen dioxide, and CO. Additionally, SO2 concentration reached a peak in January and December of 2017. To describe the sources of SO2 and other pollutants, a total of 8760 back-trajectories in 2017 were generated by HYPSLIT and divided into eight groups. Of the total trajectories, 78.2% originated within Mongolia, of which 44.8% originated in Western and Northwestern Mongolia, where large industrial and mining sites are located. Western and Northwestern Mongolia contribute considerably to the air pollution in Ulaanbaatar.
Author Contributions
M.P. performed data analysis, applied the HYPSLIT model, created Mongolian back-trajectory figure and prepared the original draft. F.C. and J.W. helped the first author to use the HYPSLIT model, analyze raw data, and review the original draft. F.C. and J.W. worked as the supervisor and director of this study, respectively. S.D. helped collect the raw data from the monitoring stations.
Funding
This research received no external funding.
Acknowledgments
The authors would like to thank the Air Pollution Reducing Department for supporting us. We would also like to thank the group members of Laboratory 537 and the International Education College of Jilin University.
Conflicts of Interest
The authors declare no conflict of interest.
References
- Amarsaikhan, D.; Battsengel, V.; Nergui, B.; Ganzorig, M.; Bolor, G. A Study on Air Pollution in Ulaanbaatar City, Mongolia. J. Geosci. Environ. Prot. 2018, 2, 123–128. [Google Scholar] [CrossRef]
- Batmunkh, T.; Kim, Y.J.; Jung, J.S.; Park, K.; Tumendemberel, B. Chemical characteristics of fine particulate matters measured during severe winter haze events in Ulaanbaatar, Mongolia. J. Air Waste Manag. Assoc. 2018, 63, 659–670. [Google Scholar] [CrossRef]
- Huang, Y.K.; Luvsan, M.E.; Gombojav, E.; Ochir, C.; Bulgan, J.; Chan, C.C. Land use patterns and SO2 and NO2 pollution in Ulaanbaatar, Mongolia. Environ. Res. 2013, 124, 1–6. [Google Scholar] [CrossRef] [PubMed]
- Zheng, C.; Zhao, C.; Li, Y.; Wu, X.; Zhang, K.; Gao, J. Spatial and temporal distribution of NO2 and SO2 in Inner Mongolia urban agglomeration obtained from satellite remote sensing and ground observations. Atmos. Environ. 2018, 188, 50–59. [Google Scholar] [CrossRef]
- Nishikawa, M.; Matsui, I.; Batdorj, D.; Jugder, D.; Mori, I.; Shimizu, A.; Sugimoto, N.; Takahashi, K. Chemical composition of urban airborne particulate matter in Ulaanbaatar. Atmos. Environ. 2018, 45, 5710–5715. [Google Scholar] [CrossRef]
- Gunchin, G.; Sereeter, L.; Dagva, S.; Tsenddavaa, A.; Davy, P.K.; Markwitz, A.; Trompetter, W.J. Air Particulate Matter Pollution in Ulaanbaatar City, Mongolia. Int. J. PIXE 2018, 22, 165–171. [Google Scholar] [CrossRef]
- Allen, R.W.; Gombojav, E.; Barkhasragchaa, B.; Byambaa, T.; Lkhasuren, O.; Amram, O.; Takaro, T.K.; Janes, C.R. An assessment of air pollution and its attributable mortality in Ulaanbaatar, Mongolia. Air Qual. Atmos. Health 2018, 6, 137–150. [Google Scholar] [CrossRef] [PubMed]
- Liu, Q.; Wang, Q. Sources and flows of China’s virtual SO2 emission transfers embodied in interprovincial trade: A multiregional input–output analysis. J. Clean. Prod. 2017, 161, 735–747. [Google Scholar] [CrossRef]
- Qiao, X.; Ying, Q.; Li, X.; Zhang, H.; Hu, J.; Tang, Y.; Chen, X. Source apportionment of PM2.5 for 25 Chinese provincial capitals and municipalities using a source-oriented Community Multiscale Air Quality model. Sci. Total Environ. 2018, 612, 462–471. [Google Scholar] [CrossRef]
- Reizer, M.; Orza, J.A.G. Identification of PM10 air pollution origins at a rural background site. E3S Web Conf. 2018, 01031, 1–7. [Google Scholar] [CrossRef]
- Zhang, Y.; Angelidaki, I.; Bandyopadhyay, P.R.; Thivierge, D.P.; McNeilly, F.M.; Fredette, A.; Ren, S.; Xia, X.; Yuan, L.; Liang, P.; et al. Current research trend on urban sewerage system in China Yun-Fang. IOP Conf. Ser. Earth Environ. Sci. 2017, 59, 012048. [Google Scholar]
- Anil, I.; Alagha, O.; Karaca, F. Effects of transport patterns on chemical composition of sequential rain samples: Trajectory clustering and principal component analysis approach. Air Qual. Atmos. Health 2017, 10, 1193–1206. [Google Scholar] [CrossRef]
- Sateesh, M.; Soni, V.K.; Raju, P.V.S.; Mor, V. Cluster analysis of aerosol properties retrieved from a sky-radiometer over a coastal site: Thiruvananthapuram, India. Atmos. Pollut. Res. 2018, 9, 207–219. [Google Scholar] [CrossRef]
- Franklin, M.; Chau, K.; Kalashnikova, O.V. Using Multi-Angle Imaging SpectroRadiometer Aerosol Mixture Properties for Air Quality Assessment in Mongolia. Remote Sens. 2018, 10, 1317. [Google Scholar] [CrossRef]
- Qiao, X.; Tang, Y.; Hu, J.; Zhang, S.; Li, J.; Harsha, S.; Wu, L.; Gao, H.; Zhang, H.; Ying, Q. Science of the Total Environment Modeling dry and wet deposition of sulfate, nitrate, and ammonium ions in Jiuzhaigou National Nature Reserve, China using a source-oriented CMAQ model: Part I. Base Case Model Results. Sci. Total Environ. 2015, 532, 831–839. [Google Scholar] [CrossRef] [PubMed]
- Pu, W.; Shi, X.; Wang, L.; Xu, J.; Ma, Z. Potential source regions of air pollutants at a regional background station in Northern China. Environ. Technol. 2018, 1–10. [Google Scholar] [CrossRef] [PubMed]
- USEPA. Integrated Science Assesment for Sulfur Dioxide—Health Criteria; EPA: Washington, DC, USA, 2009.
- Enkhmaa, D.; Warburton, N.; Javzandulam, B.; Uyanga, J.; Khishigsuren, Y.; Lodoysamba, S.; Enkhtur, S.; Warburton, D. Seasonal ambient air pollution correlates strongly with spontaneous abortion in Mongolia. BMC Pregnancy Childbirth 2014, 14, 1–7. [Google Scholar] [CrossRef]
- Chen, Y.T.; Huang, Y.K.; Luvsan, M.E.; Gombojav, E.; Ochir, C.; Bulgan, J.; Chan, C.C. The influence of season and living environment on children’s urinary 1-hydroxypyrene levels in Ulaanbaatar, Mongolia. Environ. Res. 2015, 137, 170–175. [Google Scholar] [CrossRef]
- Hauck, M.; Dulamsuren, C.; Leuschner, C. Anomalous Increase in Winter Temperature and Decline in Forest Growth Associated with Severe Winter Smog in the Ulan Bator Basin. Water Air Soil Pollut. 2016, 227. [Google Scholar] [CrossRef]
- Quan, J.; Zhang, X. Assessing the role of ammonia in sulfur transformation and deposition in China. Atmos. Res. 2008, 88, 78–88. [Google Scholar] [CrossRef] [Green Version]
- Langkamp, D.L.; Lehman, A.; Lemeshow, S. Techniques for handling missing data in secondary analyses of large surveys. Acad. Pediatr. 2010, 10, 205–210. [Google Scholar] [CrossRef] [PubMed]
- Madhulatha, T.S. An Overview on Clustering Methods. IOSR J. Eng. 2012, 2, 719–725. [Google Scholar] [CrossRef]
- Sun, J.; Li, Y.P.; Gao, P.P.; Suo, C.; Xia, B.C. Analyzing urban ecosystem variation in the City of Dongguan: A stepwise cluster modeling approach. Environ. Res. 2018, 166, 276–289. [Google Scholar] [CrossRef] [PubMed]
- JAICA. The Final Report of Improvement of Air Quality Project; JAICA: Ulaanbaatar, Mongolia, 2017. Available online: http://open_jicareport.jica.go.jp/pdf/12289195.pdf (accessed on 24 October 2018).
- Ulaanbaatar Air Quality Division. Ulaanbaatar Clean Air Project; Ulaanbaatar Air Quality Division: Ulaanbaatar, Mongolia, 2014. [Google Scholar]
- Fang, C.; Zhang, Z.; Jin, M.; Zou, P.; Wang, J. Pollution characteristics of PM2.5 aerosol during haze periods in changchun, China. Aerosol Air Qual. Res. 2017, 17, 888–895. [Google Scholar] [CrossRef]
- Salonen, H.; Salthammer, T.; Morawska, L. Human exposure to ozone in school and office indoor environments. Environ. Int. 2018, 119, 503–514. [Google Scholar] [CrossRef] [PubMed]
- Luvsan, M.E.; Shie, R.H.; Purevdorj, T.; Badarch, L.; Baldorj, B.; Chan, C.C. The influence of emission sources and meteorological conditions on SO2 pollution in Mongolia. Atmos. Environ. 2012, 61, 542–549. [Google Scholar] [CrossRef]
Figure 1.
Location of the Amgalan (A) and Bayankhoshuu (B) official monitoring stations in Ulaanbaatar, Mongolia.
Figure 1.
Location of the Amgalan (A) and Bayankhoshuu (B) official monitoring stations in Ulaanbaatar, Mongolia.

Figure 2.
Hourly variation in SO2 concentrations in 2017.

Figure 3.
Comparison of SO2 concentration trends at the Amgalan and Bayankhoshuu official stations in Ulaanbaatar, Mongolia.
Figure 3.
Comparison of SO2 concentration trends at the Amgalan and Bayankhoshuu official stations in Ulaanbaatar, Mongolia.

Figure 4.
Change in trajectory statistic value (TSV) based on number of clusters.

Figure 5.
The eight most common backward-trajectory clusters.


Table 1.
Pearson’s correlation coefficient between SO2 and other pollutants.
| NO | NO2 | CO | O3 | PM10 | PM2.5 | PM1 | NOx | |
|---|---|---|---|---|---|---|---|---|
| SO2 | 0.680 ** | 0.844 ** | 0.843 ** | −0.469 ** | 0.519 ** | 0.873 ** | 0.876 ** | 0.736 ** |
| Sig. (2-tailed) | 0.000 | 0.000 | 0.000 | 0.000 | 0.000 | 0.000 | 0.000 | 0.000 |
| N | 351 | 352 | 318 | 350 | 352 | 352 | 352 | 365 |
Notes: ** Correlation is significant at the 0.01 level.
Table 2.
Results of back-trajectory clustering with eight clusters.
| Group Trajectory Cluster No. | Number of Members | Longitude of Source | Latitude of Source | Name of Source | Percentage of Total Trajectory (%) |
|---|---|---|---|---|---|
| 1 | 1344 | 99.12 | 50.29 | Altraga sum, Khowsgol Province, Mongolia | 20.5 |
| 2 | 427 | 94.75 | 55.18 | Krasnoyarsk Krai, Russia | 7.4 |
| 3 | 468 | 103.08 | 53.94 | Irkutsk Oblast, Russia | 10.9 |
| 4 | 1129 | 103.97 | 48.11 | Burenkhangai, Bulgan Province, Mongolia | 19.1 |
| 5 | 1008 | 107.33 | 49.26 | Yeruu, Sukhbaatar Province, Mongolia | 24.3 |
| 6 | 272 | 109.61 | 47.68 | Jargaltkhaan, Khentii Province, Mongolia | 9.4 |
| 7 | 269 | 94.715 | 46.70 | Darvi sum, Govi-Altai Province, Mongolia | 5.4 |
| 8 | 171 | 84.53 | 57.41 | Tomsk Oblast, Russia | 2.9 |
© 2018 by the authors. Licensee MDPI, Basel, Switzerland. This article is an open access article distributed under the terms and conditions of the Creative Commons Attribution (CC BY) license (http://creativecommons.org/licenses/by/4.0/).
Share and Cite
MDPI and ACS Style
Prikaz, M.; Fang, C.; Dash, S.; Wang, J. Origin and Background Estimation of Sulfur Dioxide in Ulaanbaatar, 2017. Environments 2018, 5, 136. https://doi.org/10.3390/environments5120136
AMA Style
Prikaz M, Fang C, Dash S, Wang J. Origin and Background Estimation of Sulfur Dioxide in Ulaanbaatar, 2017. Environments. 2018; 5(12):136. https://doi.org/10.3390/environments5120136
Chicago/Turabian StylePrikaz, Makhbal, Chunsheng Fang, Sanchirbayar Dash, and Ju Wang. 2018. "Origin and Background Estimation of Sulfur Dioxide in Ulaanbaatar, 2017" Environments 5, no. 12: 136. https://doi.org/10.3390/environments5120136
Note that from the first issue of 2016, this journal uses article numbers instead of page numbers. See further details here.