Article

Optimal Sizing and Location of Co-Digestion Power Plants in Spain through a GIS-Based Approach

by
Laura Álvarez-de Prado
,
Miguel De Simón-Martín
,
Ana-María Diez-Suárez
,
Jorge Juan Blanes-Peiró
and
Alberto González-Martínez
*
Energy Resources’ Smart Management (ERESMA) Research Group, School of Energy and Mining Engineering, Universidad de León, 24071 León, Spain
*
Author to whom correspondence should be addressed.
Environments 2018, 5(12), 137; https://doi.org/10.3390/environments5120137
Submission received: 7 November 2018 / Revised: 4 December 2018 / Accepted: 10 December 2018 / Published: 13 December 2018
(This article belongs to the Special Issue Renewable Energy Systems and Sources)

Abstract

:
The promotion of the development of co-digestion power plants will be intensified in many European Union member states as the main target of the Union concerning energy generation is complete decarbonisation by 2050. This potential expansion prompts the need for optimal resources allocation according to several techno-economical parameters, highlighting energy costs, power infrastructures access, and social and environmental aspects and restrictions. In Spain, agricultural and livestock biogas production trough co-digestion power plants is still poorly deployed, although the EU Directive 2009/28/EU stipulates that energy from bio-fuels and bio-liquids should contribute to a reduction of at least 35% of greenhouse gas emissions in order to be taken into account, and many authors agree that biogas produced from energy crops and livestock waste fulfils this criterion. Moreover, biogas can be used to upgrade gas pipelines and may have other efficient thermal uses. In this paper, through a Geographical Information System approach, eight different co-digestion mixtures have been evaluated and the most profitable ones have been optimized for the Spanish Iberian Peninsula according to the geographical distribution of the resources. Furthermore, the best locations for co-digestion power plants siting have been calculated, minimizing transport costs and considering technical, environmental and social restrictions. In contrast with other studies, this proposed approach is focused on a holistic optimization. Results show that in Spain the most feasible co-digestion mixtures are based on slurry, glycerine and animal meals, and four areas arise with an outstanding energetic potential up to 208 MW exploitable in large electrical power plants, while 347 MW can be reserved for distributed generation based on this technology.

1. Introduction

1.1. Impact and Prospective of Co-Digestion Power Plants for a Decarbonized Generation System in Europe

The European Union (EU) states on its energy roadmap for 2050 that EU members have to prepare their infrastructure for further decarbonisation of its energy system in the longer term towards 2050. This framework should, therefore, also be able to accommodate possible future EU energy and climate policy objectives [1], being aligned with the goal of promoting the large-scale use of renewable energy sources, but always considering minimum cost and maximum efficacy criteria. Thus, most EU members have been carrying out energy policies according to the 2050 roadmap since several years ago, with different success rates depending on the economic and financial circumstances. With the aim to reduce by 2030 at least 40% of the CO2 emissions in comparison with the 1990 levels in the energy sector, the renewable energy sources (RES) must be highly promoted.
The Organization for Economic Co-operation and Development (OECD) defines waste as “matters that, generated in the activities of production and consumption, do not reach in the context in which they produce any economic value, either because there is no adequate technology for their use or because there is no market for the recovered products” [2].
The production of biogas in a more sustainable way, boosted by the intensification of crop rotation, use of agro-industrial waste, and recycling the nutrients of by-products, is in progress. Biogas from digestion has increasingly been considered a feasible alternative to energy from fossil fuels, among the RES exploitation. On the other hand, an increase of 70% compared to 2012 in the generation of waste is expected by most part of the experts, reaching 2.23 billion tons per year [3].
Biogas contains a high percentage (between 50% and 70%) of methane, CH4, so it is suitable for use in combustion in engines, turbines or boilers, either alone or mixed with another fuel [4], which contributes to a reduction of the greenhouse gas emissions derived from the reduction of uncontrolled emissions of CH4 (which produces a greenhouse effect that can be up to 20 times worse than the same amount of CO2) [5], and a reduction of CO2 saved by substitution of fossil energy [6].
Unlike other RESs, anaerobic digestion processes are associated with a series of uncertainties, which makes it difficult to generalize the technical and economic potential at regional or national levels, mainly due to the diversity of potentially suitable raw material substrates, its geographical distribution, and scale and co-existence factors [7].
According to data from the Government, currently in Spain there are 79 installations (see Figure 1) registered for the production of electrical energy from waste processed by anaerobic digestion processes [8], accumulating a generation rated power greater than 84 MW (which constitutes the 0.17% of total installed RES in Spain, as can be seen in Table 1). In this sense, wind and photovoltaic energy sources seem to be the leaders in the near future due to the high availability and significant reduction of costs, despite their low average load factors. Although biogas power plants show lower installed capacity, they have an outstandingly high load factor. More than a half of the installations have a rated power lower than 500 kW, as shown in Figure 1b. The main reason of this low rated power for the installations can be found in the advantageous Feed-in-Tariff (FIT) supporting legislation [9] (currently not in force), which promoted small power plants without taking into account an efficient design based on the amount of resources available.
Then, co-digestion-based power plants, both in distributed generation or in large concentrated power plants, will help to meet the objectives set by Europe in relation to RES penetration for the 2030 and 2050 energy supply scenarios [10]. Moreover, the generation of waste in Spain is agglomerated mainly in the agro-industrial sector and it must be noticed that Spain is one of the largest agricultural producers in Europe [3].
Observe that, on the contrary of other sorts of RESs, the energy resource in this case is limited, so it results essential to optimize its use. However, the planning of this type of power plant has been conditioned by the existing remuneration framework, which, because the resources are limited, has not led to optimal results.

1.2. Geographic Information Systems: Applications for Energy Planning

Geographic Information Systems (GIS) are a relatively disruptive technology that has arisen in the recent years to help in many disciplines which use georeferenced data. Currently, there are several studies that have applied GIS in energy planning, and its application has been extended as it has been proven useful in addressing spatial optimization problems.
One significant study in this field was conducted by Ozsoy et al., who in [12] examined the quantity and types of animals in different districts of Bursa (Turkey) over 11 years. The GIS was used with the purpose of creating an accurate database, capable of being updated and modified easily, transferring the information contained in the database to results in georeferenced visual maps. The obtained results helped to determine the power generation capacity in the region and the authors could conclude that its use would constitute 22.78% of the electric power consumption of the district.
Other studies conducted in southern Finland, such as [13], evaluated the spatial distribution and quantity of available biomass for methane production, trying to optimize the locations and sizes of potential biogas-based power plants in the area. A methodology based on a GIS was used, considering communication networks and biomass sources. Two approaches were applied, taking into account regional distinctions for the production of biogas, injecting biogas into its distribution network or using it for electricity generation. For each initial location, the quantities of biomass available within the collection area were determined and the theoretical electrical potentials were calculated assuming an annual operation of 8000 h. The study concludes that the rated power of the new proposed power generation plants should be in the range between 2.1 MW and 16.8 MW.
In [14], the authors applied a GIS tool to generate indicators to describe the production of olive pomace in different geographical areas in the region of Sicily. The geographical detection of these indicators, followed by a policy of crop rotation, allowed the reduction of the environmental burden caused by the processes of elimination of waste from the olive oil industry. The model used data from the olive oil industries, collected by carrying out specific surveys, and included the calculation of indicators relating the olive oil producing areas, the amount of olive oil produced in each area and the amount of olive pomace obtained. In addition, the GIS-based model applied in this study contributed to improve the sustainability of the biogas sector.
Other similar studies, such as [15], which was performed in southern Italy, evaluated the production of biogas in a more sustainable manner through the rotation of crops, the use of agro-industrial waste and the recycling of nutrients from the by-products used in the production of biogas. In this way, this study investigates the possibility of using citrus pulp as a possible matrix of the mixture necessary to feed anaerobic digesters in areas where the biogas sector is still developing. Based on an extensive database based on the Agricultural Census of 2010, and using a GIS tool, the potential associated with the estimated amount of citrus for biogas production can be evaluated.
Sliz-Szkliniarz et al. [16] developed a study based on assessing the potential of biogas production from manure and energy crops at a regional scale in the Polish province of Kujawsko-Pomorskie Voivodeship. The adopted GIS methodology in this case allowed the integration of different environmental factors, such as the conservation of nature or the protection of water, technical criteria (proximity to electricity grids or natural gas networks) and economic criteria (transport costs of raw materials, proximity to roads, etc.). The authors proposed the optimal locations of biogas power plants, considering as a technical solution the combined generation of heat and electricity (CHP) and the injection of biogas in the gas distribution network.
The generation of electricity in rural areas through the methanization process is very promising in countries such as India where the availability of organic materials for obtaining biomass is very high and the degree of electrification has not yet been completed [17]. The current availability of electricity is insufficient for the industry and they have to use diesel generators to cover their needs. In addition, the population has to adjust their way of living with a minimum supply experiencing difficulties in their daily lives. The spatial availability of raw materials and their equivalent in methanization potential has been analysed, and registered through a GIS in [17], in order to spatially and geographically manage the information. Through the surveys carried out previously, 7 different types of raw materials for the generation of biogas are identified. Then, the creation of an optimal network for collection and transport of raw materials to the biogas plant is proposed, since transport costs over long distances are not economically viable. It is concluded that a total of 37,000 Nm3 of methane can be produced, sufficient for a continuous generation of electricity of 5.3 MW.
Panichelli et al. [18] presented a decision-making system based on GIS to locate bioenergy plants at lower cost when there is a significant variability in the price of biomass and when more than one bioenergy plant has to be placed in the region. The adopted criterion is to assign the locations where the biomass has a lower cost.
For Japan, Babalola [19] developed a selection siting process to fulfil environmental, technical, and economic criteria, for an anaerobic digestion plant.
To the authors’ concern this approach has not been applied and validated in Spain yet. Thus, in this paper, a GIS model for the optimization of several co-digestion feasible mixtures is presented taking advantage of agricultural and livestock waste data, and a decision tool for energy planning is proposed with the aim of optimal sitting of biogas-based power plants minimizing transport costs and considering technical, environmental and social restrictions. In contrast with other studies, the proposed approach is focused in a holistic optimization and can be easily extended to other EU regions and other generation technologies with resource restrictions.
The main aim of this study is to evaluate the maximum generation potential with co-digestion-based power plants and, as novel approach, to differentiate the power capacity of this technology which must be exploited in centralized power plants (rated power higher than 10 MW) from the capacity that can be reserved for distributed generation, taking into account the effect of the resources consumption interaction (resources that are derived for distributed generation cannot be exploited in centralized power plants). Thus, based on a GIS optimization, optimal clusters have been defined and optimal power plants locations are proposed according to other geographical factors, including access to roads and the power grid.
This paper is structured in three more sections. The second section describes both the used data, the applied biogas and power generation estimation models and its GIS implementation. Next, results for the feasible co-digestion mixtures are presented and discussed and finally, main conclusions are shown, including the optimal location and sizing of centralized power plants based on co-digestion processes according to the available resources in the area.

2. Materials and Methods

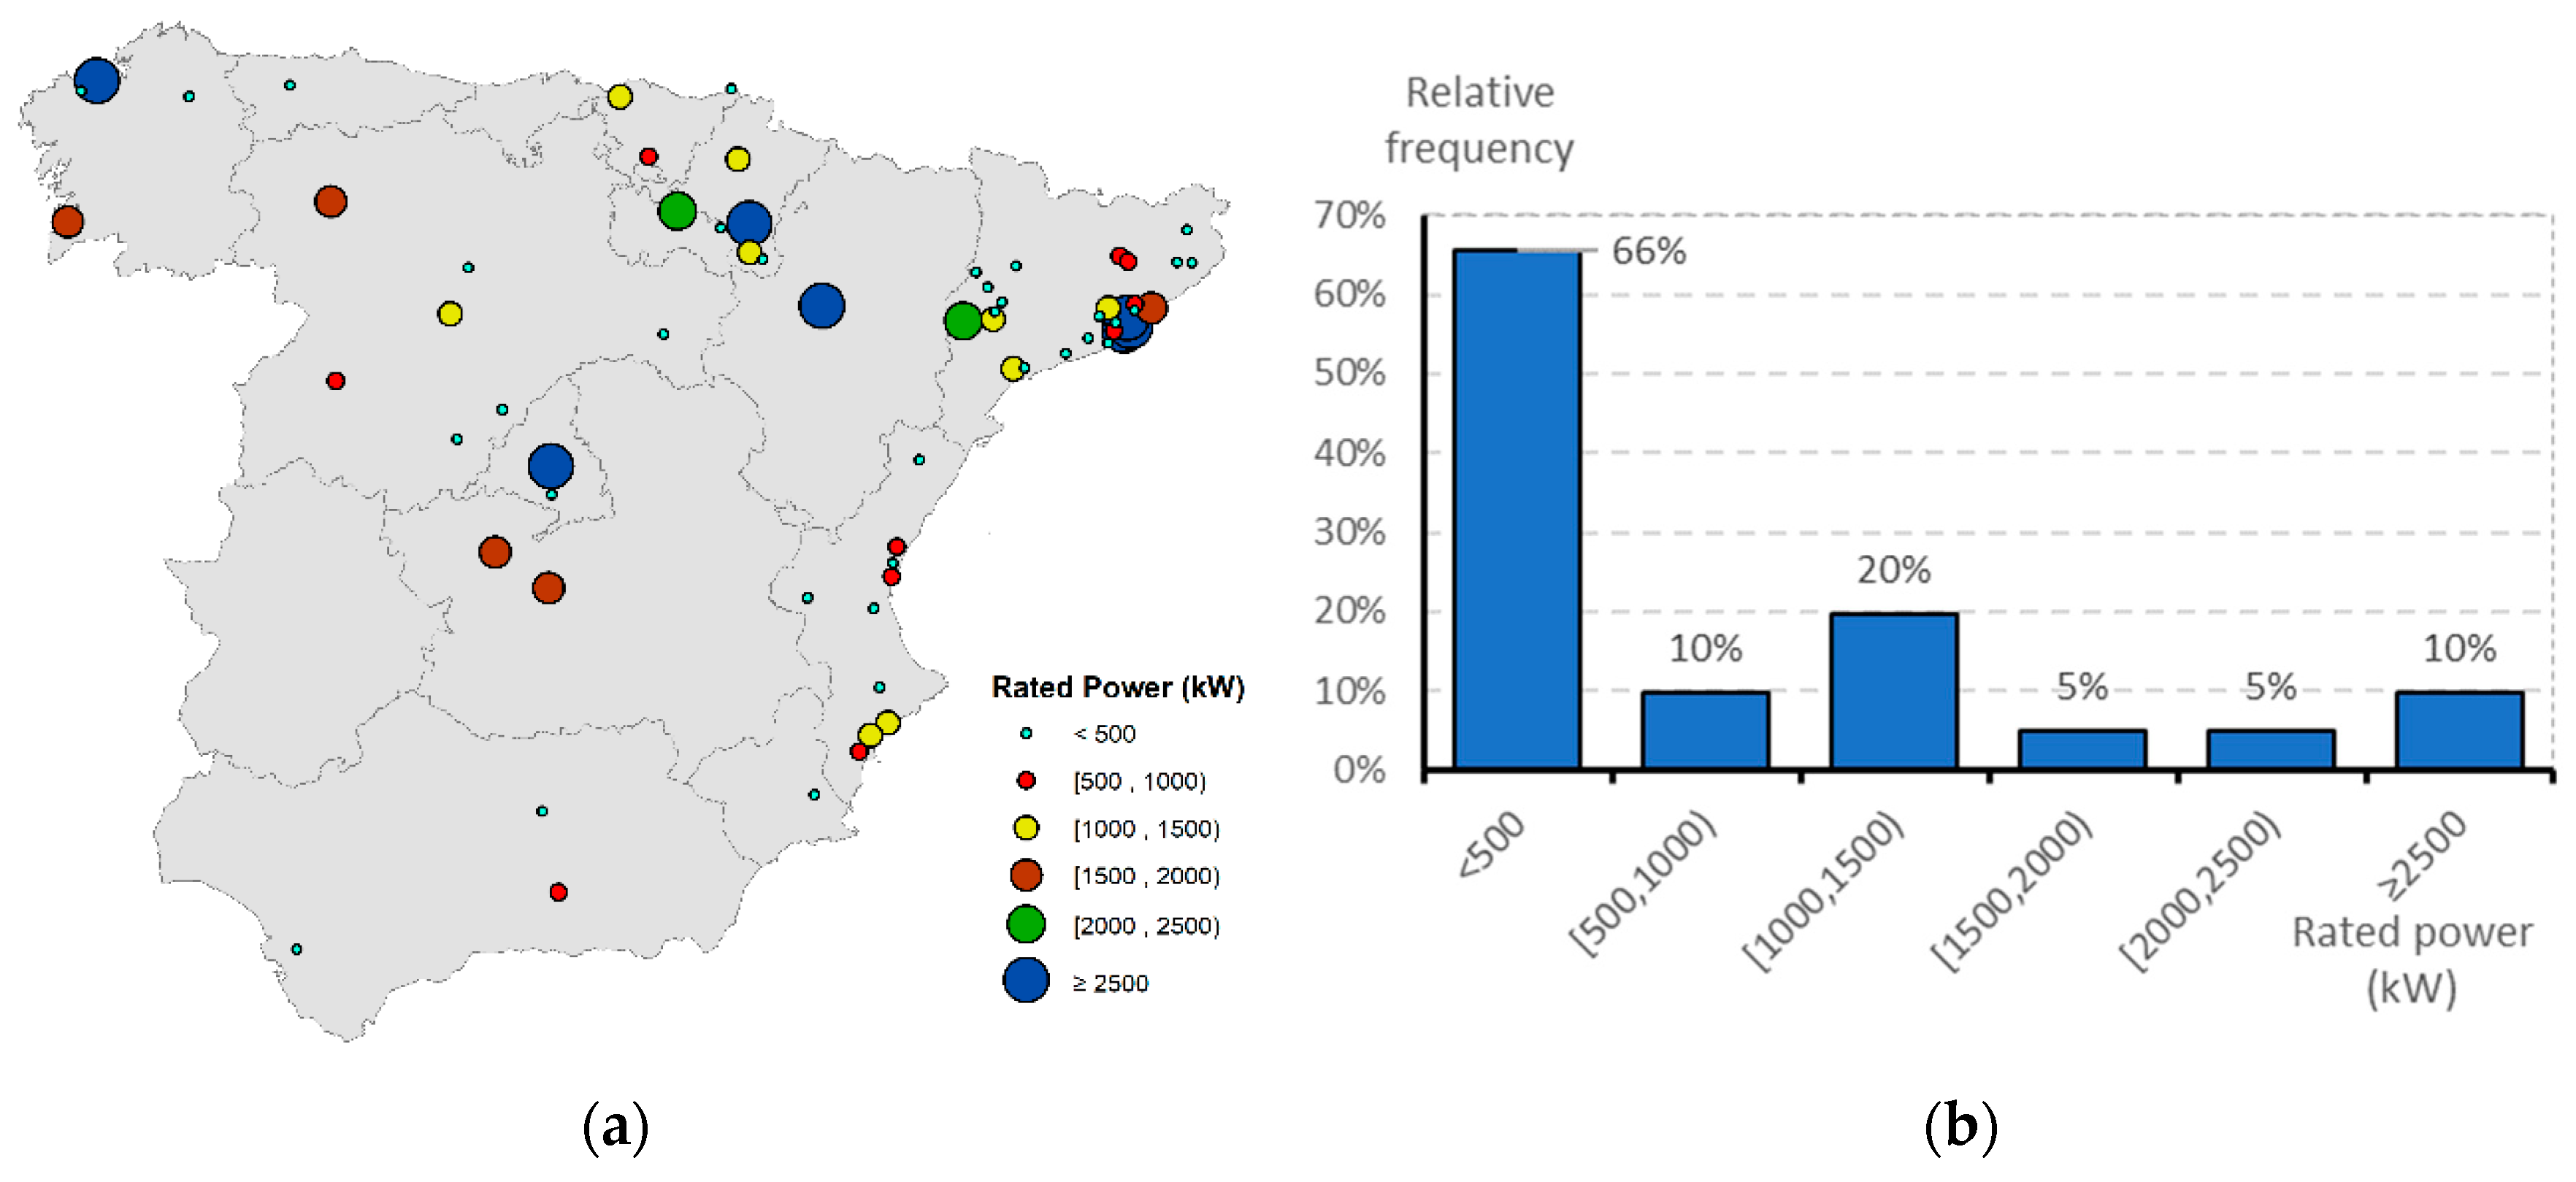
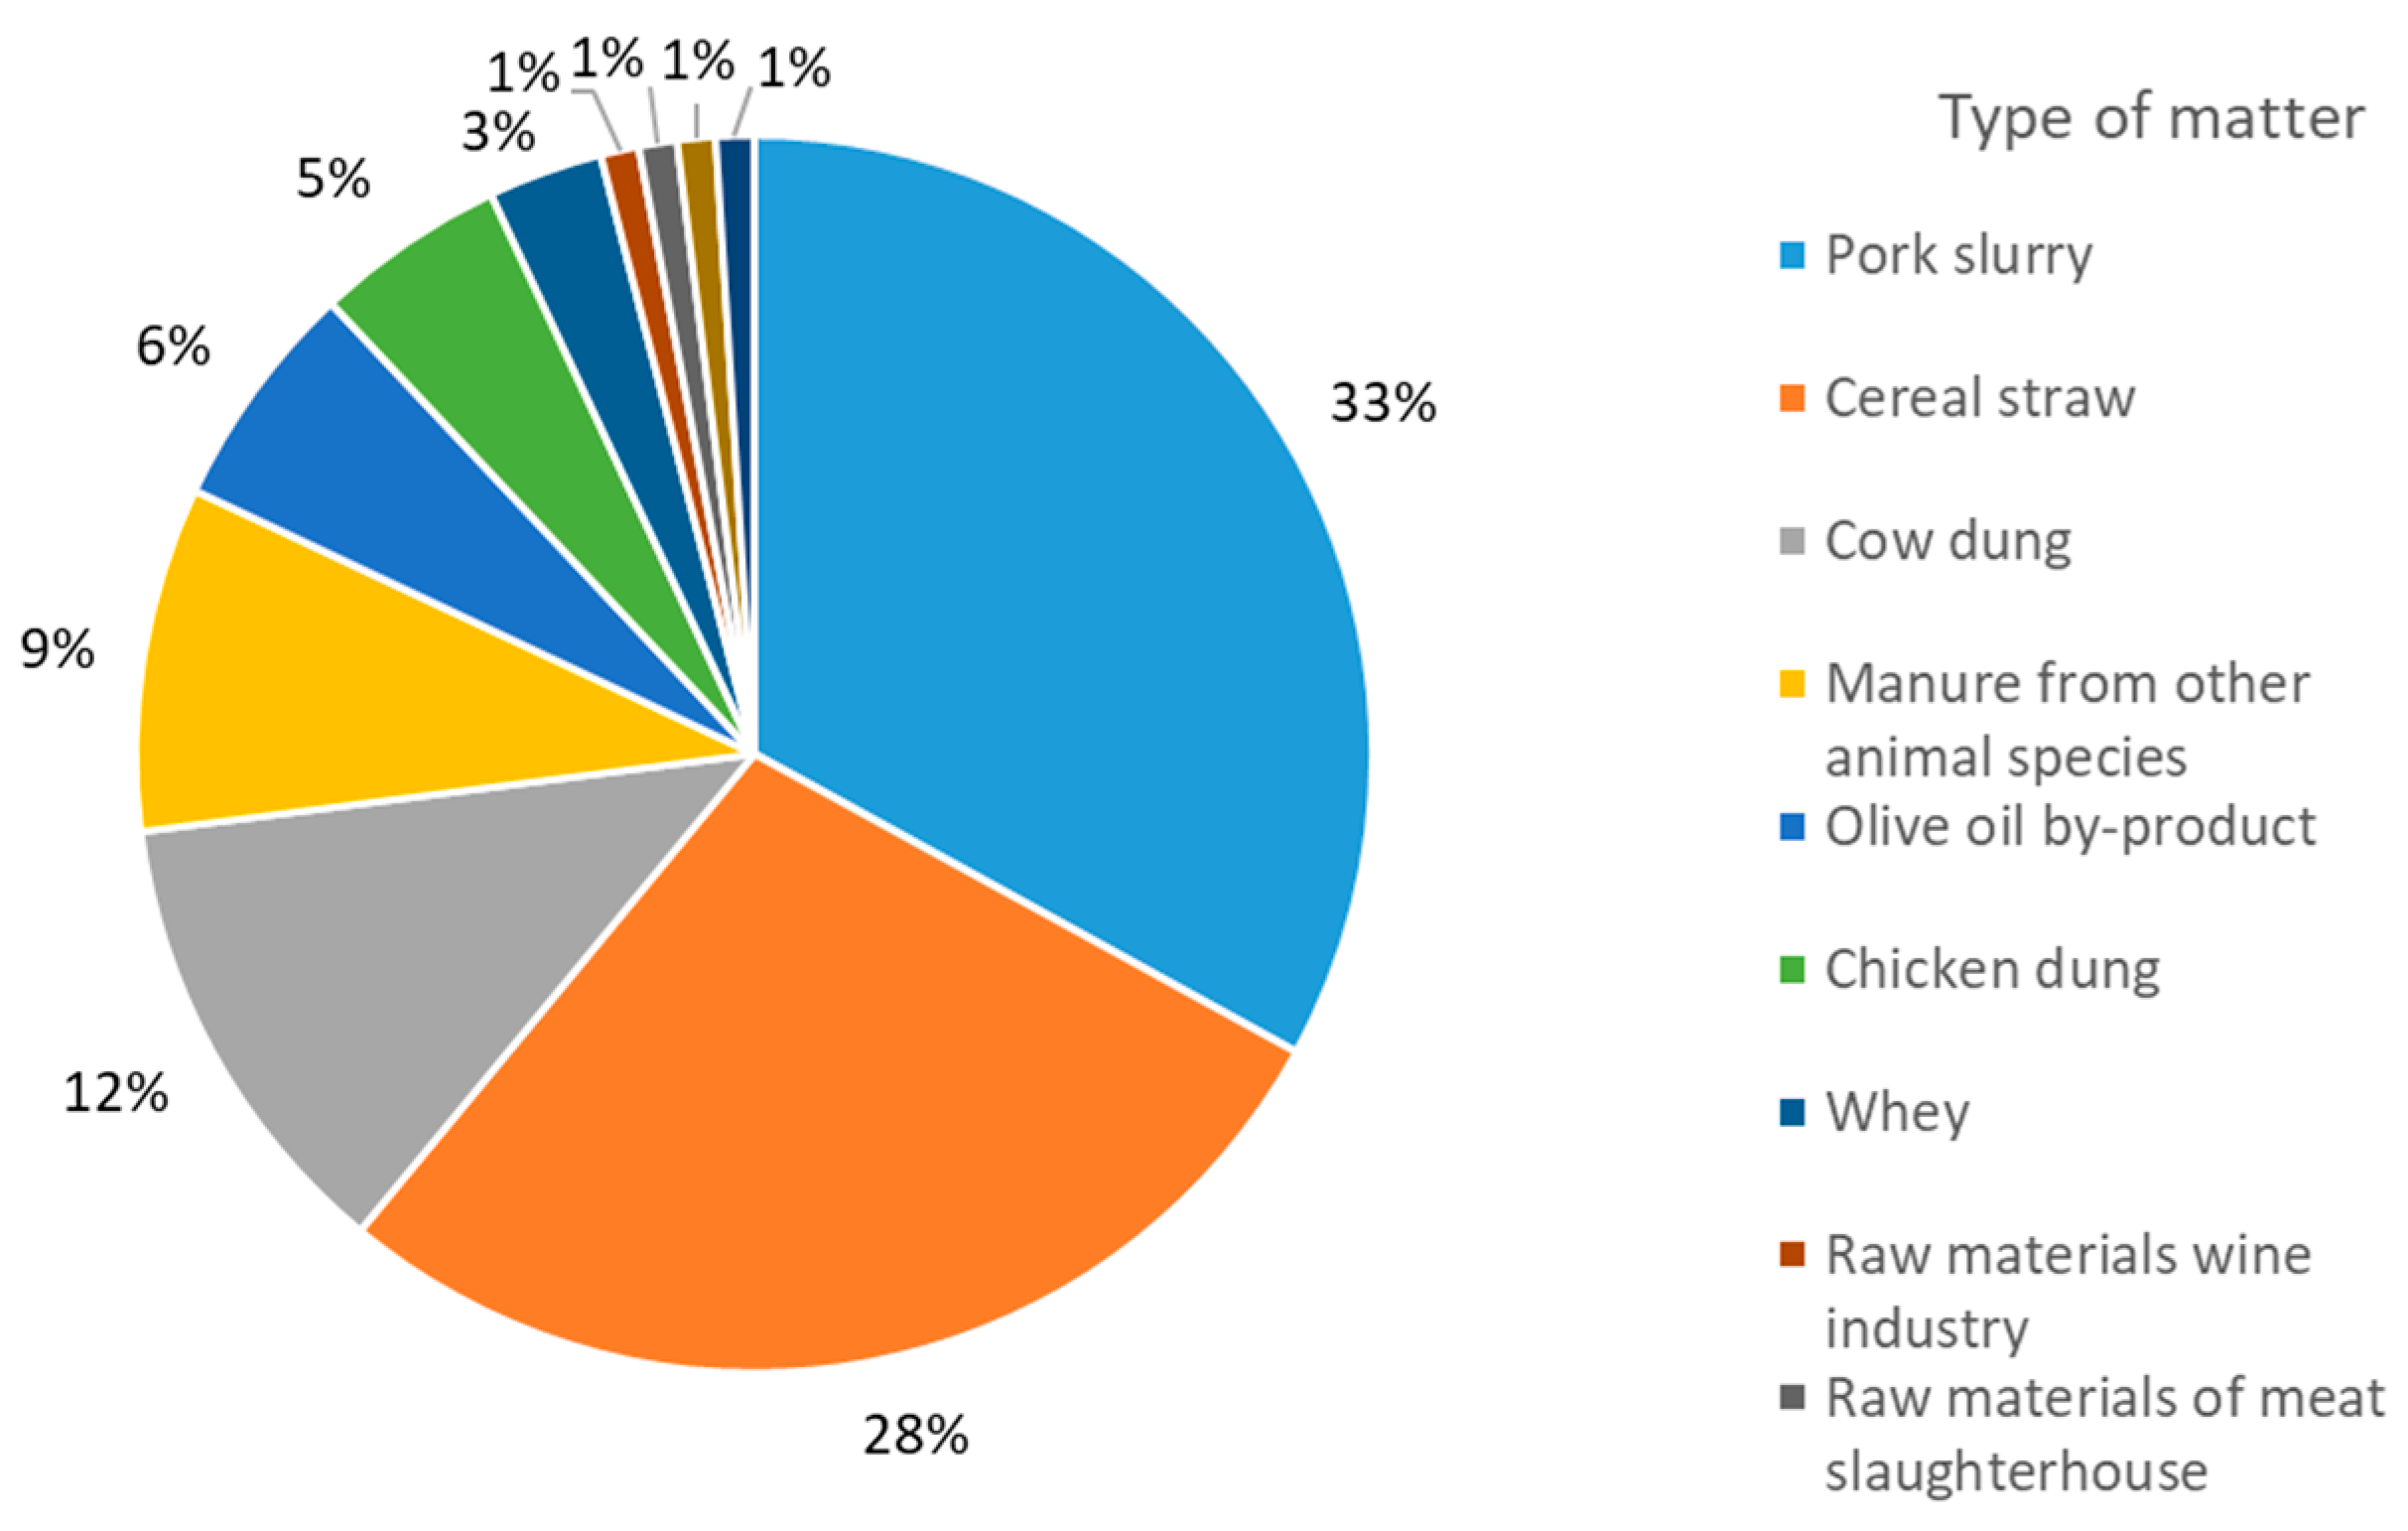
2.1. Agricultural and Livestock Waste Georeferenced Database

PROBIOGÁS” [20] is a project that carried out a study of use of agro-industrial biogas in Spain. As a main result, a database of raw materials was compiled with data from the Ministries of Agriculture and Livestock of each of the Autonomous Communities, the Ministry of Agriculture, Food and Environment (Ministerio de Agricultura, Alimentación y Medio Ambiente, MAGRAMA) and the Institute for the Diversification and Saving of Energy (Instituto para la Diversificación y ahorro de la Energía-IDAE). With the purpose of carrying out “the study of the development of sustainable systems of production and use of biogas in agro-industrial environments, as well as the demonstration of its viability and promotion in Spain”, researchers estimated with great accuracy the main agricultural and livestock waste potentials for each area, classifying the raw materials into 40 types, which can be seen in Table 2.
Data from this study were included in a georeferenced database. Taking as a unit of minimum spatial reference the district, the data of quantification of raw materials for production of biogas corresponding to each one of the Spanish regions are obtained. Each county unit provides data on the tons produced per year of the different raw materials in that region.
On the other hand, different geospatial data have been obtained, related to the National Cartographic Base, the provinces, the districts, the network of natural spaces, the urban centres, the national and secondary routes and the national power grid cartography.
From the 40 raw materials included in the GIS tool, Figure 2 shows the volume distribution of the substrates feasible for digestion processes available in Spain.
As it can be seen in Figure 2, the most abundant substrates are manures. As other environmental policies make mandatory their treatment and elimination, the valorization of manure in power generation applications makes them attractive as co-substrates. The manures have a high degree of biogas generation, as shown in Table 3, but their treatment is limited by their low C:N ratio, i.e., low organic matter content and high water and ammonia content [21]. This limitation can be compensated by including in the digestion process other residues, such as glycerine. Although glycerine is not an important resource from a quantitative point of view, it shows excellent properties as an additive in co-digestion and a high biogas production potential.
Table 3 shows the biogas production potential of the main raw materials.

2.2. Co-Digestion Mixtures for Electrical Power Production

In the 1970s, the need arose to model anaerobic digestion processes in order to optimize them and improve the design of industrial plants by taking advantage of new selection methods for substrates and substrate mixtures. The goal was not only to facilitate the understanding of the process and the analysis of the biological, chemical and physical nature of the involved processes, but also to analyse the economic feasibility of this technology.
Initially, very simple models of purely experimental or completely empirical character were developed. These preliminary models were based mainly on a reduced set of equations, which allowed researchers to simulate the behaviour of the consumption of a specific metabolite and, at the same time, the behaviour of the microbial population in a generalized way by means of simple kinetic rates.
Simple models predict the production of biogas through the algebraic resolution of empirical equations without taking into account the fundamental biochemical reactions that intervene in the process. In addition, because the models are not of a general nature, these models are only acceptable for mixtures of a known chemical composition.
Subsequently, more complex mathematical models have been developed as a result of advances in knowledge of the stages from the microbiological and biochemical point of view, added to the great technological progress in the computational calculation capacity. The modelling of the anaerobic digestion is a multi-stage process, focusing on the description of the limiting stages of the process and its influence on the overall reason of the process, although the limiting stage of the process may vary according to the operating conditions. Most models for the production of biogas include all stages, although only the limiting stage is really important for modelling the process [22].
One of the most widely used models for methane and carbon dioxide production calculation in a digestion process was proposed by Buswell and Mueller and it performs a chemical stoichiometry based on Equation (1) [23],
C a H b O c + ( a b 4 c 2 ) H 2 O ( a 2 + b 8 c 4 ) C H 4 + ( a 2 b 8 + c 4 ) C O 2 .
This model needs the exact chemical composition of the organic matter, with an uncertainty of about 5%. However, this model is only valid for complete digestion processes without previous degradation of the inlet matter. According to this relationship, the degradation of glucose results in a methane concentration of 50%.
The Buswell and Mueller’s model was improved by Boyle, who included nitrogen and sulphur to obtain the theoretical yields of biogas and methane, in addition to the concentrations of ammonia and hydrogen sulphide [24].
Other authors, like Baserga, organize the organic matter in co-substrates (organic substrates that are used in addition to animal waste) and classify them in carbohydrates, fats and proteins. Thus, the gas production and the obtained methane fraction can be deduced from these three components separately [25], as shown in Table 4.
In a similar way to Baserga, Keymer and Schilcher developed a computational model to estimate the production of biogas from agricultural substrates classified in the three previously mentioned categories [26], but they based their model on the hypothesis that the digestion of organic matter is similar to the process of digestion of food in the stomach of ruminants (cattle, sheep and goats). Based on this model, they determined the production of biogas from the different nutrient fractions of a large number of feed.
On the other hand, Amon et al. divided organic matter into four basic components (proteins, fat, fibre and nitrogen-free extracts) to estimate the energy values of methane from energy crops such as corn, cereals or grass. They also considered a regression coefficient, which was determined with tests of lots of energy crops [27].
Although these stationary models can be useful in the design and dimensioning of digesters, they cannot predict the evolution of processes continuously. Thus, a wide variety of structured dynamic models was developed, depending on the main modulator of the process [28,29,30,31].
Referring to the time-frame of the model predictions, two sorts of models can be differentiated: dynamic or non-dynamic models. Dynamic models are capable of making predictions continuous in time or at least at regular discrete intervals, while the non-dynamic models only predict time-independent variables. Dynamic models consist of several ordinary differential equations (ODE), based on mass-balance considerations [32].
The wide variety of developed models led to the realization that action was required to converge and consolidate the enormous array options available. With this objective, the “International Water Association (IWA) Task Group on Mathematical Modelling of Anaerobic Digestion Processes” developed the Anaerobic Digestion Model No. 1 (ADM1), as a unified base for modelling the anaerobic digestion process [33].
According to the waste inventory in Spain shown in the previous section, eight co-digestion mixtures are proposed for its study. The biogas, and therefore its power generation capacity, has been established applying the model presented by Chen in [34], which is derived from the ADM1 model, and implemented by Harris in a software tool [35] that allows for the determination of biogas potential of the co-digestion of the mixture of multiple substrates, taking into account mainly the volatile solids, the operating temperature and the hydraulic dwell time supposing a continuous type reactor and daily feeding conditions. This model has been widely validated in other co-digestion studies, such as [36], where different domestic and industrial mixtures are tested.
Several co-digestible mixtures, which include manures as main mixing substrates and flour, agricultural residues and glycerine as supplementary compounds, were evaluated according to the criteria exposed in [37]. From all the feasible combinations, six mixtures were selected for the study (mixtures M1 to M6 in Table 5). Many mixtures are not allowed, due to limitations in the generation of biogas depending on the percentage of water content in the manures or the digester flow rates [38].
However, these mixtures avoided the potential use of whey, which was observed to be abundant in some geographic areas. Thus, two more mixtures (mixtures M7 and M8 in Table 5) were established based on whey as a main co-substrate.
It should be taken into account that leakage of CH4 from the digester can occur and they are estimated to be less than 10% of the total methane production [39]. Table 5 shows directly the net biogas production for each mixture.
Calculations for energy production of each mixture are based on intensive properties of the substrates such as % total solids, % volatile solids and BMP (bio-methane potential, NlCH4/kgVS). These three key factors determine the methane availability of each substrate and mixture and explain the great variability of biogas production, as shown in Table 5.
Although the CH4:CO2 ratio of the biogas may be affected by the anaerobic digestion process conditions or the nature of the substrates, it is widely accepted that biogas from co-digestion plants have a rather steady concentration of methane. This paper standardize it at 65%, based on other studies in the field developing anaerobic digestion plant design tools [41,42,43].
As a final consideration, it has been demonstrated by several authors, such as [44,45], that there is an economic scale factor for thermal plants and a reduction of the net heat rate with the rated power [46]. Thus, the design of large and centralized power plants has been proposed.
Then, for the electrical power generation, it has been considered that (i) 1 Nm3 biogas is composed of 65% CH4 on average; (ii) the calorific value of CH4 is estimated in 5750 kcal/Nm3; (iii) it high-efficiency concentrated generation has been prioritized instead of distributed systems; (iv) the electric power is generated by gas turbines, with a rated power greater than 10 MW, with an overall performance set at 40%; (v) the electric losses of the electric generator are estimated in a 10%; and (vi) the power plants can operate at rated power 6000 h yearly on average.

2.3. Multi-Objective Optimization through a GIS-Based System

Once the geo-referenced database was elaborated, a spatial clusterization process was applied to gather the districts with the greatest potential for generating energy from the different mixtures, differentiating the power with a colour gradient.
Therefore, different criteria of a sequenced form were applied. First, a selection of districts is conducted, guaranteeing a minimum electric power generation potential for each of the studied mixtures. This minimum was set to 2 MW for all mixtures, except for mixture M7, which was set to 0.25 MW, and mixture M8, which was set to 0.50 MW. In this step, for mixtures M2 and M3 no areas of sufficient potential were found, so they were discarded.
Then, a smart clusterization of the districts with greater potential was made according to a maximum optimal distance where transport costs are minimized, as they only depend on the matter mass. This distance is set by experts to be 200 km [47].
Once the potential clusters were obtained for each of the mixtures, power plants locations are evaluated taking into account that they should be placed the closest to the gravity centre of the power generation potential (to minimize the transport costs) and other geographical, technical and social factors, which are summarized in Table 6.
The optimal location of the power plants considered that they should avoid the interior or the vicinity of urban centres or natural parks because of their social and environmental impact. With regards to communication routes (national and secondary roads) and power grids, the closer the plants of these networks are, the lower the production and transport costs, and thus, the greater the economic and environmental benefit. Finally, social factors such as the unemployment rate have also been taken into account, in such a way that priority was given to those provinces with the highest percentage of unemployment, with the aim of trying to reduce this percentage.

3. Results and Discussion

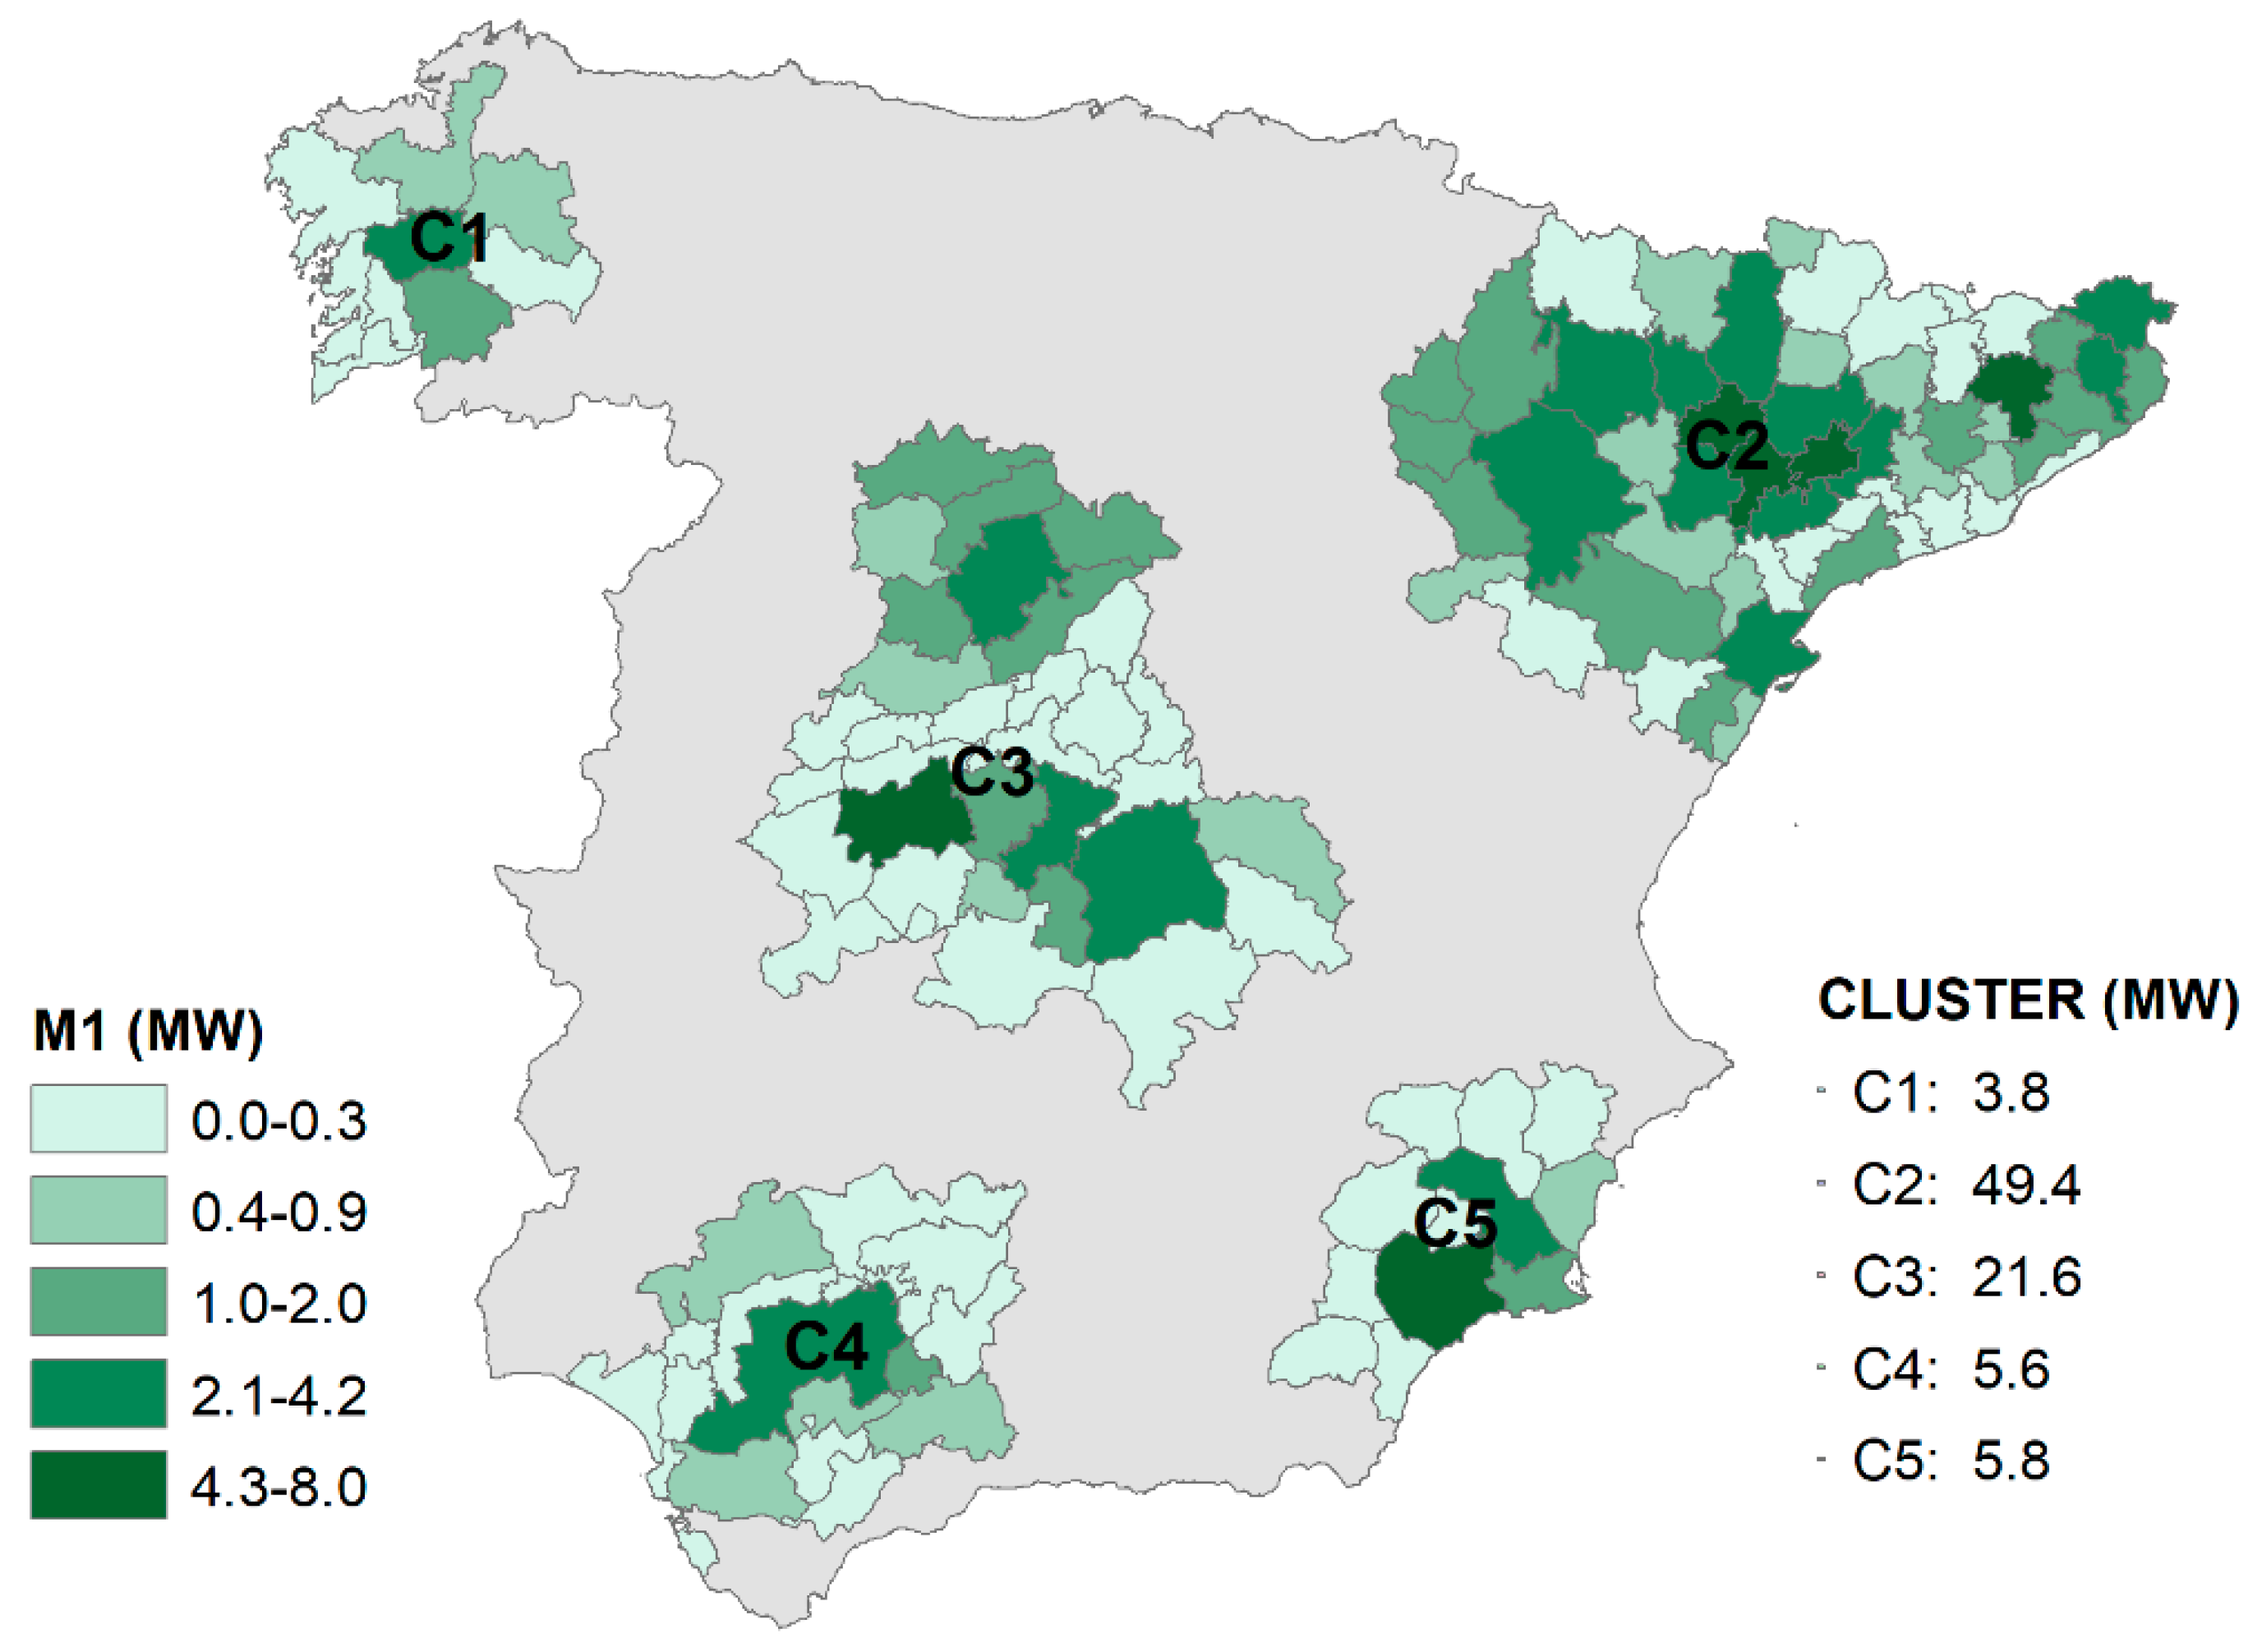
3.1. Generation Potential for Mixture M1

Mixture M1 (62% pork slurry; 38% chicken dung and cow dung) offers the best results, very favoured by the existence of a very important swine hut in the northwest and centre parts of Spain. Figure 3 indicates the districts suitable for use of mixture M1, grouped into five clusters, where the rated power of the generating installation is indicated.
Their presence in these areas allow the installation of large centralized facilities, much more efficient than the existing ones of small size, as seen in Figure 1. In this case, rated power can reach 49.4 MW and 21.6 MW.

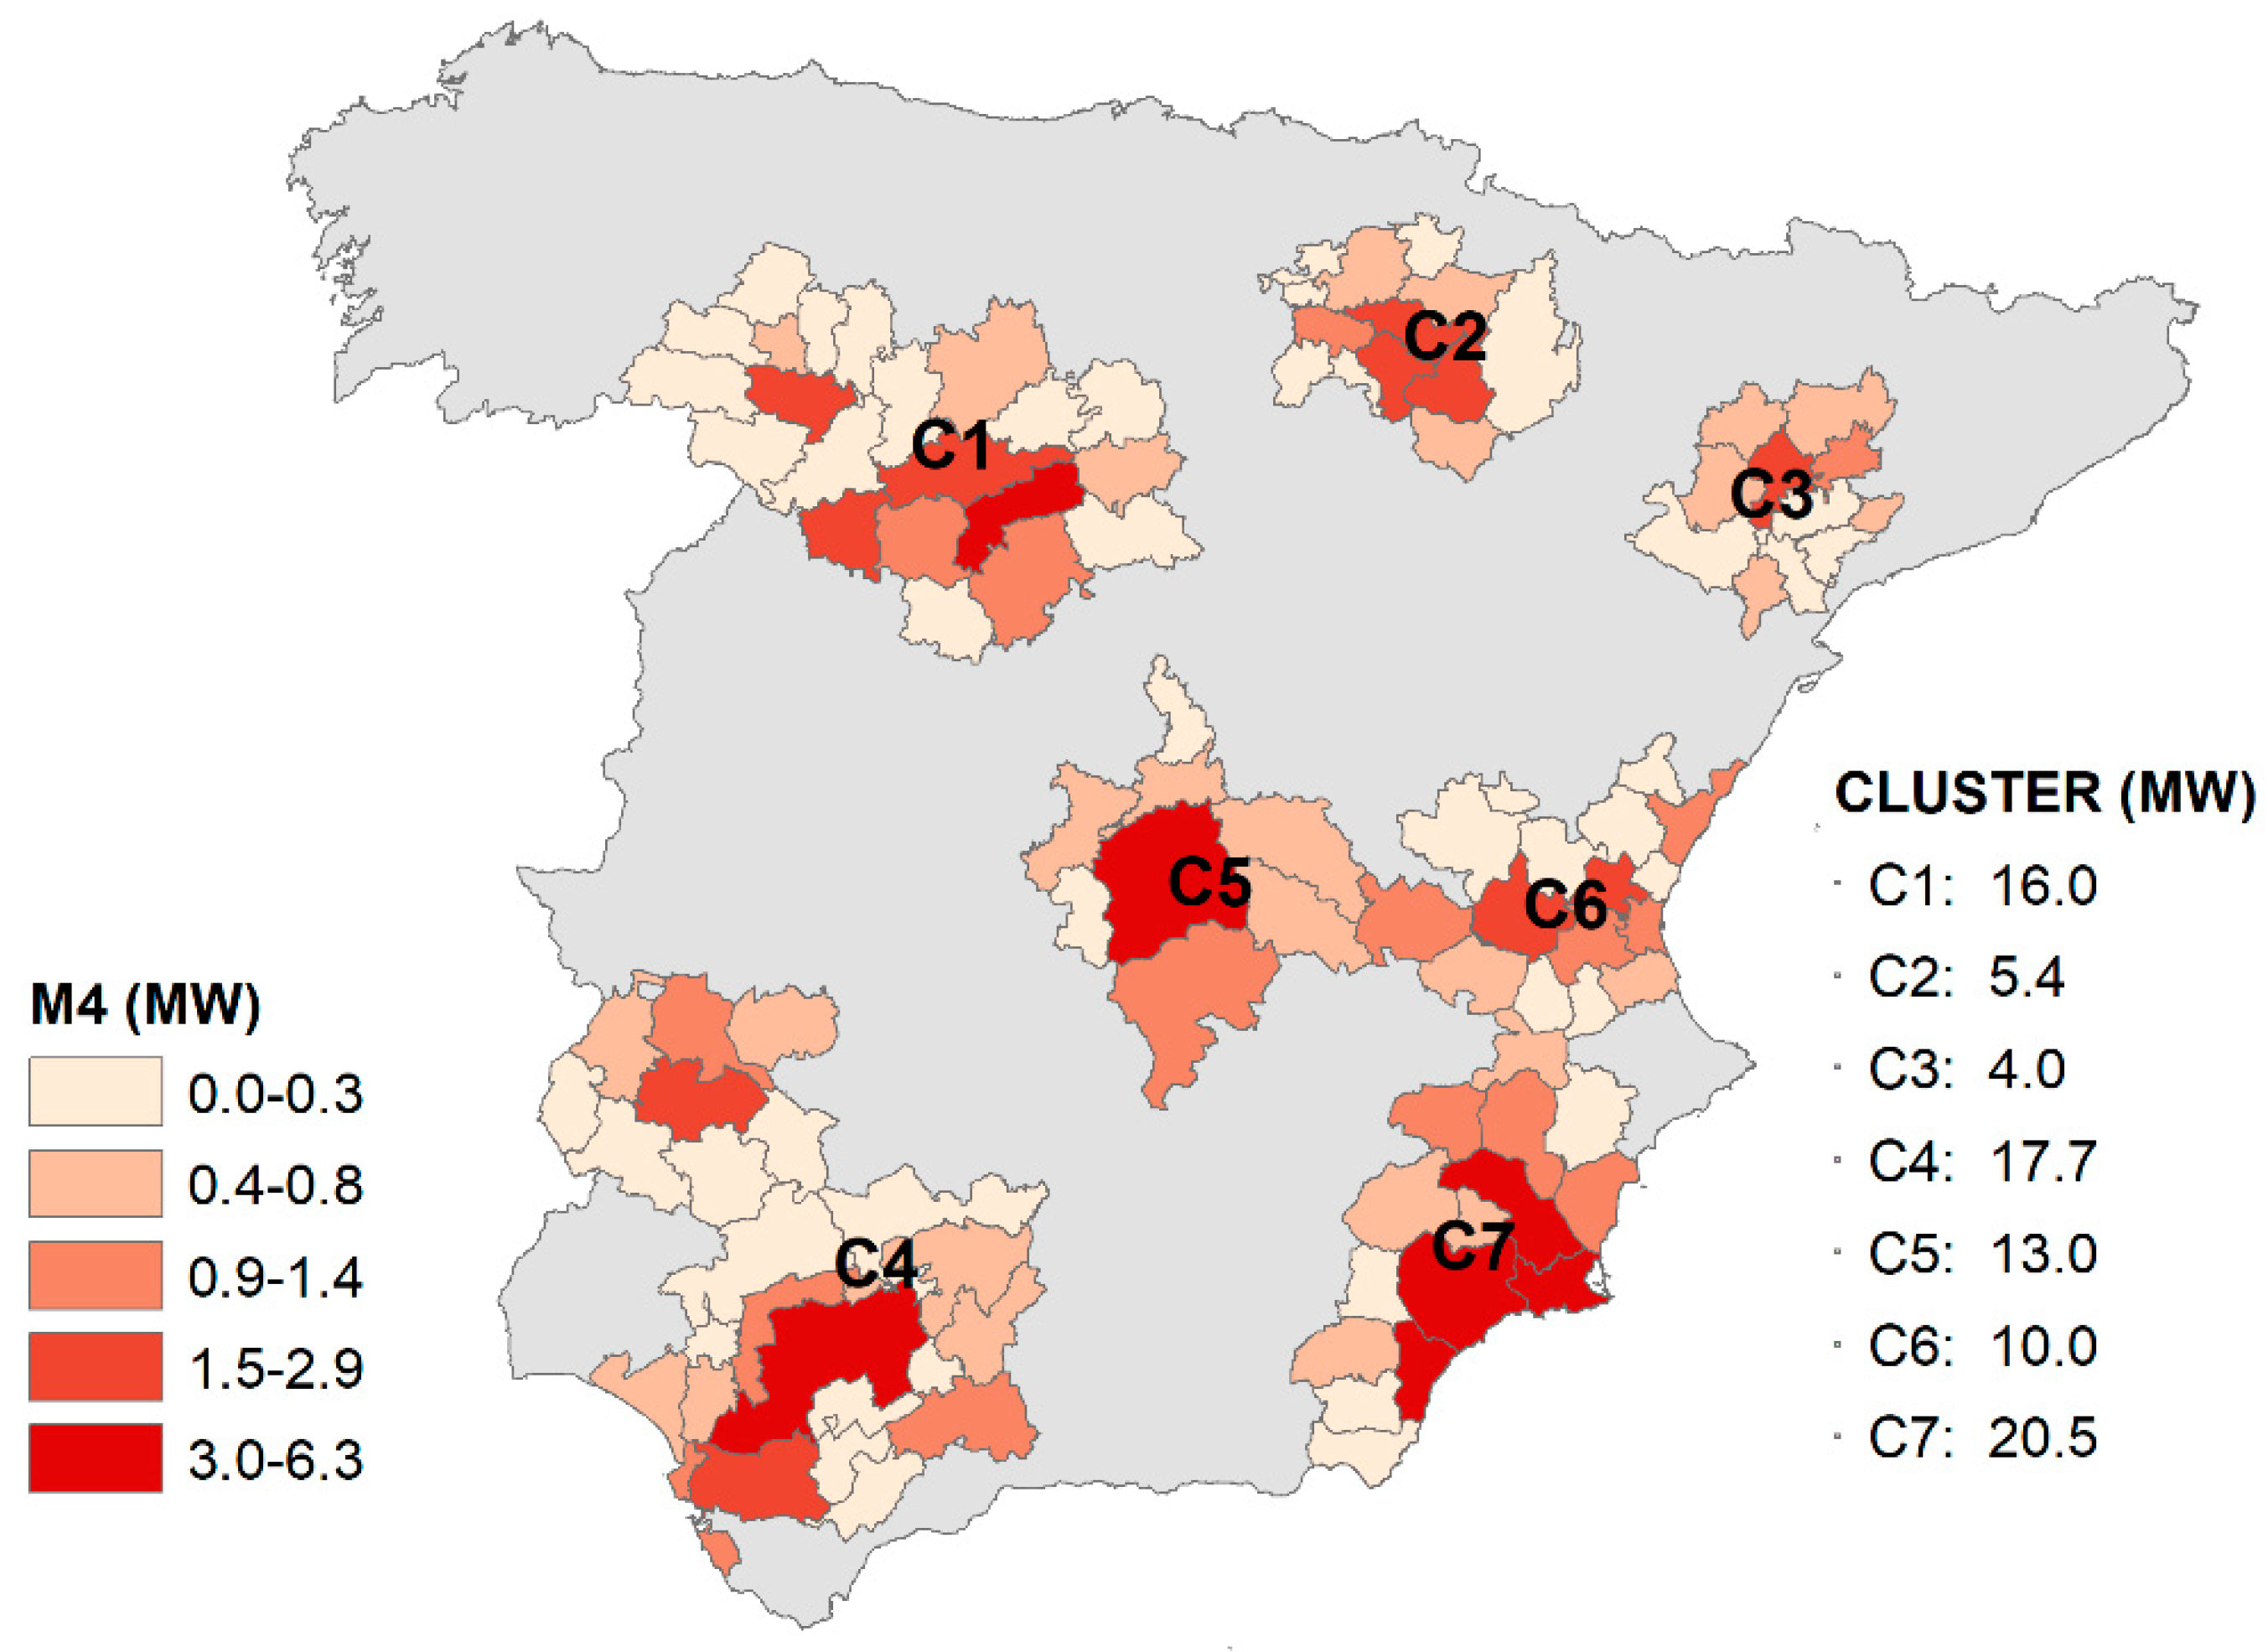
3.2. Generation Potential for Mixture M4

Mixture M4 (80% pork slurry, chicken dung and cow dung; 20% agricultural residuals) offers good results, due to the coexistence of an intensive livestock farming plus important agricultural and agro-industrial farms.
In this case, six clusters can be identified (see Figure 4) with a maximum power potential of 20.5 MW, although there are four more clusters with a power generation potential higher than 10 MW.

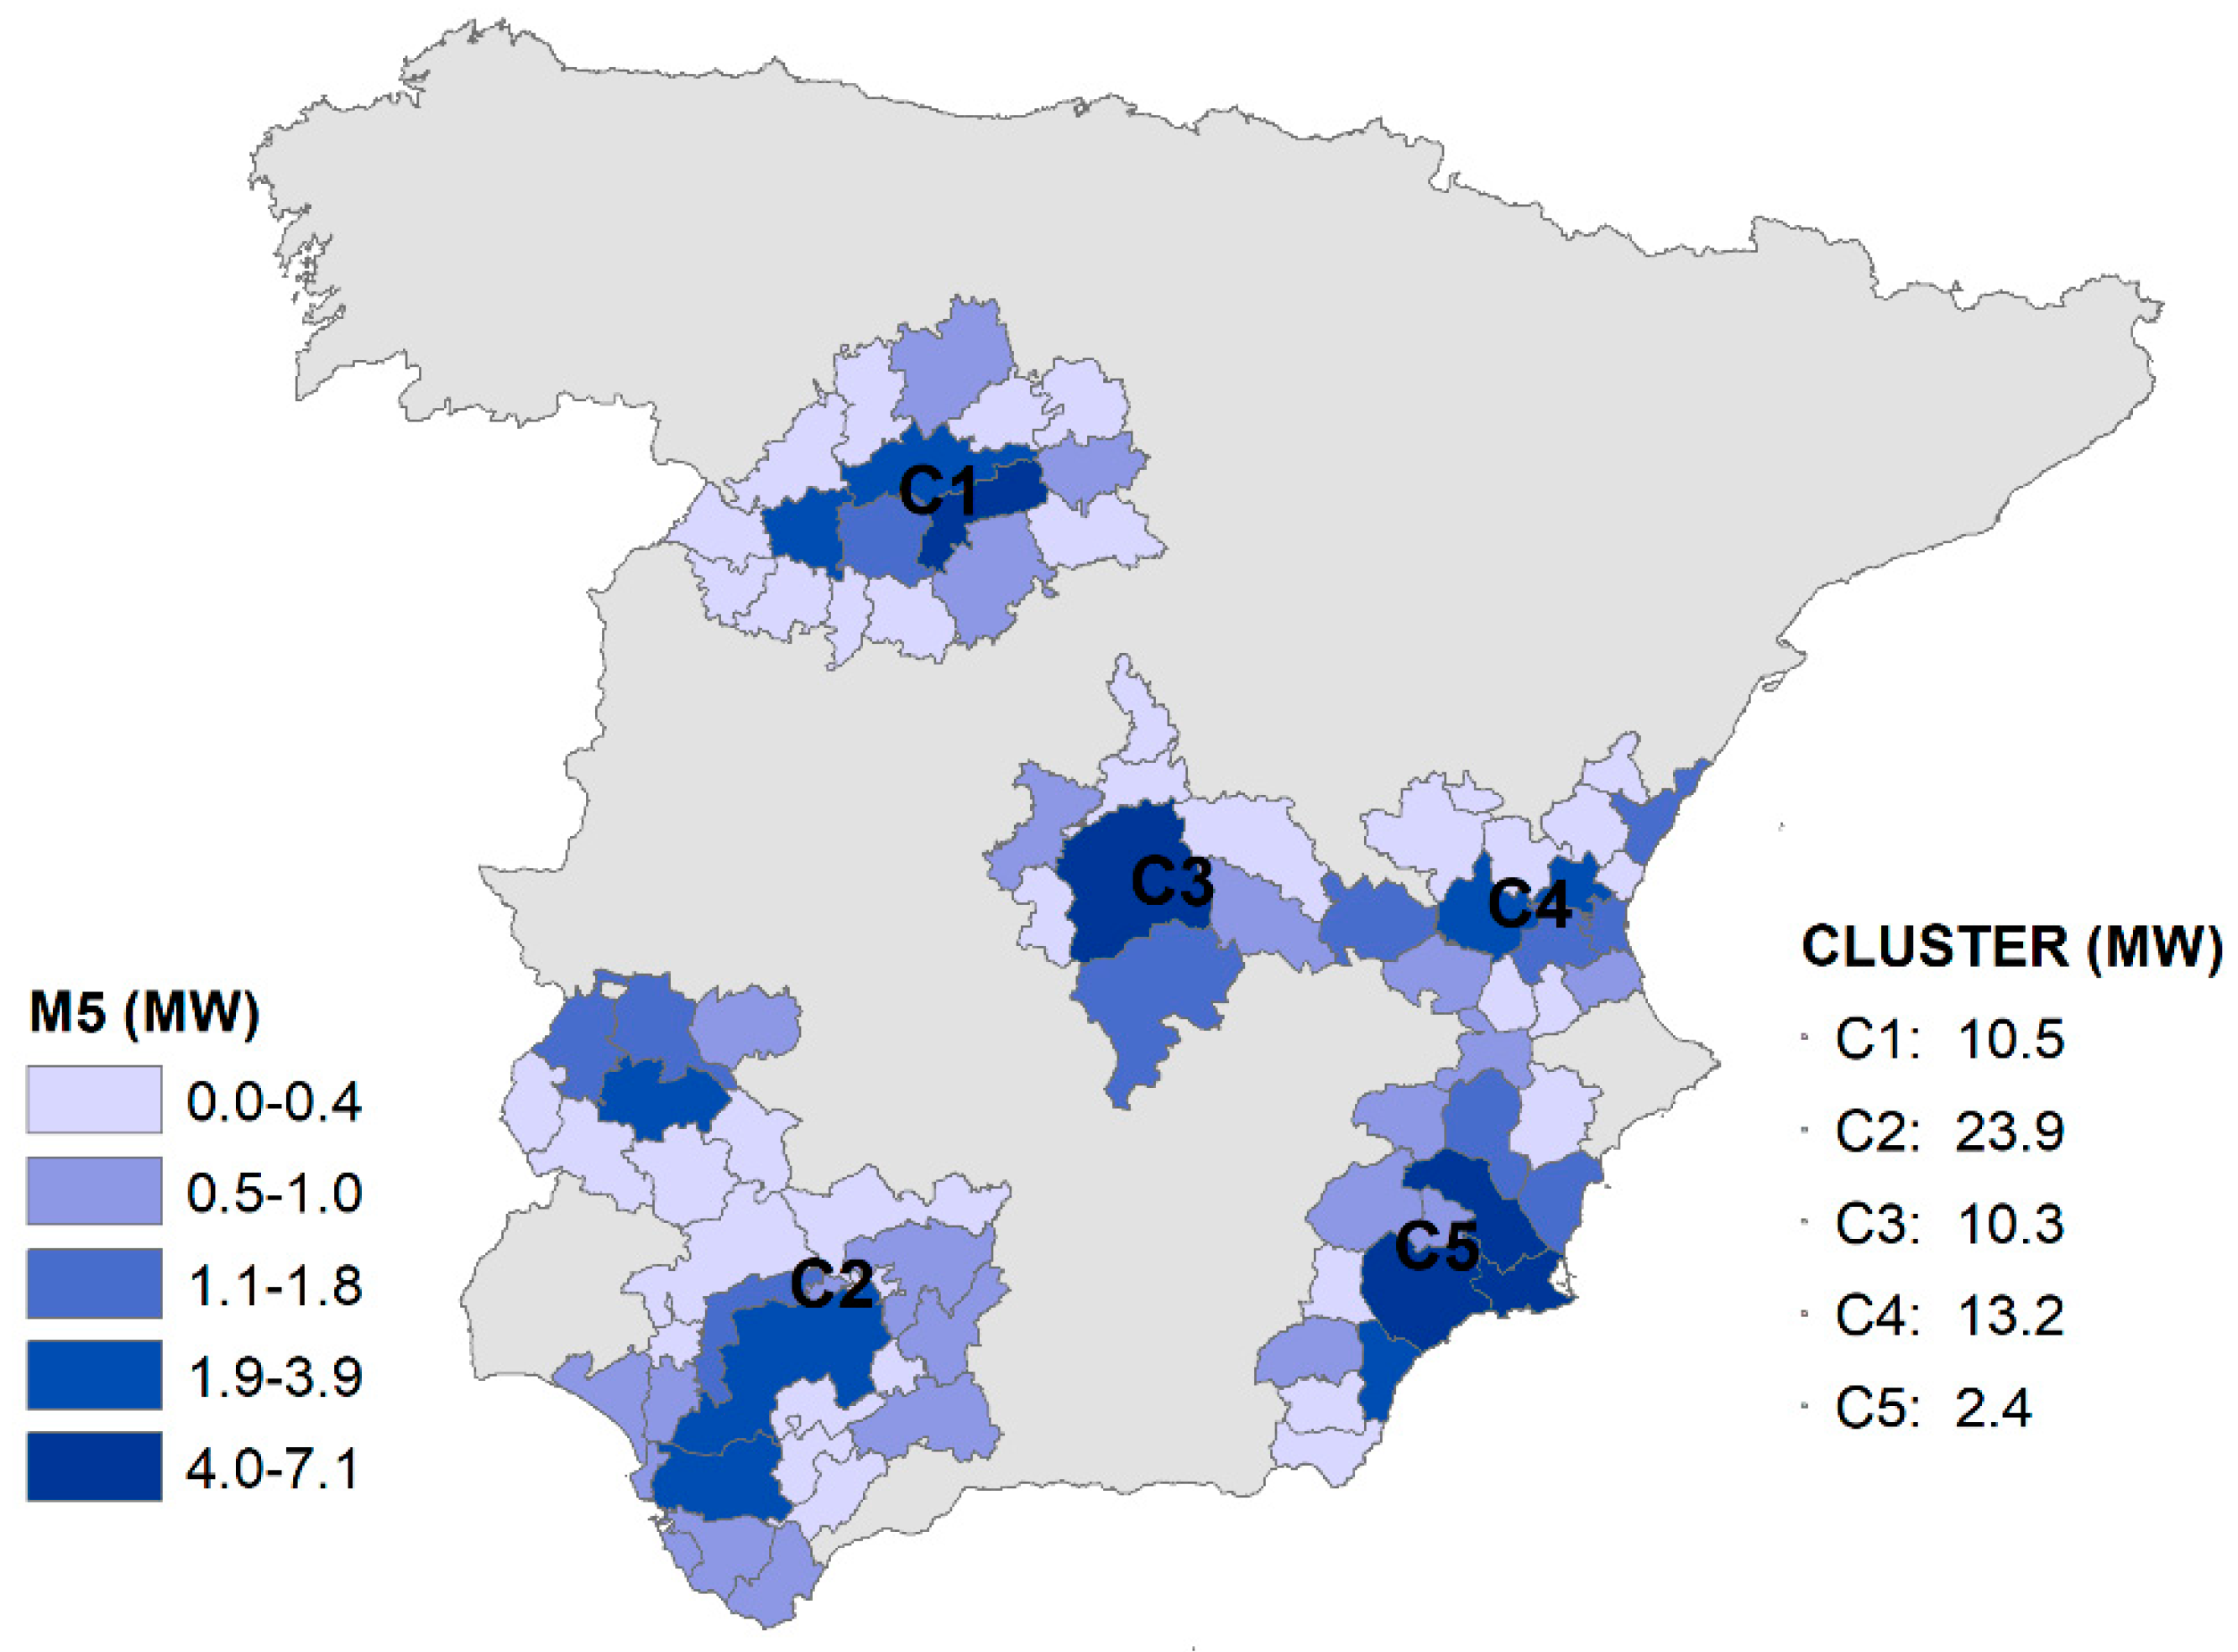
3.3. Generation Potential for Mixture M5

Mixture M5 (95% pork slurry, chicken dung and cow dung; 5% glycerine) arises with force due to the installation of biodiesel plants that generate glycerine as a sub-product. According to Figure 5, five clusters can be identified, concentrated in the south part of Spain, with a maximum power potential of 23.9 MW.

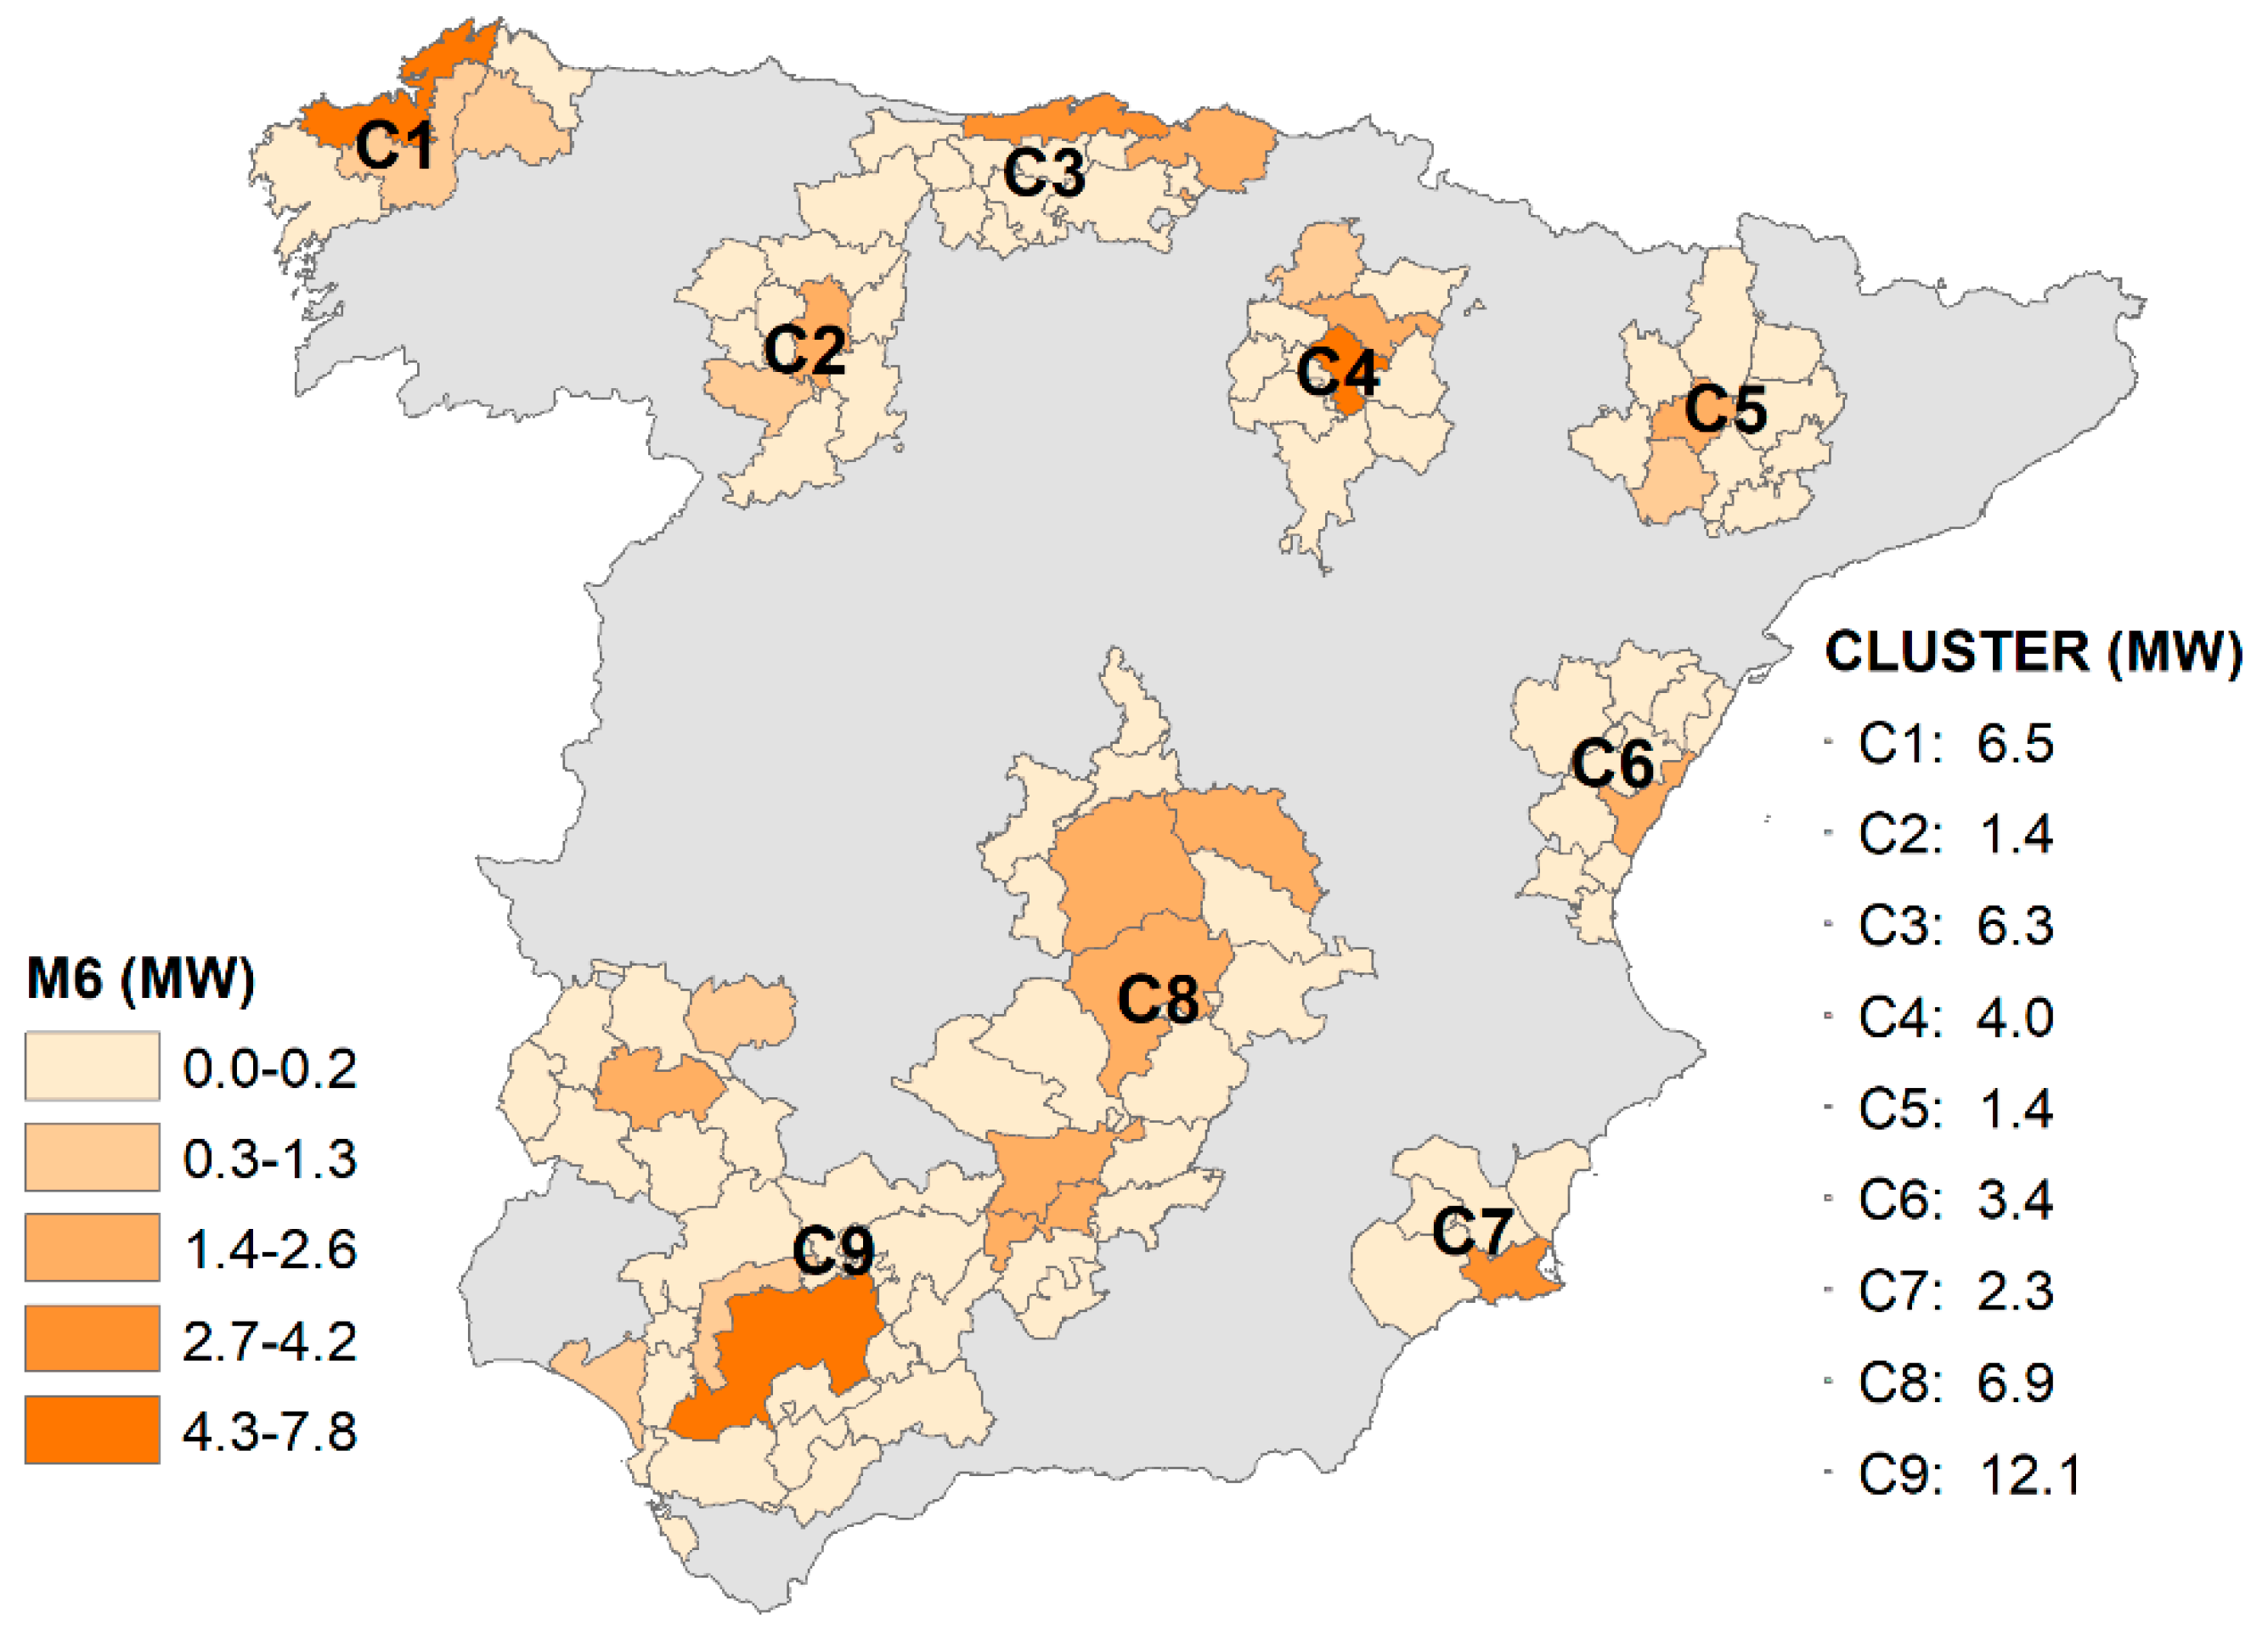
3.4. Generation Potential for Mixture M6

Mixture M6 (90% pork slurry, chicken dung and cow dung; 10% glycerine) takes advantage of the availability of glycerine, allowing the installation of a large number, but smaller rated power, of co-digestion power plants, both in the southwest part and in the north central region of Spain, as is shown in Figure 6.

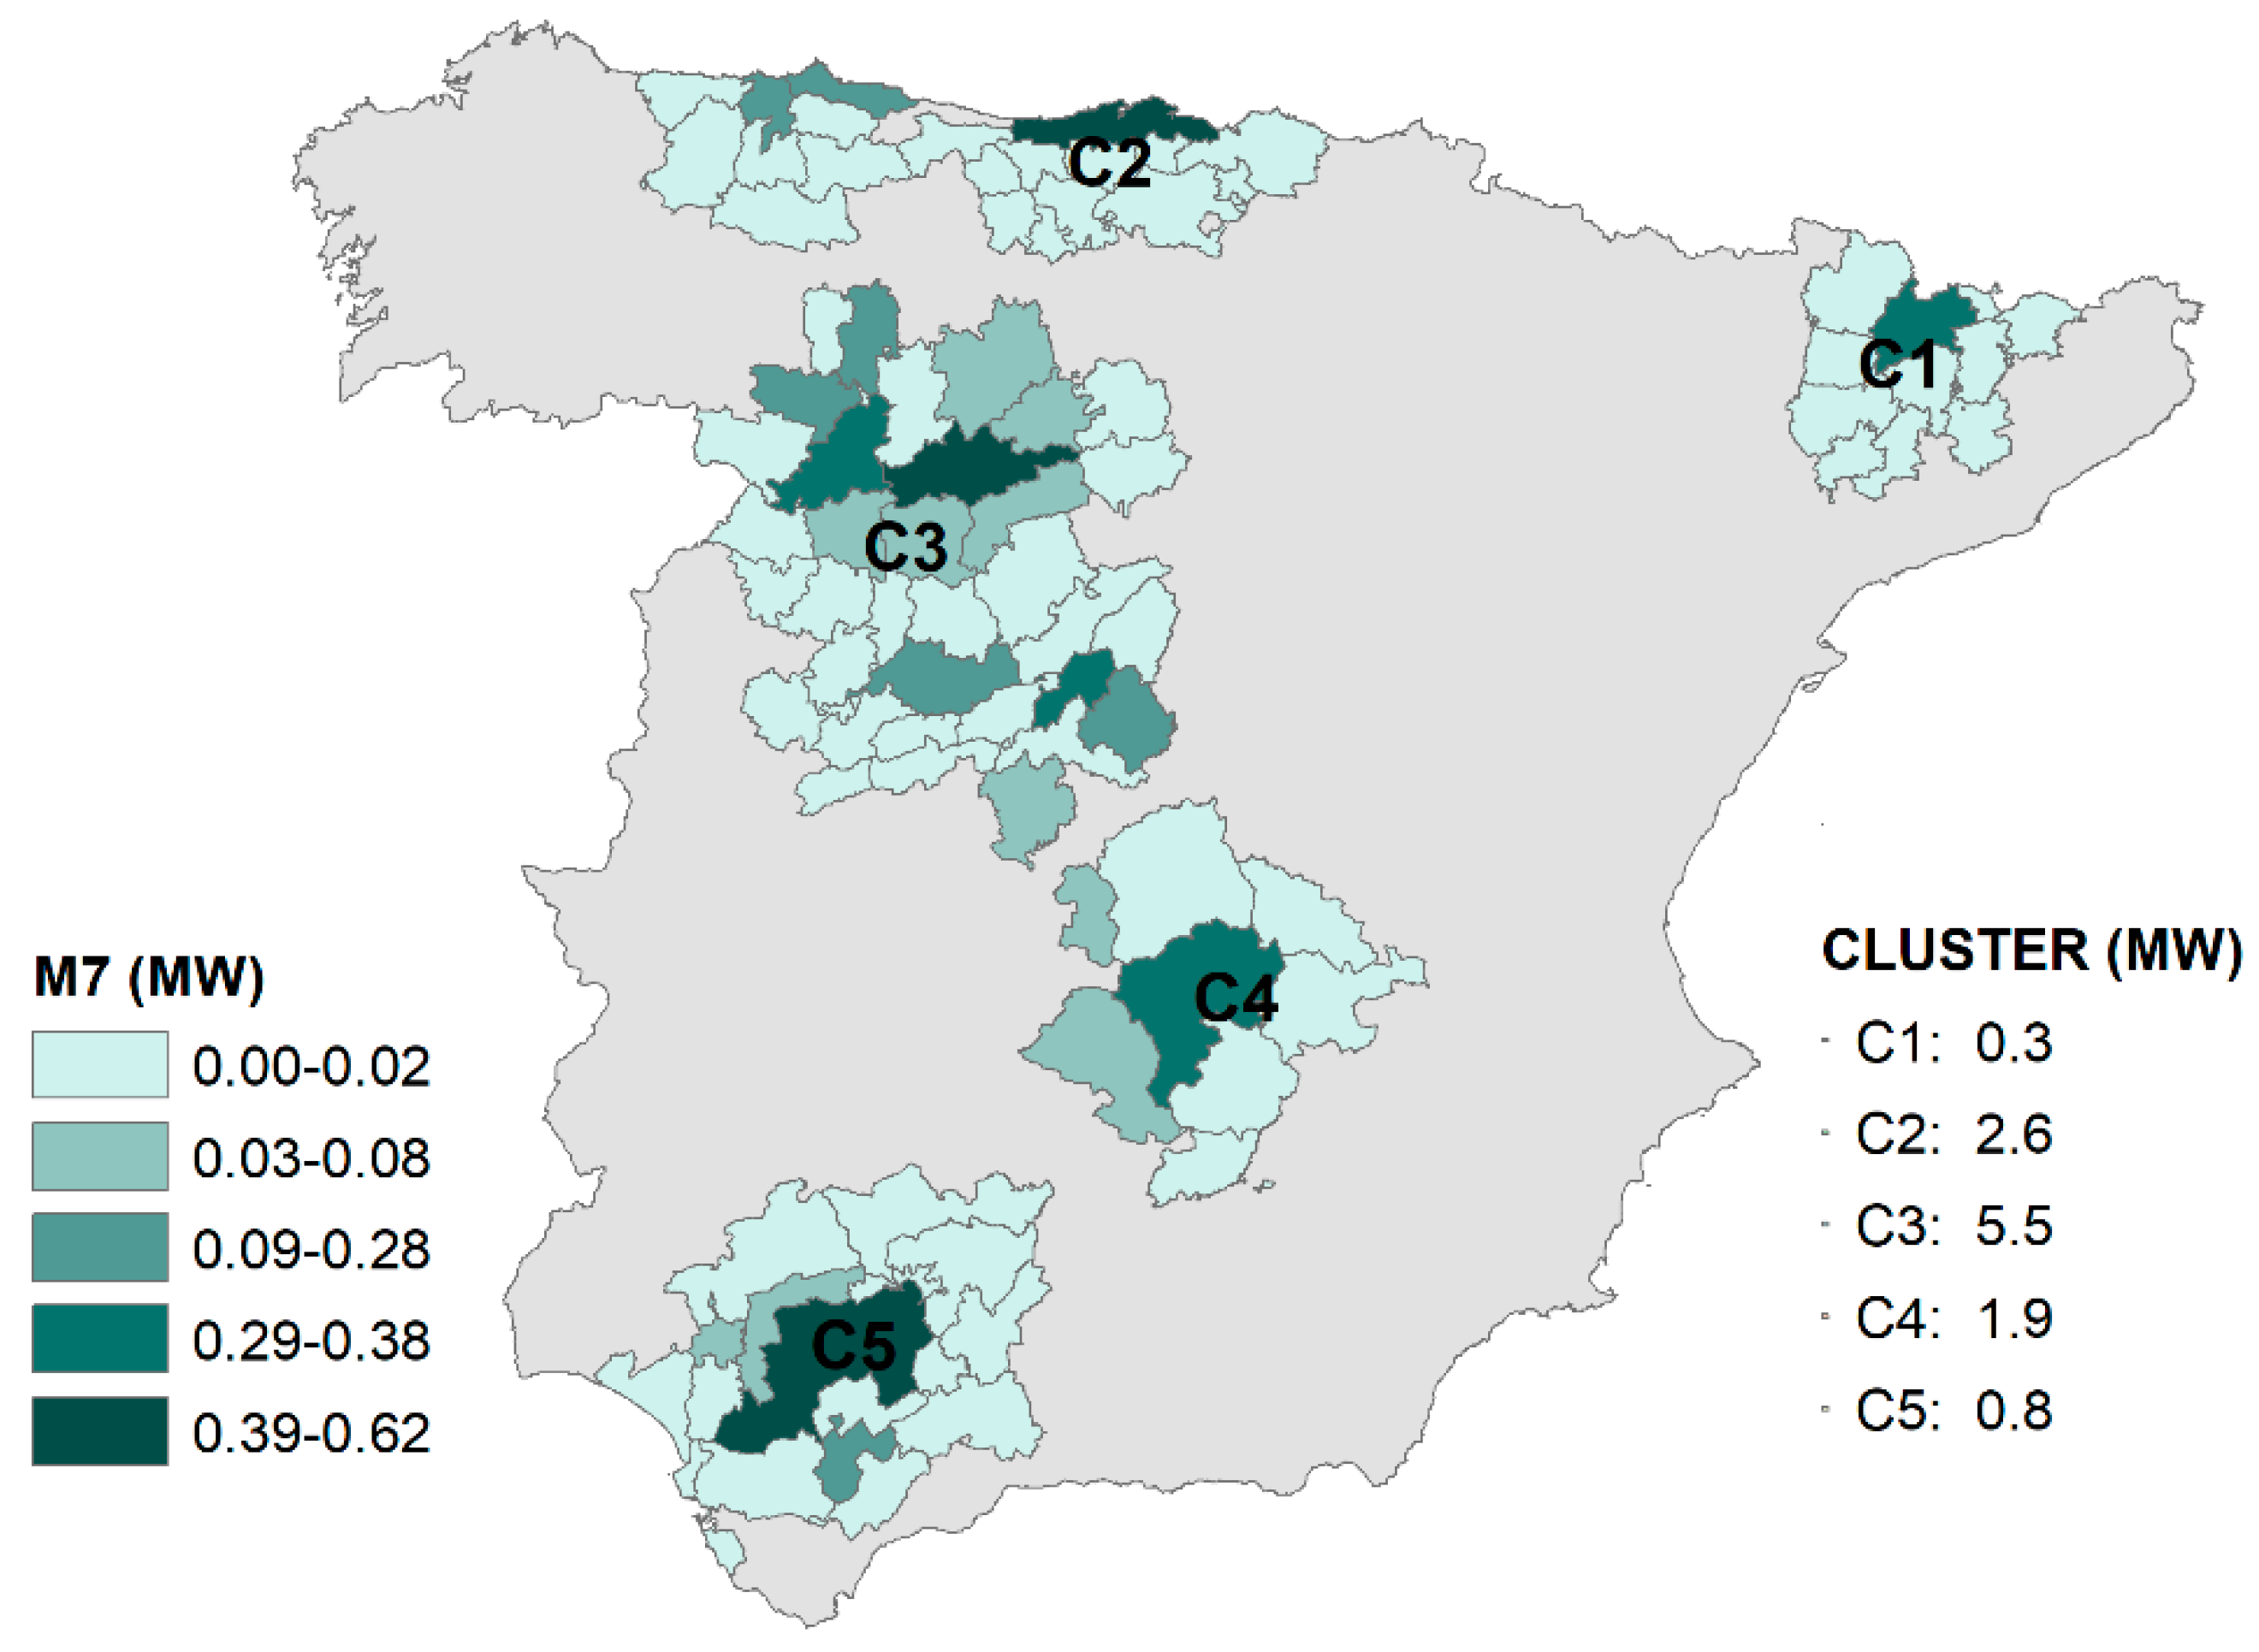
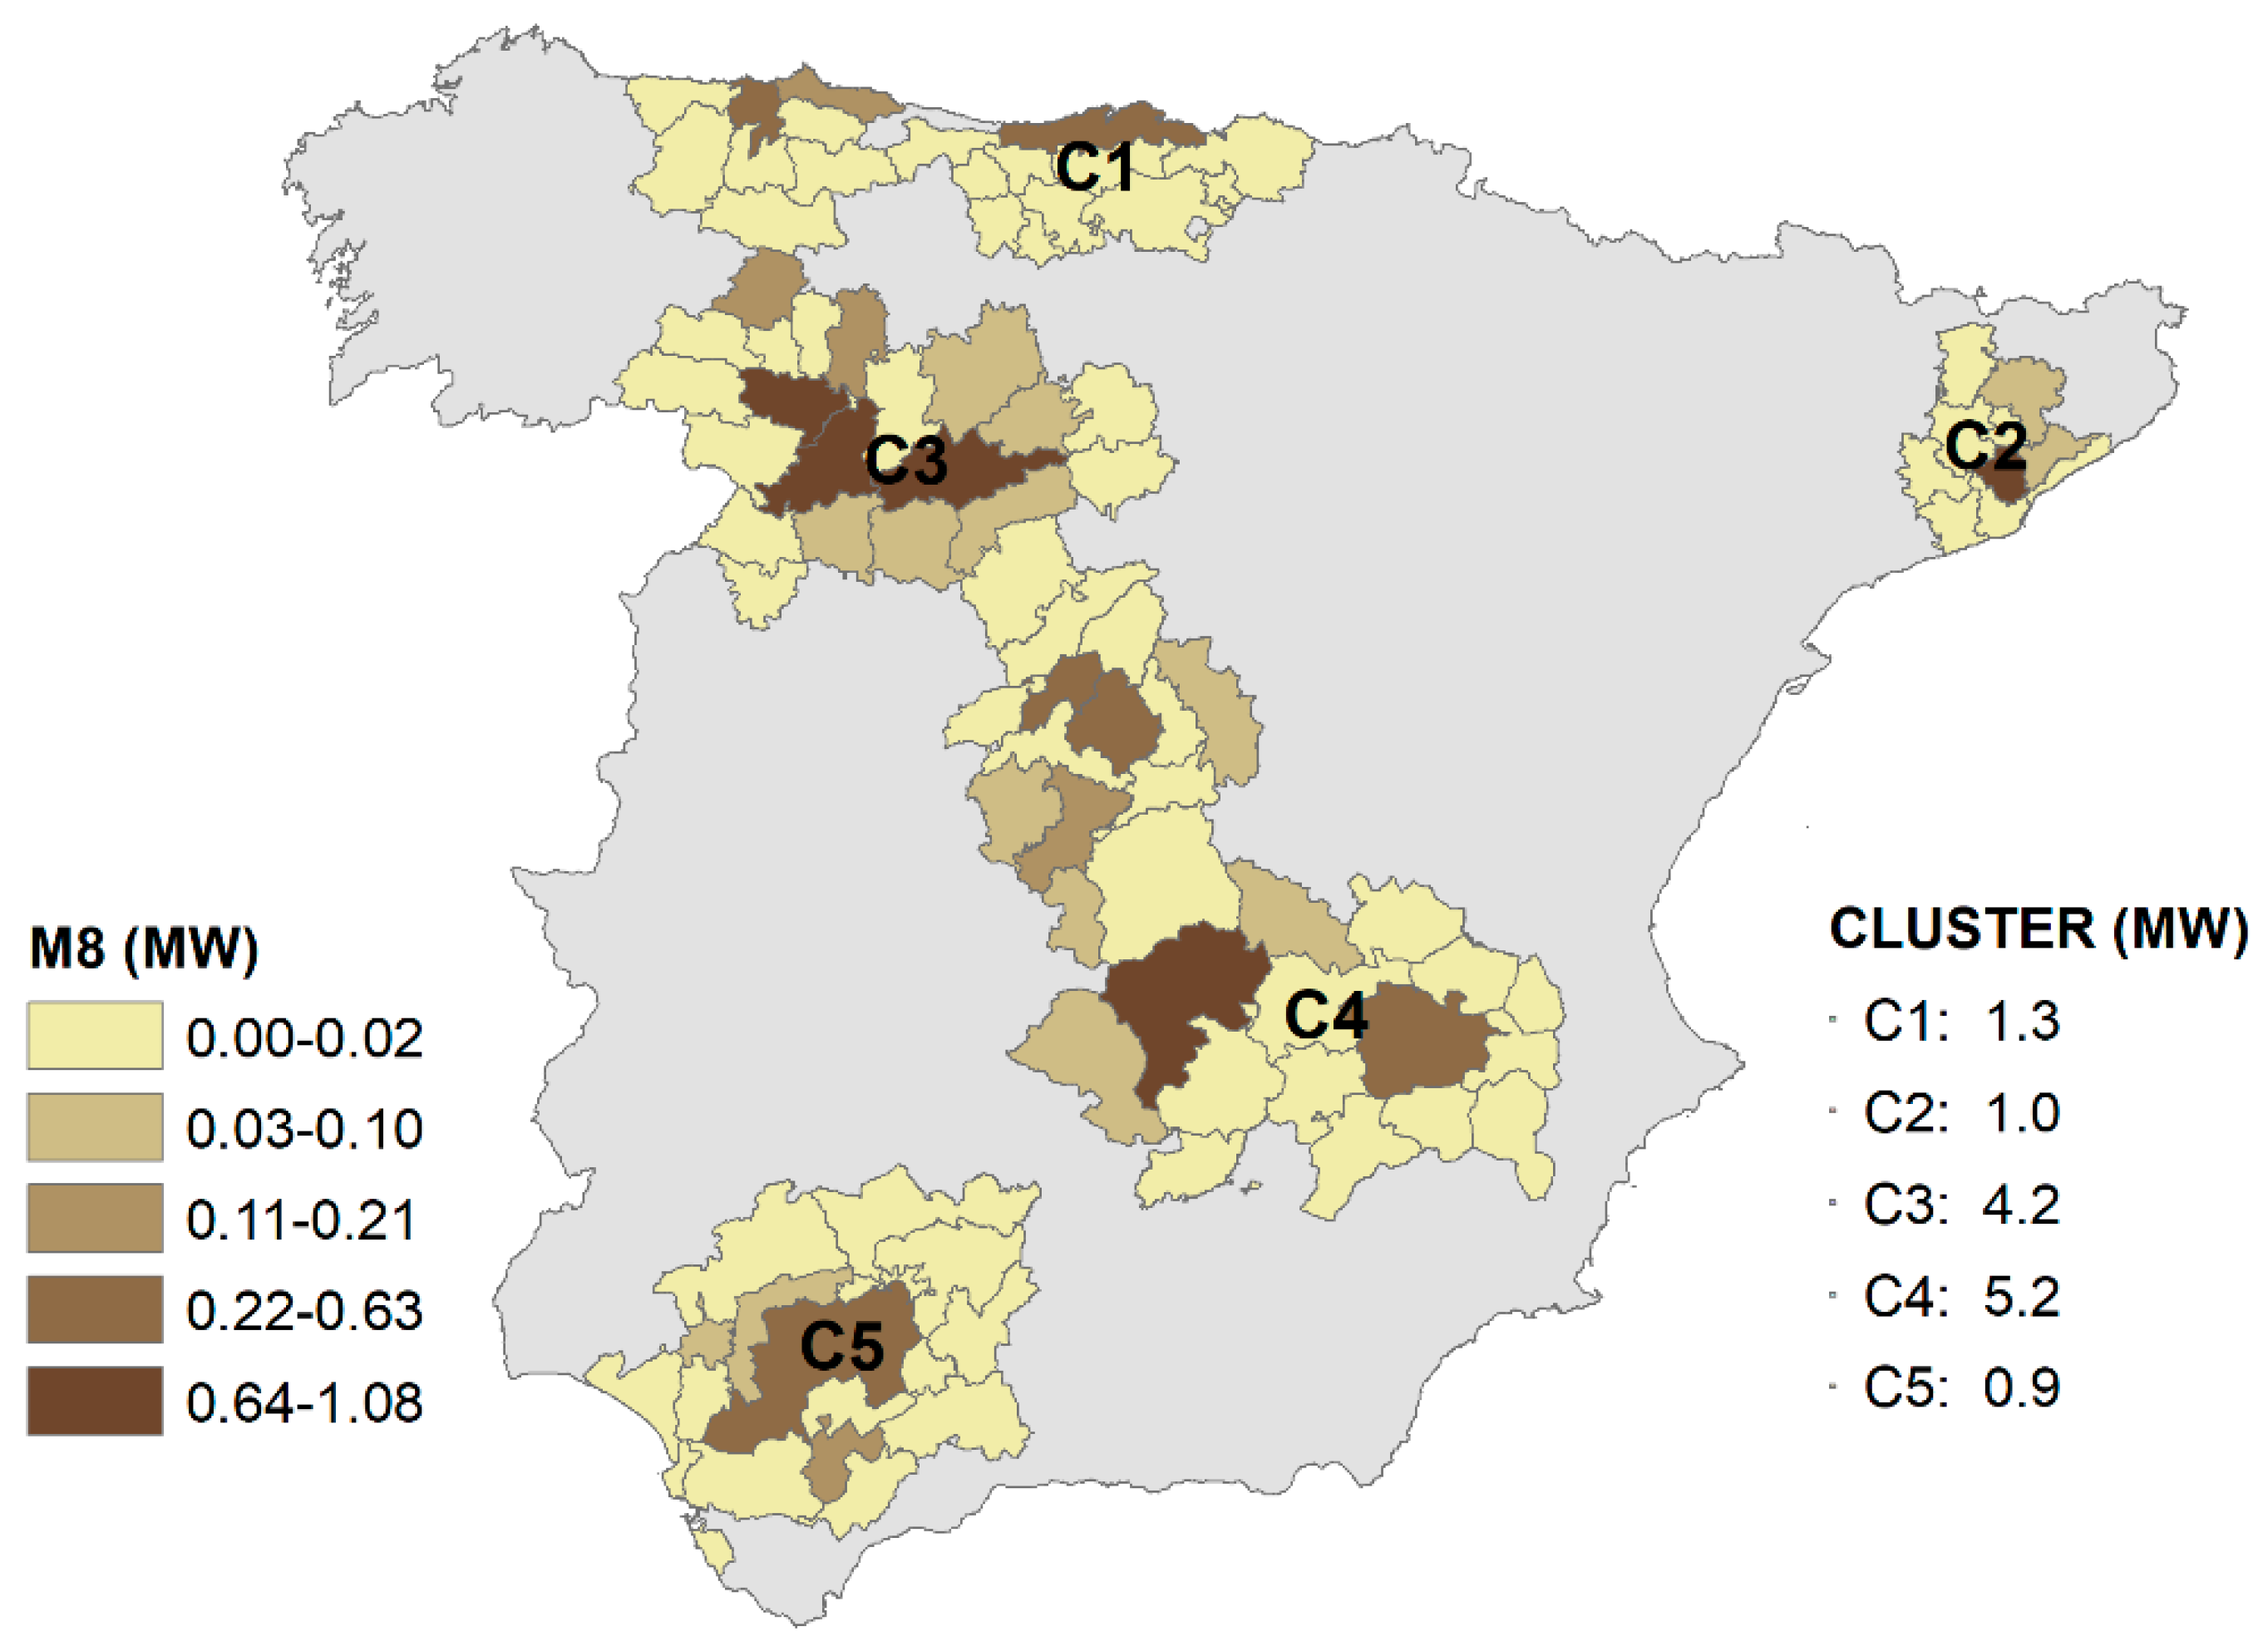
3.5. Generation Potential for Mixtures M7 and M8

Figure 7 and Figure 8 show the strong synergies that can be set between animal waste and whey. It can be observed that residues with the same origin but different properties can coexist in the same areas, favouring their use in co-digestion systems. Mixtures M7 (55% whey, 45% cow dung) and M8 (55% whey, 45% cow dung) work in a similar way, but with different proportions, in order to optimize the power energy generation. It should be noticed that whey is a very specific waste from dairy industries, and thus, its availability is limited despite its high biogas potential production in co-digestion. However, both mixtures’ power generation potentials do not exceed the minimum thresholds established for locating biogas-based power plants, even under optimal clustering. Nevertheless, they are, without a doubt, appealing options for distributed generation.
Table 7 summarizes the power potential for each cluster according to the evaluated co-digestion mixtures. The total power generation capacity is evaluated in 304.55 MW, but only 208.1 MW can be exploited in an efficient way by power plants with a rated power higher than 10 MW.

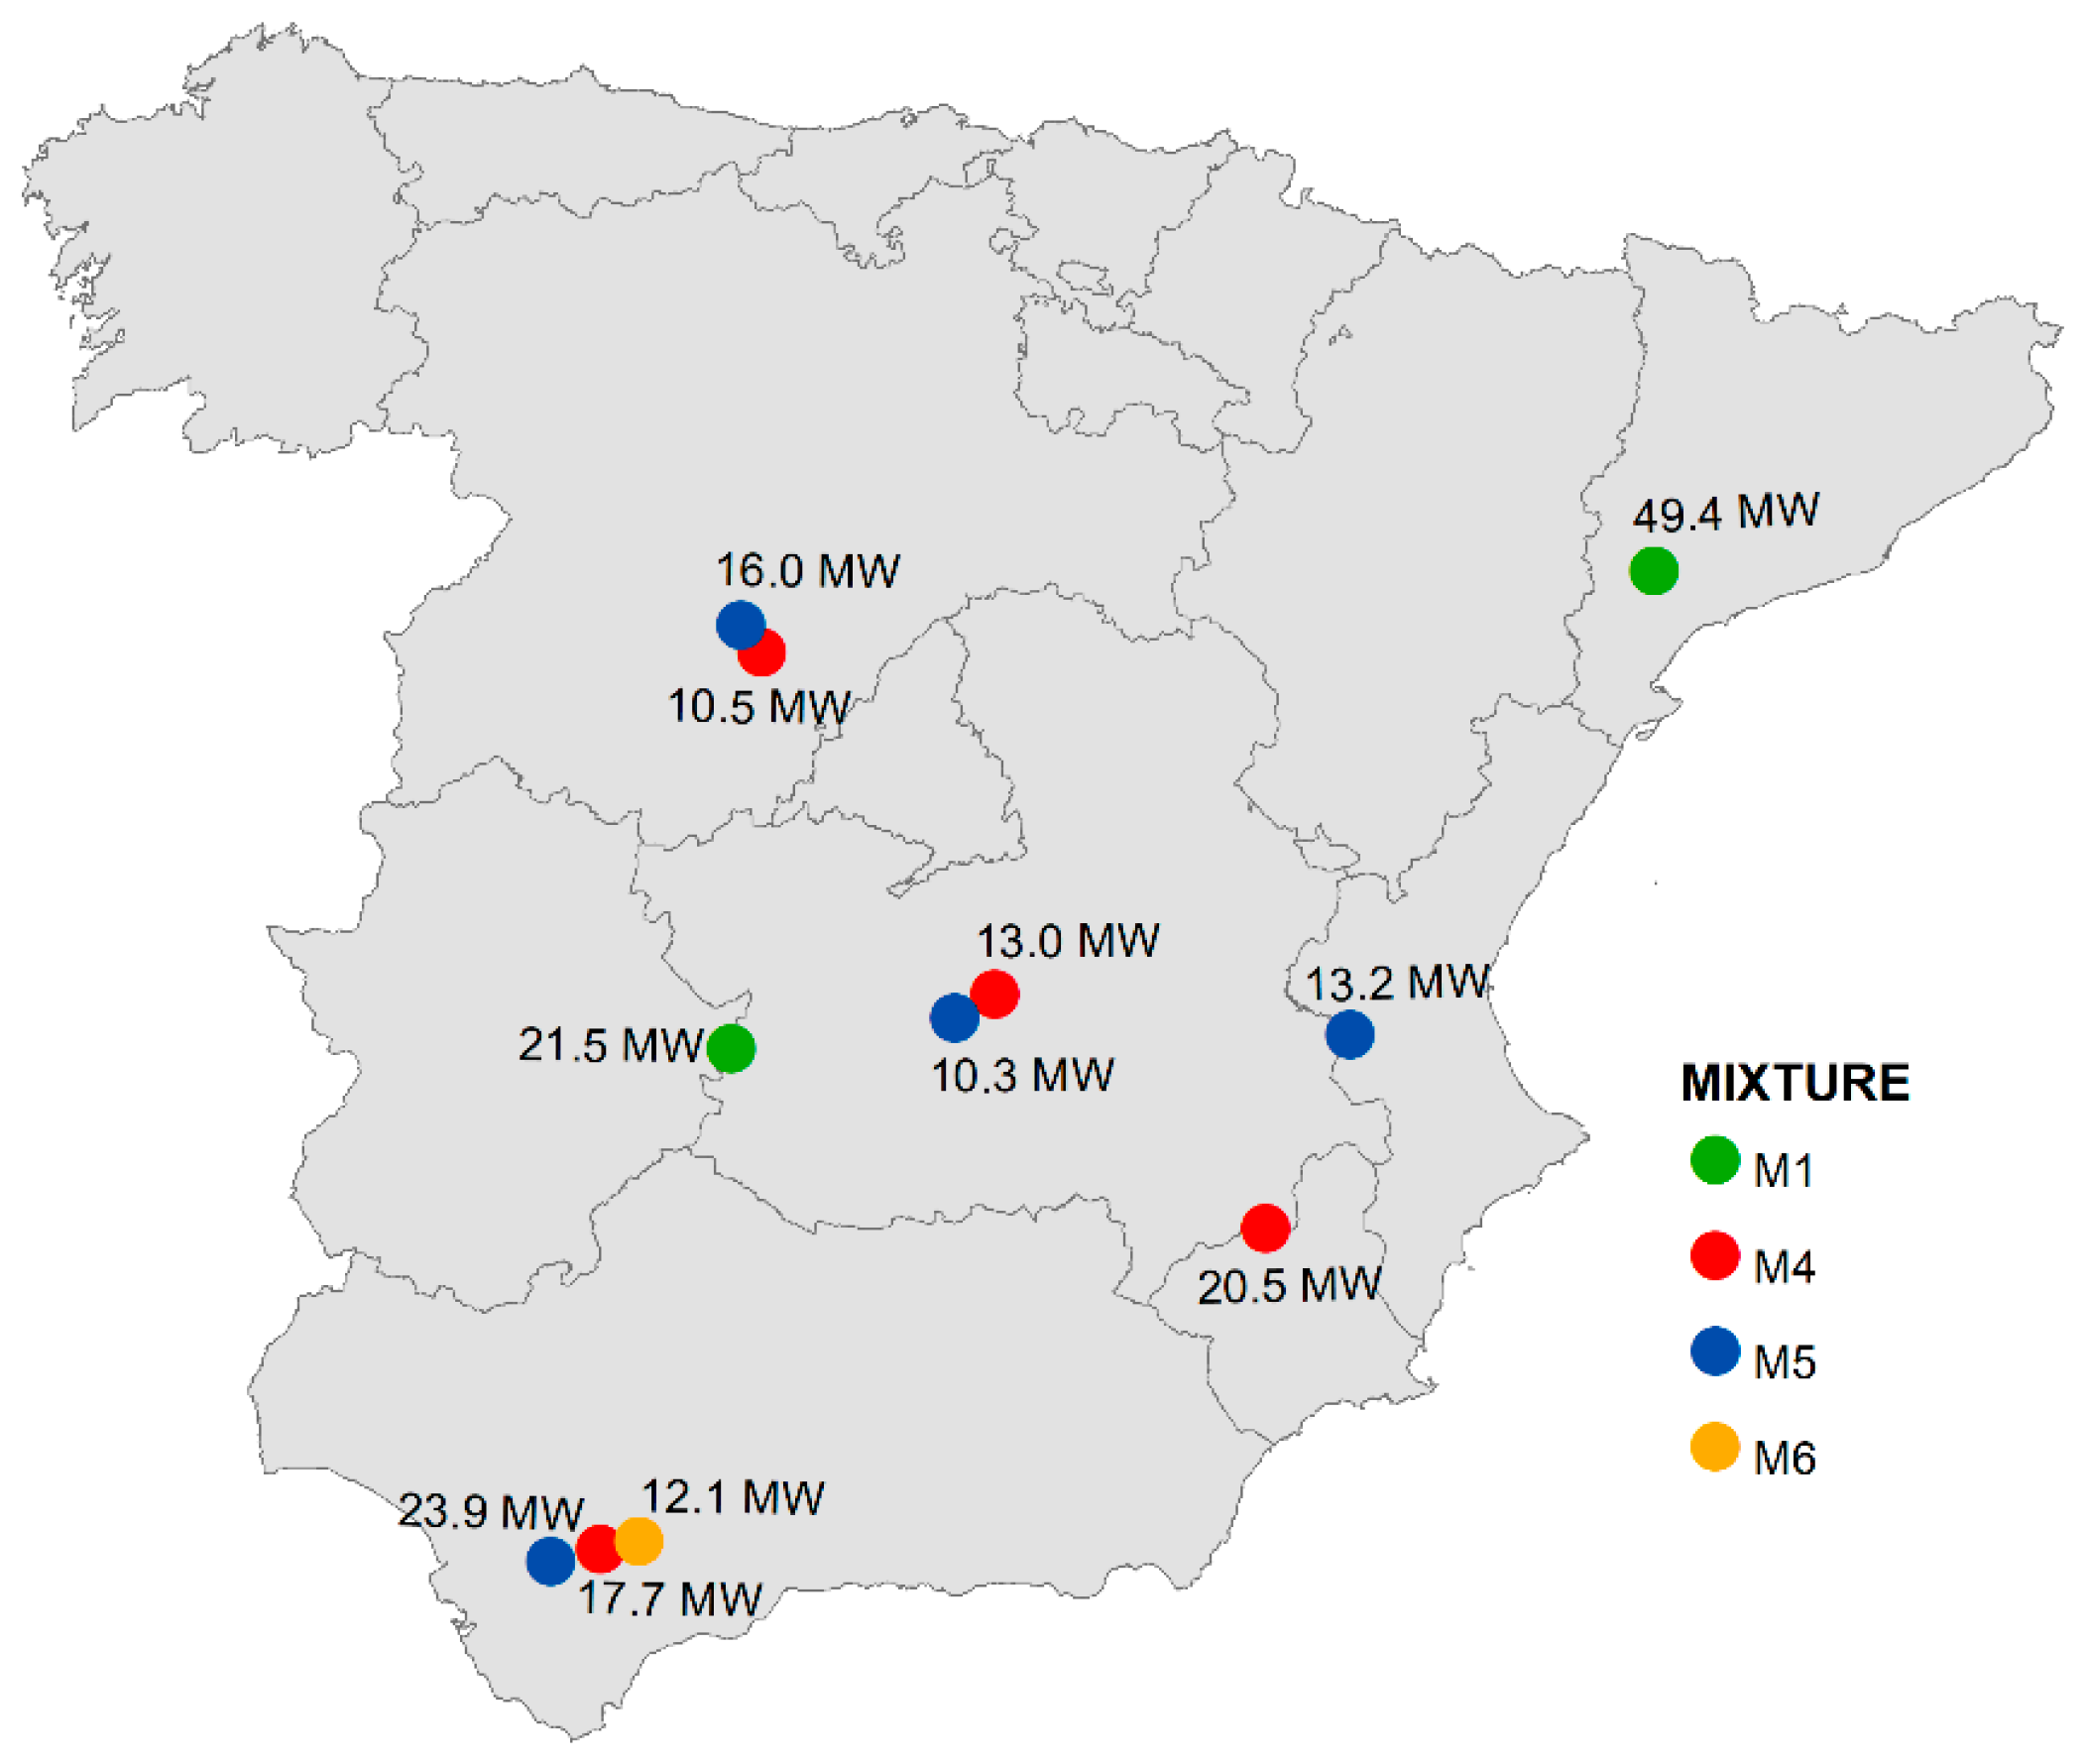
3.7. Optimized Size and Location of Feasible Co-Digestion Power Plants

Finally, Figure 9 shows the optimal sitting of the biogas-based power plants according to the optimization criteria explained in Section 2. These optimization criteria have been applied only to those clusters that show a power generation potential higher than 10 MW. This threshold shows that most of the potential has been wasted so far. Then, the optimal location of the feasible power plants was established in provinces with higher unemployment rates from those affected by the clusters, with access to transport routes and to the high voltage power grid and with the least distance to the gravity centre of the cluster.
As can be seen in the figure, the larger power plants are from mixture M1, with four plants from mixture M4 and another four from mixture M5.
Technical and socioeconomic criteria have been considered for the optimal location of the large power plants, noting that the social blockade to the installation of this type of plants can be reduced if the social benefit of the generated employment is considered. It has been observed that the location of this sort of plant can be influenced by a large number of criteria, which include the feedstock availability and price, energy and route infrastructures, and availability of manpower [48].
The deployment of the proposed co-digestion-based power plants can have a significantly positive impact on the environment and help to achieve the EU targets for decarbonisation of the economy. In particular, if we consider the CO2 emissions of the average Spanish electricity mix, which has been estimated by [49] at 0.331 kg eq.CO2/kWh (Iberian Peninsula electricity generation for 2016), the greenhouse gas (GHG) emission savings could be between 312,795 and 413,286 t CO2 per year. Although almost neglected by [50], this value does not take into account the GHG emissions related to the biomass transport, which can be assimilated into the carbon footprint of the energy generated from biomass sources (estimated by [49] in 0.018 kg eq.CO2/kWh). Then, considering the transport effect, the specific CO2 emissions savings rate would be:
β = ε g r i d ε b i o m a s s = 0.331 kg   eq . CO 2 kWh e ( 0.018 kg   eq . CO 2 kWh t · 0.9643 kWh t kWh p · 2.5 kWh p kWh e ) = 0.288 kg   eq . CO 2 kWh e ,
where β is the equivalent CO2 savings rate, εgrid the emissions rate for the average electricity mix, εbiomass the emissions rate for biomass-based generation sources, kWh t thermal kilowatt hour, kWh p primary energy kilowatt hour and kWh e electric kilowatt hour.
Thus, a more realistic CO2 savings value for the proposed power plants would be between 271,782 and 359,097 t CO2 per year (13.11% lower than the gross estimations).

4. Conclusions

The global potential for biogas production under a co-digestion regime has been determined from the mixtures available in Spain, and is determined as 208 MW of power electric energy exploitable in optimal conditions in power plants with rated power higher than 10 MW. Approximately 96 MW can be exploited in smaller power plants in distributed systems. Additionally, there is a residual power potential of 250 MW.
A methodology for optimal dispatching of co-digestion mixtures has been presented, which optimizes the set of power plants of the highest rated power, following the criteria of cost reduction by scale economy factors.
From the eight evaluated co-digestion mixtures, combinations M2 and M3 have been ruled out since they are not viable with the characteristic agro-livestock waste in Spain.
A uniform geographical distribution of the generation plants has been observed, located in areas where high-intensity agro-livestock farms predominate, as expected.
Comparing existing facilities and the proposal location and sizing in this study, it can be concluded that (i) co-digestion-based power plants in Spain are still far from their real potential; and (ii) the incorrect planning of the existing facilities based on a rated power supporting scheme decreases the economic profitability and optimal provision of the energy resources. Actually, the existing legal framework seems not to have favoured an adequate use of finite energy resources, which is a limiting factor for power plant sizing.
With the proposed energy strategy for co-digestion-based power plants, an overall savings of 359,097 t CO2 per year can be achieved, helping significantly with the target of the EU Commission of the decarbonisation of the energy generation sector.
Finally, it should be remarked that eight out of 11 feasible plants (132.19 MW) can be located in those provinces ranked in the top 10 most affected by unemployment in Spain, while 10 of them (158.71 MW) are ranked in the top 14.

Author Contributions

All co-authors have collaborated in an equal manner to the conception and design of the content, the performance of the studies, the analysis of the data and the writing of the paper.

Funding

This research was funded by GERSUL (Consorcio provincial de gestión de residuos de León, Spain), under the research project ref. 2011/00052/001, entitled: “Asesoramiento técnico y científico a GERSUL en materia de ahorro y eficiencia enegética en el CTR de S. Román de la Vega (León)”. The APC was funded partially by MDPI and Laboratorio de Inspección Técnica de Minas (LITEM).

Acknowledgments

This paper has been published in open access thanks to funds from the Laboratorio de Inspección Técnica de la Escuela de Minas (LITEM), Universidad de León (Spain). The authors want to thank all contributors to the project, especially Marián Ramos-Malmierca, Javier Visus-Hernández and Daniel Blanco-Cobián, and the editors and reviewers for their valuable comments that increased the overall quality of the manuscript.

Conflicts of Interest

The authors declare no conflict of interest. The founding sponsors had no role in the design of the study; in the collection, analyses, or interpretation of data; in the writing of the manuscript, and in the decision to publish the results.

Nomenclature

CO2 kg eq.CO2 kilograms equivalent
EUEuropean Union
GHGGreenhouse gases
GISGeographic information system
GWhGigawatt hour
IWAInternational Water Association
kcalKilocalories
kgVSKilograms of volatile solids
kWKilowatt
kWhKilowatt hour
kWheElectric kilowatt hour
kWhpPrimary energy kilowatt hour
kWhtThermal kilowatt hour
MWMegawatt
MWhMegawatt hour
NlNormal liter
Nm3Normal cubic meter
RESRenewable energy source
tton
WWTPWastewater treatment plant

References

  1. European Parliament. Regulation (EU) No 347/2013 of the European Parliament and of the Council of 17 April 2013 on Guidelines for Trans-European Energy Infrastructure and Repealing Decision No 1364/2006/EC and Amending Regulations (EC) No 713/2009, (EC) No 714/2009 and (EC) No 715/2009; Council of the European Union: Brussels, Belgium, 2013. [Google Scholar]
  2. Organization for Economic Co-Operation and Development. Environmental Outlook to 2050; OECD Publishing: Paris, France, 2012; pp. 1–353. [Google Scholar]
  3. Bhada-Tata, P.; Hoornweg, D.A. What a Waste?: A Global Review of Solid Waste Management; The World Bank: Washington, DC, USA, 2012; pp. 1–116. [Google Scholar]
  4. Castells, X.E. Tratamiento y Valorización Energética de Residuos; Ediciones Díaz de Santos: Madrid, Spain, 2005; ISBN 978-84-7978-694-6. [Google Scholar]
  5. Rodhe, H. A comparison of the contribution of various gases to the greenhouse effect. Science 1990, 248, 1217–1219. [Google Scholar] [CrossRef] [PubMed]
  6. Burton, C.H.; Turner, C. Manure Management: Treatment Strategies for Sustainable Agriculture; Editions Quae: Bedford, UK, 2003. [Google Scholar]
  7. Berglund, M.; Börjesson, P. Assessment of energy performance in the life-cycle of biogas production. Biomass Bioenergy 2006, 30, 254–266. [Google Scholar] [CrossRef]
  8. PRETOR. Available online: https://sedeaplicaciones.minetur.gob.es/Pretor/Vista/Informes/InformesInstalaciones.aspx (accessed on 14 October 2018).
  9. Real Decreto 661/2007, de 25 de Mayo, por el que se Regula la Actividad de Producción de Energía Eléctrica en Régimen Especial. Available online: https://www.boe.es/buscar/act.php?id=BOE-A-2007-10556 (accessed on 16 October 2018).
  10. European Union. Energy Roadmap 2050; European Union: Brussels, Belgium, 2012. [Google Scholar]
  11. Red Eléctrica de España. El Sistema Eléctrico Español; Resumen Ejecutivo: Madid, Spain, 2017. [Google Scholar]
  12. Ozsoy, G.; Alibas, I. GIS mapping of biogas potential from animal wastes in Bursa, Turkey. Int. J. Agric. Biol. Eng. 2015, 8, 74–83. [Google Scholar] [CrossRef]
  13. Höhn, J.; Lehtonen, E.; Rasi, S.; Rintala, J. A Geographical Information System (GIS) based methodology for determination of potential biomasses and sites for biogas plants in southern Finland. Appl. Energy 2014, 113, 1–10. [Google Scholar] [CrossRef]
  14. Valenti, F.; Arcidiacono, C.; Chinnici, G.; Cascone, G.; Porto, S.M. Quantification of olive pomace availability for biogas production by using a GIS-based model. Biofuels Bioprod. Biorefin. 2017, 11, 784–797. [Google Scholar] [CrossRef]
  15. Valenti, F.; Porto, S.M.C.; Chinnici, G.; Selvaggi, R.; Cascone, G.; Arcidiacono, C.; Pecorino, B. Use of citrus pulp for biogas production: A GIS analysis of citrus-growing areas and processing industries in South Italy. Land Use Policy 2017, 66, 151–161. [Google Scholar] [CrossRef]
  16. Sliz-Szkliniarz, B.; Vogt, J. A GIS-based approach for evaluating the potential of biogas production from livestock manure and crops at a regional scale: A case study for the Kujawsko-Pomorskie Voivodeship. Renew. Sustain. Energy Rev. 2012, 16, 752–763. [Google Scholar] [CrossRef]
  17. Brahma, A.; Saikia, K.; Hiloidhari, M.; Baruah, D.C. GIS based planning of a biomethanation power plant in Assam, India. Renew. Sustain. Energy Rev. 2016, 62, 596–608. [Google Scholar] [CrossRef]
  18. Panichelli, L.; Gnansounou, E. GIS-based approach for defining bioenergy facilities location: A case study in Northern Spain based on marginal delivery costs and resources competition between facilities. Biomass Bioenergy 2008, 32, 289–300. [Google Scholar] [CrossRef]
  19. Babalola, M.; Babalola, M.A. Application of GIS-Based Multi-Criteria Decision Technique in Exploration of Suitable Site Options for Anaerobic Digestion of Food and Biodegradable Waste in Oita City, Japan. Environments 2018, 5, 77. [Google Scholar] [CrossRef]
  20. Probiogas. Available online: http://www.probiogas.es/ (accessed on 23 September 2018).
  21. Ministerio de Medio Ambiente y Medio Rural y Marino. El Sector del Biogás Agroindustrial en España; Ministerio de Medio Ambiente y Medio Rural y Marino: Madrid, Spain, 2010; pp. 1–89.
  22. Hill, D.T. A Comprehensive Dynamic Model for Animal Waste Methanogenesis. Trans. ASAE 1982, 25, 1374–1380. [Google Scholar] [CrossRef]
  23. Buswell, A.M.; Mueller, H.F. Mechanism of Methane Fermentation. Ind. Eng. Chem. 1952, 44, 550–552. [Google Scholar] [CrossRef]
  24. Boyle, W.C. Energy recovery from sanitary landfills—A review. In Microbial Energy Conversion; Schlegel, H.G., Barnea, J., Eds.; Pergamon: Bergama, Turkey, 1977; pp. 119–138. ISBN 978-0-08-021791-8. [Google Scholar]
  25. Baserga, U. Landwirtschaftliche Co-Vergärungs-Biogasanlagen: Biogas aus Organischen Reststoffen und Energiegras; FAT: Zürich, Switzerland, 1998. [Google Scholar]
  26. Robra, S. Uso da Glicerina Bruta em Biodigestão Anaeróbica: Aspectos Tecnológicos, Ambientais e Ecológicos; Druck diplomica Verlag GmbH: Hamburg, Germany, 2007; ISBN 978-3-95636-249-1. [Google Scholar]
  27. Amon, T.; Amon, B.; Kryvoruchko, V.; Machmüller, A.; Hopfner-Sixt, K.; Bodiroza, V.; Hrbek, R.; Friedel, J.; Pötsch, E.; Wagentristl, H.; et al. Methane production through anaerobic digestion of various energy crops grown in sustainable crop rotations. Bioresour. Technol. 2007, 98, 3204–3212. [Google Scholar] [CrossRef] [PubMed]
  28. Andrews, J.F.; Graef, S.P. Dynamic Modeling and Simulation of the Anaerobic Digestion Process. In Anaerobic Biological Treatment Processes; Advances in Chemistry; American Chemical Society: Washington, DC, USA, 1971; Volume 105, pp. 126–162. ISBN 978-0-8412-0131-6. [Google Scholar]
  29. Parker, W.J. Application of the ADM1 model to advanced anaerobic digestion. Bioresour. Technol. 2005, 96, 1832–1842. [Google Scholar] [CrossRef] [PubMed]
  30. Rosen, C.; Vrecko, D.; Gernaey, K.V.; Pons, M.N.; Jeppsson, U. Implementing ADM1 for plant-wide benchmark simulations in Matlab/Simulink. Water Sci. Technol. 2006, 54, 11–19. [Google Scholar] [CrossRef] [PubMed]
  31. Thamsiriroj, T.; Murphy, J.D. Modelling mono-digestion of grass silage in a 2-stage CSTR anaerobic digester using ADM1. Bioresour. Technol. 2011, 102, 948–959. [Google Scholar] [CrossRef]
  32. Lauwers, J.; Appels, L.; Thompson, I.P.; Degrève, J.; Van Impe, J.F.; Dewil, R. Mathematical modelling of anaerobic digestion of biomass and waste: Power and limitations. Prog. Energy Combust. Sci. 2013, 39, 383–402. [Google Scholar] [CrossRef]
  33. Batstone, D.J.; Keller, J.; Angelidaki, I.; Kalyuzhnyi, S.V.; Pavlostathis, S.G.; Rozzi, A.; Sanders, W.T.M.; Siegrist, H.; Vavilin, V.A. The IWA Anaerobic Digestion Model No 1 (ADM1). Water Sci. Technol. 2002, 45, 65–73. [Google Scholar] [CrossRef] [Green Version]
  34. Chen, Y.R. Kinetic analysis of anaerobic digestion of pig manure and its design implications. Agric. Wastes 1983, 8, 65–81. [Google Scholar] [CrossRef]
  35. Harris, P. Biowatts—Online Biogas Calculator & Biomass Marketplace—Index. Available online: http://www.biowattsonline.com/anaerobic_digestion_kinetics_calculator/index (accessed on 5 November 2018).
  36. Samarasiri, B.K.T.; Samarakoon, S.W.S.; Rathnasiri, P.G.; Gunawardena, S.H.P. Mechanistic model for electricity generation via biomethane production through anaerobic digestion of organic fraction of municipal solid waste generated in Sri Lanka. In Proceedings of the 2017 Moratuwa Engineering Research Conference (MERCon), Moratuwa, Sri Lanka, 29–31 May 2017; pp. 407–412. [Google Scholar]
  37. Ministerio de Agricultura, Pesca y Alimentación. Comarcas Agrarias. Available online: https://www.mapama.gob.es/es/cartografia-y-sig/ide/descargas/agricultura/default.aspx (accessed on 23 September 2018).
  38. Bidart, C.; Fröhling, M.; Schultmann, F. Livestock manure and crop residue for energy generation: Macro-assessment at a national scale. Renew. Sustain. Energy Rev. 2014, 38, 537–550. [Google Scholar] [CrossRef]
  39. Daniel-Gromke, J.; Liebetrau, J.; Denysenko, V.; Krebs, C. Digestion of bio-waste-GHG emissions and mitigation potential. Energy Sustain. Soc. 2015, 5, 3. [Google Scholar] [CrossRef]
  40. Muñoz Soler, N. Valorización de Residuos de la Industria Agroalimentaria. Codigestión de Estiércol de Vacuno Lechero y Suero de Quesería; Universidad de Cantabria: Cantabria, Spain, 2017. [Google Scholar]
  41. Metaniza. Available online: http://213.229.136.11/bases/ainia_probiogas.nsf/webContents/Metaniza (accessed on 29 November 2018).
  42. Interreg IVB SUDOE AGROGAS. Available online: http://www.agrogas.eu/herramienta-de-biog-s-532.html (accessed on 29 November 2018).
  43. The German Solar Energy Society. Planning and Installing Bioenergy Systems: A Guide for Installers, Architects, and Engineers; James & James: London, UK, 2005; ISBN 1-84407-132-4. [Google Scholar]
  44. López, R.; Menéndez, M.; Fernández, C.; Bernardo-Sánchez, A. The effects of scale-up and coal-biomass blending on supercritical coal oxy-combustion power plants. Energy 2018, 148, 571–584. [Google Scholar] [CrossRef]
  45. Rentizelas, A.A.; Li, J. Techno-economic and carbon emissions analysis of biomass torrefaction downstream in international bioenergy supply chains for co-firing. Energy 2016, 114, 129–142. [Google Scholar] [CrossRef] [Green Version]
  46. Wood, A.J.; Wollenberg, B.F. Power, Generation, Operation and Control, 2nd ed.; John Wiley: Toronto, ON, Canada, 1996. [Google Scholar]
  47. Dopico, V. Propuesta de Tarifas de Coste de Transporte de Mercancías. Available online: https://docplayer.es/5597155-Propuesta-de-tarifas-de-coste-de-transporte-de-mercancias.html (accessed on 29 November 2018).
  48. Lee, G.-E.; Loveridge, S.; Joshi, S. Local acceptance and heterogeneous externalities of biorefineries. Energy Econ. 2017, 67, 328–336. [Google Scholar] [CrossRef]
  49. Ministerio de Industria, Energía y Turismo. Factores de Emisión de CO2 y Coeficientes de Paso a Energía Primaria de Diferentes Fuentes de Energía Final Consumidas en el Sector de Edificios en España. Documeto Reconocido del Reglamento de Instalaciones Térmicas en los Edificios (RITE); Gobierno de España: Madrid, España, 2016; p. 31.
  50. Joint Research Centre European Comission. WELL-TO-TANK Report Version 4.0 JEC WELL-TO-WHEELS ANALYSIS; European Commission: Brussels, Belgium, 2013; p. 134. [Google Scholar]
Figure 1. (a) Geographical distribution and its rated power of the currently installed digestion-based power plants in Spain. (b) Relative frequency of the rated power (data from [8]).
Environments 05 00137 g001
Figure 2. Volume distribution of the studied materials in Spain (data from [20]).
Environments 05 00137 g002
Figure 3. Geographical distribution of the power potential and clusters’ power for mixture M1.
Environments 05 00137 g003
Figure 4. Geographical distribution of the power potential and clusters’ power for mixture M4.
Environments 05 00137 g004
Figure 5. Geographical distribution of the power potential and clusters’ power for mixture M5.
Environments 05 00137 g005
Figure 6. Geographical distribution of the power potential and clusters’ power for mixture M6.
Environments 05 00137 g006
Figure 7. Geographical distribution of the power potential and clusters’ power for mixture M7.
Environments 05 00137 g007
Figure 8. Geographical distribution of the power potential and clusters’ power for mixture M8.
Environments 05 00137 g008
Figure 9. Geographical distribution of the proposed feasible power plants.
Environments 05 00137 g009
Table 1. Power capacity, generated energy and average load factor for RES generation technologies in Spain in 2017 (data from [11]).
RESInstalled Capacity (MW)Generated Energy (GWh)Average Load Factor (kWh/kW)
Wind energy22,92247,4982072
Photovoltaic443979881799
Biogas844975919
Total RES47,67083,5261752
RES: renewable energy sources; MW: megawatt; GWh: gigawatt hour; kWh: kilowatt hour.
Table 2. Identification of the different types of waste available to be used in anaerobic digestion.
CodeType of MaterialCodeType of Material
R01Pork slurryR21Other fruit rejection
R02Cow dungR22Vegetable transformation
R03Chicken dungR23Tuber transformation
R04Manure from other animal speciesR24Citrus transformation
R05Raw materials of meat slaughterhouseR25Other fruit transformation
R06Raw materials of poultry slaughterhouseR26Beer bagasse
R07Stacking raw materialsR27Olive oil by-product
R08FloursR28Olive oil waste
R09Meat sludge WWTP *R29Raw materials from wine industry
R10Milk sludge WWTP *R30Raw materials from cider industry
R11WheyR31Raw materials from sugar industry
R12Dairy raw materialsR32Cereal straw
R13Fish raw materialsR33Vegetable transformation sludge WWTP *
R14Fish sludge WWTP *R34Energy crops
R15Vegetable surplusR35Glycerine
R16Citrus surplusR36Bioethanol from manufacturing raw materials
R17Other fruit surplusesR37Bioethanol from manuf. raw mat. in sugar industry
R18Vegetable rejectionR38Food retailing
R19Tuber rejectionR39Bar and restaurant waste
R20Citrus rejectionR40Hotel waste
* WWTP: Wastewater Treatment Plant.
Table 3. Unit production of biogas for each type of material (data from [21]).
MaterialBiogas Production (Nm3/t)
Pork slurry10.82
Chicken dung31.28
Cow dung115.59
Flour469.00
Agricultural residuals106.00
Whey37.00
Glycerine686.00
Table 4. Biogas and methane fraction generation for each organic material type (data from [25]).
TypeBiogas Production (Nm3/t)CH4 (%)
Carbohydrates79050%
Fat125068%
Proteins70071%
Table 5. Potential net production of biogas for each evaluated mixture (data from [21,40]).
MixtureBreakdownBiogas Production (Nm3/t)
M162% Pork slurry
38% Chicken dung and cow dung
20.17
M295% Pork slurry, chicken dung and cow dung
5% Flours
42.99
M390% Pork slurry, chicken dung and cow dung
10% Flours
65.40
M480% Pork slurry, chicken dung and cow dung
20% Agricultural residuals
31.76
M595% Pork slurry, chicken dung and cow dung
5% Glycerine
31.36
M690% Pork slurry, chicken dung and cow dung
10% Glycerine
87.11
M755% Whey
45% Cow dung
10.60
M885% Whey
15% Cow dung
14.60
Table 6. Optimization criteria.
IDOptimization FactorValuePriority
1Transport costs<200 km1
2Power grid access<1 km3
3Vicinity of urban centres or natural parks>2 km4
4Communication routes (national and secondary roads)<1 km2
5Unemployment rateHighest5
Table 7. Nominal characteristics of the selected facilities.
MixtureClusterPower Potential (MW)MixtureClusterPower Potential (MW)
M1C13.81M6C16.53
C249.39C21.44
C321.55C36.30
C45.58C44.03
C55.76C51.44
M2C11.73C63.40
C21.32C72.27
M3C10.22C86.93
C20.16C912.07
M4C115.98M7C10.32
C25.38C22.57
C34.02C35.48
C417.68C41.94
C513.03C50.84
C69.96M8C11.33
C720.49C20.96
M5C110.54C34.23
C223.88C45.25
C310.28C50.86
C413.21Not clusterized (all mixtures)250.18
C52.39

