Groundwater Vulnerability and Risk Assessment in A Karst Aquifer of Greece Using EPIK Method


1
Department of Water Resource Management, University of Applied Forest Sciences Rottenburg, 72108 Rottenburg, Germany
2
Laboratory of Engineering Geology & Hydrogeology, Department of Geology, Aristotle University, GR54124 Thessaloniki, Greece
*
Author to whom correspondence should be addressed.
Environments 2019, 6(11), 116; https://doi.org/10.3390/environments6110116
Submission received: 16 July 2019
/
Revised: 25 October 2019
/
Accepted: 29 October 2019
/
Published: 31 October 2019
(This article belongs to the Special Issue Groundwater Quality and Groundwater Vulnerability Assessment)
Abstract
:The aim of this study was the assessment of groundwater vulnerability and pollution risk of the Perivleptos karst aquifer in the northwestern part of Greece. Hence, the EPIK method has been applied within the study area. Additionally, a detailed literature overview has been obtained, including the worldwide application of the EPIK method. The hazard map has been developed for the implementation of risk assessment. The resulting vulnerability map was divided into four classes and showed especially high to very high vulnerability. The subsequent hazard assessment has shown mostly low to moderate endangerment for the northern part of the study area, which is mainly covered by forest, while the areas covered by urban and industrial, as well as agricultural land, use primarily show high to very high endangerment. Concluding in the risk map, the study area consists of 13% of very high, 48% of high, 36% of moderate and 4% of low risk of contamination. According to the literature overview, the EPIK method was mostly used in combination with other vulnerability assessment methods, and results have been validated through tracer tests, sensitivity analysis or comparing to other methods. In this study, an additional single parameter sensitivity analysis was obtained for validation of the EPIK parameters.
1. Introduction
Groundwater accounts for 98% of all freshwater on earth, and thus is the most important water resource for more than half of the world´s population [1]. At the same time, it is the most extracted raw material in the world, and with a global withdrawal rate of 800–1000 km3/year, this is twenty times more than the extraction of oil [1]. Driven by the world’s population increase up to 33% until 2050 [2,3] and a rising food demand by 60% [3], the demand for arable land worldwide will increase tremendously. Agriculture draws 70% of global freshwater [4]. This leads to an increasing freshwater demand worldwide which is mostly covered by groundwater, especially in regions that are already dealing with water stress [1]. In this context, water stress means a negative water balance, provoked by e.g., climatic conditions, irregular rainfalls and increased water demands due to agriculture and tourism. On a global scale, between 20–25% of the world’s population relies on groundwater from karst aquifers [5]. Thus, karst aquifers are of significant importance to the freshwater supply, and constitute the main supply for many cities in the country [6,7]. According to Daskalaki and Voudouris [7], with its semi-arid climate and fragile socio-economic conditions, Greece is ranked 31st out of 50 countries suffering from severe water stress. In Greece, 86% of the total annual water demand is used for agricultural irrigation, covered mainly by groundwater, as it is the main water source in Greece. In total, there are 300,000 existing boreholes (legal and illegal) in Greece.
Moreover, the aquifers in Greece with the highest productivity are found in carbonate rocks. Carbonate rocks cover an area of about 35% of Greece, especially in the western, southern and central parts [7]. The main aquifers in Greece are porous in granular rocks and karst aquifers. The latter result from the solution of carbonate minerals like calcites or dolomites based on the reaction with CO2=containing water, and thus, its acidic reaction. Karst aquifers are unique, and show special characteristics, including large voids and high flow velocities. Its special character enables water transport over long distances and rapid infiltration. These factors make karst aquifers extremely vulnerable to contamination, especially due to the increase of potentially harmful anthropogenic activities, which have been developed above the aquifers [8,9,10].
For protecting these aquifer systems, securing groundwater against pollution and promoting the sustainable use of groundwater resources, the EU Water Framework Directive pursues the aim of defining protection zones around the proximity of public drinking water supplies [11]. In Switzerland, the Centre of Hydrogeology of the Neuchâtel University was contracted by the Federal Office for Environment, Forests and Landscape and the Swiss National Hydrological and Geological Survey to develop a new method for the delineation of groundwater protection zones in a karst environment [11]. Therefore, the EPIK method, developed by Doerfliger et al. [11] was the first attempt of vulnerability mapping specifically for karstic environments. The multiparameter method consists of four parameters: Epikarst (E), Protective Cover (P), Infiltration Conditions and (I) and the Degree of Karstic Network Development (K). The method was developed to determine the intrinsic vulnerability of groundwater to surface and subsurface contamination and address the definition of protection zones in a karst environment. In this context it is to accentuate that the EPIK method was the first method that allows an application at the catchment scale and thus, is appropriately adapted for the delineation of protection zones [12]. For the designation of groundwater protection zones, vulnerability maps serve as a valuable tool. The term “vulnerability” dates back to the 1960s, where it was scientifically used by Albinet and Margat [13].
In the context of the EPIK method, vulnerability is defined as the sensitivity of groundwater to anthropogenically-caused contamination. Thereby it is necessary to distinguish between intrinsic vulnerability (the distinctive hydrogeological and geological characteristics, determining the vulnerability) and the specific vulnerability, which describes the characteristic contamination, caused by a specific contaminant. Vulnerability is described by Doerfliger [11] as “a function of the natural properties of the overlying soil and rock column or unsaturated zone of the aquifer”.
The risk of groundwater pollution is, therefore, dependent upon both the “natural”, intrinsic vulnerability and the specific vulnerability, the contaminant load on the subsurface, caused by human activity. Through the years, various methods for vulnerability assessment have been developed. It has to be mentioned that vulnerability assessment is a highly subjective process. It is occasionally that the application of different methods on the same test site results in different vulnerability maps [14]. Still, there is no European standardized method that would lead to coherent results. Therefore, vulnerability assessment depends on the available dataset, time and financial frame, as well as the location of the study area.
Since the first introduction of vulnerability, various methods for vulnerability assessment have been presented. The first approach was introduced by the Environmental Protection Agency (EPA) of the USA in 1987, where the DRASTIC method was presented. The DRASTIC method takes seven hydrogeological parameters into consideration: Depth of groundwater (D), net recharge (R), aquifer media (A), soil media (S), topography (T), impact of the vadose zone media (I) and the hydraulic conductivity of the aquifer (C) [10,15]. Over time, the DRASTIC method has been developed and modifications, as well as new methods, have been published, including GOD [16], AVI [17], GLA [18], ISIS method [19], German method [20], SINTACS [21] and more. The just mentioned methods were applicable independently of the relevant aquifer type. Although these methods have not been intentionally designed especially for the karst environment, they have been adapted and applied in karst areas [10]. However, results have shown that for karst areas, a more specific method is necessary [10].
This paper deals with the vulnerability, hazard and risk assessment to external pollution of a karst system in NW Greece, and is therefore divided into three sections. The first section evaluates an overview of applied EPIK method, as well as the resulting modifications, advantages and disadvantages since its first implementation in 1999. In the second section, the geological, climatic, hydrogeological and land use data of the study area were evaluated and presented. In the third section, the EPIK method was applied for groundwater vulnerability assessment of the studied karst aquifer. Hence, the pollution risk map was obtained from the combination of the hazard and vulnerability map. The elaboration of all data was conducted in a geographic information system (GIS) environment applying overlying techniques. Concluding, results are presented and some recommendations are made to protect the karst aquifer system.
2. Literature Overview
In the following, an overview of the application of the EPIK method on a time scale is presented. In total, 15 applications of EPIK method are presented in this work. The results in the here-mentioned publication form only a small selection of existing applications of EPIK method around the world. Although there exist many more applications of this EPIK method, due to the available time frame of this work, only a selection of the ones published on the Scopus platform will be noted.
Over the last decades, various studies have been compared in order to analyze the performances of these methods. Depending on the present conditions, some methods have proven more suitable than others have. Following the first application of the EPIK method by Doerfliger and Zwahlen [11] on the St. Imier catchment area in Bern, Switzerland, Gogu and Dassargues [22] have analyzed the statistical sensitivity of the single E-P-I-K parameters of EPIK method on a test site in Belgium. In that study, the effective weights and the theoretical weights of the parameters were disparate. For example, the Epikarst parameter appeared overrated (39%) compared to the theoretical weight (33.3%) of the parameter presented in the study of Doerfliger and Zwahlen [11]. On the contrary, the I-parameter was proven underweighted, comparing the 29.8% of the Belgium test site with the 33.3% of the theoretical weight. This analysis shows that changes in the weights can either increase or reduce the importance of a single parameter, and thus proves the subjective element of vulnerability assessment. The authors Gogu and Dassargues [22] recommend applying a sensitivity analysis for every vulnerability assessment in order to archive a more efficient interpretation of the vulnerability indices. Thus, it is necessary to be aware of the subjective impact of each parameter. Three years later, the same authors compared the EPIK method to DRASTIC, GOD, ISIS and the German method for the slight karstified test site in Condroz Region, southern Belgium. The EPIK method, as the only karst-specific method in this application, has proven to be the most suitable one for this test site [23].
In 2006, Neukum and Hötzl [24] applied the EPIK method together with the DRASTIC, PI and GLA methods on a study area between Karlsruhe and Stuttgart, Southwest Germany. The generally well-karstified area showed high vulnerability, but depending on the applied method, differences in the intensity occurred. The DRASTIC and GLA method both worked independently of the aquifer type, but the GLA method estimated higher vulnerability than the DRASTIC method. The PI method showed the highest vulnerability, whereas the EPIK method assumed moderate vulnerability for the whole study area, except for the catchment of the sinking stream [24]. In a following study, the EPIK method was compared with the PI, Simplified and COP Method, as well as the Slovene approach in the catchment area of Podstenjsek spring, southwest Slovenia [8]. Regarding Ravbar and Goldscheider [8], the main difference occurred in temporal hydrologic variations. Special hydrologic conditions, particularly heavy rainfall and snowmelt events, lead to strong fluctuations of the groundwater table resulting in intermittent lakes in the study area. While the EPIK method and the Slovene approach deem karst geomorphological characteristics more significant than fluctuation in the groundwater table, the PI method values the thickness of the unsaturated zone higher than the geomorphological features. Conclusively, the Slovene approach shows the most reasonable results for the study area, especially in low water conditions [8]. Various methods including GOD, DRASTIC, SINTACS, EPIK, PI and COP have been applied for vulnerability assessment in Apulia, Southern Italy by Polemio et al. [25].
In order to compare universal methods, like DRASTIC and SINTACS, with more karst sensitive methods like EPIK, COP and PI, a universal vulnerability index was used. Results revealed that universal methods consider a high number of parameters, and thus, present results on a large scale, while karst-sensitive methods are more suitable for the test site [25,26].
In 2015, Kazakis et al. [27] compared the EPIK, DRASTIC, AVI and DRASTIC-FM methods to the Anthemountas basin in north Greece. The test area contains three different aquifer types: Porous, karstic and fissured rock aquifer, which therefore need special consideration. Vulnerability assessment has shown that each method provides different results for different aquifer types. Results have proven the authors’ expectations, meaning EPIC, AVI and DRASTIC-FM methods have each been developed for special aquifer types, while DRASTIC is a general tool for vulnerability assessment, regardless of the aquifer type. As a consequence, the author sympathizes with a general application in advance, followed by special methods for significant aquifer types present in the study area [27]. In 2016, Hamdan et al. [28] applied the EPIK method in the catchment area of the Tanour and Rasoun springs in northwest Jordan. For the applied groundwater vulnerability assessment, the COP and EPIK methods were compared. Results have revealed that the COP method is more flexible regarding different hydrogeological conditions. Nevertheless, both methods are designed for karstic formations and present the urgent need for protection measurements in the study area, but the COP method has shown better suitability for that specific test site [28]. For the vulnerability assessment on a test site in Quatar, which contains karst- as well as non-karstic features, the DRASTIC and EPIK methods were compared. Results present the DRASTIC method as more suitable for the study area. Both maps confirm areas of depressions and land collapse as the most vulnerable ones. The main difference is that the DRASTIC method uses the depth of the water table and topology, which results in very high vulnerability in coastal areas, while the EPIK method neglects these parameters, which leads to a very low vulnerability in the vulnerability map [15].
On a test site in Yichang, in Hubei Province, SW China, only the EPIK method has been applied, but results have been validated using tracer tests [29]. Contrary to the successful application in China [29] and Brazil [30,31], the use of European methods to the Mexican Yucatán karst has shown that the applied methods need more adaptation for the local karst system and do not correspond with regional characteristics. The applied methods include EPIK, COP, PI and PaPRIKa. While the first three methods showed similar vulnerability (>52%), the PaPRIKa method has shown especially high and very high vulnerability for the test site [12]. This can be justified by the fact that this PaPRIKa method takes all components of the karst aquifer into account. In general, there are modern tools for the application of the method, such as a PaPRIKa QGIS plugin [32]. In the eastern hemisphere, in the regions around Beirut, Jal el Dib and Tripoli, Lebanon, three different variations of the EPIK method were applied. Thereby the author distinguished between EPIK-V1 to V3 regarding the urbanization impact [33].
In general, the EPIK method has been modified various times over the last decades. The RISKE method, presented by Petelet-Giraud et al. [34], and further developed by Plagnes et al. [35] to become the RISKE 2 method, was the first modification, mentioned by Iván und Mádl-Szőnyi [26]. RISKE was then further used as a base for the PRESK method, developed by Koutsi and Stournaras [36]. More recent, the PaPRIKa method has been developed, combining several of the initial approaches, such as EPIK, COP and the European approach. In the study of Moreno-Gómez, the PaPRIKa method has been applied together with the EPIK method and others [12]. In combination with hazard and risk assessment, the EPIK method has been applied by Younos et al. [37].
Resulting from the overview in this work, the EPIK method is a worldwide applied and commonly used method. Due to its practicality, various studies have shown that this EPIK method can be an important tool for vulnerability assessment. In addition to that, the EPIK method is an easy to use tool, which delivers fast results [30]. Although it is important to verify the results of the EPIK method using tracer test, it is not always feasible to obtain such measurements. In individual cases, adaptations regarding the local test site have to be made, which was observed in the study of Moreno-Gómez et al. [12], Momejian et al. [33] and Loborec et al. [14].
3. Case Study
The study area of this research is located in the Epirus Region, NW Greece, and is presented in Figure 1. The village of Perivleptos is displaced within the study area. It is part of the Mitsikeli karst system [38], and hence we refer to the system as the Perivleptos karst aquifer. The protection of this part of the karst aquifer is crucially important due to the presence of the two biggest bottled water companies in Greece. The study area enfolds around 10 km2 and is located in a distance approximately 15 km north of the city of Ioannina. The test site borders to the Mitsikeli Mountain Plateau in the northeast with elevations between 600 m and 1461 m, while in the southwest of the study area the elevation is ranging between 480 m and 600 m above mean sea level. The present slope ranges from 0.02% to 71.36%.
According to the Köppen and Geiger classification, the climate of Greece is a Mediterranean climate with mild and rainy winters and warm, dry summers [39]. The winter period lasts from October until the end of March, whereas the summer months last from April until September. The lowest mean temperature is 4.7 °C in January, and the highest is 24.8 °C in July. The annual mean temperature is 14.3 °C [39]. Rainfall in Greece occurs mainly during the winter months between October and the end of March. During the summer months, rainfall events are rare. Rainfall mainly occurs in intervals with rapid rain or in combination with thunderstorms [40].
3.1. Land Use
The land use map of the study area was created with ArcGIS and is based on the Corine Land Cover [41] and updated using satellite images and field observations. It consists mostly of vegetated areas with large parts of forest cover. More precisely the land cover is composed of eight different items, and can be divided into three major groups.
First, there are urban units, used for industrial and commercial use. These areas are located especially in the southern area of the study area. They are depicted around the village of Perivleptos covering an area of 0.69 km2. The second group contains agricultural land as well as areas with complex cultivation patterns. This covers an area of 2.57 km2. There has to be mentioned that due to the high number of agriculturally used areas in between the urban areas around Perivleptos, a very strict distinction is not possible. The third group enfolds an area of 5.49 km2 and includes large areas of broad-leaved and mixed forests, as well as sclerophyllous plants, mostly in the northern part of the study area. In higher altitudes, between agricultural areas and forests, there is an area of natural grasslands, covering an area of 1.03 km2. In conclusion, the overall land use of the study area is pictured in Figure 2.
3.2. Geology
In Greece, around 35% of the land is covered by carbonate rocks [42]. Eighty percent of them are developed within sedimentary rocks (limestones and dolomites), mainly in the regions of Western Greece, Epirus, Peloponnese and Crete Island [43]. Carbonate sedimentary rocks in Greece are said to date back to the Mesozoic Era, 252–66 million years ago, while metamorphic rocks are from the Paleozoic–Mesozoic Era [6,44]. The research area is primarily covered with carbonate rocks (limestone) in the mountainous zone and with superficial formations in the flat area around Perivleptos town (Figure 3). More precise, the geologic formations in the study area consist of Posidonian schists and limestones belonging to the Ionian tectonic zone.
4. Methodology
In order to perform pollution risk assessment, vulnerability as well as hazard assessment have to be performed in advance. The whole procedure is displayed in the flowchart in Figure 4. Firstly, the four parameters have to be determined to apply the Epikarst, Protective Cover, Infiltration Conditions and Degree of Karstic Network Development (EPIK) method.
Therefore, each parameter is assigned with category values, ranging from 1–3 or 1–4. For the evaluation of the four parameters of the EPIK method, various tools can be used besides.
In this case study, geomorphological maps were used in order to determine the Epikarst parameter (E). Remote sensing and aerial photography can be used for further investigation, as well as field investigation [46]. Additionally, hydrogeophysical methods are useful and essential for the Epikarst determination and karst aquifer structure [47]. For the definition of the P factor, the present soil, as well as geological formations covering the karst aquifer, are taken into account. Due to its practicability, only the thickness of the protective cover is considered.
Therefore, geological maps in combination with satellite pictures were used, based on existing data [38]. The I and K parameters were determined with the help of ArcGIS, more precise, digital elevation and slope models were used, based on the data available from the study of Voudouris et al. [48] and Nikolaou [38]. The determination of the K parameter is usually based on direct identification through the presence of caves or swallow holes. In this case study, further indirect methods, based on flow hydrograph analysis, tracer tests, as well as water quality examination, had to be used [38].
Subsequently, ArcGIS Software was utilized for the preparation of single parameter maps (Figure 5). Accordingly, to its protective function, the parameters are weighted, and last of all, added up obtaining the values for the four parameters [11].
The following Equation (1) describes the process for calculating the protection index F:
The indices, α = 3, β = 1, γ = 3 and δ = 2 are determined by Doerfliger and Zwahlen [11] and represent the weighting coefficients for each parameter. The indices Ei, Pj, Ik, and Ki represent the ratings of each parameter. The vulnerability values range from 9–34 and are ranked in four classes.
Low values of the protection index F signify a higher vulnerability of the karst aquifer [11,27]. Following Equation (1), and by using raster calculator in GIS, the vulnerability map was created (Figure 6). Additionally, a single parameter sensitivity analysis was implemented [49]. The sensitivity analysis is a dynamic tool that helps the analyst to judge the significance of subjectivity components and provides essential information on the influence of the weights of each parameter. The sensitivity analysis performed according to Equation 2 [49] using raster calculator within the toolbox of ArcGIS, is as follows:
where:
W = [(Pr × Pw)/V] × 100
- W = the effective weight of each parameter (%)
- Pr = the parameter’s rating
- Pw = the parameter’s weight
- V = the aggregated value of the applied index.
Subsequent to the validation of the parameters and the creation of the final vulnerability map, the hazard map was prepared. The hazard map in this context describes the potential threat of pollution and was produced with ArcGIS by taking Corine land use data and possible pollution sources into account. More detailed, the hazard map was adapted in ArcGIS, according to the present pollution sources mentioned in Table 1.
The pollution risk map depicts the areas in which it is most likely that groundwater will be polluted, caused by human activities. The risk is very high, where high vulnerable zones and dangerous hazards come together [24]. For this case study, the risk map was evaluated by overlaying the vulnerability and hazard map, following Equation (3) [6].
5. Results
The following Figure 5 displays the distribution of the single parameters. The Epikarst (E) and Infiltration parameter (I) are very important for the resulting vulnerability map, and therefore their theoretical weight is three times the weight of the K parameter (Karst network) and 1.5 times the weight of the P parameter (Protective cover). As can be seen from the Figure 5 a high percentage of the area is covered by high epikarst values. In addition to that, the same area is affected by little to non-protective cover, which results in high vulnerability (Figure 6). A similar distribution is to be seen for karst development. Infiltration is high in the northern area of the test site, where most forest-covered areas occur. This leads to a low vulnerability and is displayed by green color in the specific parameter map.
Following Equation (1) the initial vulnerability assessment revealed 71% of very high vulnerability in the study area. High and moderate vulnerability occurs mainly in the northern territory of the test site (18% and 0.33%, respectively). Only in the upper part and close to the lower border of the test site, low vulnerability occurs (11%). Very low vulnerability appears in neglecting small parts in the study area (Figure 6).
In order to analyze the significance of each parameter and to verify the actual weight of the input parameters, an additional sensitivity analysis was implemented and used for the preparation of an additional validated vulnerability map. Validation in this context means the verification of input parameters. The results of the sensitivity analysis are summarized in Table 2. In this table the statistical results of the single parameter sensitivity analysis are presented. The sensitivity analysis overcomes the subjectivity of the used data, and hence increases the reliability of the method. The weights of each parameter are replaced from the mean values of the sensitivity analysis and thus, the model presents a more validated vulnerability map. For the vulnerability assessment, the revised parameters are displayed in Figure 7.
The assessment of the validated vulnerability map showed that 22.6% of the total area is very highly vulnerable to groundwater pollution. In contrary to the initial vulnerability map, where the largest part contained very high vulnerability (71.04%), the validated parameters lead to a smaller area containing very high susceptibility (22.60%). The largest part within the validated map is highly vulnerable (58.8%), in contrary to the 17.47% of the initial map. Only 0.5% of the total area is moderately sensitive (0.3% in the initial map), whereas 18.1% of the area is low vulnerable against pollution (11.19% respectively).
Comparing the average effective weight of the analysis with the theoretical weights of the EPIK parameters (Table 2), the Epikarst parameter (E) in this study is undervalued with 23.6% instead of 33.3%. On the contrary, the Infiltration parameter (I) is over weighted, with 49.3% to 33.3%. The influence of the Protective cover parameter (P) is only little less according to its theoretical weight (8.7% to 11.1%), as well as the Karst network (K) parameter (18.4% to 22.2% respectively). Comparing both vulnerability maps, the I-parameter presents the strongest influence, followed by the E-parameter. For the risk assessment, the validated vulnerability map was used in order to provide more reliable results.
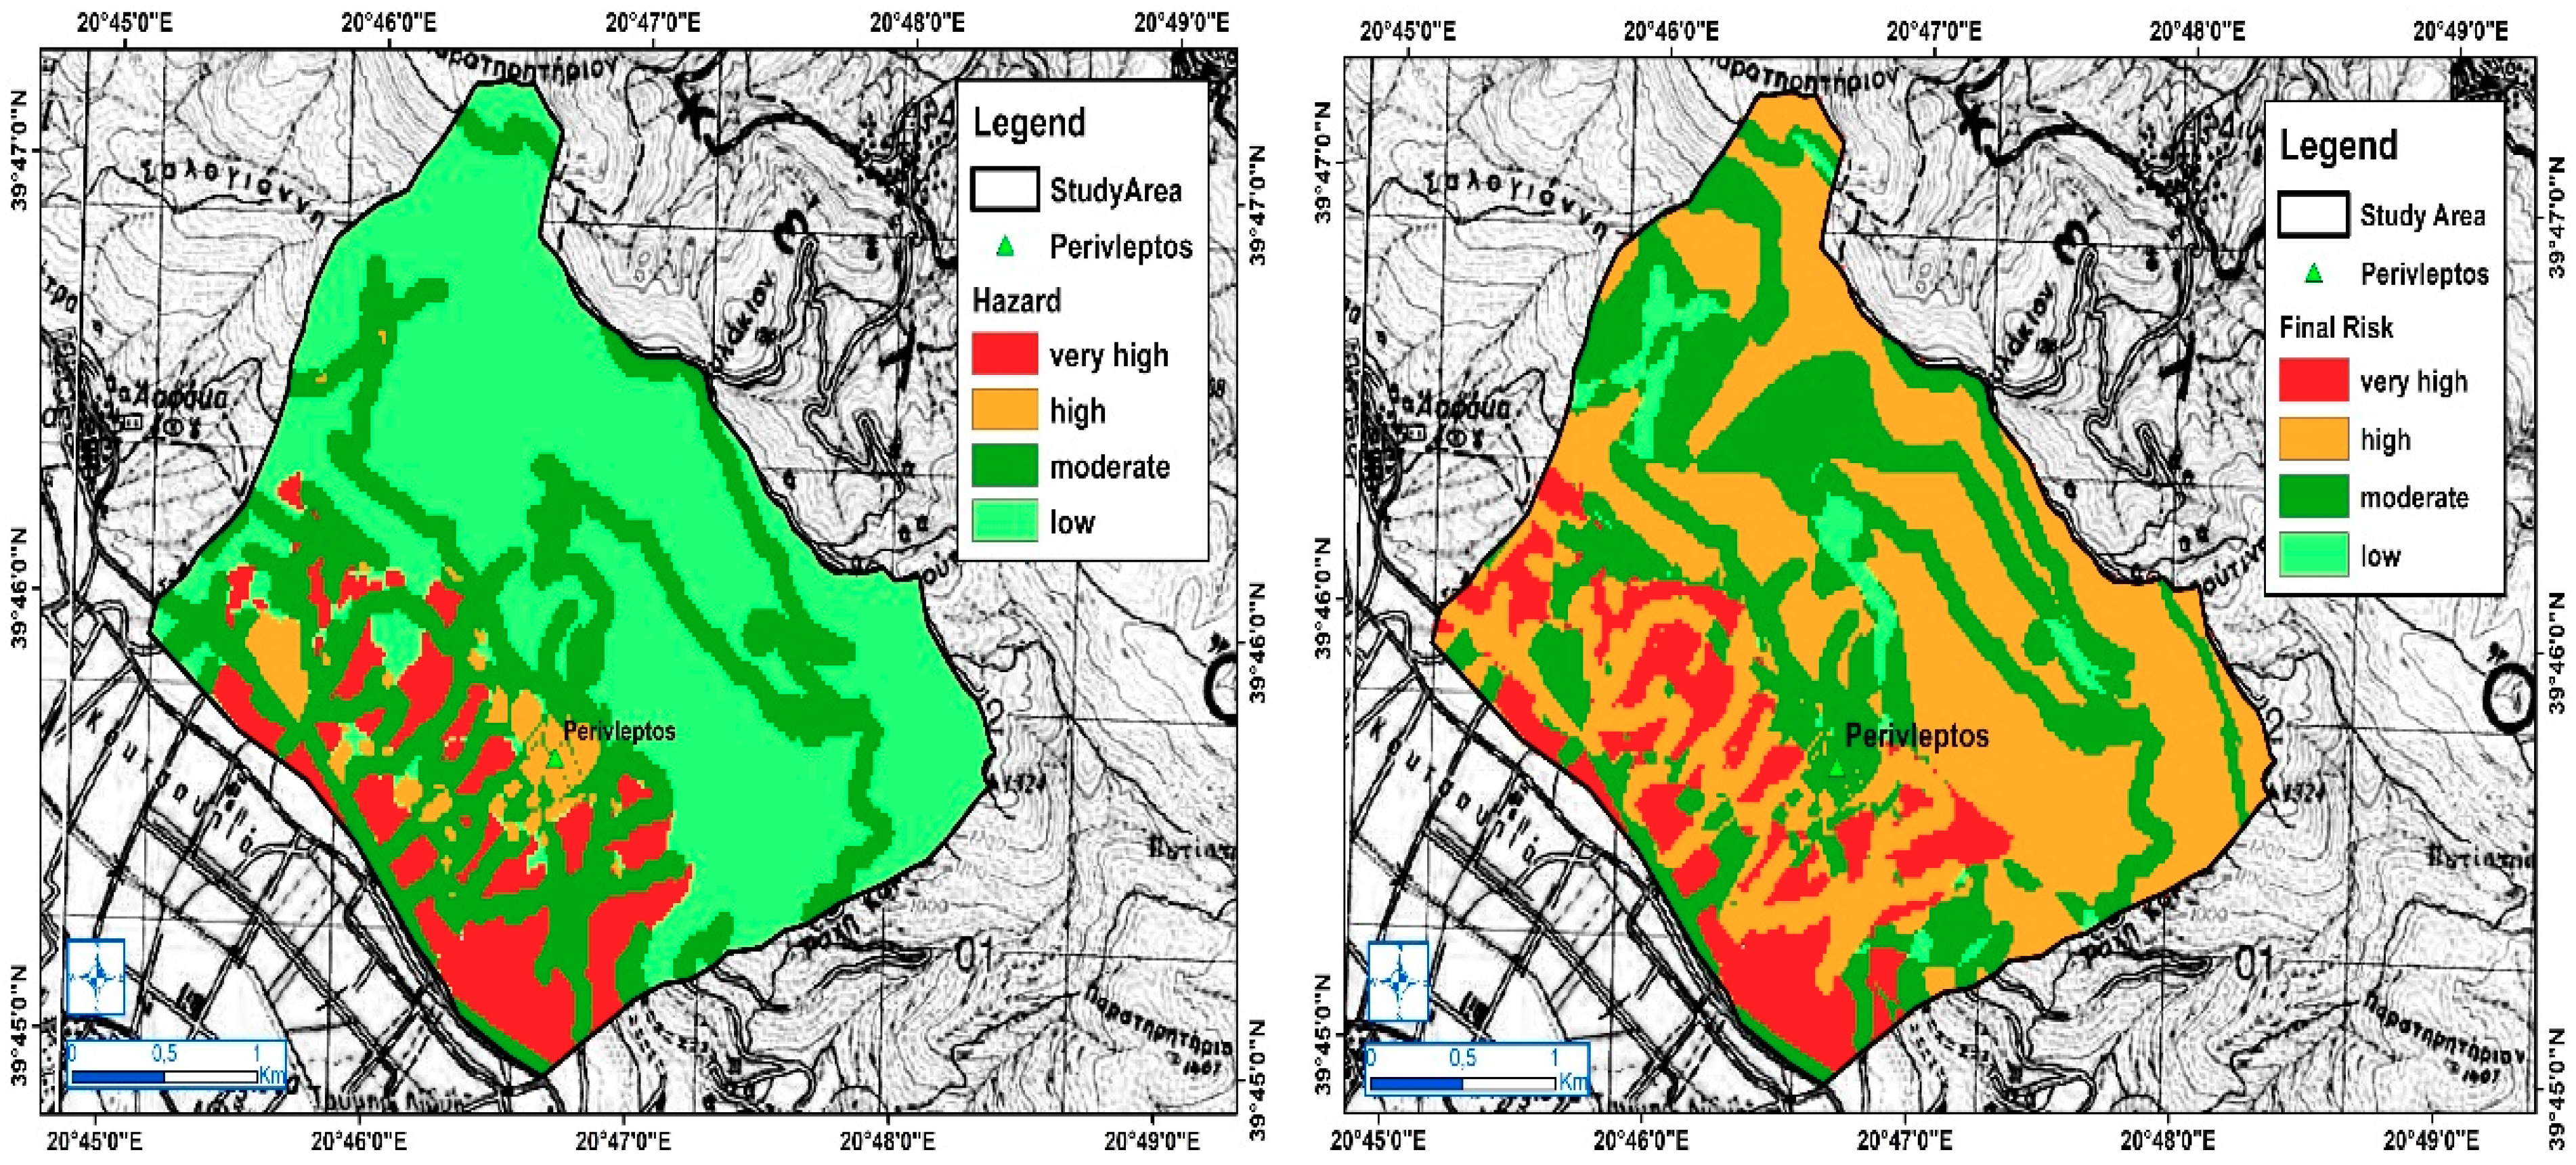
The hazard map presents high to very high danger in the urban area around Perivleptos village (3.48% and 10.67%, respectively). Urban and industrial land uses have an impact on the hazard calculation. As appears from the map (Figure 8), moderate hazard appears in the area of streets (33.1%) while low hazard occurs in forest-covered areas (52.68%).
Conclusively, the highest risk for pollution covers 12.9% and is very high around the urban and industrial used areas in the southern part of the test site. A high risk of contamination appears mainly in areas covered by agricultural activities (48%). Moderate risk is presented around the areas around urban and agricultural used regions and includes 35.6%, while low risk of contamination occurs in the northern part of the area, where mostly forest covers the region (3.56%). The distribution is summarized in Table 3.
6. Discussion
Vulnerability maps are simplifications of natural processes and constitute a valuable tool for groundwater protection [50]. However, the conceptualization of the hydrogeological regime is required for system characterization [51]. Therefore, the availability of significant data, its validation and interpretation, are of utmost importance. In order to access reliable data, especially for the Epikarst (E) and Protective Cover Parameter (P), many resources are necessary. Given the available time and financial scale of this study, there was no possibility to attend fieldwork validation for every parameter, but data has been provided by former studies in the area [38,48]. This might lead to deviations in this study. The EPIK method is a multi-parameter method [11], and thus it is based on rating parameters. With the use of only four parameters, it allows itself to be applied within areas where only limited data is available, and upon the condition that the examined area is a karst area.
Due to the fact that the EPIK method is designed for application in karst aquifers, it is developed and adapted specifically for these regions, but might be incongruous for porous or fissured rock aquifers [27]. In addition to that, the EPIK method is an easy to use tool, which delivers fast results [30]. This, however, could mislead one to a so-called “rapid assessment”, where users of the method do not consider wisely, which could result in serious errors [23]. Additionally, the EPIK method is based on weighing parameters. Therefore, subjectivity is inevitable, and can affect the results of the vulnerability assessment. This means the results have to be validated and interpreted carefully by the responsible researchers [22]. The here displayed results have been validated using the single parameter sensitivity analysis [49]. It is a dynamic tool that helps the analysts to estimate the significance of subjectivity components and provides essential information about the influence of weights for each parameter. The sensitivity analysis has been used in coastal aquifer vulnerability validation and in flood hazard area assessment by Kazakis et al. [27,52], in the delineation of zones for the application of Managed Aquifer Recharge (MAR) [53], as well as in groundwater risk index by Lezzaik et al. [54]. Clearly, the single sensitivity constitutes a robust method for model validation in environmental issues. It is worth mentioning that using lumped, deterministic and spatial modeling is essential to understand the function of a karst aquifer and is suggested to be coupled with the concept of groundwater vulnerability assessment [9].
As resulting from the literature overview in this work, tracer tests or more physically based approaches were used by various authors [23,26] in order to validate the results of the vulnerability assessment with the EPIK method. In addition, the application and results of the EPIK method were compared to other methods which were applied in the same test site [8,10,23,24,25,27,55,56]. However, in this case study, tracer tests have been used in order to determine certain parameters, but could not be implemented for results validation due to the location of the Perivleptos aquifer and its proximity to the boreholes of the water bottling company [38]. In comparison to other studies, this EPIK method has shown a stronger weighted vulnerability for poorly karstified environments compared to other methods in the publication of Gogu, Hallet and Dassargues [23]. In addition to that, the resulting vulnerability appeared very coherent (91% of moderate vulnerability).
The authors endorsed the combination with physically based methods in order to validate the results [23,26]. Another possibility was presented within the study of Kazakis et al. [27] where authors used a general approach in combination with more specific approaches for special types of aquifers, e.g., EPIK for karstic aquifers while the AVI method was applied for porous aquifers.
Turning to a more detailed consideration of EPIK parameters, the fluctuation of the groundwater table is not sufficiently fulfilled by the EPIK method, as was to observe in the study of Ravbar and Goldscheider [8], Baalousha [15] and Iván and Mádl-Szőnyi [26]. In addition to that, the lithology and thickness of the unsaturated zone, as well as the confining conditions, are neglected factors of the EPIK method [27]. Further disregarded factors of this EPIK method were highlighted comparing EPIK and COP methods by Hamdan et al. [28], where the quantity and temporal distribution of precipitation were not taken into account. Furthermore, the resulting vulnerability map showed a very rough distinction of vulnerability classes [28].
7. Conclusions
The EPIK method is commonly used for vulnerability assessment, not only in Europe, but also around the world. In this study, the EPIK method was applied for vulnerability assessment in the Perivleptos karst aquifer (NW Greece). Additionally, the EPIK method has been validated using the single parameter sensitivity analysis, and was complemented for groundwater pollution risk assessment. Results revealed high to very high vulnerability and moderate to very high pollution risk in the majority of the test site. The highly vulnerable zones are related to a high degree of karstification and the absence of soil cover. The overvalued Infiltration parameter counteracted to the other three parameters, which resulted in a lower vulnerability and risk for the area. Similarly, very high pollution risk zones of the aquifer correspond to high and very highly vulnerable zones overlying with agricultural, livestock, poultry farms and industrial activities.
The karst aquifer of Mitsikeli is characterized by high vulnerability and obviously its protection is of utmost importance. Hence, a set of protection measures is proposed, aiming to retain the system’s sustainability. These measures should include a monitoring program on groundwater quantity and quality, as well as the delineation of protection zones of the boreholes and springs which are exploited to cover the demands for domestic use. In addition, any change in land use, as well as the installation of poultry and livestock farms, must be accompanied by the necessary hydrogeological and environmental studies.
According to the literature overview, the EPIK method can be an important tool for vulnerability assessment, however, it should be applied wisely, and validated with the help of sensitivity analysis, simulation of systems function, statistical analysis, tracer tests or more physically-based approaches. As appearing in the literature overview, most studies have used the EPIK method in combination with other methods, such as DRASTIC, SINTACS, LeGrand, GOD, ISIS, AVI, KDI, COP, PI, VULK, the European as well as the Slovene approach and the PaPRIKa method. On balance, the application of the EPIK method can provide a general characterization of the karst aquifer vulnerability even in sites with a lack of data. However, result comparison using different methods or the validation of the single parameters using sensitivity analyses are valuable tools in order to increase the reliability of the vulnerability mapping and achieve sustainable management of the karst aquifer.
Supplementary Materials
The following are available online at https://www.mdpi.com/2076-3298/6/11/116/s1, Table S1: Literature Overview.
Author Contributions
A.V. contributed to the application of the method, data collection and preparation of the manuscript. N.K. contributed in the application of the method, field measurements and preparation of the manuscript. K.V. conceived the project idea, contributed to the application of the method, field measurements and preparation of the manuscript. S.B. contributed to the preparation and the review of the manuscript.
Funding
This research received no external funding.
Acknowledgments
This research was carried out in the framework of a research internship between the University of Applied Forest Sciences Rottenburg, Germany and the Aristotle University of Thessaloniki, Greece (Dept. of Geology). This internship was founded by the European Community Action Scheme for the Mobility of University Students (ERASMUS+). The preliminary results of this survey were presented at the 14th Conference of the Hellenic Hydrotechnical Association, Volos, 16–17 May 2019 (in Greek).
Conflicts of Interest
The authors declare no conflict of interest.
References
- Velis, M.; Conti, K.I.; Biermann, F. Groundwater and human development: Synergies and trade-offs within the context of the sustainable development goals. Sustain. Sci. 2017, 12, 1007–1017. [Google Scholar] [CrossRef] [PubMed]
- FAO’s director-general on how to feed the world in 2050. Popul. Dev. Rev. 2009, 35, 837–839. [CrossRef]
- UNESCO. World Water Assessment Programme, UNESCDOC The United Nations World Water Development Report 2016: Water and Jobs, Facts and Figures. Available online: https://unesdoc.unesco.org/ark:/48223/pf0000244041 (accessed on 27 June 2019).
- FAO. Transforming Food and Agriculture to Achieve the SDGs: 20 Interconnected Actions to Guide Decision-Makers, Technical Reference Document; FAO: Rome, Italy, 2018. [Google Scholar]
- Chen, Z.; Auler, A.S.; Bakalowicz, M.; Drew, D.; Griger, F.; Hartmann, J.; Jiang, G.; Moosdorf, N.; Richts, A.; Stevanovic, Z.; et al. The World Karst Aquifer Mapping project: Concept, mapping procedure and map of Europe. Hydrogeol. J. 2017, 25, 771–785. [Google Scholar] [CrossRef]
- Voudouris, K.; Kazakis, N. General characteristics and classification of karst aquifers in Greece: Reviev of the Bulgarian geological society. Geosciences 2018, 79, 159–160. [Google Scholar]
- Daskalaki, P.; Voudouris, K. Groundwater quality of porous aquifers in Greece: A synoptic review. Environ. Geol. 2008, 54, 505–513. [Google Scholar] [CrossRef]
- Ravbar, N.; Goldscheider, N. Comparative application of four methods of groundwater vulnerability mapping in a slovene karst catchment. Hydrogeol. J. 2009, 17, 725–733. [Google Scholar] [CrossRef]
- Kazakis, N.; Chalikakis, K.; Mazzilli, N.; Ollivier, C.; Manakos, A.; Voudouris, K. Management and research strategies of karst aquifers in Greece: Literature overview and exemplification based on hydrodynamic modelling and vulnerability assessment of a strategic karst aquifer. Sci. Total Environ. 2018, 643, 592–609. [Google Scholar] [CrossRef]
- Vías, J.M.; Andreo, B.; Perles, M.J.; Carrasco, F. A comparative study of four schemes for groundwater vulnerability mapping in a diffuse flow carbonate aquifer under Mediterranean climatic conditions. Environ. Geol. 2005, 47, 586–595. [Google Scholar] [CrossRef]
- Doerfliger, N.; Jeannin, P.-Y.; Zwahlen, F. Water vulnerability assessment in karst environments: A new method of defining protection areas using a multi-attribute approach and GIS tools (EPIK method). Environ. Geol. 1999, 39, 165–176. [Google Scholar] [CrossRef]
- Moreno-Gómez, M.; Pacheco, J.; Liedl, R.; Stefan, C. Evaluating the applicability of European karst vulnerability assessment methods to the Yucatan karst, Mexico. Environ. Earth Sci. 2018, 77, 51. [Google Scholar] [CrossRef]
- Margat, J. Vulnérabilité des Nappes d’eau Souterraine ala Pollution—BRGM-Publication 68 SGL 198 HYD.; BRGM: Orléans, France, 1968. (In French) [Google Scholar]
- Loborec, J.; Kapelj, S.; Dogančić, D.; Siročić, A.P. Assessment of Groundwater Vulnerability in Croatian Karstic Aquifer in Jadro and Žrnovnica Springs Catchment Area. In Hydrogeological and Environmental Investigations in Karst Systems; Andreo, B., Carrasco, F., Durán, J.J., Jiménez, P., LaMoreaux, J.W., Eds.; Springer: Berlin/Heidelberg, Germany, 2015; pp. 397–405. ISBN 978-3-642-17434-6. [Google Scholar]
- Baalousha, H.M. Groundwater vulnerability mapping of Qatar aquifers. J. Afr. Earth Sci. 2016, 124, 75–93. [Google Scholar] [CrossRef]
- Groundwater Quality Protection: A Guide for Water Utilities, Municipal Authorities, and Environment Agencies; Foster, S.S.D. (Ed.) World Bank: Washington, DC, USA, 2002; ISBN 978-0-8213-4951-9. [Google Scholar]
- Stempvoort, D.V.; Ewert, L.; Wassenaar, L. Aquifer vulnerability index: A Gis—Compatible method for groundwater vulnerability mapping. Can. Water Resour. J. Rev. Can. Ressour. Hydr. 1993, 18, 25–37. [Google Scholar] [CrossRef]
- Hölting, B.; Haertle, T.; Hohberger, K.-H.; Eckl, H.; Hahn, J. Konzept zur Ermittlung der Schutzfunktion der Grundwasserüberdeckung; Schweizerbart Science Publishers: Stuttgart, Germany, 1995; ISBN 978-3-510-96195-5. [Google Scholar]
- Civita, M.; De Regibus, C. Sperimentazione di alcune metodologie per la valutazione della vulnerabilità degli aquiferi. Q. Geol. Appl. Pitagora Bologna 1995, 3, 63–71. [Google Scholar]
- Von Hoyer, M.; Sofner, B. Groundwater Vulnerability Mapping in Carbonate (karst) Areas of Germany; Federal Institute for Geosciences Natural Resources: Hanover, Germany, 1998. [Google Scholar]
- Civita, M.; De Maio, M. SINTACS Un sistema parametrico per la valutazione e la cartografia per la valutazione della vulnerabilita degli acquiferi all’inquinamento. Metodologia e automatizzazione; Pitagora: Samos, Greece, 1997. [Google Scholar]
- Gogu, R.C.; Dassargues, A. Sensitivity analysis for the EPIK method of vulnerability assessment in a small karstic aquifer, southern Belgium. Hydrogeol. J. 2000, 8, 0337. [Google Scholar] [CrossRef]
- Gogu, R.C.; Hallet, V.; Dassargues, A. Comparison of aquifer vulnerability assessment techniques. Application to the Nblon river basin (Belgium). Environ. Geol. 2003, 44, 881–892. [Google Scholar] [CrossRef]
- Neukum, C.; Hötzl, H. Standardization of vulnerability maps. Environ. Geol. 2006, 51, 689–694. [Google Scholar] [CrossRef]
- Polemio, M.; Casarano, D.; Limoni, P.P. Karstic aquifer vulnerability assessment methods and results at a test site (Apulia, southern Italy). Nat. Hazards Earth Syst. Sci. 2009, 9, 1461–1470. [Google Scholar] [CrossRef]
- Iván, V.; Mádl-Szőnyi, J. State of the art of karst vulnerability assessment: Overview, evaluation and outlook. Environ. Earth Sci. 2017, 76, 13. [Google Scholar] [CrossRef]
- Kazakis, N.; Oikonomidis, D.; Voudouris, K.S. Groundwater vulnerability and pollution risk assessment with disparate models in karstic, porous, and fissured rock aquifers using remote sensing techniques and GIS in Anthemountas basin, Greece. Environ. Earth Sci. 2015, 74, 6199–6209. [Google Scholar] [CrossRef]
- Hamdan, I.; Margane, A.; Ptak, T.; Wiegand, B.; Sauter, M. Groundwater vulnerability assessment for the karst aquifer of Tanour and Rasoun springs catchment area (NW-Jordan) using COP and EPIK intrinsic methods. Environ. Earth Sci. 2016, 75, 340. [Google Scholar] [CrossRef]
- Jakada, H.; Chen, Z.; Luo, Z.; Zhou, H.; Luo, M.; Ibrahim, A.; Tanko, N. Coupling intrinsic vulnerability mapping and tracer test for source vulnerability and risk assessment in a karst catchment based on EPIK method: A case study for the Xingshan County, Southern China. Arab. J. Sci. Eng. 2019, 44, 377–389. [Google Scholar] [CrossRef]
- Lenhare, B.D.; Sallun Filho, W. Application of EPIK and KDI methods for identification and evaluation of karst vulnerability at Intervales State Park and surrounding region (Southeastern Brazil). Carbonates Evaporites 2019, 34, 175–187. [Google Scholar] [CrossRef]
- Pereira, D.L.; Galvão, P.; Lucon, T.; Fujaco, M.A. Adapting the EPIK method to Brazilian Hydrogeological context of the São Miguel watershed to assess karstic aquifer vulnerability to contamination. J. South Am. Earth Sci. 2019, 90, 191–203. [Google Scholar] [CrossRef]
- Ollivier, C.; Chalikakis, K.; Mazzilli, N.; Kazakis, N.; Lecomte, Y.; Danquigny, C.; Emblanch, C. Challenges and limitations of karst aquifer vulnerability mapping based on the PaPRIKa method—Application to a large European karst aquifer (Fontaine de Vaucluse, France). Environments 2019, 6, 39. [Google Scholar] [CrossRef]
- Momejian, N.; Abou Najm, M.; Alameddine, I.; El-Fadel, M. Groundwater vulnerability modeling to assess seawater intrusion: A methodological comparison with geospatial interpolation. Water Resour. Manag. 2019, 33, 1039–1052. [Google Scholar] [CrossRef]
- Petelet-Giraud, E.; Dörfliger, N.; Crochet, P. RISKE: Méthode d’évaluation multicritère de la vulnérabilité des aquifères karstiques. Application aux systèmes des Fontanilles et Cent-Fonts (Hérault, Sud de la France). Hydrogéologie 2000, 4, 71–88. [Google Scholar]
- Plagnes, V.; Théry, S.; Fontaine, L.; Bakalowicz, M.; Dörfliger, N. Karst vulnerability mapping: Improvement of the RISKE method. KARST 2005. Water Resour. Environ. Probl. Karst 2005, 14–19. [Google Scholar]
- Koutsi, R.; Stournaras, G. Groundwater vulnerability assessment in the Loussi polje area, N Peloponessus: The PRESK method. In Advances in the Research of Aquatic Environment; Springer: Berlin/Heidelberg, Germany, 2011; pp. 335–342. [Google Scholar]
- Younos, T.; Schreiber, M.; Kosič Ficco, K. Karst Water Environment; Springer International Publishing: Cham, Switzerland, 2019; Volume 68, ISBN 978-3-319-77367-4. [Google Scholar]
- Nikolaou, E. Hydrogeological Study of Epirus Water Destrict, Unpublished Report; Institute of Geology and Mineral Exploration (IGME): Preveza, Greece, 2010. [Google Scholar]
- Hellenic National Meteorological Service. Climatic Data for Selected Stations in Greece—Ioannina. Available online: http://www.hnms.gr/emy/chart/climatology/climatogy_temperature?zgdchart_runtime_ytitle=Temperature+%28C%29&zgdchart_runtime_title=Ioannina&language=en&dr_city=Ioannina (accessed on 28 June 2019).
- Hellenic National Meteorological Service. The Climate of Greece. Available online: http://www.hnms.gr/emy/en/climatology/climatology (accessed on 28 June 2019).
- Forslund, L. CLC 2018—Copernicus Land Monitoring Service. Available online: https://land.copernicus.eu/pan-european/corine-land-cover/clc2018 (accessed on 11 September 2019).
- Lambrakis, N.; Marinos, P. The salinisation of coastal aquifers in Greece; a general review. Proc. Coast. Aquifers Intrusion Technol. Mediterr. Ctries 2003, 8, 251–263. [Google Scholar]
- The Main Coastal Karstic Aquifers of Southern Europe: A Contribution by Members of the COST-621 Action’ groundwater Management of Coastal Karstic Aquifers; Calaforra, J.M. (Ed.) EUR Environment; Office for Official Publications of the European Communities: Luxembourg, 2004; Volume 20911, ISBN 92-894-6413-5. [Google Scholar]
- Gradstein, F.M.; Ogg, J.G.; Hilgen, F.J. On the geologic time scale. Newsl. Stratigr. 2012, 45, 171–188. [Google Scholar] [CrossRef]
- Institute of Geology & Mineral Exploration. Geoportal. Available online: http://portal.igme.gr/index.php/en/ (accessed on 14 September 2019).
- Doerfliger, N.; Zwahlen, F. Practical Guide, Groundwater Vulnerability Mapping in Karstic Regions (EPIK): Applications to Groundwater Protection Zones; Swiss Agency for the Environment, Forests and Landscape SAEFL: Bern, Switzerland, 1998; p. 56. [Google Scholar]
- Chalikakis, K.; Plagnes, V.; Guerin, R.; Valois, R.; Bosch, F.P. Contribution of geophysical methods to karst-system exploration: An overview. Hydrogeol. J. 2011, 19, 1169–1180. [Google Scholar] [CrossRef]
- Voudouris, K.; Kazakis, N.; Chalikakis, K. Hydrogeological Research and Determination of Protection Zones In the Wider Area of the Boreholes of VIKOS SA—Final Essay; Laboratory of Engineering Geology & Hydrogeology, Aristotle University of Thessaloniki: Thessaloniki, Greece, 2018; p. 63. (In Greek) [Google Scholar]
- Napolitano, P.; Fabbri, A.G. Single parameter sensitivity analysis for aquifer vulnerability assessment using DRASTIC and SINTACS. IAHS Publ. Wallingford 1996, 235, 559–566. [Google Scholar]
- Patrikaki, O.; Kazakis, N.; Voudouris, K. Vulnerability map: A useful tool for groundwater protection: An example from Mouriki basin, North Greece. Fresenius Environ. Bull. 2012, 21, 2516–2521. [Google Scholar]
- Manakos, A.; Ntona, M.; Kazakis, N.; Chalikakis, K. Enhanced characterization of the Krania–Elassona structure and functioning allogenic karst aquifer in central Greece. Geosciences 2018, 9, 15. [Google Scholar] [CrossRef]
- Kazakis, N.; Busico, G.; Colombani, N.; Mastrocicco, M.; Pavlou, A.; Voudouris, K. GALDIT-SUSI a modified method to account for surface water bodies in the assessment of aquifer vulnerability to seawater intrusion. J. Environ. Manag. 2019, 235, 257–265. [Google Scholar] [CrossRef] [PubMed]
- Kazakis, N. Delineation of suitable zones for the application of managed aquifer recharge (MAR) in coastal aquifers using quantitative parameters and the analytical hierarchy process. Water 2018, 10, 804. [Google Scholar] [CrossRef]
- Lezzaik, K.; Milewski, A.; Mullen, J. The groundwater risk index: Development and application in the Middle East and North Africa region. Sci. Total Environ. 2018, 628–629, 1149–1164. [Google Scholar] [CrossRef]
- Barrocu, G.; Muzzu, M.; Uras, G. Hydrogeology and vulnerability map (EPIK method) of the “Supramonte” karstic system, north-central Sardinia. Environ. Geol. 2006, 51, 701–706. [Google Scholar] [CrossRef]
- Delle Rose, M.; Parise, M.; Andriani, G.F. Evaluating the impact of quarrying on karst aquifers of Salento (southern Italy). Geol. Soc. Lond. Spec. Publ. 2007, 279, 153–171. [Google Scholar] [CrossRef]
Figure 1.
Test Site Perivleptos, NW Greece.

Figure 2.
Land use based on Corine Land Cover [41].
Figure 2.
Land use based on Corine Land Cover [41].

Figure 3.
Geological map of the study area (based on the Institute of Geology and Mineral Exploration (IGME) [45]).
Figure 3.
Geological map of the study area (based on the Institute of Geology and Mineral Exploration (IGME) [45]).

Figure 4.
Flowchart of the used processes for generating the vulnerability and pollution risk maps.

Figure 5.
Thematic maps of parameters E, P, I, K. (The Epikarst, Protective Cover, Infiltration Conditions and Degree of Karstic Network Development (EPIK) Method).
Figure 5.
Thematic maps of parameters E, P, I, K. (The Epikarst, Protective Cover, Infiltration Conditions and Degree of Karstic Network Development (EPIK) Method).

Figure 6.
Initial vulnerability map of the study area.

Figure 7.
Validated vulnerability map of the study area.

Figure 8.
Hazard and risk map of the study area.


Table 1.
Land use ratings for the Hazard map (adapted from Kazakis et al. [9]).
Table 1.
Land use ratings for the Hazard map (adapted from Kazakis et al. [9]).
| Land Uses | Hazard | Rating |
|---|---|---|
| Agriculture | Very High | 4 |
| Industrial or urban units | High | 3 |
| Streets | Moderate | 2 |
| Forests | Low | 1 |
Table 2.
Sensitivity analysis for Epikarst, Protective Cover, Infiltration Conditions and Degree of Karstic Network Development (EPIK) parameters.
Table 2.
Sensitivity analysis for Epikarst, Protective Cover, Infiltration Conditions and Degree of Karstic Network Development (EPIK) parameters.
| Parameter | Initial Weights Expressed in (%) | Minimum (%) | Maximum (%) | Standard Deviation (%) | Mean (%) |
|---|---|---|---|---|---|
| E | 33.3 | 13.6 | 42.8 | 9.7 | 23.6 |
| P | 11.1 | 3.2 | 23.1 | 5.9 | 8.7 |
| I | 33.3 | 23.1 | 66.7 | 18.4 | 49.3 |
| K | 22.2 | 11.1 | 46.2 | 8.33 | 18.4 |
Table 3.
Distribution of validated Vulnerability, Hazard and validated Risk in the study area.
| Vulnerability | Hazard | Risk | ||||||
|---|---|---|---|---|---|---|---|---|
| Area (km2) | Percent (%) | Area (km2) | Percent (%) | Area (km2) | Percent (%) | |||
| Very-high | 2.21 | 22.60 | Very-high | 1.04 | 10.63 | Very high | 1.26 | 12.86 |
| High | 5.76 | 58.83 | High | 0.34 | 3.48 | High | 4.70 | 48.00 |
| Moderate | 0.05 | 0.49 | Moderate | 3.23 | 32.97 | Moderate | 3.48 | 35.58 |
| Low | 1.77 | 18.07 | Low | 5.18 | 52.91 | Low | 0.35 | 3.56 |
© 2019 by the authors. Licensee MDPI, Basel, Switzerland. This article is an open access article distributed under the terms and conditions of the Creative Commons Attribution (CC BY) license (http://creativecommons.org/licenses/by/4.0/).
Share and Cite
MDPI and ACS Style
Vogelbacher, A.; Kazakis, N.; Voudouris, K.; Bold, S. Groundwater Vulnerability and Risk Assessment in A Karst Aquifer of Greece Using EPIK Method. Environments 2019, 6, 116. https://doi.org/10.3390/environments6110116
AMA Style
Vogelbacher A, Kazakis N, Voudouris K, Bold S. Groundwater Vulnerability and Risk Assessment in A Karst Aquifer of Greece Using EPIK Method. Environments. 2019; 6(11):116. https://doi.org/10.3390/environments6110116
Chicago/Turabian StyleVogelbacher, Anastasia, Nerantzis Kazakis, Konstantinos Voudouris, and Steffen Bold. 2019. "Groundwater Vulnerability and Risk Assessment in A Karst Aquifer of Greece Using EPIK Method" Environments 6, no. 11: 116. https://doi.org/10.3390/environments6110116
Note that from the first issue of 2016, this journal uses article numbers instead of page numbers. See further details here.