Article

Environmental Noise around Hospital Areas: A Case Study

by
David Montes-González
1,2,
Juan Miguel Barrigón-Morillas
1,*,
Valentín Gómez Escobar
1,
Rosendo Vílchez-Gómez
1,
Guillermo Rey-Gozalo
1,3,
Pedro Atanasio-Moraga
1 and
Juan Antonio Méndez-Sierra
1
1
Departamento de Física Aplicada, Escuela Politécnica, Universidad de Extremadura, Avda. de la Universidad s/n, 10003 Cáceres, Spain
2
ISISE, Departamento de Engenharia Civil, Universidade de Coimbra, Luis Reis dos Santos 290, 3030-790 Coimbra, Portugal
3
Facultad de Ciencias de la Salud, Universidad Autónoma de Chile, 5 Poniente 1670, 3460000 Talca, Chile
*
Author to whom correspondence should be addressed.
Environments 2019, 6(4), 41; https://doi.org/10.3390/environments6040041
Submission received: 19 March 2019 / Accepted: 27 March 2019 / Published: 1 April 2019
(This article belongs to the Special Issue New Solutions Mitigating Environmental Noise Pollution)

Abstract

:
Due to the particular characteristics of hospitals, these buildings are highly sensitive to environmental noise. However, they are usually located close or within urban agglomerations. Hence, hospitals are, in many cases, exposed to high levels of environmental noise. A study of one of the main hospitals in the Extremadura region (Spain) is presented here to allow a global assessment of the acoustic impact of outdoor sound sources. Both long- and short-term measurements were carried out, and a software model was developed. The measured values exceed the World Health Organisation reference value of 50 dBA for daytime and evening, and are even higher than the 55 dBA limit at which severe annoyance is generated. Taking into account the results obtained, the noise impact on this hospital is primarily influenced by three sound sources: road traffic, cooling towers of the hospital and the emergency helicopter. Their relative importance depends on the facade under consideration. It can therefore be concluded that the overall situation of the hospital needs to be improved. Thus, a series of solutions are proposed for a possible action plan based on interventions regarding the main sound sources and the location of the most sensitive areas to environmental noise.

1. Introduction

Health centres are considered to be noise-sensitive buildings due to the activities carried out in them and the presence of hospitalised patients [1]. This sensitivity to noise is taken into account by different international organisations that have proposed specific limiting values for these types of buildings. The World Health Organisation (WHO) suggested a daytime and nighttime threshold of 30 dBA (similar to the expected noise level in a library) for ward rooms in hospitals due to the health effects that can be produced by sleep disturbances and as low as possible for treatment rooms due to the interference with rest and recovery [2]. The United States Environmental Protection Agency (USEPA) recommends that day and night noise levels inside hospitals should not exceed 45 dBA [3]. Moreover, The WHO has established that 50 dBA can be considered a moderate daytime and evening annoyance in outdoor living areas; if the measured values exceed 55 dBA, serious annoyance is generated [2]. In this regard, USEPA has established a value of 55 dBA for day-night noise levels outside hospitals as a requirement to protect public health and the welfare of the population with an adequate safety margin [3]. In Spain, Real Decreto 1367/2007 [4] sets objectives in terms of the acoustic qualities of noise that are applicable to existing urbanised areas. In sectors with a predominance of land used for medical, educational and cultural purposes, which requires special protection against noise pollution, this regulation establishes values of 60 dBA during the day (Ld) and evening (Le) and 50 dBA at night (Ln) as thresholds. However, the sound levels recorded in studies in hospitals in various countries significantly exceed the recommendations made by the WHO and USEPA as well as local regulations [5,6].
In recent years, concern about noise pollution and its effects has been increasing. In this sense, more and more studies and research have been carried out on its effects and how to avoid them. It is well known that constant exposure to noise has very varied effects on people’s health [7]. These effects include sleep disturbances [8,9], annoyance [10,11], cardiovascular effects [12], learning impairment [13,14] or ischemic heart disease due to hypertension [15], among others. Correct prevention requires a good understanding, even in real time, of the noise levels in an affected area. To do this, it is increasingly normal to use a network of wireless sensors for noise monitoring [16,17], which represents a modern solution to comply with mandatory noise maps and action plans [18]. In the outdoor environment, acoustic barriers are the most widespread solution to mitigate noise produced by the main sources: road traffic [19], railway traffic [20,21], airports [22,23], industrial zones [24,25]. In this sense, very interesting developments are taking place in this field, such as sonic crystals used as acoustic barriers [26].
In the specific case of hospitals, many studies have shown that noise pollution in hospitals causes physico-psychological and social problems (i.e., stress, increased incidence of rehospitalisation, extended hospital stays, and increased dosages of pain medication [27], cardiovascular response, problems with speech intelligibility, irritability [28], increased secretion of gastric acid and mucosal blood flow [29], increased wound healing [30], sleep disturbance [31]). Moreover, elevated noise levels have been found to influence the stress on workers [32], influencing their job performance [33] and it may even be the cause of staff intention to change jobs [34]. Thus, noise affects both the well-being of the patient and the productivity and well-being of healthcare staff [35].
The main sources of noise in hospitals come from outside and arise from environmental noise as defined by the European directive [1]: road traffic (cars, ambulances), air traffic (emergency medical helicopters) or industrial equipment (cooling towers). Almost all of the respondents in a recent study regarded road traffic as a major source of noise [5]. Many hospitals are located on roads that experience high volumes of road traffic (e.g., in Curitiva, Brazil [36], Valladolid, Spain [37] or Plasencia, Spain [38]). The external facilities of the hospital are also a source of noise (heating and air conditioning, ventilation ducts, alarms, etc.) [6].
Despite evidence of high levels of noise and the effects that these have on hospital workers and patients, studies show that noise levels in hospitals have tended to increase in recent decades [39]. Technological advances in medicine have resulted in potentially harmful levels of sound pressure and unsuitable urban locations for some hospitals [36].
The present study arises because of this problematic acoustic situation in hospitals. It is carried out in the University Hospital of Badajoz outdoors (formerly known as Hospital Infanta Cristina), one of the main hospitals in the region of Extremadura, Spain. The purposes of this study are to evaluate the exterior acoustic environment of the hospital, compare the measured sound levels with international and national regulations, evaluate the main sources of sound and propose recommendations to reduce the noise levels from architectural and urban points of view. To achieve these purposes, several sampling measurements and in situ characterization are carried out. Additionally, trying to enrich the study, a complementary noise model of the environment is conducted. Based on the model, some proposals for the improvement of the environment have been tested, which would involve regulating traffic flow or using porous asphalts among others, as indicated in the conclusions section.

2. Materials and Methods

2.1. Description of the Study Area

Badajoz city has a population of 150,543 inhabitants [40], but this hospital also provides general healthcare services to the population living in the area around Badajoz (273,977 inhabitants) [41] in conjunction with two other public and two private hospitals. In this regard, it is important to note that it is considered the primary public hospital in the region of Extremadura (1,092,977 inhabitants). Thus, the number of potential patients is therefore quite high. In addition, there is a collaboration agreement with the Portuguese region of Alentejo, meaning that the potential number of patients is even greater.
Figure 1 shows an aerial view of the hospital and its surroundings. It is located on the outskirts of the city and there are no residential areas around it. Its architectural design has a complex structure; there are several rectangular buildings that rise to different heights, while the upper floor has a cross-shaped layout. The hospital is located close to one of the main avenues of the city (Elvas Avenue) and the campus of the University of Extremadura. Elvas Avenue is considered as a type 1 road according to the categorisation method developed by our Laboratory of Acoustics, in which all the streets of the city are assigned to a category in accordance with their use for connecting different sites of the city [42,43], and is about 100 m from the south facade of the hospital. The east facade is about 50 m from a street used for internal access to the hospital and for access to the School of Medicine of the University of Extremadura. It is also used as a car park and as an access to various parking areas. The west facade is oriented towards an unpaved area and the north facade towards a wide internal car park. Finally, bearing in mind the importance of this sound source, it is important to note that the hospital is equipped with a heliport, which is located on the southern facade of the building but also very close to the eastern facade.
According to the catalogue of hospitals in Extremadura [41], it currently has a total of 529 beds, and its functional dependence corresponds to Extremadura Health Service. Visiting hours in this hospital are from 4 pm to 8 pm, and visits are limited to two people per patient. Wards are distributed from the ground to the eighth floor and are located at an approximate distance of more than 100 m from the main traffic lanes.

2.2. Long-Term Measurements

Points LT-1, LT-2, LT-3 and LT-4 were selected for long-term (LT) measurements of noise (Figure 2). Each of these was located on one of the main facades of the University Hospital of Badajoz. At each of these points, measurements were performed over a two-week period. Table 1 gives the main characteristics of the sampling points and the sound sources that were expected to be most relevant in the measured sound levels, in the absence of the helicopter (which rarely flew over the hospital; that is, it does not fly over every day and if it does, it does not usually fly over more than once a day). To carry out these long-term measurements, 01dB OPER@ Class 1 data acquisition stations were employed.

2.3. Short-Term Measurements

A total of 12 points were chosen to carry out short-term (ST) measurements. Points ST-1, ST-2, ST-3 and ST-4 were the same as those used for long-term measurements, although in the case of short-term measurements the microphones were placed at a height of 1.5 m above the ground according to ISO 1996-2 standard [44,45,46,47]. These points were distributed in different areas of the University Hospital of Badajoz (Figure 2) in order to obtain an acoustic characterisation of the whole hospital (Table 2). Four samples of 15 min were taken at these measuring points during the day and evening, giving a total of 48 measurements of 15 min each. For this purpose, Brüel and Kjær 2250L and 2238 Class 1 sound-level meters and a Brüel and Kjær 4231 Class 1 calibrator were used.

2.4. Environmental Noise Modelling

As mentioned previously, an environmental noise propagation model of the hospital and its environment was done in order to complement the measurements carried out. In this regard, it is important to clarify that the helicopter was not considered in the noise model. Since the measurements carried out in this study are before the introduction of common noise assessment methods [48], the traffic flow was divided into only three categories (cars, heavy vehicles and motorcycles) instead of the five categories established by CNOSSOS-EU [49]. The French national standard ‘NMPB-Routes-96’ [50] and ‘NF S 31-133’ [51] were used for road traffic noise and ISO 9613-2 [52] as a general calculation standard [1]. CadnaA software v.4.6, from DataKustik, was used for predictive calculation and the recommendations of the Good Practice Guide [53] were taken into account.
When calculating reflections (only the first reflection was considered), the principles of the European Directive were followed. Meteorological conditions were configured as those stablished as default values in Toolkit 17 of the ‘Good Practice Guide for Strategic Noise Mapping and the Production of Associated Data on Noise Exposure’ report [53]. Finally, a mesh of 1 m × 1 m was chosen for the configuration of these calculations, since this was considered to be sufficiently representative of the dimensions of the area. The calculations were carried out at different heights from 1.5 m to 10 m above the ground, including 4 m as indicated in the European Directive.
To validate the noise propagation map, receivers were placed in the model at the same points as the measuring stations. Once all the elements had been inserted and the input data configured for the model, the reception levels at these points were calculated. The results were compared with those measured in situ to check the accuracy of the model. Finally, other scenarios were tested to assess their effectiveness in trying to reduce the noise levels to which the hospital is exposed.

3. Results

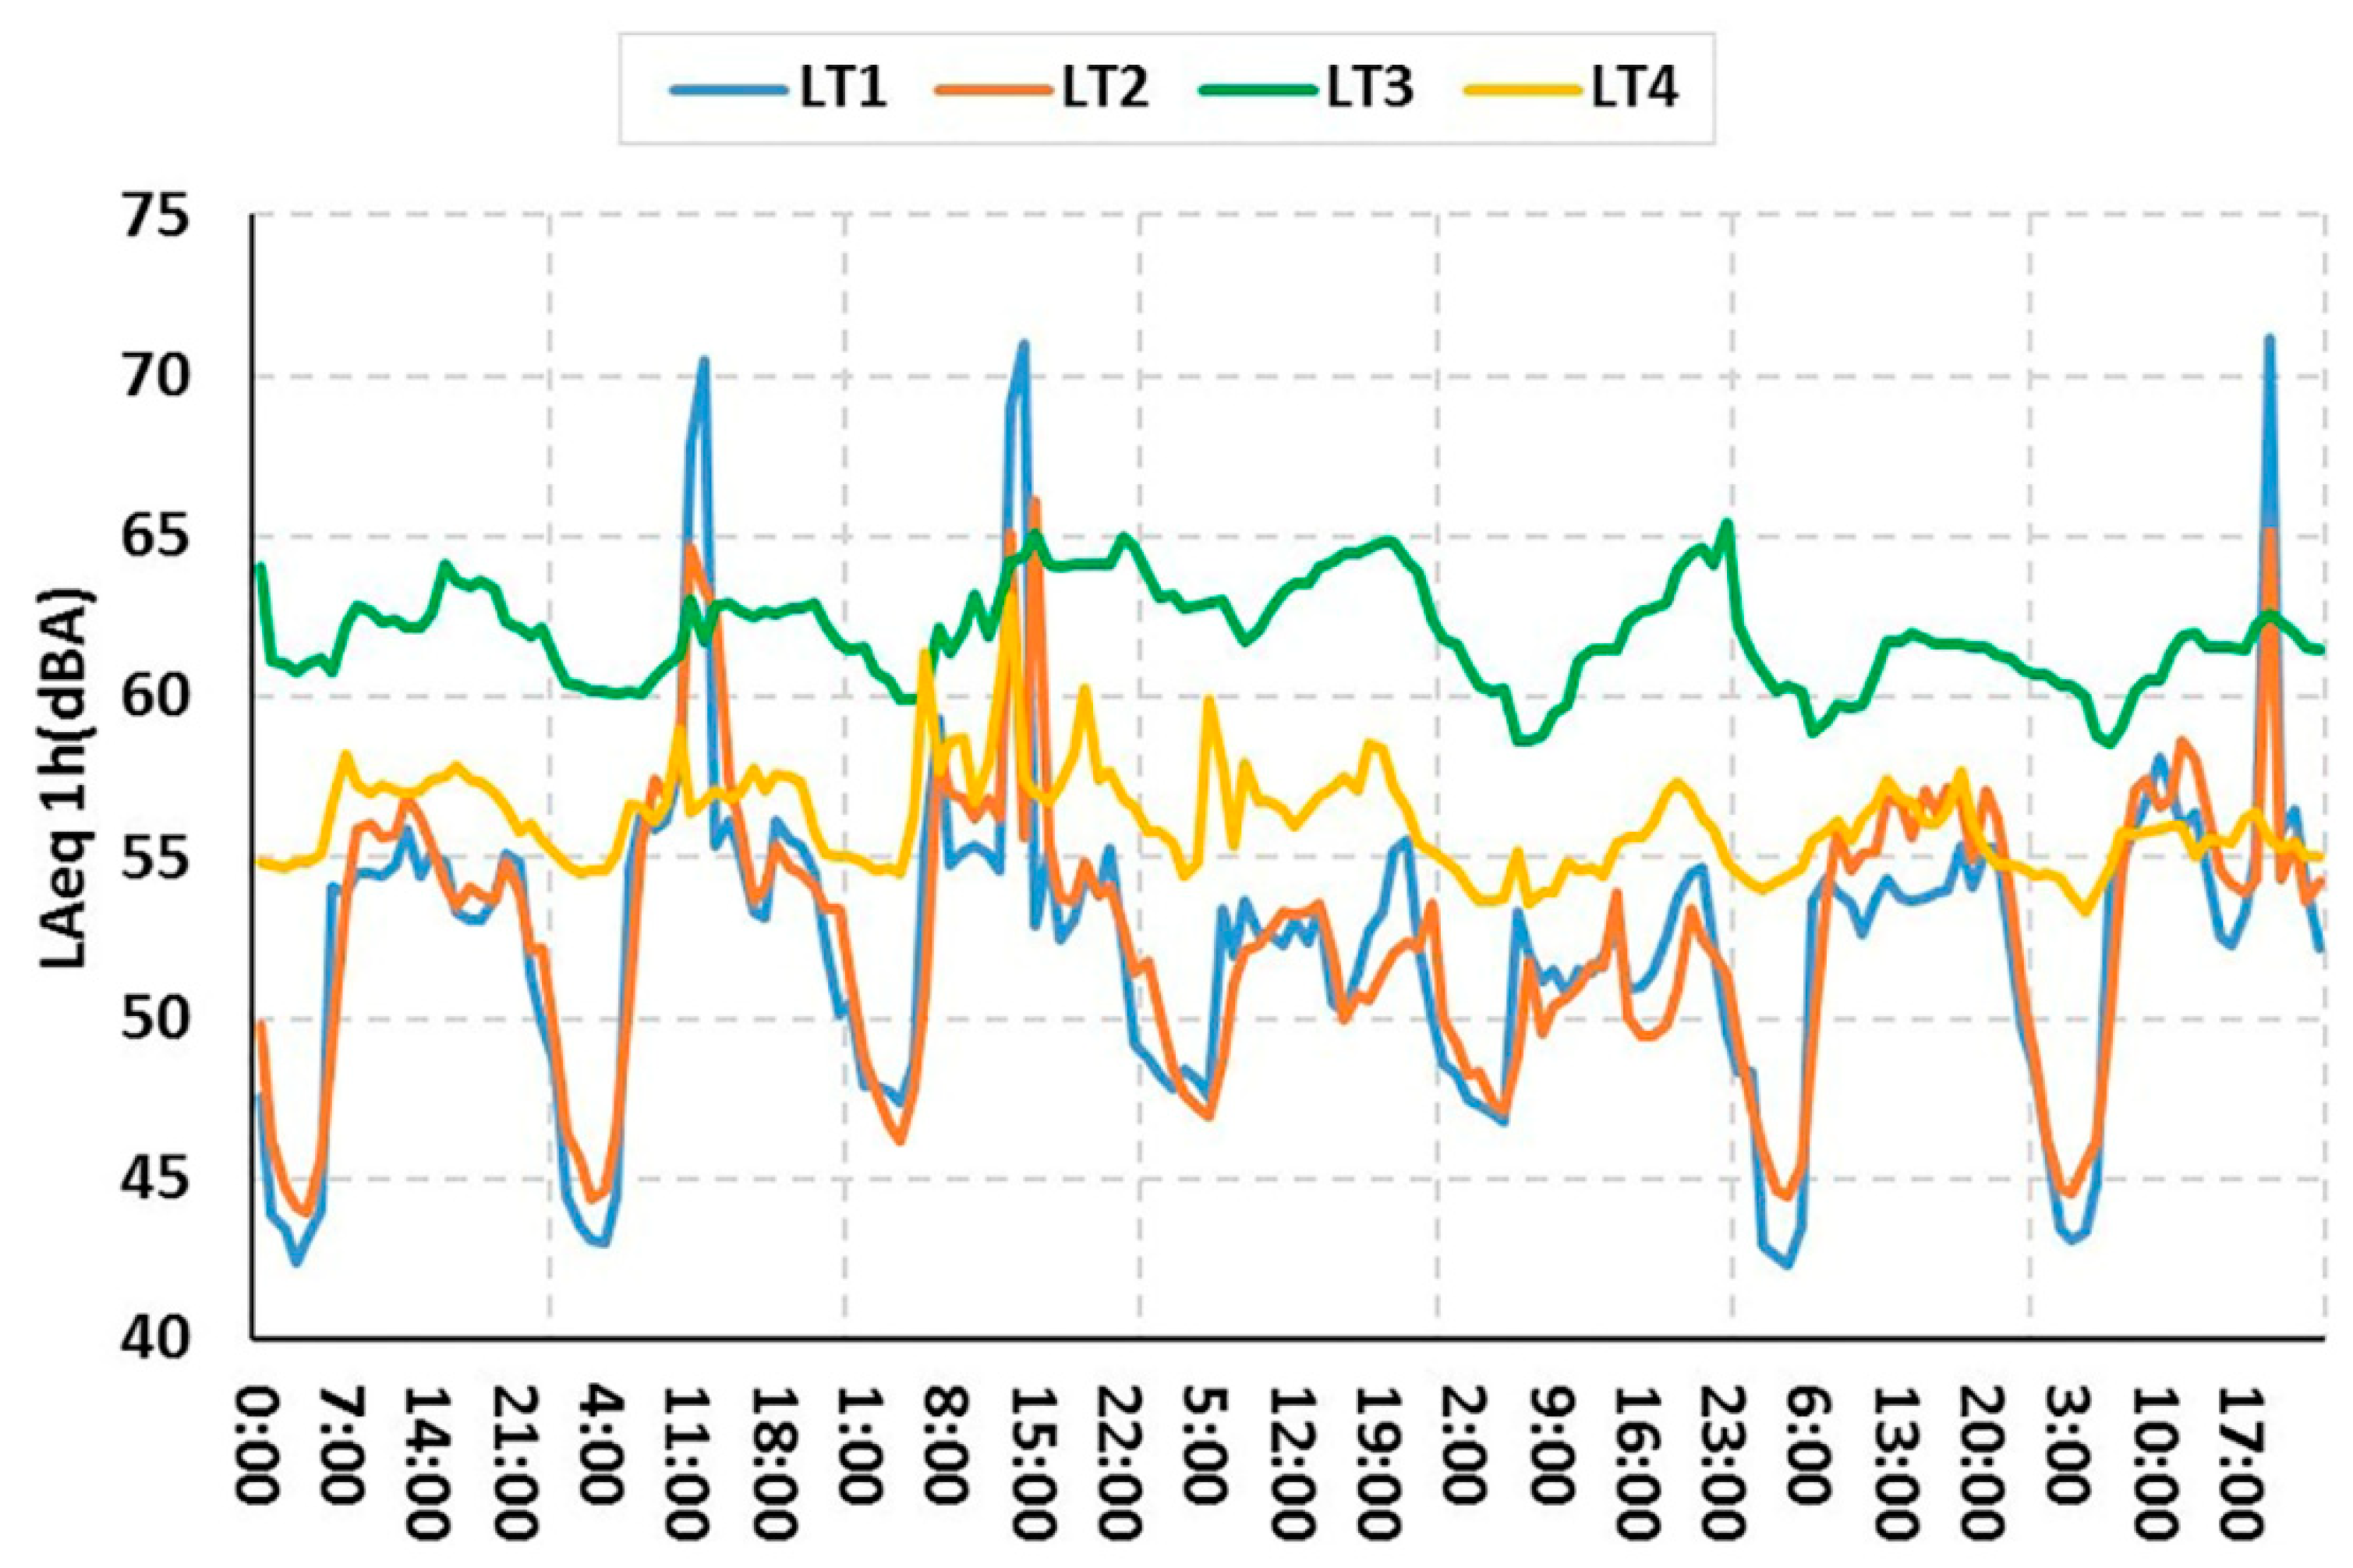
3.1. Long-Term Measurements

The methodology described in the previous section was used to carry out long-term measurements, and Figure 3 shows the values obtained for the different sound indicators at the four points located at the different facades of the University Hospital of Badajoz. The values include day (Ld), evening (Le), night (Ln) and day-evening-night (Lden) indices for working days (Mondays to Fridays), nonworking days (Saturdays and Sundays) and an overall figure.
From the results shown in Figure 3, it can be seen that the sound levels measured on nonworking days are lower than those measured on working days at points LT-1 (south facade) and LT-2 (east facade). This effect may be because these facades are quite exposed to road traffic noise, mainly from Elvas Avenue and other access roads. It is therefore quite common that the flow of vehicles decreases on nonworking days with respect to working days, and this is reflected in a reduction in the values measured for the different sound indicators [54]. The road traffic is not only due to hospital users. Near the hospital is the University of Extremadura campus and several warehouses. As usual, both the activity of the city and that of the hospital itself are reduced during the weekends. Naturally, this implies a reduction in traffic flow.
A similar trend is observed at point LT-4 (west facade), although in this case, the decrease in the values is lower. This may be because this facade is less exposed to traffic noise than the previous two points. However, it is partially affected by noise caused by the cooling towers located at the back of the hospital (Figure 1). At point LT-4, the microphone was placed at a height of 35 m, where there is almost no acoustic shielding from the building itself. Although there is a decrease in the levels measured on nonworking days compared to working days on the north facade (point LT-3), this is very slight. In this case, despite the fact that there is a parking area for vehicles close to the measuring point that entails significant transit of vehicles, the results seem to indicate that the influence of the noise generated by the cooling towers on the measured values of the sound indicators is of considerable relevance.
International references for assessing the impact of outside noise on the population at the University Hospital of Badajoz included those of the WHO, which has established that sound levels of 50 dBA and 55 dBA produce moderate and serious annoyance during the daytime and evening [2]. USEPA proposes a sound limit of 55 dBA over 24 h [3]. In connection with this topic, the European Noise Directive [1] was transposed into the national legislation of each of the member countries of the European Union. In Spain, Real Decreto 1367/2007 [4] establishes values of 60 dBA during the day (Ld) and evening (Le) and 50 dBA at night (Ln) as thresholds.
Figure 3 shows that in all three cases considered (working days, nonworking days and overall), the measured values exceed the WHO reference value of 50 dBA for daytime and evening, and are even higher than the 55 dBA limit at which severe annoyance is generated.
In terms of the objectives for acoustic quality set in Real Decreto 1367/2007 [4], it can be firstly observed that the measured values during the day and in the evening are mostly lower than 60 dBA, except at the point LT-3 (north facade), where this value is slightly exceeded. If the objective of 50 dBA for noise at night is then taken into account, it can be verified that at LT-1 (south facade) and LT-2 (east facade), the values are below this limit, while at LT-4 (west facade) and especially at LT-3 (north facade), the threshold established for zones of medical use is exceeded.
In order to provide more detailed information on the measured sound levels, Figure 4 shows the values for the equivalent sound level (LAeq) at each point during the first week, using an integration period of one hour.
In Figure 4, it can be seen that in the case of points LT-1 and LT-2 there are three very marked peaks, due to helicopter activities. Points LT-3 and LT-4 have high levels due to the close presence of cooling systems, causing a very high residual noise level.
As indicated above, the main source of noise detected is the 112 emergency service helicopter, the presence of which had a very significant effect on the average sound level. Its presence was detected on five occasions during the two weeks in which this study was carried out. The effect that the helicopter has had on the sound levels has been of great importance in the case of point LT-1, followed by point LT-2, although at this point, the effect was somewhat less. Its effect on the other two measuring points (LT-3 and LT-4) has not been of great importance due to its greater distance from the heliport, the take-off-landing trajectory and the presence of other sound sources close to these points, such as the cooling towers (Figure 1 and Figure 2).
After an analysis of the measured sound level profile with an integration time of 1 minute, the sound levels associated with the helicopter landing and take-off operations have been obtained and their relative importance at these points has been analysed. For this purpose, the measured Ld indicator and the calculated indicator (Ld CALC) were compared, substituting the levels associated with the presence of the helicopter for the average values of the day (Table 3).
Given the sound levels measured in these environments, the results obtained for the contributions associated with the operations of the 112 helicopter imply a high impact on the facades associated with the measurement points LT-1 and LT-2.
For point LT-1, the average contribution obtained is close to 8 dB. This implies that, on average during daylight hours, each intervention of this source involves an increase in the average acoustic energy of that upper facade by more than four times that which would exist due to the other sources. For point LT-2, the average contribution obtained is close to 4 dB. So that, in average daytime, each intervention of this source means at this point an increase in average acoustic energy greater than twice that due to other sources.
With regard to the influence of the presence of the cooling towers on the other two facades during daytime, the results of the measurements indicate that their influence is greater than that of the rest of the sound sources present in the surroundings. In particular, the LT-3, which is the closest to this hospital infrastructure (Figure 1 and Figure 2), is the one with the highest noise level, on average, both during the day and at night.

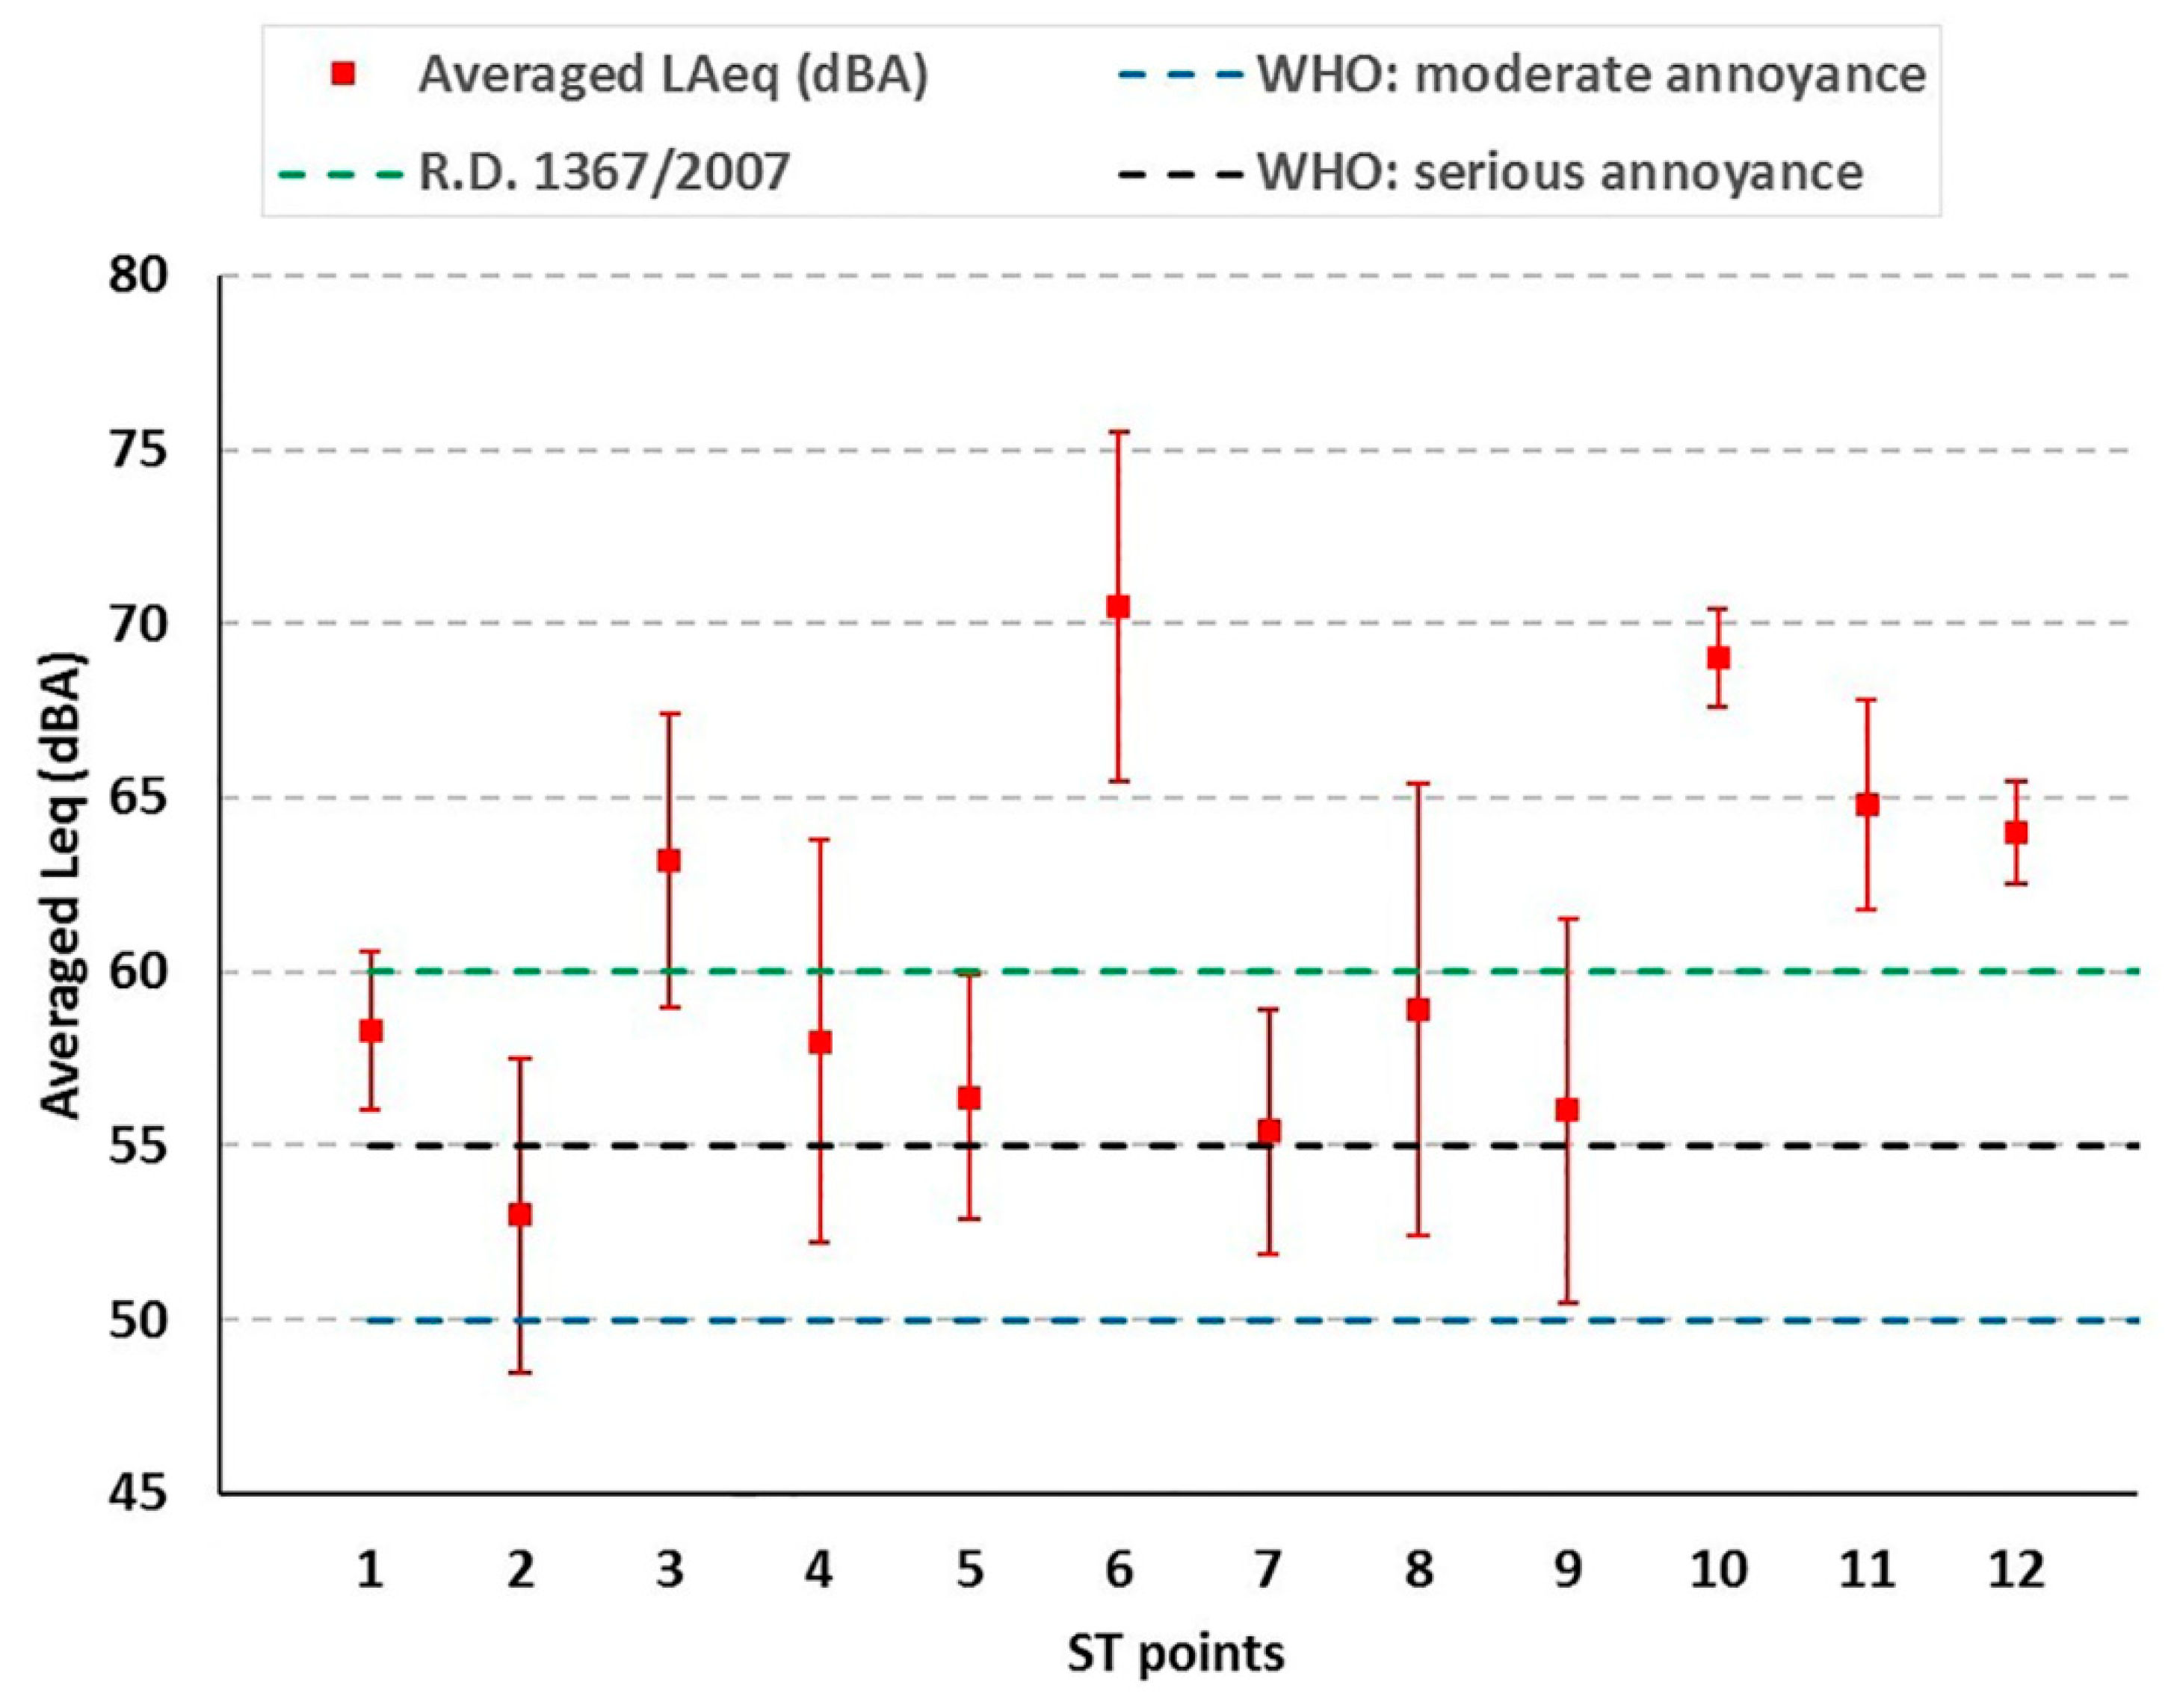
3.2. Short-Term Measurements

Taking the equivalent sound level (LAeq) as a reference acoustic indicator, Figure 5 shows the averaged values, together with the standard deviation for each of the 12 points (ST-1 to ST-12). This figure also shows the previously indicated reference values for which WHO estimates moderate and serious annoyance to the population due to environmental noise [2] and the values for the acoustic quality objectives established in Real Decreto 1367/2007 [4] during the day and evening for sectors with a predominance of land for medical use.
Firstly, it is important to note that no landing or take-off operations of the emergency helicopter at the heliport were registered during the short-term measurements. Nevertheless, Figure 5 shows that at 100% of the selected measuring points, the average sound levels exceeded the reference value of 50 dBA defined by the WHO for moderate annoyance during the day and evening [2]. For the 55 dBA threshold for severe annoyance, this percentage is only reduced to 92%. In an analogous way, it was verified that at 42% of the points, the value of 60 dBA established by Real Decreto 1367/2007 [4] as an objective for acoustic quality for the indicators Ld and Le in sectors of medical use is exceeded.
If these results are analysed taking into account the location of the measurement points (Figure 2), it can be seen that the points at which the highest values of the equivalent sound level were recorded were those located at the perimeter of the hospital (ST-10, ST-11 and ST-12) and near the cooling towers (ST-6). These results are mainly due to the proximity of the indicated points to sound sources such as road traffic and cooling towers, respectively.
The values obtained at the same points as the long-term measurements are analysed bearing in mind that in this case, the measurements were made at a height of 1.5 m above the ground. In the same way as for the results of the long-term measurements, it is observed that the northern facade (ST-3) receives the greatest impact of environmental noise, followed by the southern facade (ST-1). As indicated in the previous section, the main sound sources at these measurement points are the cooling towers and the traffic on Elvas Avenue, respectively. In this regard, it is interesting to note that the values measured at the east (ST-2) and west (ST-4) facades seem to decrease by a greater amount than at the south and north facades compared to the results for the long-term measurements during the day and evening. This effect may be due to the existence of acoustic shielding effects due to buildings and differences in ground heights that did not arise when microphones were placed at a higher height.

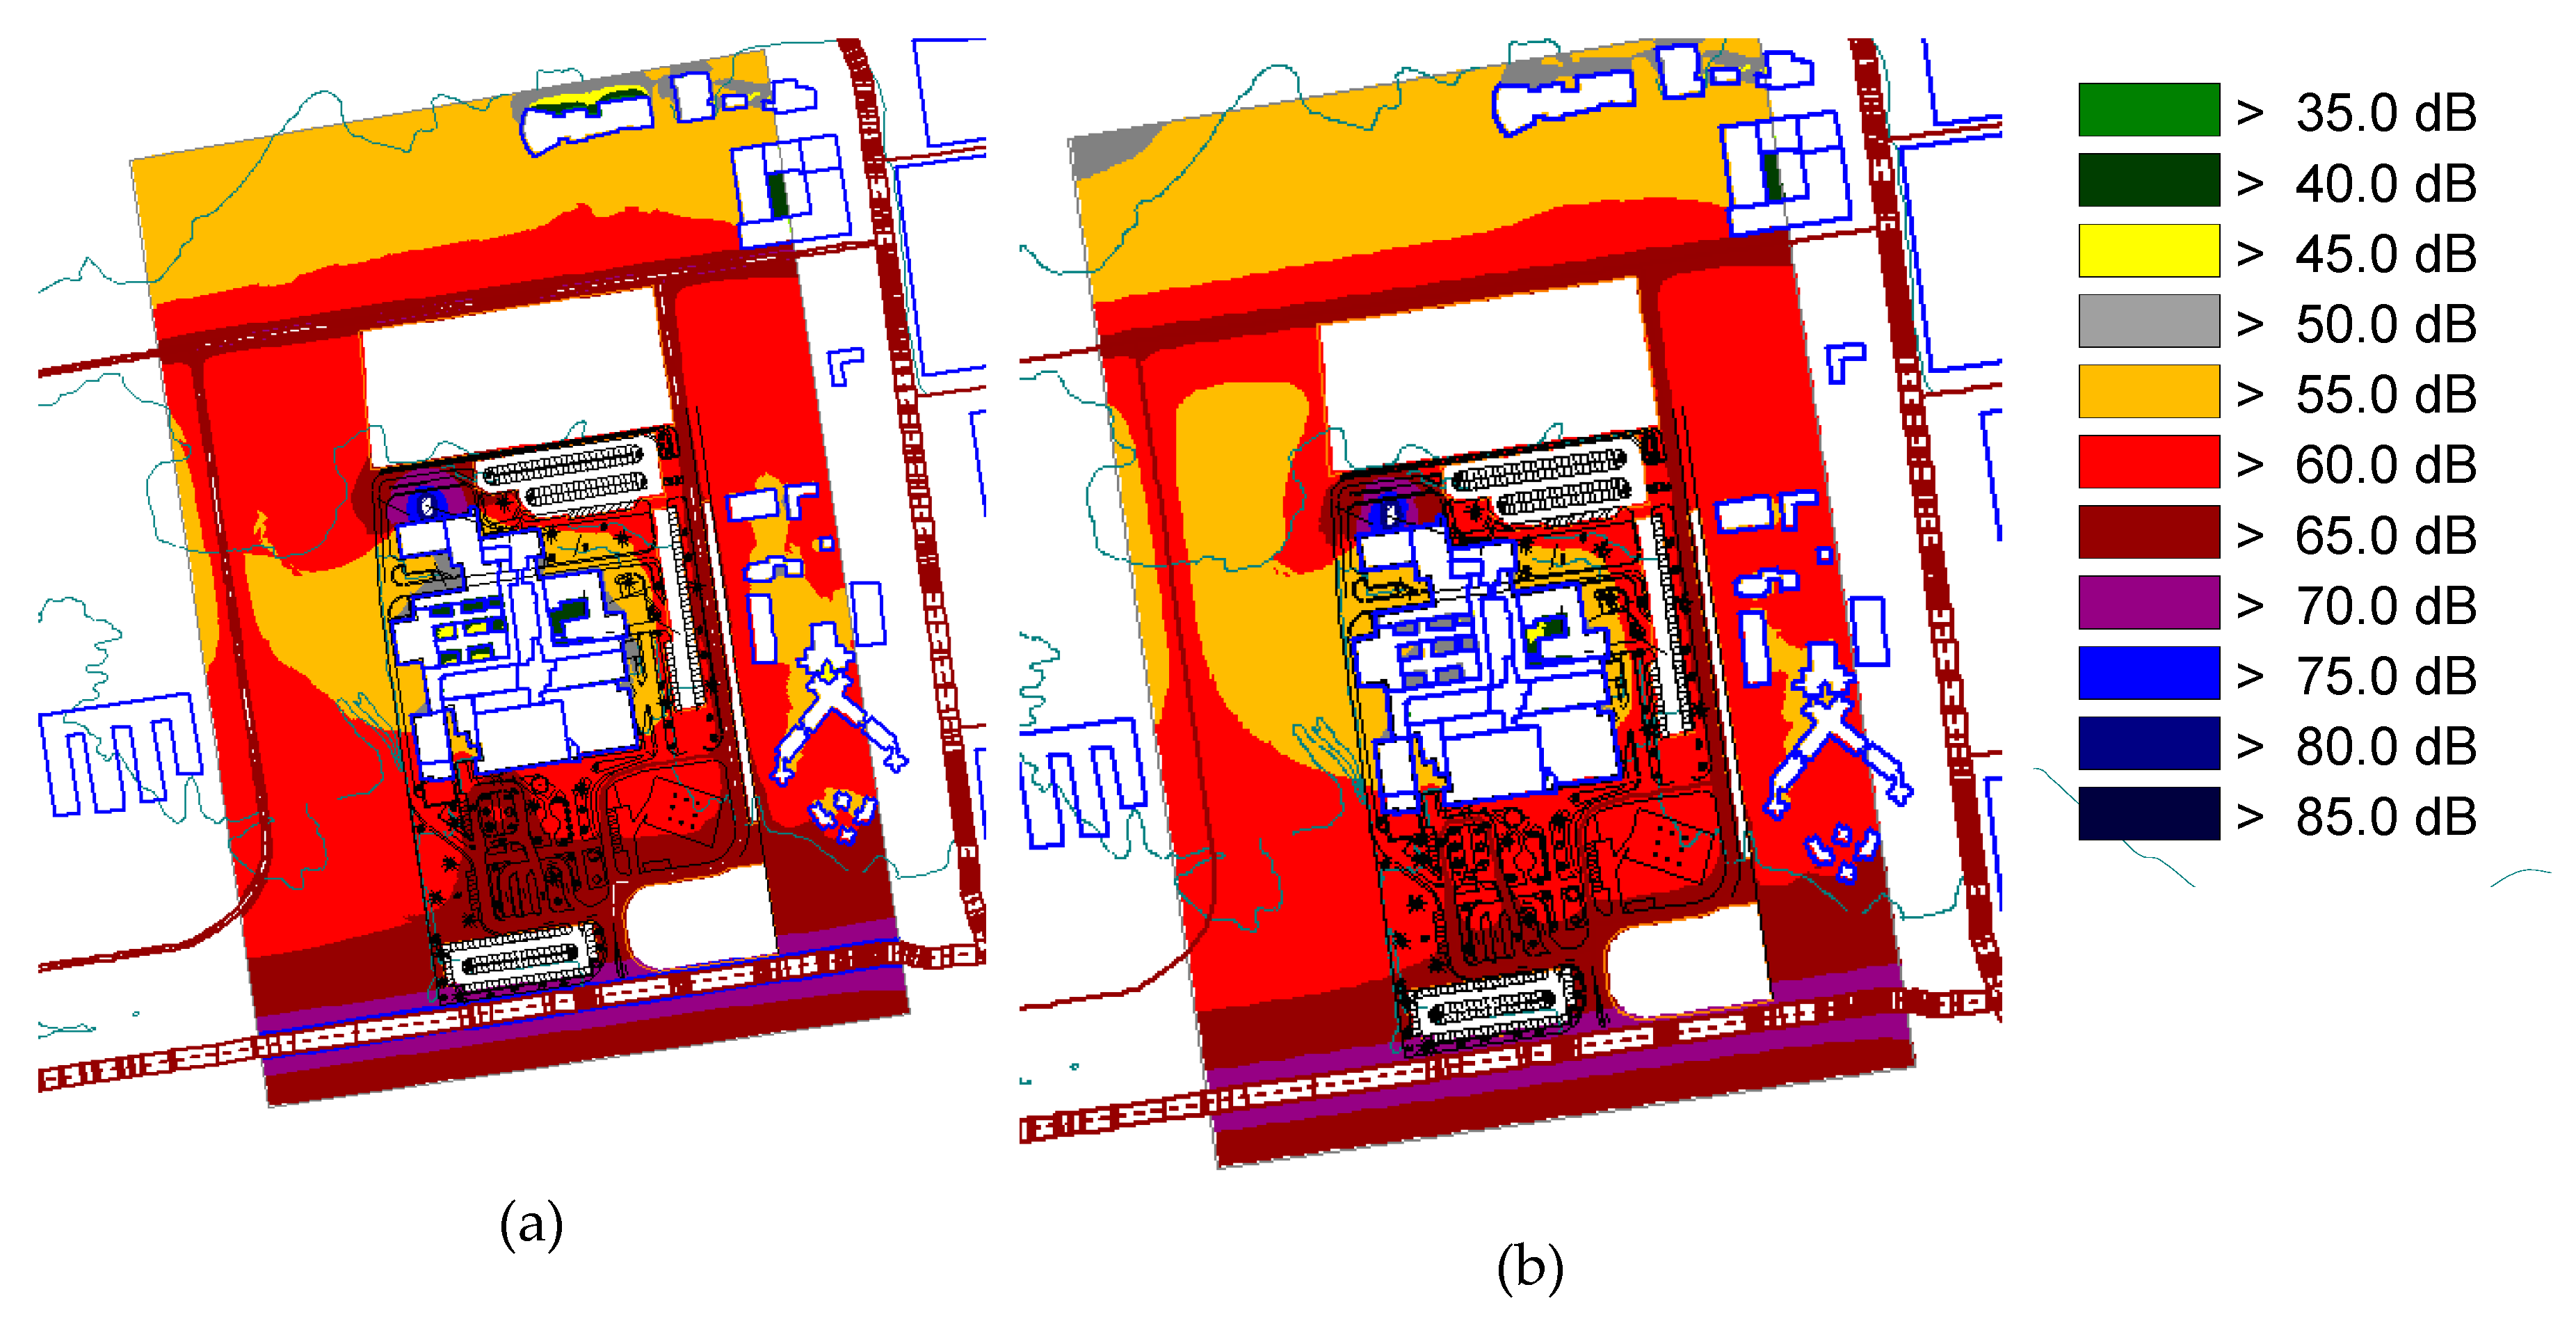
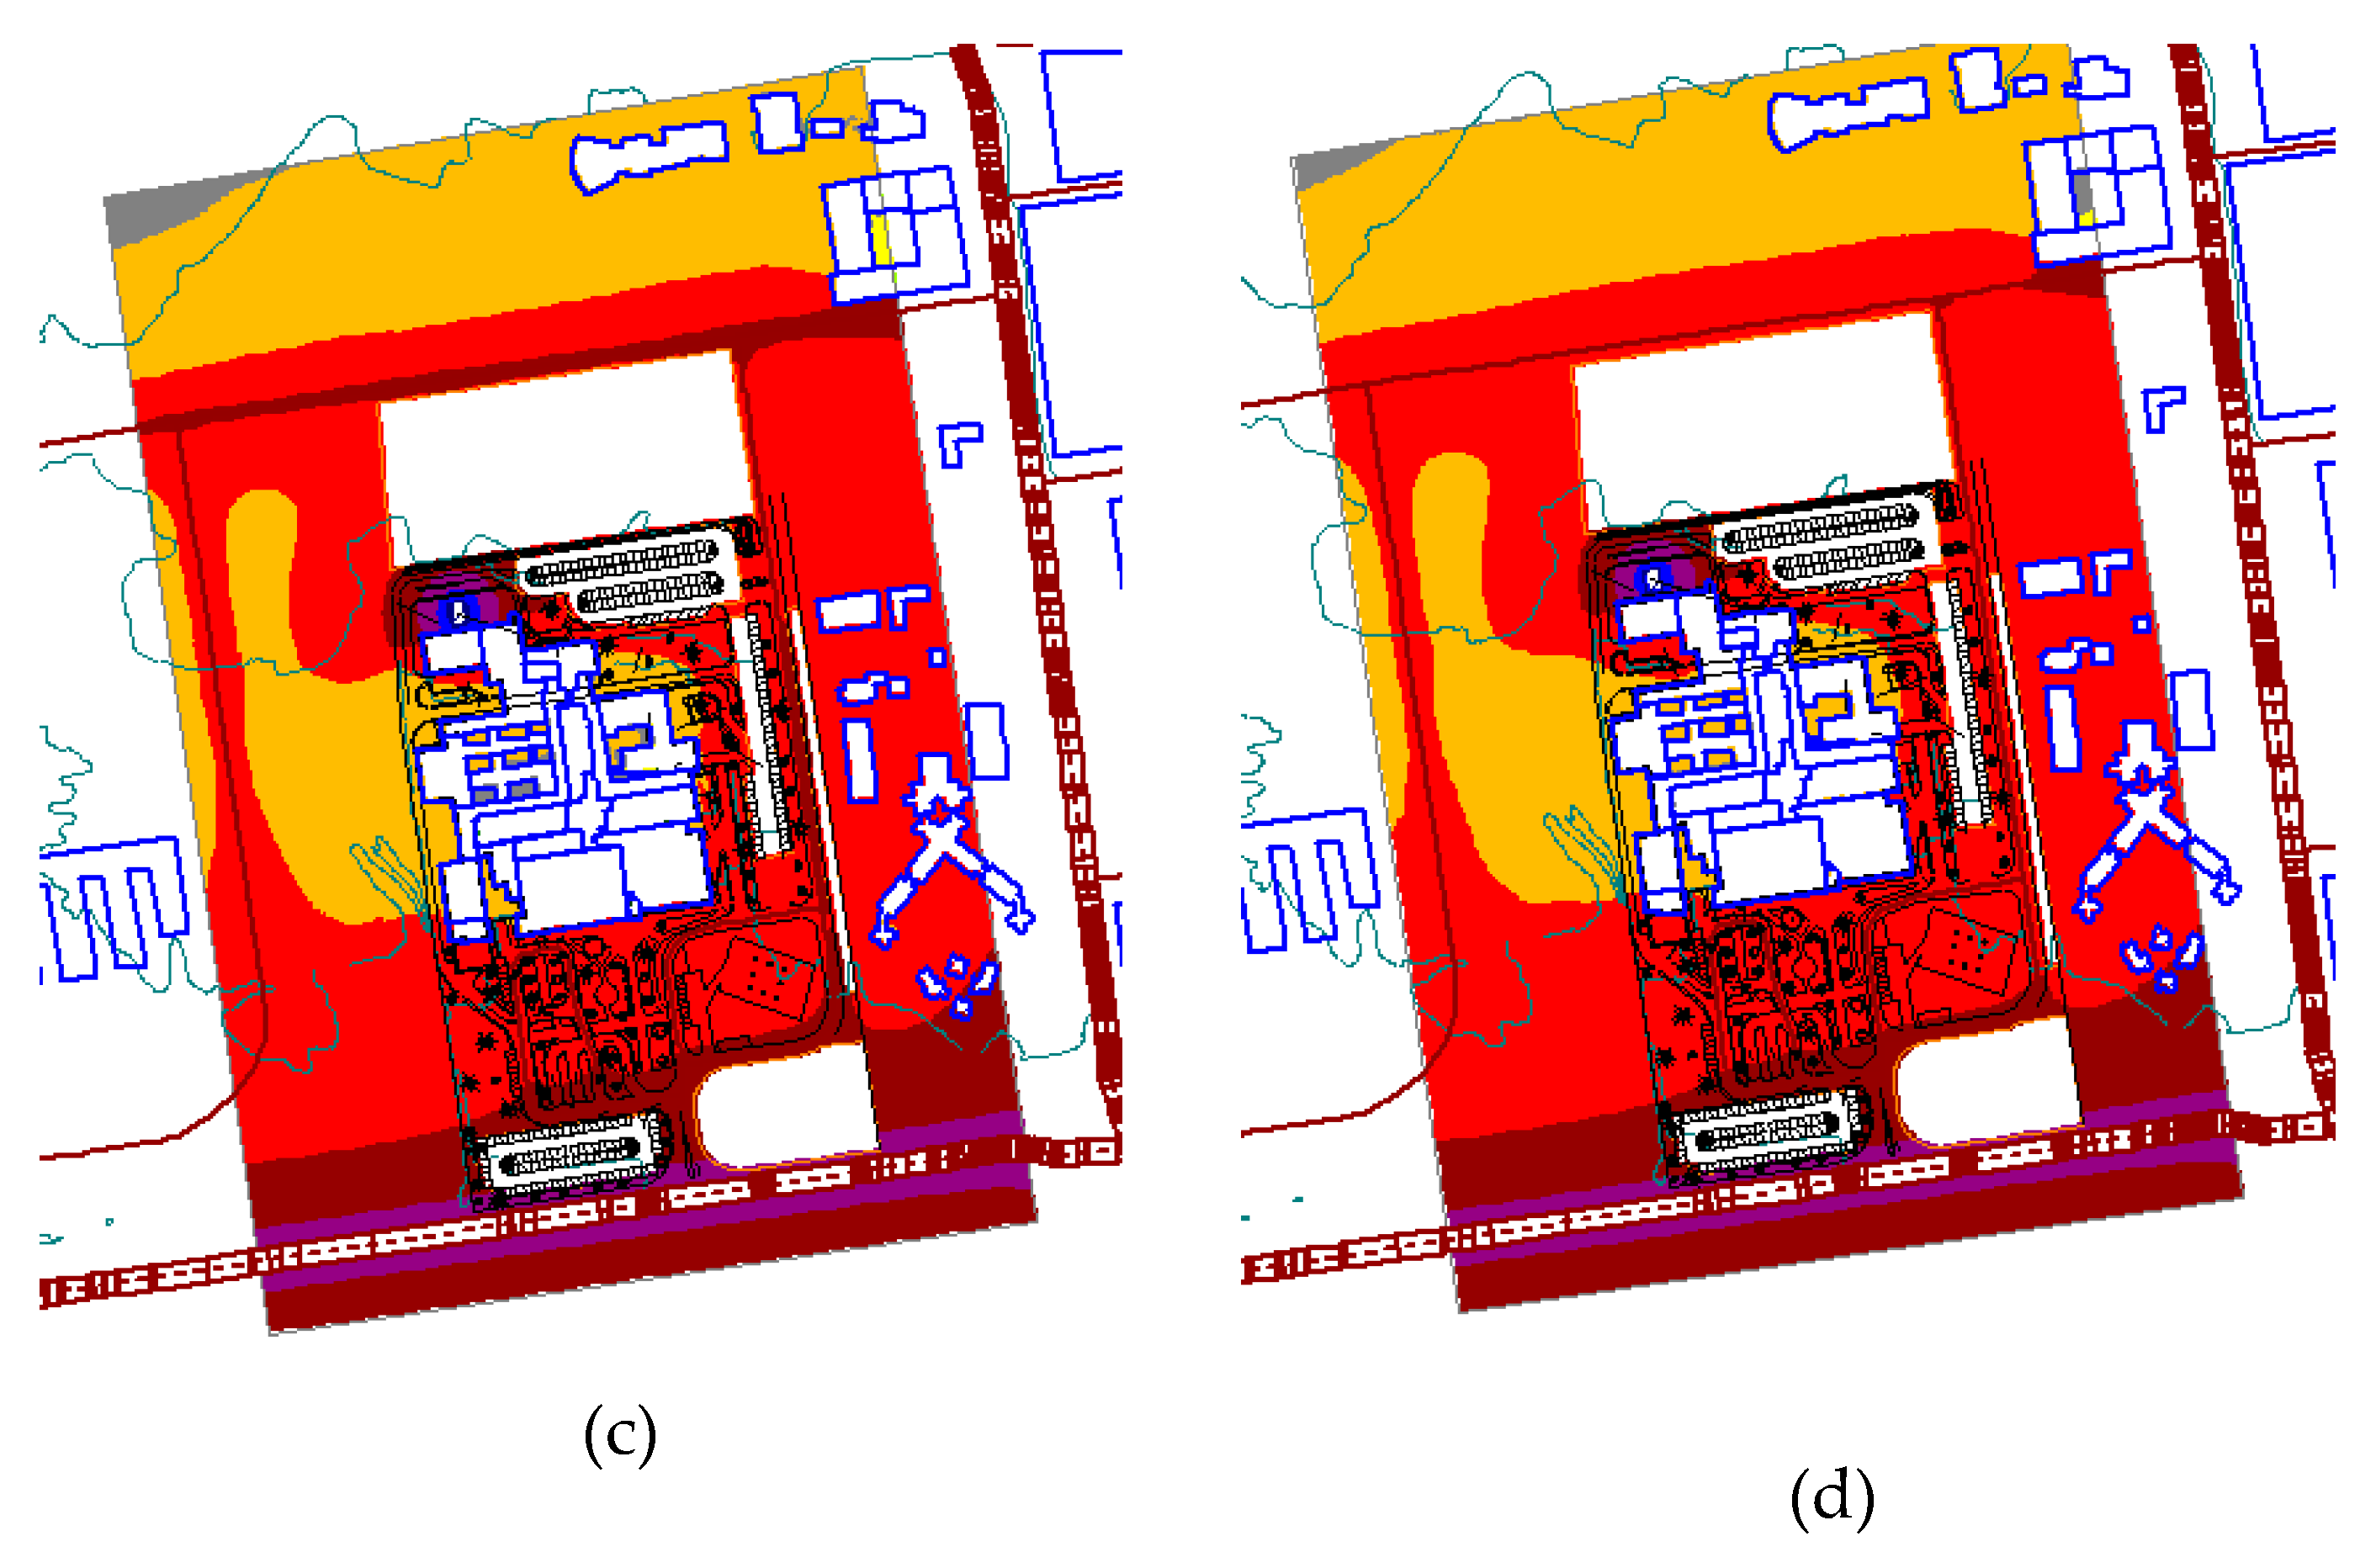
3.3. Environmental Noise Modelling

An environmental noise propagation model of the hospital and its surroundings was built. In this model, the following noise sources were introduced:
  • Noise sources related to traffic: eight roads (internal and external roads)
  • Noise sources associated with hospital activity: six cooling towers.
Factors such as the average speed of the vehicles, the type of road surface, the slope of the road, the number of light and heavy vehicles, the atmospheric conditions and the emission spectrums were taken into account. Figure 6 shows a three-dimensional view of the noise model of the University Hospital of Badajoz with a 1 m × 1 m receiver mesh at a height of 4 m above the ground.
The noise model was calibrated with the values obtained from the long-term measurements. In Table 4, results of long-term measurements and for the noise model in the same locations are presented.
As can be seen, except for point LT-2 and Ld value of point LT-3, the difference of levels in dBA for the parameters Ld, Le, Ln and Lden in no case was greater than ±2 dBA. Although there was bias of the simulation results towards noise values higher than those measured, the lower values of the difference indicated the suitability of the model, thus ensuring the subsequent results and conclusions derived.
It is well known that predictive methods offer a wide range of possibilities, since they offer the opportunity to place receivers at any point in the noise propagation model. Receivers were placed at the facades of the hospital, in order to evaluate the acoustic impact to which they were exposed.
As indicated in the methodology section, the architectural structure of the hospital is complex due to the different configurations of each floor of the buildings that compose it. In view of this, it was decided to place receivers on each of the different floors. Figure 7 shows horizontal sections of the building at different floors (marked in blue) and the locations of some of the receiver evaluation points at the different facades.
From an analysis of the results obtained from the receivers located on each of the floors of the main facades of the hospital, it can be concluded that the north and south facades receive a greater noise impact. It is important to remind that landing and take-off operations of the emergency helicopter at the heliport were not considered as a sound source during the simulations.
Figure 8 shows the results for the noise propagation model at different heights with a 1 m × 1 m receiver mesh. The south facade is oriented towards Elvas Avenue, which has a significant flow of road traffic. As the height of the receiver between the ground and third floors increases, there is a progressive increase in the measured level due to a possible reduction in acoustic shielding with respect to this road. This effect cannot be assessed between the fourth and eighth floors due to the different architectural configurations of these floors (see Figure 7 and Figure 8).
In the case of the northern facade, the sound levels registered are important, and are caused mainly by the cooling towers located in this area of the hospital. An increase in the height of the receivers located between the first and third floors of this facade shows a trend that is similar to the previous case. The sound levels increase slightly as the height increases, due to a reduction in the acoustic shielding of the cooling systems from the building itself. At this facade, the sound level remains remarkably high, even on the eighth floor. It is therefore observed that the influence of the cooling towers is very important in terms of the noise impact on the northern facade and this affected all floors assessed.
Finally, the results obtained for the east and west facades show that these have a lower exposure to environmental noise than the other two, although this does not mean that they are less important. Particularly at the east and south facades, the negative effects of take-off and landing operations at the heliport, which were observed in the long-term measurements but were not considered in the simulations, should be taken into account as an added factor.
After evaluating the exposure of each of the facades of the University Hospital of Badajoz on different floors, the suitability of the distribution of the different hospital services can be evaluated in terms of their situation with respect to the overall sound impact from external noise. The aim was to propose possible solutions for the management of the most noise-sensitive services and their relocation as far as possible away, bearing in mind that the hospital was built in the 1980s.
Table 5 shows the values estimated in simulations for during the day and night, the approximate length of each facade of the hospital and the number of receivers used. It also includes the percentage of highly sensitive areas at each facade using the following classification of the different hospital rooms depending on their sensitivity to noise and based on subjective criteria:
  • Highly sensitive area: patient wards, dormitories in general, surgical and treatment areas.
  • Moderately sensitive area: work areas, meaning those areas in which work is carried out that may be affected by high noise levels. This scale would include the offices of medical and administrative professionals, specialty consultations, laboratories and research centres, training rooms, etc.
  • Less sensitive area: areas in which a high level of noise would not cause any harm to patients and professionals. This area would include cafeterias, canteens, warehouses, archives, rooms with air-conditioning facilities, public toilets, etc.
  • Undefined area: areas or rooms that do not have an assigned fixed functionality.

4. Discussion

Based on the results obtained in both the long- and short-term measurements as well as simulations, the northern facade seems to be exposed to quite high levels of environmental noise that are even higher than some of the values recommended by international and national references such as WHO [2], USEPA [3] and Real Decreto 1367/2007 [4]. Bearing in mind that this is one of the facades of the University Hospital of Badajoz that has the highest percentage of areas highly sensitive to noise, it is necessary to take action on the main source of noise in this area of the hospital.
To achieve a significant reduction in noise levels on the north and west facades, it is important to acoustically isolate the source (cooling towers) or to move this source of noise to another area with a lower proportion of sensitive areas.
The south facade of the University Hospital of Badajoz, where 20% of the areas are highly sensitive to noise, is also highly impacted due to environmental noise, but in this case mainly due to road traffic on Elvas Avenue and access roads to the enclosure. Possible simple and known solutions to attenuate noise from Elvas Avenue could include the following:
  • Electric buses could be used on the lines running along this avenue towards the hospital and the university campus [55,56].
  • Although this road currently has a speed limit of 50 km/h in some sections, the vehicles generally travel at a higher speed. A radar could be placed here to ensure that vehicles do not exceed the speed limit [57,58].
  • Another option is to reduce speed limit from 50 km/h to 30 km/h [59].
  • Finally, traffic noise can be reduced by using porous asphalts [60].
A common solution in the propagation medium for reducing the impact of traffic noise is the use of acoustic screens. However, this option is not very effective in high buildings such as the University Hospital of Badajoz, so it has not been considered.
The southern facade of the hospital and the others are also affected by road traffic on the internal roads within the hospital enclosure. Some possible actions to mitigate the effects of this sound source would be to design the routes of the vehicles to circulate in the areas furthest away from the facades and to introduce traffic-light radar to reduce speeds.
The effects of the mitigation measures proposed can be seen in Table 6 and Figure 9. Table 6 shows the effects of some corrective actions individually and all together: The corrective actions considered are: (a) Speed reduction from 50 km/h to 30 km/h; (b) Use of porous asphalt and (c) 20 dB noise reduction for cooling towers. It can be seen that the main influence of road noise is at points 1 and 2 and that the influence of cooling towers is at points 3 and 4. Figure 9 shows a comparison of our noise model before any corrective action and after applying the following corrective actions all together.
The take-off and landing operations of the emergency helicopter are another sound source with great impact on the hospital, especially at the southern and eastern facades, due to their proximity to the heliport located at the front of the enclosure. To achieve an effective control of this sound source, it would be appropriate to relocate the heliport to an area further away from the building and to redesign the flight trajectories. Considering the hospital environment (Figure 1), it can be seen that it would be relatively easy to locate the heliport at a reasonable distance from the hospital, considering both the effect of the helicopter noise and the urgency of getting the emergency patient to the hospital as quickly as possible.
A series of possible solutions have been proposed here to attenuate the noise outside the University Hospital of Badajoz, primarily addressing the different sound sources. However, in order to reduce the impact of environmental noise on the most sensitive areas, it would be appropriate to prevent noise impact by redesigning the management of the interior spaces of the building, so that these areas could be oriented towards interior facades or less exposed to outdoor noise. It is a viable solution in the case studied and may be of interest as a criterion to be used both in other noise-sensitive buildings already constructed to solve problems associated with outdoor noise pollution and in the design phase of new buildings of this nature as a prevention system.
Although it is outside the scope of this paper, an attempt can be made to estimate the impact of environmental noise inside the hospital, excluding the internal noise sources. The overall insulation requirement of a facade according to Spanish legislation at the time of construction of the hospital was 30 dBA. The recorded sound levels at point LT-3 (shown in Figure 3) indicated that it was the point with the highest levels. Thus, it could be concluded that the noise level in this internal area of the hospital could be usually above 30 dBA, only due to external noise, which is the value that, according to WHO, should not be exceeded, but it could be within the USEPA recommendations. In the other three points, the internal noise levels would be sporadically exceeded by external noise due to the passage of the helicopter.

5. Conclusions

This paper presents a global assessment of the acoustic situation outside the University Hospital of Badajoz (Spain) due to outdoor sound sources. For this purpose, short- and long-term in situ measurements were carried out, and an environmental noise propagation model of the area under study was developed in which noise sources, such as road traffic and other sources associated with the activity of the hospital itself, were considered.
The values obtained for the different sound indicators by means of measurements and simulations show that the overall situation of the hospital should be improved. These values exceed the threshold of 50 dBA established by the WHO for moderate annoyance during the daytime and evening, and in many cases even exceed the threshold of 55 dBA for severe annoyance. In a similar way, the evaluation indicated that other important international reference values such as those issued by USEPA (55 dBA) and specific national guidelines (60 dBA) are also exceeded for the outdoor areas of hospital use.
From the results obtained from the measurements or the noise models, it can be deduced that the noise impact on this hospital is primarily influenced by three sound sources: road traffic, cooling towers of the hospital and the emergency helicopter landing and take-off operations. Their relative importance depended on the facade under consideration.
External and internal road traffic principally affected the southern facade of the hospital. For noise control, the main actions included a redesign of the access to the hospital, limitation of speed for vehicles and the introduction of traffic-light radars.
The north facade had more important noise impact. Cooling towers principally affected the north and west facades. Acoustic insulation of the sound source could considerably improve this situation.
The source with the highest acoustic power detected in this study was the emergency helicopter. Its effect was very important on the south facade and was significant on the east facade. The proposed action plans for this noise source were to redesign the flight trajectories and relocate the heliport to an area further away from the building.
A series of measures for action on the indicated sound sources were proposed to mitigate environmental noise at the facades of the hospital. In addition, management of the building’s interior spaces in order to reduce the noise impact of environmental noise on the most sensitive areas was suggested. These criteria could be useful for researchers or professionals not only for proposing action plans to mitigate the impact of environmental noise on buildings, but also as a preventive method against noise pollution in the design phase of new noise-sensitive buildings.

Author Contributions

Ultimately, all the authors contributed in a similar way in the different phases of this work. Conceptualization, D.M.-G., J.M.B.-M., V.G.E., R.V.-G. and J.A.M.-S.; Data curation, J.M.B.-M.; Formal analysis, D.M.-G., J.M.B.-M., V.G.E., R.V.-G., G.R.-G., P.A.-M. and J.A.M.-S.; Funding acquisition, J.M.B.-M.; Investigation, D.M.-G., J.M.B.-M., V.G.E., R.V.-G., G.R.-G., P.A.-M. and J.A.M.-S.; Methodology, D.M.-G., J.M.B.-M., V.G.E., R.V.-G. and J.A.M.-S.; Project administration, D.M.-G., J.M.B.-M. and V.G.E.; Resources, D.M.-G., J.M.B.-M., V.G.E., R.V.-G., G.R.-G. and P.A.-M.; Software, D.M.-G., J.M.B.-M. and V.G.E.; Supervision, J.M.B.-M. and V.G.E.; Validation, J.M.B.-M., V.G.E., G.R.-G. and P.A.-M.; Visualization, J.M.B.-M.; Writing—original draft, D.M.-G., R.V.-G., G.R.-G. and P.A.-M.; Writing—review & editing, D.M.-G., J.M.B.-M., V.G.E., R.V.-G., G.R.-G. and P.A.-M.

Funding

This research was funded by Consejería de Sanidad y Consumo of Junta de Extremadura and Consejería de Economía e Infraestructuras of Junta de Extremadura (Grant GR18107) and Fondo Europeo de Desarrollo Regional (FEDER)/European Regional Development Fund (ERDF). David Montes González was supported by the European Union, European Social Fund (ESF) and Consejería de Economía e Infraestructuras of Junta de Extremadura (PO17014). Guillermo Rey Gozalo was supported by Juan de la Cierva—Incorporación contract from the Spanish Ministry of Economy, Industry and Competitiveness (IJCI-2016-28923).

Acknowledgments

The authors would like to thank M. Ángel Gómez, Miguel Mellado, David Guzmán and Carlos Prieto for their punctual help at some points of this work.

Conflicts of Interest

The authors declare no conflict of interest.

References

  1. Official Journal of the European Union. Directive 2002/49/EC of the European Parliament and of the Council of 25 June 2002 Relating to the Assessment and Management of Environmental Noise—Declaration by the Commission in the Conciliation Committee on the Directive Relating to the Assessment and Management of Environmental Noise; The European Parliament and the Council of the European Union: Brussels, Belgium, 2002; Available online: http://data.europa.eu/eli/dir/2002/49/oj (accessed on 7 March 2019).
  2. WHO (World Health Organization). Guidelines for Community Noise; WHO: Geneva, Switzerland, 1999; Available online: http://apps.who.int/iris/handle/10665/66217 (accessed on 7 March 2019).
  3. USEPA (United States Environmental Protection Agency). Information on Levels of Environmental Noise Requisite to Protect Public Health and Welfare with Adequate Margin of Safety. EPA/ONAC Report No. 550/9-74-004; 1974. Available online: https://nepis.epa.gov/Exe/ZyNET.exe/2000L3LN.TXT?ZyActionD=ZyDocument&Client=EPA&Index=Prior+to+1976&Docs=&Query=&Time=&EndTime=&SearchMethod=1&TocRestrict=n&Toc=&TocEntry=&QField=&QFieldYear=&QFieldMonth=&QFieldDay=&IntQFieldOp=0&ExtQFieldOp=0&XmlQuery=&File=D%3A%5Czyfiles%5CIndex%20Data%5C70thru75%5CTxt%5C00000001%5C2000L3LN.txt&User=ANONYMOUS&Password=anonymous&SortMethod=h%7C-&MaximumDocuments=1&FuzzyDegree=0&ImageQuality=r75g8/r75g8/x150y150g16/i425&Display=hpfr&DefSeekPage=x&SearchBack=ZyActionL&Back=ZyActionS&BackDesc=Results%20page&MaximumPages=1&ZyEntry=1&SeekPage=x&ZyPURL (accessed on 7 March 2019).
  4. Real Decreto 1367/2007, de 19 de Octubre, por el que se Desarrolla la Ley 37/2003, de 17 de Noviembre, del Ruido, en lo Referente a Zonificación Acústica, Objetivos de Calidad y Emisiones Acústicas. Available online: https://www.boe.es/buscar/pdf/2007/BOE-A-2007-18397-consolidado.pdf (accessed on 7 March 2019).
  5. Khaiwal, R.; Singh, T.; Tripathy, J.P.; Mor, S.; Munjal, S.; Patro, B.; Panda, N. Assessment of noise pollution in and around a sensitive zone in North India and its non-auditory impacts. Sci. Total Environ. 2016, 566–567, 981–987. [Google Scholar] [CrossRef]
  6. Loupa, G.; Katikaridis, A.; Karali, D.; Rapsomanikis, S. Mapping the noise in a Greek general hospital. Sci. Total Environ. 2019, 646, 923–929. [Google Scholar] [CrossRef] [PubMed]
  7. Montes-González, D.; Vílchez-Gómez, R.; Barrigón-Morillas, J.M.; Atanasio-Moraga, P.; Rey-Gozalo, G.; Trujillo-Carmona, J. Noise and Air Pollution Related to Health in Urban Environments. Proceedings 2018, 2, 1311. [Google Scholar] [CrossRef]
  8. Muzet, A. Environmental noise, sleep and health. Sleep Med. Rev. 2007, 11, 135–142. [Google Scholar] [CrossRef]
  9. de Kluizenaar, Y.; Janssen, S.A.; van Lenthe, F.J.; Miedema, H.M.; Mackenbach, J.P. Long-term road traffic noise exposure is associated with an increase in morning tiredness. J. Acoust. Soc. Am. 2009, 126, 626–633. [Google Scholar] [CrossRef]
  10. Miedema, H.M.; Oudshoorn, C.G. Annoyance from transportation noise: Relationships with exposure metrics DNL and DENL and their confidence intervals. Environ. Health Perspect. 2001, 109, 409–416. [Google Scholar] [CrossRef]
  11. Fredianelli, L.; Carpita, S.; Licitra, G. A procedure for deriving wind turbine noise limits by taking into account annoyance. Sci. Total Environ. 2019, 648, 728–736. [Google Scholar] [CrossRef] [PubMed]
  12. Babisch, W.; Beule, B.; Schust, M.; Kersten, N.; Ising, H. Traffic noise and risk of myocardial infarction. Epidemiology 2005, 16, 33–40. [Google Scholar] [CrossRef]
  13. Lercher, P.; Evans, G.W.; Meis, M. Ambient noise and cognitive processes among primary schoolchildren. Environ. Behav. 2003, 35, 725–735. [Google Scholar] [CrossRef]
  14. Chetoni, M.; Ascari, E.; Bianco, F.; Fredianelli, L.; Licitra, G.; Cori, L. Global noise score indicator for classroom evaluation of acoustic performances in LIFE GIOCONDA project. Noise Mapp. 2016, 3, 157–171. [Google Scholar] [CrossRef]
  15. Van Kempen, E.; Babisch, W. The quantitative relationship between road traffic noise and hypertension: A meta-analysis. J. Hypertens. 2012, 30, 1075–1086. [Google Scholar] [CrossRef] [PubMed]
  16. Zambon, G.; Roman, H.; Smiraglia, M.; Benocci, R. Monitoring and prediction of traffic noise in large urban areas. Appl. Sci. 2018, 8, 251. [Google Scholar] [CrossRef]
  17. Zambon, G.; Benocci, R.; Bisceglie, A.; Roman, H.E.; Bellucci, P. The LIFE DYNAMAP project: Towards a procedure for dynamic noise mapping in urban areas. Appl. Acoust. 2017, 124, 52–60. [Google Scholar] [CrossRef]
  18. Licitra, G.; Ascari, E.; Fredianelli, L. Prioritizing Process in Action Plans: A Review of Approaches. Curr. Pollut. Rep. 2017, 3, 151–161. [Google Scholar] [CrossRef]
  19. Prieto Gajardo, C.; Godinho, L.; Amado-Mendes, P.; Barrigon-Morillas, J.M. Numerical analysis of acoustic barriers with a diffusive surface using a 2.5D boundary element model. J. Comput. Acoust. 2015, 23, 1550009. [Google Scholar] [CrossRef]
  20. Licitra, G.; Fredianelli, L.; Petri, D.; Vigotti, M.A. Annoyance evaluation due to overall railway noise and vibration in Pisa urban areas. Sci. Total Environ. 2016, 568, 1315–1325. [Google Scholar] [CrossRef] [PubMed]
  21. Bunn, F.; Zannin, P.H.T. Assessment of railway noise in an urban setting. App. Acoust. 2016, 104, 16–23. [Google Scholar] [CrossRef]
  22. Gagliardi, P.; Fredianelli, L.; Simonetti, D.; Licitra, G. ADS-B System as a Useful Tool for Testing and Redrawing Noise Management Strategies at Pisa Airport. Acta Acust. United Acust. 2017, 103, 543–551. [Google Scholar] [CrossRef]
  23. Iglesias-Merchan, C.; Diaz-Balteiro, L.; Soliño, M. Transportation planning and quiet natural areas preservation: Aircraft overflights noise assessment in a National Park. Transp. Res. D Transp. Environ. 2015, 41, 1–12. [Google Scholar] [CrossRef]
  24. Kephalopoulos, S.; Paviotti, M.; Anfosso-Lédée, F.; Van Maercke, D.; Shilton, S.; Jones, N. Advances in the development of common noise assessment methods in Europe: The CNOSSOS-EU framework for strategic environmental noise mapping. Sci. Total Environ. 2014, 482, 400–410. [Google Scholar] [CrossRef] [PubMed] [Green Version]
  25. Morel, J.; Marquis-Favre, C.; Gille, L.A. Noise annoyance assessment of various urban road vehicle pass-by noises in isolation and combined with industrial noise: A laboratory study. App. Acoust. 2016, 101, 47–57. [Google Scholar] [CrossRef]
  26. Fredianelli, L.; Del Pizzo, A.; Licitra, G. Recent Developments in Sonic Crystals as Barriers for Road Traffic Noise Mitigation. Environments 2019, 6, 14. [Google Scholar] [CrossRef]
  27. Persson Waye, K.; Ryherd, E.; Lindahl, B.; Bergbom, I. Relating the hospital sound environment to occupant psychological and physiological response. J. Acoust. Soc. Am. 2008, 123, 3193. [Google Scholar] [CrossRef]
  28. Ulrich, R. Effects of healthcare acoustics on medical outcomes. J. Acoust. Soc. Am. 2008, 123, 3094. [Google Scholar] [CrossRef]
  29. Sonnenberg, A.; Donga, M.; Erckenbrecht, J.F.; Wienbeck, M. The effect of mental stress induced by noise on gastric acid secretion and mucosal blood flow. Scand. J. Gastroenterol. Suppl. 1984, 89, 45–48. [Google Scholar]
  30. Wysocki, A.B. The effect of intermittent noise exposure on wound healing. Adv. Skin Wound Care 1996, 9, 35–39. [Google Scholar]
  31. Cmiel, C.A.; Karr, D.M.; Gasser, D.M.; Oliphant, L.M.; Neveau, A.J. Noise control: A nursing team’s approach to sleep promotion. Am. J. Nurs. 2004, 104, 40–48. [Google Scholar] [CrossRef] [PubMed]
  32. Morrison, W.E.; Haas, E.C.; Shaffner, D.H.; Garrett, E.S.; Fackler, J.C. Noise, stress, and annoyance in a pediatric intensive care unit. Crit. Care Med. 2003, 31, 113–119. [Google Scholar] [CrossRef] [PubMed]
  33. Blomkvist, V.; Eriksen, C.A.; Theorell, T.; Ulrich, R.; Rasmanis, G. Acoustics and psychosocial environment in intensive coronary care. Occup. Environ. Med. 2005, 62, e1. [Google Scholar] [CrossRef]
  34. Applebaum, D.; Fowler, S.; Fiedler, N.; Osinubi, O.; Robson, M. The impact of environmental factors on nursing stress, job satisfaction, and turnover intention. J. Nurs. Adm. 2010, 40, 323–328. [Google Scholar] [CrossRef] [PubMed]
  35. Ryherd, E.E.; West, J.E.; Ackerman, J.; Zimring, C.; Waye, K.P. Evaluating and improving hospital soundscapes. In Proceedings of the 41st International Congress and Exposition on Noise Control Engineering, New York, NY, USA, 19–22 August 2008. [Google Scholar]
  36. Zannin, P.H.T.; Ferraz, F. Assessment of Indoor and Outdoor Noise Pollution at a University Hospital Based on Acoustic Measurements and Noise Mapping. Open J. Acoust. 2016, 6, 71–85. [Google Scholar] [CrossRef]
  37. Carmona del Río, F.J.; Gómez Escobar, V.; Trujillo Carmona, J.; Vílchez-Gómez, R.; Méndez Sierra, J.A.; Rey Gozalo, G.; Barrigón Morillas, J.M. A street categorization method to study urban noise: The Valladolid (Spain) study. Environ. Eng. Sci. 2011, 28, 811–817. [Google Scholar] [CrossRef]
  38. Rey Gozalo, G.; Barrigón Morillas, J.M.; Gómez Escobar, V.; Vílchez-Gómez, R.; Méndez Sierra, J.A.; Carmona del Río, F.J.; Prieto Gajardo, C. Study of the categorisation method using long-term measurements. Arch. Acoust. 2013, 38, 397–405. [Google Scholar] [CrossRef]
  39. Busch-Vishniac, I.J.; West, J.E.; Barnhill, C.; Hunter, T.; Orellana, D.; Chivukula, R. Noise levels in Johns Hopkins Hospital. J. Acoust. Soc. Am. 2005, 118, 3629–3645. [Google Scholar] [CrossRef] [PubMed]
  40. INE (Instituto Nacional de Estadística). Datos Oficiales de Población 2017. Available online: www.ine.es (accessed on 7 March 2019).
  41. SES (Servicio Extremeño de Salud). Catálogo de Hospitales de Extremadura. 2015. Available online: https://saludextremadura.ses.es/filescms/web/uploaded_files/Principal/Recursos%20Sanitarios/CATALOGO%20DE%20HOSPITALES%20DE%20EXTREMADURA%202015.pdf (accessed on 7 March 2019).
  42. Barrigón Morillas, J.M.; Gómez Escobar, V.; Méndez Sierra, J.A.; Vílchez-Gómez, R.; Vaquero, J.M.; Trujillo Carmona, J. A categorization method applied to the study of urban road traffic noise. J. Acoust. Soc. Am. 2005, 116, 2844–2852. [Google Scholar] [CrossRef]
  43. Rey Gozalo, G.; Barrigón Morillas, J.M.; Gómez Escobar, V. Urban streets functionality as a tool for urban pollution management. Sci. Total Environ. 2013, 461–462, 453–461. [Google Scholar] [CrossRef] [PubMed]
  44. International Organization for Standardization (ISO). ISO 1996-2: 2007. Description, Measurement and Assessment of Environmental Noise. Part 2: Determination of Environmental Noise Levels; International Organization for Standardization (ISO): Geneva, Switzerland, 2007. [Google Scholar]
  45. Barrigón Morillas, J.M.; Montes González, D.; Rey Gozalo, G. A review of the measurement procedure of the ISO 1996 standard. Relationship with the European Noise Directive. Sci. Total Environ. 2016, 565, 595–606. [Google Scholar] [CrossRef] [PubMed] [Green Version]
  46. Montes González, D.; Barrigón Morillas, J.M.; Rey Gozalo, G. The influence of microphone location on the results of urban noise measurements. Appl. Acoust. 2015, 90, 64–73. [Google Scholar] [CrossRef]
  47. Montes Gonzalez, D.; Barrigón Morillas, J.M.; Rey Gozalo, G. Acoustic behaviour of plates made of different materials for measurements with the microphone flush mounted. Appl. Acoust. 2018, 132, 135–141. [Google Scholar] [CrossRef]
  48. Official Journal of the European Union. Commission Directive (EU) 2015/996 of 19 May 2015 Establishing Common Noise Assessment Methods according to Directive 2002/49/EC of the European Parliament and of the Council; The European Parliament and the Council of the European Union: Brussels, Belgium, 2015; Available online: https://eur-lex.europa.eu/eli/dir/2015/996/oj (accessed on 7 March 2019).
  49. Kephalopoulos, S.; Paviotti, M.; Anfosso-Lédée, F. Common Noise Assessment Methods in Europe (CNOSSOS-EU) EUR 25379 EN; Publications Office of the European Union: Luxembourg, 2012; Available online: https://ec.europa.eu/jrc/en/publication/reference-reports/common-noise-assessment-methods-europe-cnossos-eu (accessed on 7 March 2019).
  50. NMPB-Routes-96. Bruit des Infastructures Routières. Méthode de Calcul Incluant les Effects Météorologiques. Centre D’études sur les Réseaux, les Transports, L’urbanisme et les Constructions Publiques, 1997. Available online: http://dtrf.setra.fr/pdf/pj/Dtrf/0000/Dtrf-0000741/DT741.pdf?openerPage=notice (accessed on 7 March 2019).
  51. AFNOR (Association Française de Normalisation). NF S 31–133. Bruit des Infrastructures de Transports Terrestres. Calcul de L’atténuation du son lors de sa Propagation en Milieu Extérieur, Incluant les Effets Météorologiques; AFNOR (Association Française de Normalisation): La Plaine Saint-Denis, France, 2011. [Google Scholar]
  52. International Organization for Standardization (ISO). ISO 9613-2:1996. Acoustics—Attenuation of Sound during Propagation Outdoors—Part 2: General method of Calculation; International Organization for Standardization (ISO): Geneva, Switzerland, 1993. [Google Scholar]
  53. WG-AEN. Good Practice Guide for Strategic Noise Mapping and the Production of Associated Data on Noise Exposure. Version 2. European Commission Working Group-Assessment of Exposure to Noise (WG-AEN), 13 August 2007. Available online: https://www.lfu.bayern.de/laerm/eg_umgebungslaermrichtlinie/doc/good_practice_guide_2007.pdf (accessed on 7 March 2019).
  54. Barrigón Morillas, J.M.; Gómez Escobar, V.; Méndez Sierra, J.A.; Vílchez-Gómez, R.; Vaquero, J.M. Measurements of noise pollution in Badajoz City, Spain. Acta Acust. United Acust. 2005, 91, 797–801. [Google Scholar]
  55. Conti, V.; Orchi, S.; Valentini, M.P.; Nigro, M.; Calò, R. Design and evaluation of electric solutions for public transport. Transp. Res. Proc. 2017, 27, 117–124. [Google Scholar] [CrossRef]
  56. Wang, X.; González, J.A. Assessing Feasibility of Electric Buses in Small and Medium-Sized Communities. Int. J. Sustain. Transp. 2013, 7, 431–448. [Google Scholar] [CrossRef]
  57. Can, A.; Aumond, P. Estimation of road traffic noise emissions: The influence of speed and acceleration. Transp. Res. Part D Transp. Environ. 2018, 58, 155–171. [Google Scholar] [CrossRef]
  58. Ece, M.; Tosun, I.; Ekinci, K.; Yalçindag, N.S. Modeling of road traffic noise and traffic flow measures to reduce noise exposure in Antalya metropolitan municipality. J. Environ. Health Sci. Eng. 2018, 16, 1. [Google Scholar] [CrossRef] [PubMed]
  59. Ögren, M.; Molnár, P.; Barregard, L. Road traffic noise abatement scenarios in Gothenburg 2015–2035. Environ. Res. 2018, 164, 516–521. [Google Scholar] [CrossRef] [PubMed]
  60. Bezemer-Krijnen, M.; Wijnant, Y.H.; De Boer, A. Prediction of sound absorption of stacked granular materials for normal and oblique incident sound waves. Acta Acust. United Acust. 2018, 104, 464–476. [Google Scholar] [CrossRef]
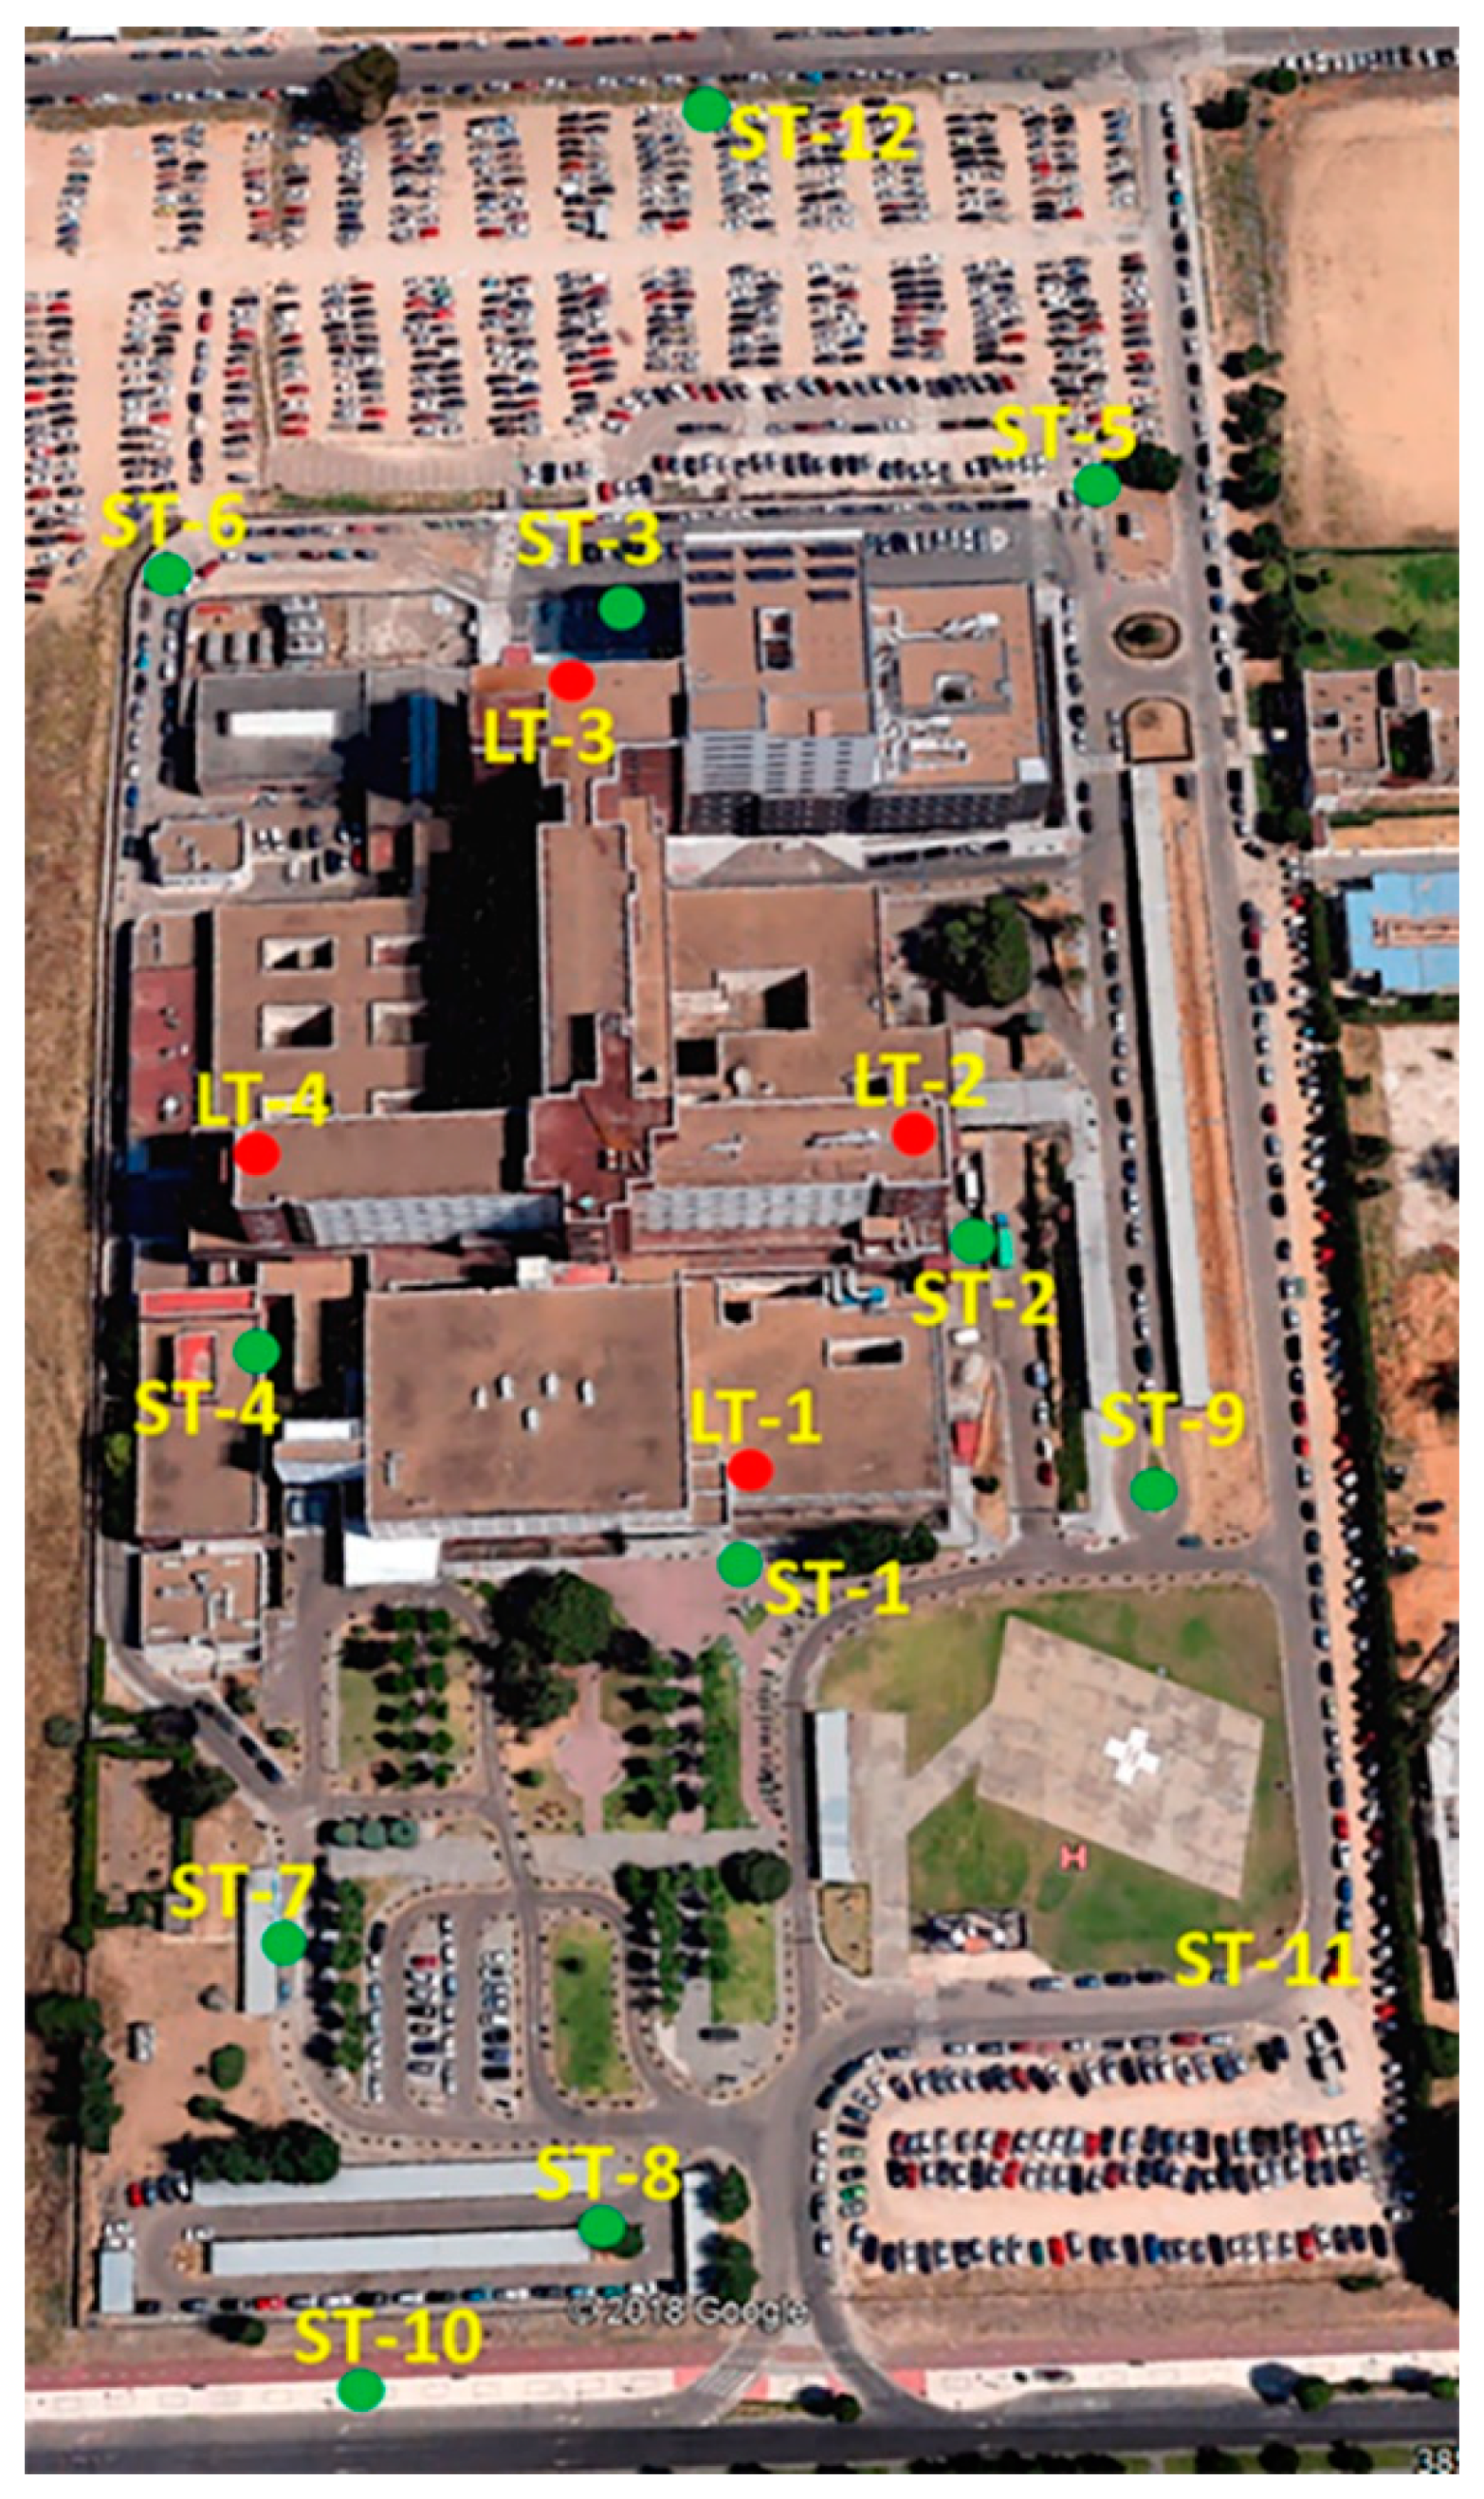
Figure 1. Aerial view of the University Hospital of Badajoz (Google Maps). North is shown at the upper right corner.
Environments 06 00041 g001
Figure 2. Location of short-term (ST-1 to ST-12) and long-term (LT-1 to LT-4) measuring points (Google Maps).
Environments 06 00041 g002
Figure 3. Values for Ld, Le, Ln and Lden sound indicators at points LT-1 to LT-4 in the University Hospital of Badajoz.
Environments 06 00041 g003
Figure 4. One h interval time evolution of LAeq at the measuring points during the first week of long-term measurements.
Environments 06 00041 g004
Figure 5. Averaged values of LAeq for short-term measurements points ST-1 to ST-12 at the University Hospital of Badajoz.
Environments 06 00041 g005
Figure 6. 3D view of the results of the noise propagation model at 4 m.
Environments 06 00041 g006
Figure 7. Horizontal sections of the building at different floors (marked in blue) together with the locations of some of the receiver evaluation points at the different facades. (a) The ground floor plan; and (b) the fourth to eighth floor plan.
Environments 06 00041 g007
Figure 8. Noise propagation model at different heights. (a) H = 1.5 m; (b) H = 4.0 m; (c) H = 7.0 m; (d) 10.0 m.
Environments 06 00041 g008aEnvironments 06 00041 g008b
Figure 9. Comparative of the noise model before and after corrective actions: (a) Without any corrective action. (b) After applying all the corrective actions.
Environments 06 00041 g009
Table 1. Description of long-term (LT) measuring points.
PointFacadeMicrophone LocationHeight from the Ground (m)/FloorMost Relevant Sound SourcesOther Considerations
LT-1South
(main)
Balcony9
(1st floor)
Road traffic noise from Elvas Ave. and access roadsClosest point to the heliport
LT-2EastRoof35
(8th floor)
Road traffic noise from access road to the hospital and car parksNear the heliport
LT-3NorthRoof35
(8th floor)
Road traffic noise from car parks
Cooling towers
Farthest point from heliport
LT-4WestBalcony18
(3rd floor)
Cooling towersNear the emergency entry
Table 2. Description of short-term (ST) measuring points.
PointLocationOther Considerations
ST-1Below point LT-1Near the main entry
ST-2Below point LT-2
ST-3Below point LT-3Close to the gateway to the outpatient clinic area
ST-4Below point LT-4Near the emergency entry
ST-5Right rear edge of hospital enclosureAccess to rear parking area
ST-6Left rear area of hospital enclosureNear the cooling towers
ST-7Front left side of the main buildingCar park street near the emergency access door
ST-8Front left parking areaNext to the access entrance of vehicles from Elvas Avenue
ST-9Close to a crossroads located at the exit of the car parks in the hospital coffee shop area
ST-10Next to Elvas Avenue
ST-11Unpaved area on the front right side of the hospitalNear the heliport
ST-12On the road next to the unpaved rear parking area
Table 3. Contribution of helicopter emergency operations to the Ld indicator at points LT-1 and LT-2.
LT-1LT-2
Ld (dBA)Ld CALC (dBA)∆Ld (dBA)Ld (dBA)Ld CALC (dBA)∆Ld (dBA)
Event 162.456.06.459.556.72.8
Event 262.954.48.559.655.74.0
Event 361.655.66.058.356.42.0
Event 462.354.18.259.955.54.4
Event 562.452.99.558.853.85.0
Table 4. Comparison of long-term noise levels measured and simulation results.
In SituSimulation ResultsDifferences
PointLT-1LT-2LT-3LT-4LT-1LT-2LT-3LT-4LT-1LT-2LT-3LT-4
Ld (dBA)56.657.057.154.657.460.060.256.3−0.8−3.0−3.1−1.7
Le (dBA)54.955.057.253.956.558.758.955.8−1.6−3.7−1.7−1.9
Ln (dBA)49.849.754.350.551.352.855.451.7−1.5−3.1−1.1−1.2
Lden (dBA)58.558.661.658.159.861.863.259.6−1.3−3.2−1.6−1.5
Table 5. Sound levels obtained at facades and percentages of areas highly sensitive to noise.
OrientationLength (m)Nº of Assessment Points% of Highly Sensitive AreasLd (dBA)Ln (dBA)
East15538%48–5542–48
South132520%54–5748–51
West14085%49–5845–57
North120643%38–6143–61
Table 6. Noise level received in each of the facades of the hospital according to our model after applying different corrective measures.
Ld (dBA)Le (dBA)Ln (dBA)Lden (dBA)
Receiver 1 (south)
1Initial situation56.457.451.459.9
2Speed reduction from 50 km/h to 30 km/h56.457.451.459.8
3Use of porous asphalt55.556.550.559.0
420 dB noise reduction for cooling towers56.457.451.459.8
5All corrective measures together55.556.550.558.9
Receiver 2 (east)
1Initial situation58.759.952.861.8
2Speed reduction from 50 km/h to 30 km/h58.659.952.861.8
3Use of porous asphalt57.759.152.061.0
420 dB noise reduction for cooling towers58.759.952.861.8
5All corrective measures together57.759.152.161.0
Receiver 3 (north)
1Initial situation58.960.255.563.2
2Speed reduction from 50 km/h to 30 km/h58.960.255.463.2
3Use of porous asphalt58.559.955.363.0
420 dB noise reduction for cooling towers56.258.250.659.7
5All corrective measures together55.357.749.959.0
Receiver 4 (west)
1Initial situation55.756.251.759.5
2Speed reduction from 50 km/h to 30 km/h55.656.251.659.5
3Use of porous asphalt55.155.651.359.0
420 dB noise reduction for cooling towers54.054.548.457.0
5All corrective measures together52.953.547.355.9

