Article

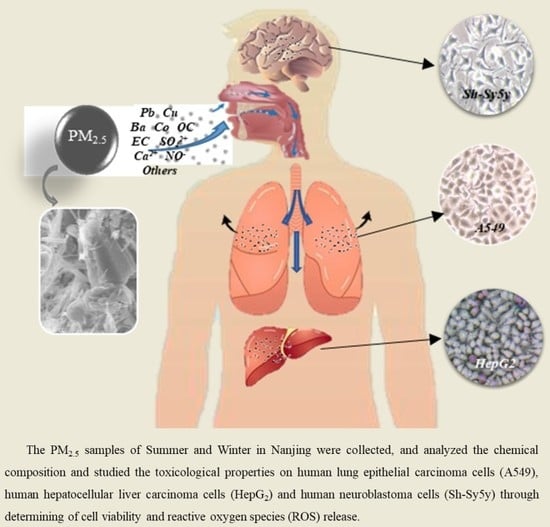
Chemical Characterization of Two Seasonal PM2.5 Samples in Nanjing and Its Toxicological Properties in Three Human Cell Lines

Jiangsu Key Laboratory of Atmospheric Environment Monitoring and Pollution Control (AEMPC), Collaborative Innovation Center of Atmospheric Environment and Equipment Technology (CIC-AEET), School of Environmental Science and Engineering, Nanjing University of Information Science & Technology, Nanjing 210044, China
*
Author to whom correspondence should be addressed.
Environments 2019, 6(4), 42; https://doi.org/10.3390/environments6040042
Submission received: 9 March 2019 / Revised: 29 March 2019 / Accepted: 31 March 2019 / Published: 3 April 2019

Abstract

:
PM2.5 pollution is of great concern in China due to its adverse health effects. Many diseases have been proven to be associated with PM2.5 components, but the effects of chemical characteristics of PM2.5 on toxicological properties, especially in different human organs, are poorly understood. In this study, two seasonal PM2.5 samples (summer and winter) were collected in Nanjing, and their chemical compositions (heavy metals, water-soluble ions, organic carbon (OC), and elemental carbon (EC)) were analyzed. Human lung epithelial carcinoma cells (A549), human hepatocellular liver carcinoma cells (HepG2), and human neuroblastoma cells (Sh-Sy5y) were employed to evaluate the toxicological properties of the collected PM2.5. The results showed that the average mass concentrations of PM2.5 were lower in summer (51.3 ± 21.4 μg/m3) than those in winter (62.1 ± 21.5 μg/m3). However, the mass fractions of heavy metals, OC, and EC exhibited an opposite seasonal difference. Among all tested fractions, water-soluble ions were the major compositions of particles in both summer and winter, especially the secondary ions (SO42−, NO3 and NH4+). Besides, the ratio of OC/EC in PM2.5 was greater than two, indicating serious secondary pollution in this area. The NO3/SO42− ratio (< 1) suggested that fixed sources made important contributions. The toxicological results showed that PM2.5 in the summer and winter significantly inhibited cell viability (p < 0.01) and induced intracellular reactive oxygen species (ROS) production (p < 0.01). Moreover, the viability inhibition in A549, Sh-Sy5y, and HepG2 cells was more prominent in summer, especially at high PM2.5 (400 μg/mL) (p < 0.05), and the induction of reactive oxygen species (ROS) in A549 and Sh-Sy5y cells was also more evident in summer. Such seasonal differences might be related to the variations of PM2.5 components.

Graphical Abstract

1. Introduction

Over the past decade, China has been suffering from severe air pollution due to rapid economic and heavy industry development. Haze pollution episodes occurred frequently in city-clusters such as the Beijing Tianjin-Hebei Region, the Yangtze River Delta (YRD), and the Pearl River Delta. Fine particulate matter (PM2.5) has received extensive attention due to its important role in global climate and its adverse effects on air quality and terrestrial and aquatic ecosystems, especially on human health [1,2]. Numerous studies have indicated that exposure to PM2.5 was associated with many health issues, such as the onset or development of respiratory diseases, increased morbidity, and mortality of cardiovascular illnesses [3,4]. The Global Burden of Disease Study showed that PM2.5 was the seventh largest important death risk factor in the world and the fourth largest important death risk factor in China [5,6].
PM2.5 is consisted of carbonaceous cores with various absorbed chemical compounds, such as metals, organic compounds, salts, and biological components (e.g., toxins and pollen) [7]. Considering the chemical heterogenicity of PM2.5 and the complex interactions among multiple factors, including particle size, composition, source, and meteorological conditions [8,9], only PM2.5 mass concentration could not account for its comprehensive effects on human health. Therefore, the adverse health effects of PM2.5 are thought to largely depend on particle-associated contaminants. Recent epidemiological analysis and animal studies have verified that particle-bound metals were relevant to the increase in cardiovascular mortality and morbidity, and could easily cause chronic poisoning to different human organs and lung/nasal cancer after long-term exposure [10,11,12]. Oxidative damage in cells and cell death were demonstrated to be caused by transition metal elements such as V, Ni, Cd, Cu, and Zn [13].
Wang et al. and Weber et al. also found that polycyclic aromatic hydrocarbons (PAHs) and quinones in PM2.5 resulted in reactive oxygen species (ROS) production [14,15]. In addition, water-soluble ions (e.g., SO42− and NO3) in PM2.5 would change the pH of the exposure solution and affect cell viability [16].
An in vitro study is a cost and time effective method to evaluate the toxicity of chemicals. PM2.5 can be transported into human body mainly through inhalation [17], and the lung is the major exposed/contacted organ. The human lung epithelial carcinoma cell line (A549) has been widely used to examine the cytotoxic mechanisms resulted from PM2.5 exposure [18,19]. Once entering into system circulation, PM2.5 could be accumulated in other human organs and produce adverse effects. Since the liver is the primary accumulation and detoxification organ, the human hepatocellular liver carcinoma cell line (HepG2) is a rational choice for indicating potential hepatotoxicity and has been used as a tool for studying inflammatory response, genotoxicity, oxidative stress, mitochondrial dysfunction, and apoptosis [20]. Moreover, the central nervous system (CNS) was also proposed as a target organ of airborne pollutants. PM exposure may lead to neurodevelopmental disorders and neurodegenerative diseases, including autism spectrum disorder [21], Alzheimer’s disease [22], and Parkinson’s disease [23]. The human neuroblastoma cell line (Sh-Sy5y), originated from bone marrow, is known to be one type of the most sensitive cells to oxidative stress [24]. However, only a few studies focused on the toxicity of PM2.5 to different cell models.
Nanjing is one of the fastest growing megacities in the YRD, and continuous industrialization aggravates its air pollution and haze occurrence. Since seasonal differences exist in the compositions of particulate matter in the same area—especially between summer and winter—which would affect PM2.5 cytotoxicity [25], temporal differences should be taken into consideration when evaluating the risks of regional PM2.5. In this study, we first collected the PM2.5 samples in both summer and winter from the northern suburbs of Nanjing, analyzed the major components in PM2.5 (including heavy metals, water-soluble ions, organic carbon (OC), and elemental carbon (EC)), and investigated the cytotoxicity (cell viability) of PM2.5 on A549, Sh-Sy5y, and HepG2 cells. Considering that the HepG2 cells contain higher levels of metabolic enzymes, which may be due to the fact that HepG2 cells have metabolic capabilities and cannot accurately reflect the oxidative stress of particulates [26], we chose the A549 cell line and the Sh-Sy5y cell line for the oxidative damage test. Our results could provide scientific basis for the development of health risk assessment and health protection measures in Nanjing.

2. Materials and Methods

2.1. PM2.5 Collection

PM2.5 were collected in the campus of Nanjing University of Information Science and Technology (32°12′9″ N, 118°42′49″ E), which is surrounded by chemical companies, residential areas, and farmland, and is 1 km from the freeway. The sampling site is located at the top of the library, about 25 m above the ground and without high-rise buildings around (Figure 1). Two seasons were chosen for PM2.5 sampling (33 samples for summer, 32 samples for winter): The summer sampling was conducted from June to August 2016, and the winter sampling was from December 2016 to February 2017. The sampling time was from 9:00 a.m. to the next 7:00 a.m. A high-volume air sampler (Tisch Environmental, Cleves, OH, USA) was used to collect PM2.5 samples with a flow rate of 1.13 m3/min. PM2.5 were collected by a quartz filter (203 mm × 254 mm, Whatman, UK). Before sampling, all quartz filters were placed in a muffle furnace at 450 °C for 4 h to remove any organic matter and wrapped with aluminum foil within a desiccator for 24 h. Similarly, the quartz filters were desiccated after collection, and each was weighed three times. The difference in filter mass before and after sampling was recorded as the mass of PM2.5 collected. All the PM2.5 filters were then stored at −20 °C in the dark for further analysis. Filter blanks were also prepared at the same time and in the same way.

2.2. PM2.5 Chemical Analysis

A strip of 1 cm × 2 cm was cut from each filter (33 samples for summer, 32 samples for winter), and digested with a mixture of 5 mL HNO3 (69%) and 1 mL HF. The acid digestion procedure was conducted using a microwave digestion instrument (GEM Corpooration, Charlotte, NC, USA). The suspension was then filtered, diluted with ultrapure water to a volume of 45 mL, and stored at 4 °C for analysis. Thirteen metal elements (Al, As, Ba, Cd, Co, Cr, Cu, Mn, Ni, Pb, Sr, V, and Zn) were detected by inductively coupled plasma mass spectrometry (ICP-MS, Thermo, USA). Seven blank membranes and two standard reference materials (GBW07403, GBW08401) were treated by the same digestion method. The recovery rates of all elements were within 100 ± 15%.
A part of the extracted PM2.5 was prepared for the analysis of water-soluble ions, including Na+, K+, Mg2+, Ca2+, NH4+, F, Cl, NO3, and SO42−. They were first extracted in 45 mL of ultrapure water, and then they ultrasonicated for 20 min in an ice bath. This step was repeated three times. Then, the suspension was filtered with a 0.22 μm filter to obtain the water-soluble ions. The cations were determined by a methanesulfonate elution method using a Dionex ICS-3000 ion chromatograph equipped with an Ion Pac CS16 (5 mm × 250 mm) type separation column, and the anions were analyzed by a KOH elution method using a Dionex ICS-2000 ion chromatograph with an Ion Pac (4 mm × 250 mm) separation column. For both anions and cations, conductivity detectors were used, and the flow rate of eluent was 1 mL/min. The detection limit for each ion was less than 0.01 μg/m3.
Besides, PM2.5 samples (33 samples for summer, 32 samples for winter) were collected from each filter by using a 17-mm-diameter ring cutter. The concentrations of OC and EC in the samples were quantitatively determined using a Sunset Lab model 4 organic carbon analyzer (Sunset Lab., Tigard, OR, USA).

2.3. Cytotoxicity

2.3.1. PM2.5 Preparation and Cell Culture

In tandem with the chemical analysis, PM2.5 samples were also prepared for the determination of cytotoxicity. A 2 cm × 18 cm strip was cut from each filter (33 samples for summer, 32 samples for winter), immersed in 150 mL of ultrapure water, and ultrasonicated for 20 min in an ice bath (repeated three times). The solution was filtered, and then the collected solution was freeze-dried in vacuum to obtain the extracted particles [27]. We thought the substance obtained by ultrasonic extraction was only PM2.5, regardless of the decomposition of quartz filter membrane. In this experiment, particles collected from the same season were grouped together, and a 5 mg/mL of particle stock solution was then prepared for each season by Phosphate Buffer Saline (PBS, KeyGEN BioTECH, Suzhou, China).
Three human cell lines—the human lung epithelial carcinoma cells (A549), the human hepatocellular liver carcinoma cells (HepG2), and the human neuroblastoma cells (Sh-Sy5y)—were used in this study. They were all obtained from the School of Public Health of Nanjing Medical University. The cells were cultured in a Dulbecco’s modified Eagle medium (DMEM) (Gibco, Grand Island, NY, USA) containing 10% fetal bovine serum (Gibco, USA) and 1% streptomycin antibiotic. These cells were maintained in a humidified incubator (Thermo, USA) at 37 °C with 5% CO2. At about 80% cell confluence, the cells were gently digested with 0.25% trypsin (Gibco, Grand Island, NY, USA) for cytotoxicity tests.

2.3.2. Cell Viability

The A549 and HepG2 cells were used to examine the effects of PM2.5 on cell viability. The cells in the logarithmic growth phase were collected, seeded in 96-well plates at the specific densities (each 5000/well), and incubated in the CO2 incubator for 24 h. Afterward, the culture medium was replaced with the serum-free DMEM medium containing different levels of PM2.5: 50, 100, 200, and 400 μg/mL (corresponding to 16, 31, 62, 125 μg/cm2). There were 6 replicates for each treatment. The blank group and the control group were also prepared using PBS or serum-free DMEM medium instead of PM2.5. After 24 h of incubation, 10 μL of CCK-8 (Beyotime Biotechnology CO., Ltd., Shanghai, China) was added to each wel, and continually incubated at 37 °C for 2 h. The optical density (OD) of the final solutions was measured by a multi-function microplate reader (Molecular Devices CO., USA) at 450 nm. The viability of cells was calculated using Equation (1):
Viability ( % ) = OD sample OD blank OD control OD blank

2.3.3. ROS Assay

The A549 and Sh-Sy5y cells were chosen for an intracellular reactive oxygen species (ROS) assay. Similarly, the cells in the logarithmic growth phase were inoculated into 6-well plates (each 2 × 10⁵/well) and placed in the CO2 incubator at 37 °C for 24 h. Then the cells were exposed to the PM2.5 solutions. There were three PM2.5 treatments (50, 100, and 200 μg/mL) (corresponding to 10, 21, and 42 μg/cm2) and a control group, with three replicates for each treatment. After another 24 h, the cells were labeled with an oxidative-sensitive fluorescent probe DCFH-DA (10 μmol/L) for 25 min in the dark. The fluorescence intensity was finally measured by a flow cytometry (Beckman, Miami, FL, USA) with excitation wavelength at 488 nm and emission wavelength at 525 nm.

2.4. Data Analysis

Cytotoxicity data were used to calculate the LC20 and LC50 (IBM Statistics SPSS 21.0), the concentrations of PM2.5 killing 20% and 50% of the cells, respectively. Statistical analysis was performed by the Pearson’s correlation test, T-test, and One-Way Anova test (IBM Statistics SPSS 21.0). p < 0.05 implies statistically significant, and p < 0.01 indicates extremely significant. The experimental results are expressed as mean ± standard deviations.

3. Results

3.1. PM2.5 Mass Concentrations and Chemical Characteristics
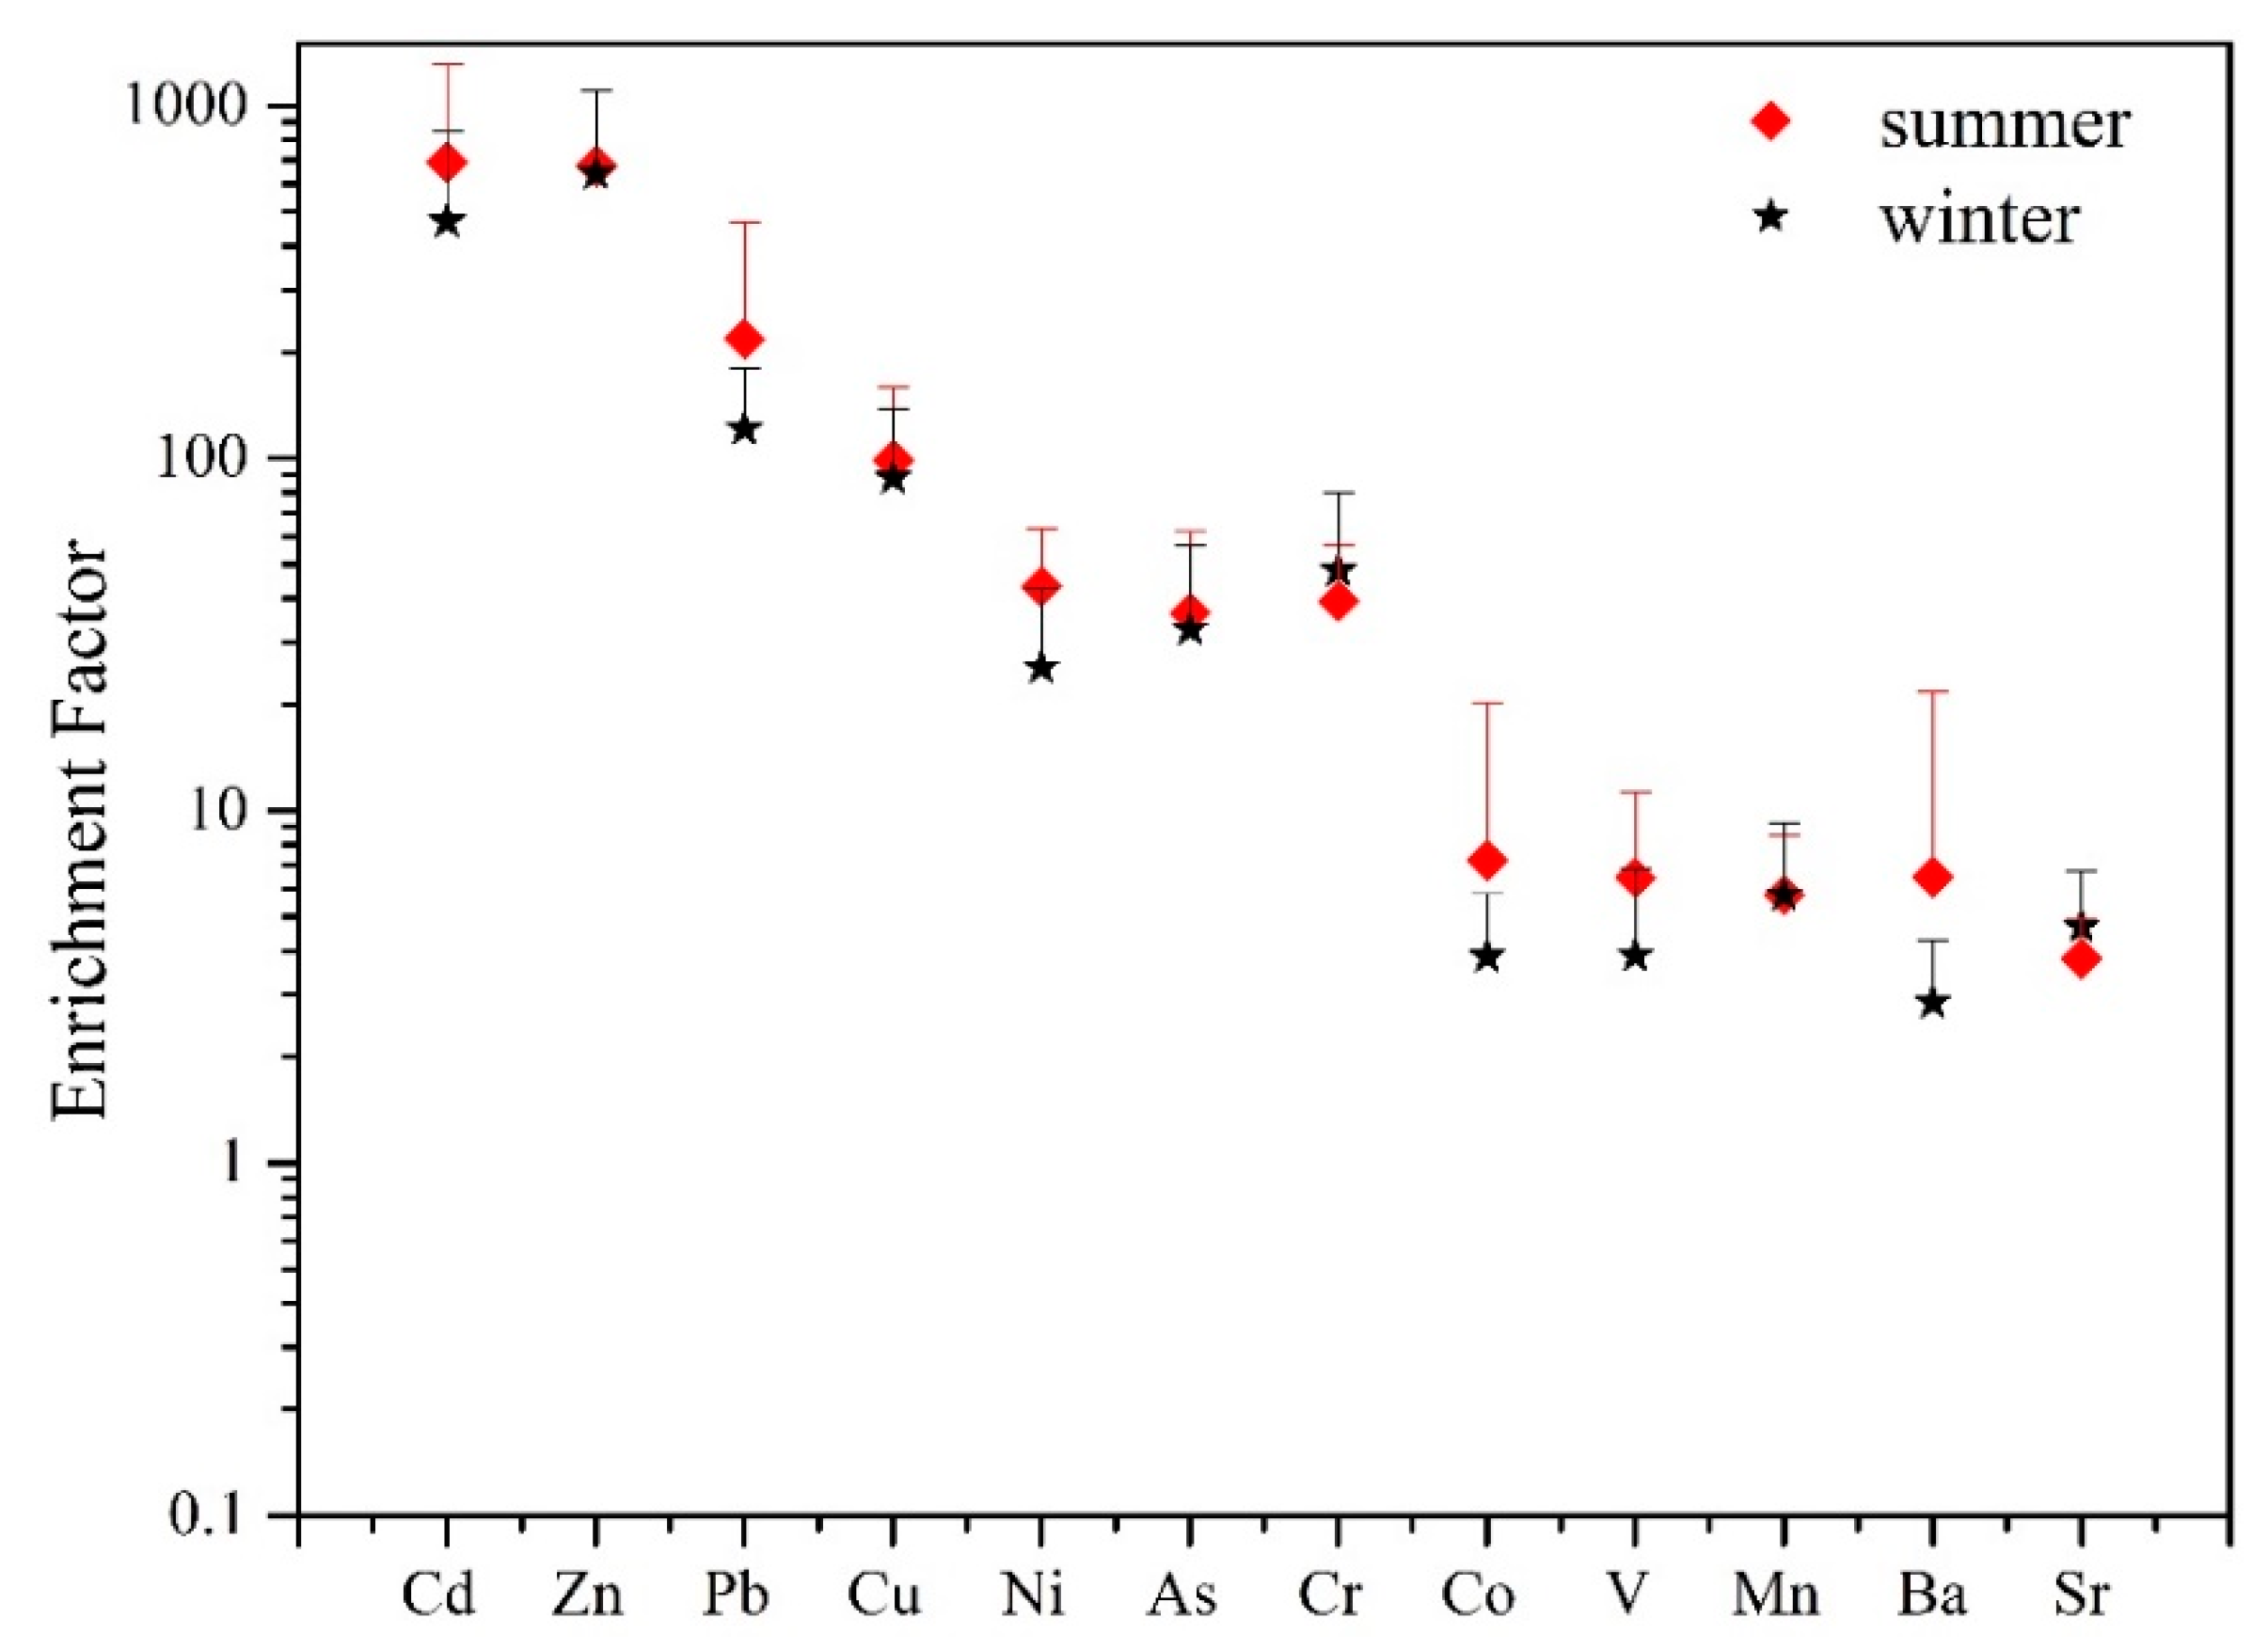
The daily average concentrations of PM2.5 in summer and winter 2016 were 51.3 ± 21.4 μg/m3 (n = 33) and 62.1 ± 21.5 μg/m3 (n = 32), respectively. Compared with previous observations of PM2.5 in the northern suburbs of Nanjing (the average observed values of summer and winter were 69.8–82.9 μg/m3, 122.4–152.1 μg/m3), PM2.5 concentrations in summer and winter 2016 were decreased by about 26.5%–38.1% and 49.3%–59.2%, respectively [28,29]. Such reductions suggest that the implementation of environmental protection measures has made some progress in recent years, but there is still a long way to go compared with the daily average standards (PM2.5: 25 μg/m3) proposed by the World Health Organization.

3.1.1. Heavy Metals

The average concentrations of heavy metals in PM2.5 during our sampling periods are shown in Table 1. These concentrations varied greatly among different elements and seasons, in which Al and Zn were the major elements in both summer and winter PM2.5 samples. The average concentrations of Al and Zn were 588.85 ± 284.99 ng/m3 and 678.16 ± 325.86 ng/m3 in summer, and they were 755.05 ± 738.39 ng/m3 and 724.40 ± 438.32 ng/m3 in winter. Correspondingly, these two elements accounted for 85.0–88.9% of the metal concentration in PM2.5. These metal mass fractions are consistent with the observations by Qi et al. in Nanjing [30]. Generally, Al is a quintessential crustal element, and its existence in atmosphere was mainly derived from soil and dust. In contrast, the main sources of elemental Zn were industrial smelting [31] and exhaust emissions from motor vehicles [32]. Our sampling point is located to the west of a traffic pollution zone (Nanjing Jiangbei Expressway) on the northwest and southwest sides of many chemical plants. Therefore, Zn in PM2.5 had a relatively high content and came from a wide range of pollution sources. In addition, the concentrations of As in summer (3.37 ± 2.31 ng/m3) and winter (3.05 ± 1.90 ng/m3) were close to the Environmental Air Quality Standard GB3095-2012 (As: 6 ng/m3). Given the high health risk of As for human beings [33], it is critical to closely monitor As concentration levels and environmental fates. Though Fe, another major crustal element [34], has not been determined in this study, the heavy metals detected accounted for 2.8–3.2% of the PM2.5 mass concentration. Higher percentages of metals were found here than those reported previously [35], indicating that metal pollution in this area need to be controlled locally and strictly.
The metal enrichment factor (EF) was also calculated to differentiate the anthropogenic sources from natural process, using Al as the reference element according to Senaratne’s study [36]. As shown in Figure 2, the EF values of Zn, Cd, and Pb were far greater than 100 (except for Pb in winter), indicating that these elements were heavily enriched and strongly affected by human activities. Previous studies have demonstrated that Cd and Zn usually originated from metal smelting, electric batteries, electroplating, pigments, building materials, and coatings [37]. The Pb content in PM2.5 was higher in summer than in winter (p < 0.05), which is consistent with the observations of Liu Fengling in Nanjing and which may be due to the difference in industrial emissions during the sampling period [28]. Cu, Cr, As, and Ni also had EF values greater than 10, indicating that anthropogenic sources made an important contribution to these PM2.5-bound elements. In contrast, The EF values of V, Mn, Co, Ba, and Sr were all less than 10, which is consistent with the findings that these elements were commonly from both human activities and nature emissions [38]. The correlation between the mass concentration of heavy metal elements (average values of summer and winter samples) are shown in Table 2. A correlation coefficient of 0.470 (p < 0.01) was noted between As and Sr, and both were generally considered to be trace elements of coal combustion, especially from coal-fired power plants [39,40]. The correlation coefficients between Pb with Cu, Mn and V were 0.452, 0.394 and 0.568 (p < 0.01), respectively. Pb, Mn, and Cu were thought to be signs of traffic emissions [41,42]; the use of fuel additives and combustion of fuel will lead to the emissions of these metals [43]. These results suggest that human activity, especially industrial activity, traffic transportation, and dust, has led to severe metal pollution in PM2.5 at the sampling site.

3.1.2. Water-Soluble Ions
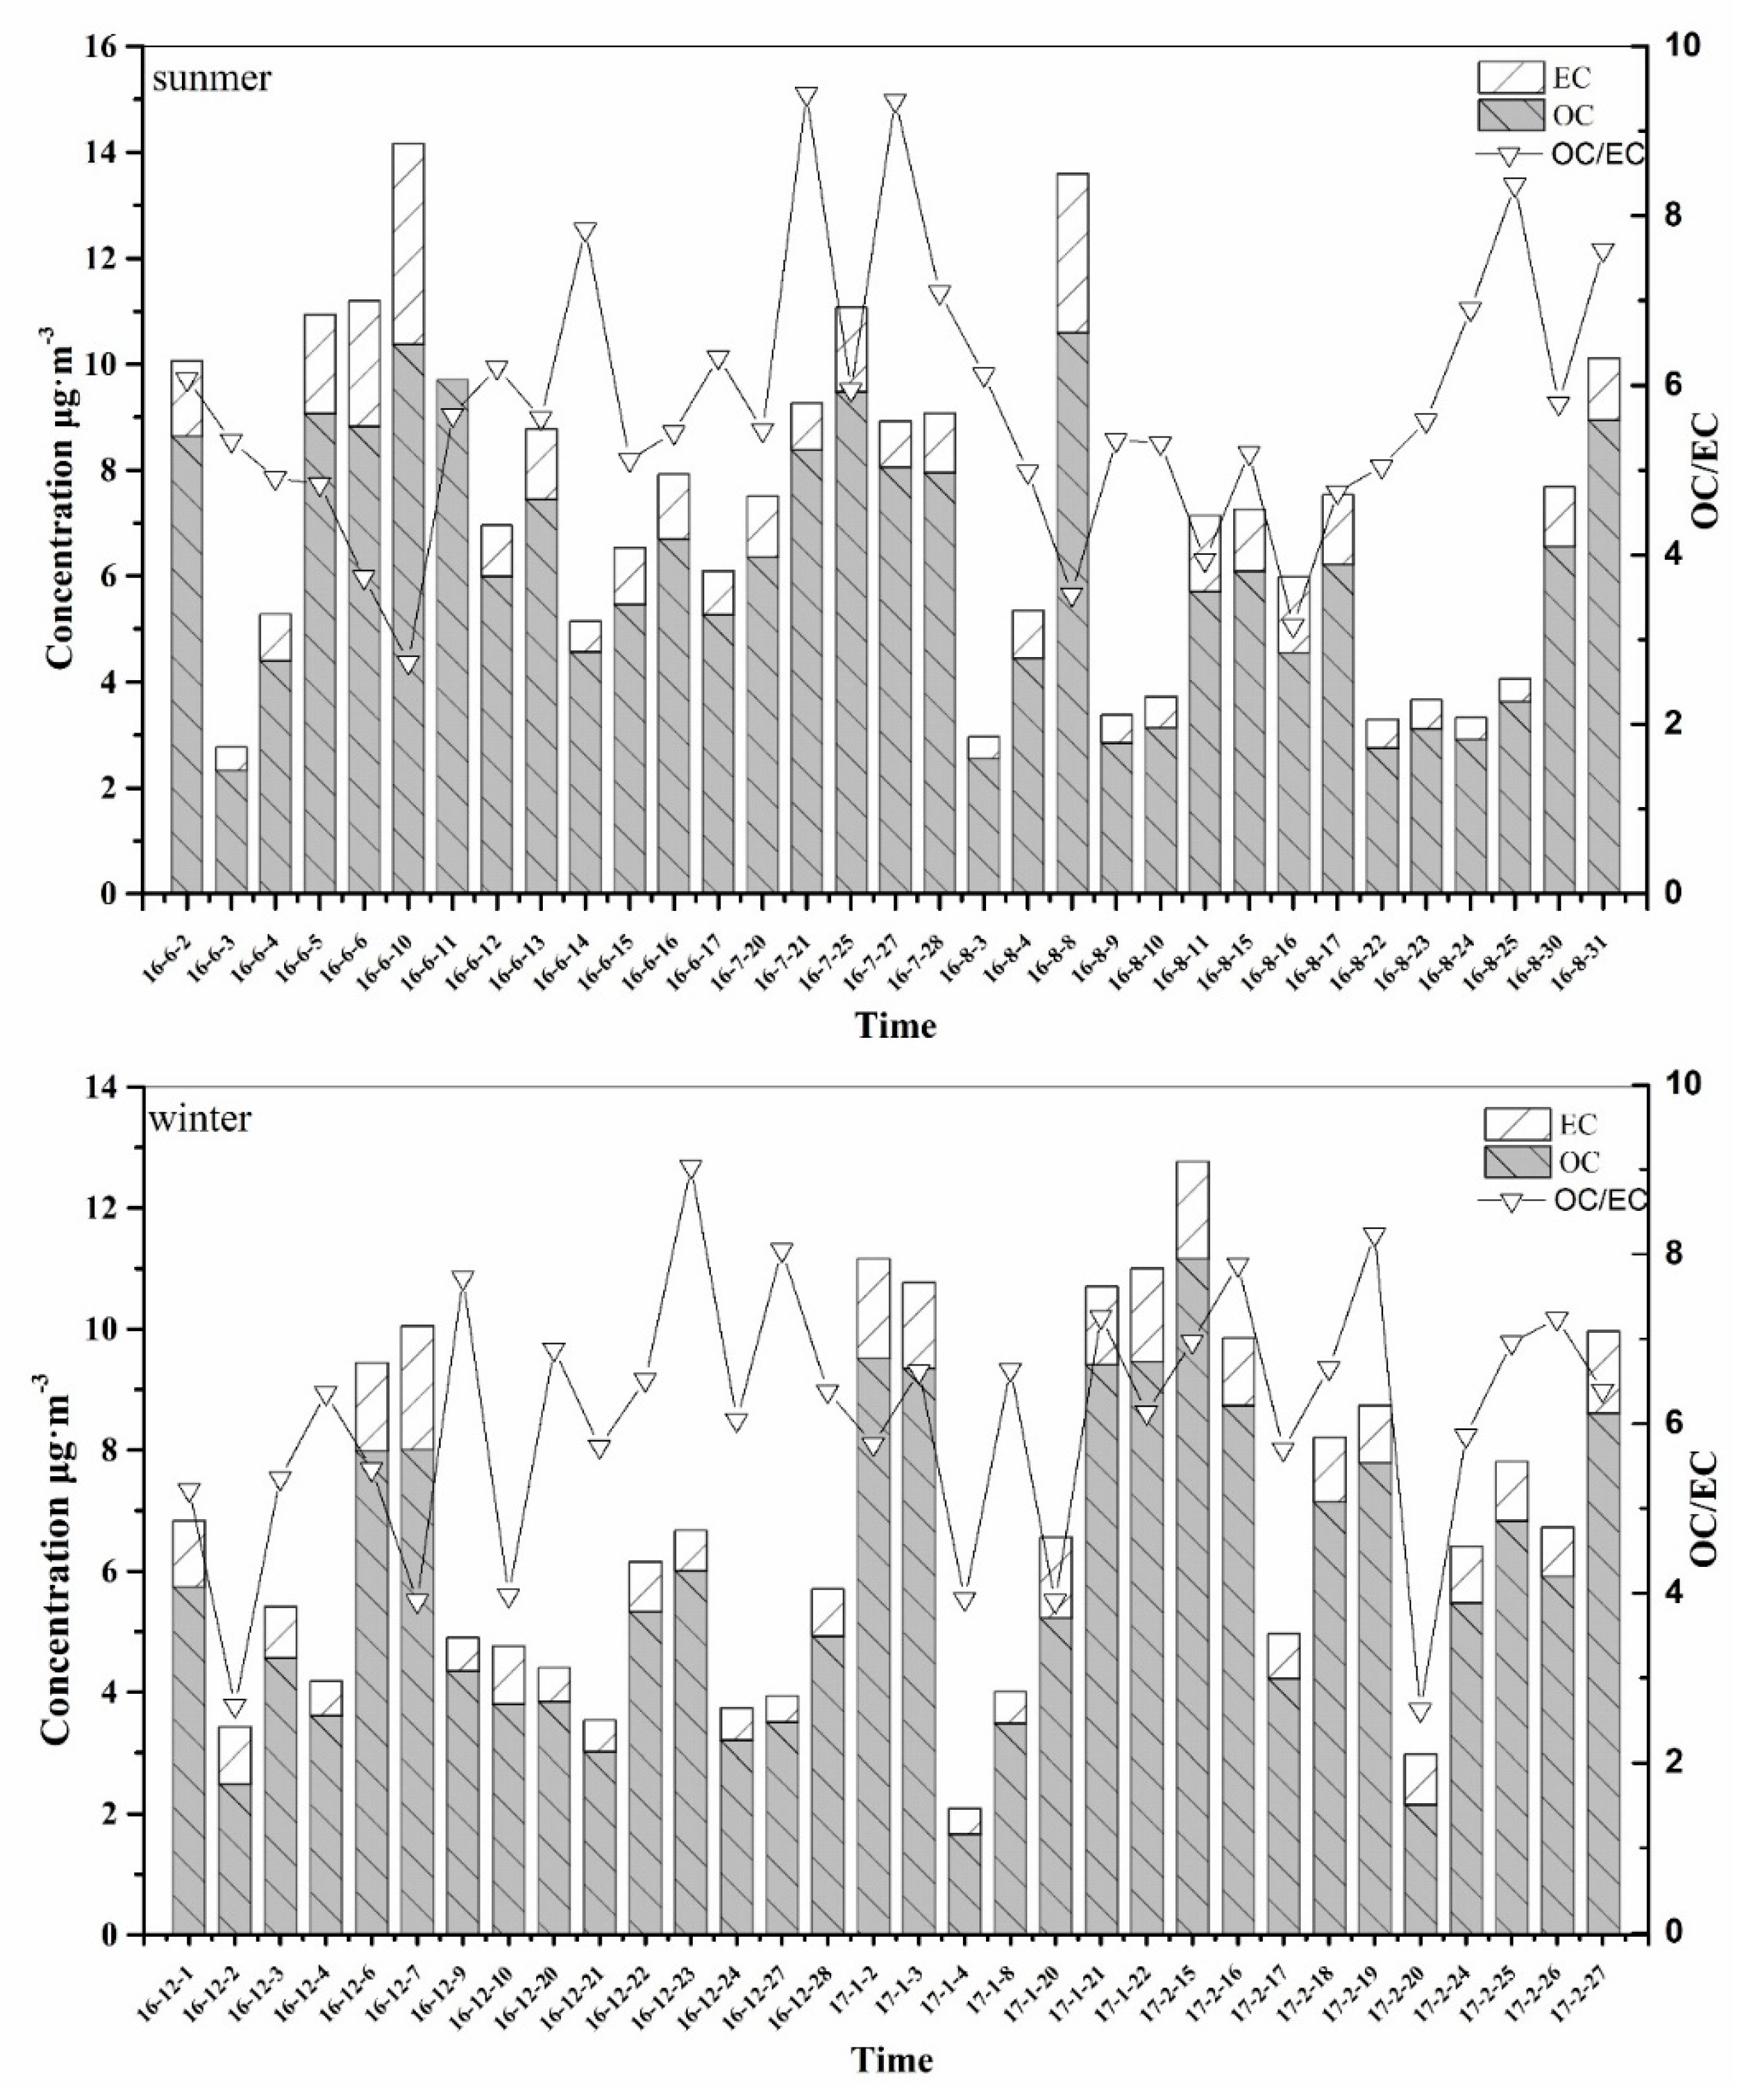
Figure 3 shows the proportions of water-soluble ions (WSI) in PM2.5. For summer and winter particles, the ionic components accounted for 31.4% and 38.6% of the total mass of PM2.5, respectively. Compared with other regions, the proportion of WSI was lower than Zhengzhou’s 66.1% [44], higher than Xiamen’s 24.4% [45], and close to Beijing’s 38.6% [46]. The concentrations of nine ionic species followed the order of SO42− > NH4+ > NO3 > Cl > Mg2+ > K+ > Na+ > Ca2+ > F in summer, while the concentrations followed the order of SO42− > NO3 > NH4+ > Cl > Na+ > Ca2+ > K+> Mg2+ > F in winter. Among these ions, SO42−, NO3, and NH4+ (referred to as SNA) generally had the highest concentrations, and the sums of SNA made up 85.7% and 77.8% of the measured water-soluble ions in summer and winter, respectively. Generally, these three ions were rarely discharged from primary sources, as they were mainly from secondary reactions instead [25]. Therefore, the high contents of SNA in PM2.5 indicated the high frequency of secondary pollutions in this area. Besides, the concentration of SO42− in summer was higher than that in winter (p < 0.01), which may be explained by the enhanced photochemical oxidation of SO2 during warm periods. In contrast, the NO3 concentration was lower in summer, which may be conducive to the effective conversion of semi-volatile nitrate to gaseous state at high temperature. In addition, significant differences were observed for Na+ and Ca2+ ion concentration (p < 0.01) between summer and winter particles. Higher percentages of these two ions in winter may be associated with crustal dust or construction around the sampling point, and they could hardly be dispersed under unfavorable meteorological conditions during cold weather [47]. The ratio of NO3/SO42− was also used to explore the sources of PM2.5 pollutant. It is considered that the mobile source is dominant when this ratio is greater than 1, while the fixed source is dominant when the ratio is less than 1 [48]. The ratios of NO3/SO42− in summer and winter particles were 0.38 and 0.94, respectively, indicating again the major contribution of fixed sources (many chemical plants around) in this area [49].

3.1.3. OC and EC

As shown in Figure 4, the average concentrations of OC and EC were 6.1 ± 2.5 μg/m3 and 1.2 ± 0.7 μg/m3 in summer, and 5.8 ± 2.6 μg/m3 and 1.0 ± 0.4 μg/m3 in winter, respectively. These carbonaceous compounds accounted for 10.8–14.3% of total PM2.5 mass. Our results were comparable to the reported values in other major Chinese cities, that the PM2.5-associated OC and EC concentrations were 7.8 and 4.4 μg/m3 in Hong Kong [50], 7.2 and 2.6 μg/m3 in Shanghai [51], and 12.1 and 5.4 μg/m3 in Beijing [52], respectively. Previous studies have also examined these carbonaceous compounds in Nanjing: 13.8 and 5.3 μg/m3 in 2001 [53], 15.7 and 10.4 μg/m3 in 2007 [54], and 13.5 and 3.4 μg/m3 in 2012–2013 [55]. A decrease in OC/EC contents was observed on a yearly basis, implying that air pollution control measures had obvious effects. Different from the PM2.5 levels discussed above, the carbonaceous pollution in summer was higher than that in winter (p < 0.001), which may be due to the factories working hours near the sampling point.
The correlation coefficients between OC and EC in summer and winter were 0.785 (p < 0.01) and 0.810 (p < 0.01), respectively, showing that strong homology existed in the emission of carbonaceous aerosols in different seasons. It has been proposed that the ratio of OC to EC could be used to identify the source of carbonaceous aerosols, the variation characteristics, and the formation of secondary organic carbon (SOC) [56]. The ratios of OC/EC varied in the range of 2.7–9.4 in summer and 2.6–9.0 in winter, respectively. It can be seen that all these values were greater than 2, indicating that secondary pollution was common in this area and came mainly from coal combustion and exhaust emissions [57]. Considering the importance of SOC to visibility, climate, and human health, the average concentrations of SOC have also been analyzed based on the minimum value of OC/EC [58], and they were 2.9 ± 1.5 μg/m3 in summer and 3.3 ± 1.5 μg/m3 in winter. Such seasonal variation may be due to lower temperature in cold periods, which could promote the generation of SOC [59].

3.2. PM2.5 Cytotoxicity

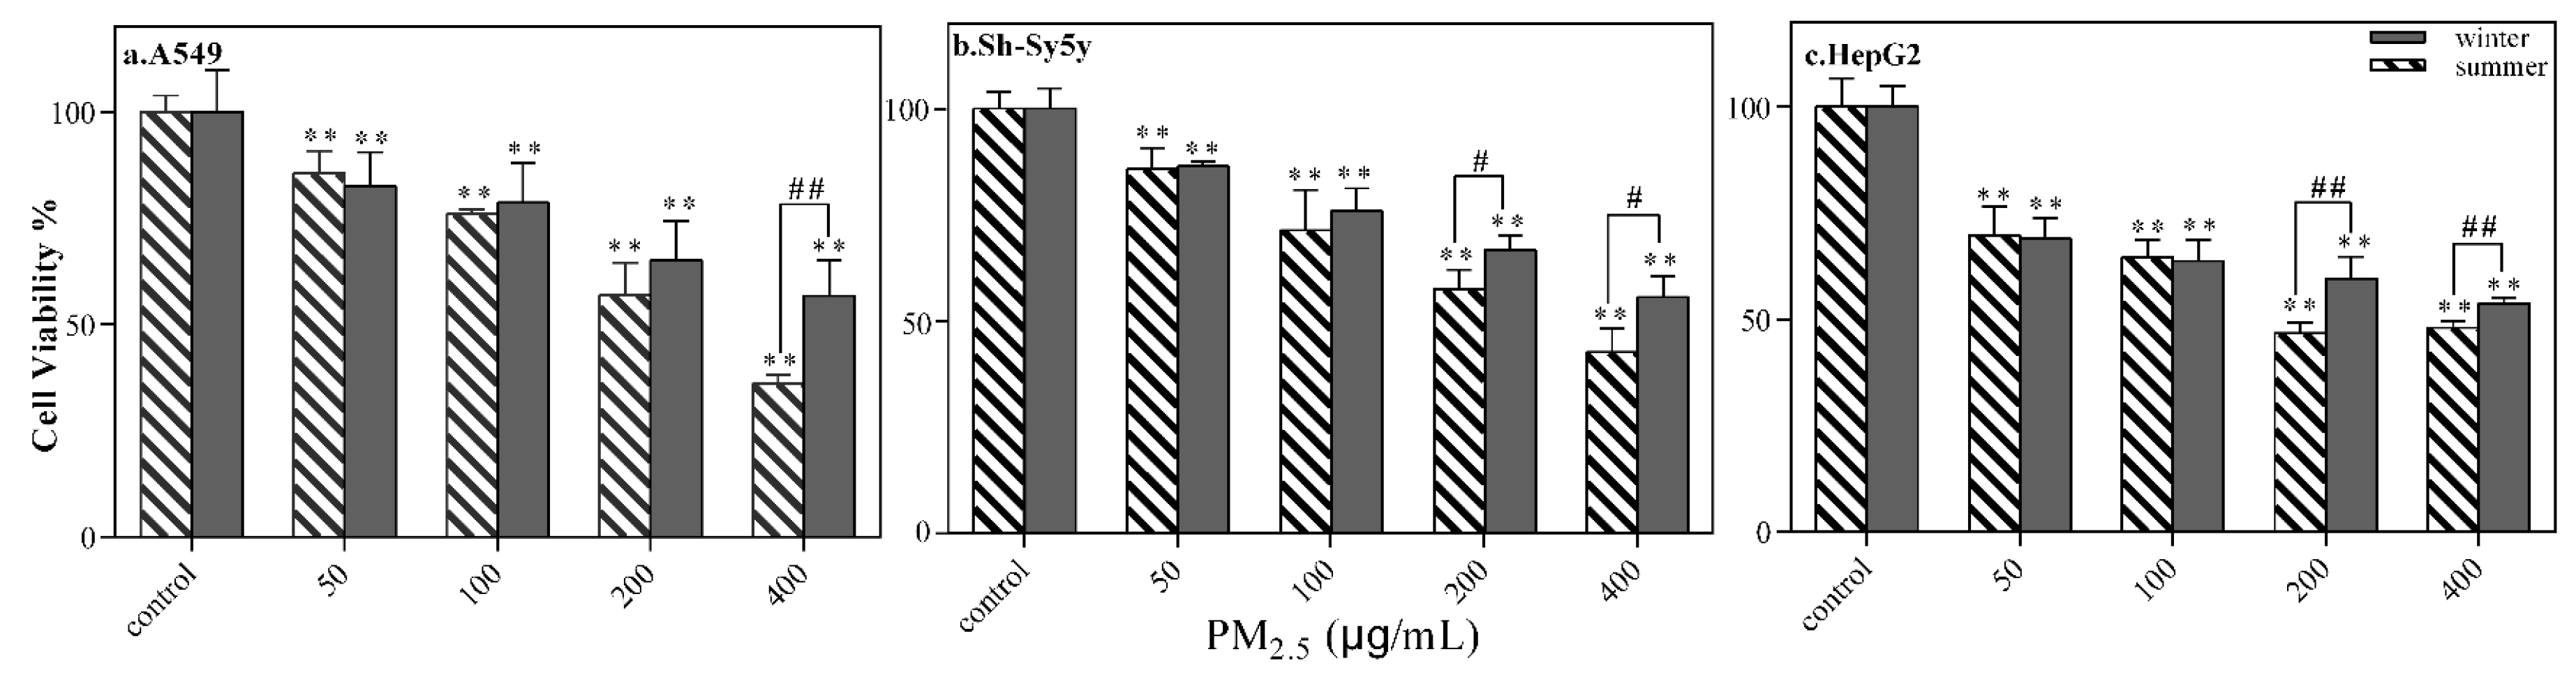
3.2.1. Cell Viability

The cell viability of three human cell lines exposed to different concentrations (50, 100, 200, and 400 μg/mL) of PM2.5 is shown in Figure 5. It is clear that dose-effect relationships (p < 0.01) existed in all treatments. At lower PM2.5 levels (50 μg/mL), there was no significant difference (p > 0.05) in cell viability between summer and winter PM2.5. When the concentrations of PM2.5 were above 200 and 100 μg/mL, respectively, significantly higher levels of cell viability (p < 0.05) were observed in winter PM2.5 for A549, Sh-Sy5y, and HepG2 cells. Correspondingly, as shown in Table 3, the calculated LC50 values were higher in winter (323 μg/mL for A549 cells, 312 μg/mL for Sh-Sy5y cells, and 268 μg/mL for HepG2 cells) than those in summer (274 μg/mL for A549 cells, 279 μg/mL for Sh-Sy5y cells, and 205 μg/mL for HepG2 cells). Similar results were obtained from the LC20 values, indicating that the cytotoxicity caused by PM2.5 was higher in summer. Previous studies have shown that the toxicity of particulate matter may be related to the contained elements and organic components [60,61,62]. First, as shown in Table 1, almost all elements (except for Cr or Sr) had higher mass fractions in summer than in winter, especially for Ba, Co, and Pb (2.59, 2.20, and 2.18-fold differences, respectively). Perrone et al. found that the chemical components of PM samples, such as Cr, As, Cu, and Zn, were highly correlated with the decrease of A549 cell viability [25]. Metal components were demonstrated to exert adverse effects by producing oxidative stress and inflammatory factors, resulting in cell membrane lipids, protein and DNA damage, and then cell death [14,61]. Second, the mass fractions of OC and EC in summer were also higher than that in winter. OC is a complex mixture of polycyclic aromatic hydrocarbons, normal paraffins, organic acids, hydroxy compounds, and heterocyclic compounds, and EC consists mainly of pure carbon, graphitic carbon, and some relatively non-volatile organic substances such as coke and tar [63,64]. The seasonal differences in carbonaceous components might be another important reason for the relatively high cytotoxicity of PM2.5 in summer. Additionally, the PM2.5 samples in summer showed higher percentages of SO42−, which might affect the acid-base balance of the exposure solution and, thereby, affect cell viability [15].
For A549, Sh-Sy5y, and HepG2 cells, the decrease in cell viability became significant when the concentration of PM2.5 was above 50 μg/mL. Such a decrease was more precipitous for HepG2 cells at a higher PM2.5, with a few exceptions. For example, at a summer PM2.5 of 100 μg/mL, the cell viability was 76% in A549 cells and 71% in Sh-Sy5y cells, as compared with 65% in HepG2 cells. Therefore, the estimated LC20 and LC50 values of HepG2 cells were lower than those of A549 and Sh-Sy5y cells, indicating that the HepG2 cells were more sensitive to PM2.5 exposure.

3.2.2. ROS Induction

It has been widely recognized that the induction of free radicals is an important mechanism of fine particles toxicity [65,66]. Excessive free radical production may disturb the dynamic balance between oxidants and antioxidants, and it may also damage normal human cells. The content of ROS is considered as an important indicator of the degree of oxidative damage. According to the results in the previous section, the cell viability was less than 50% when the PM2.5 concentration reached 400 μg/mL. Therefore, in order to collect enough cells for ROS analysis, A549 and Sh-Sy5y cells were exposed to three different levels of PM2.5 (50, 100, and 200 μg/mL). The results, as measured by the DCFH-DA assay, are presented as the relative increase in viable cells with respect to non-exposed controls (Figure 6). Whatever the cell lines and seasons, the intracellular ROS production at the lowest tested PM2.5 was significantly higher than that in the control group (p < 0.01) and increased continuously with increasing exposure concentration. These trends are consistent with the results of previous studies [67,68]. For Sh-Sy5y cells, the production of ROS was higher in summer than that in winter at the same dose level (except for Sh-Sy5y cells at 50 μg/mL, p < 0.05), especially at higher levels of PM2.5, indicating that the summer PM2.5 caused more serious oxidative damage to the cells. For A549 cells, the production of ROS was obviously higher in summer than that in winter only at 100 μg/mL (p < 0.05). Intracellular ROS production is mainly due to the presence of metal elements, other inorganic, and organic chemicals [69,70] adsorbed on particle surfaces. Previous extensive studies have shown that metal elements such as Pb, Ni, V, Cu, etc., were significantly related with the production of ROS (R > 0.70, p < 0.05) [71,72,73]. Saffari et al. also found that there was a strong correlation between OC content and ROS production (R = 0.79, p < 0.05) [74]. As discussed above, the mass fractions of most metals and carbonaceous components were higher in summer than those in winter samples, which might explain the higher induction of ROS after summer PM2.5 exposure. Such inter-seasonal differences in ROS production were similar with the results of cell viability. Although lower PM2.5 pollution levels are often observed in summer, the health risks of particles should not be underrated due to the higher proportions of toxic components. Moreover, there was no significant difference in oxidative damage between A549 and Sh-Sy5y cells (p > 0.05). Once PM2.5 has entered the systemic circulation, human neuroblastoma cells are also important and sensitive targets.

4. Conclusions

The average concentrations of PM2.5 in northern suburbs of Nanjing were 51.3 ± 21.4 μg/m3 in summer and 62.1 ± 21.5 μg/m3 in winter. Among multiple components, heavy metals, water-soluble ions, and carbonaceous compounds accounted for 2.8–3.2%, 31.4–38.6%, and 10.8–14.3% of total PM2.5 mass. Over half of heavy metals (Zn, Cd, Pb, Cu, Cr, As, and Ni) had EF values greater than 10, indicating that these elements came mainly from human activities. SO42−, NO3, and NH4+ made up 77.8–85.7% of the measured water-soluble ions in PM2.5; combined with the OC/EC ratio greater than two, it is clear that secondary pollution occurred frequently in this area. Moreover, the ratio of NO3/SO42− (<1) implied the important contributions of fixed sources.
PM2.5 exposure led to a decrease in cell viability and an induction of ROS in cells, both of which exhibited good dose-effect relationships. However, higher cytotoxicity was observed after summer PM2.5 exposure as compared with the winter PM2.5 samples. Such seasonal variation may be explained by the variations in PM2.5 components. Different from PM2.5 levels, both the metal and carbonaceous fractions in summer PM2.5 were higher than those in winter particles. Of course, the chemical composition of PM2.5 is extremely complex, and the cytotoxicity of PM2.5 may also be related to undetermined organic pollutants, which together generate the observed joint effects. Therefore, further research is needed to characterize the contributions of different components to PM2.5 toxicity. At present, the method of ultrasonic extraction of particulate matter with water may cause some losses to the extraction of some insoluble parts. In future experiments, studies on the extraction efficiency of different methods for the extraction of particulate matter should be added.

Author Contributions

Data curation, P.G., W.L., B.H., and Y.Y.; funding acquisition, M.C.; investigation, Z.L. and X.M.; writing—original draft, K.Z. and M.C.; writing—review and editing, D.N., Y.W., X.G., and J.H.

Funding

This research was funded by the National Natural Science Foundation of China (Grant No. 21577065, 91543115), the National Key Research and Development Program of China (2018YFC0213802), National Development and Reform Commission (2014078), Environmental Protection Department of Jiangsu Province, China (2017022), International ST Cooperation Program of China (ISTCP) (Grant No. 2014DFA90780), and the APC was funded by the National Natural Science Foundation of China.

Acknowledgments

The authors sincerely acknowledge financial support from the National Natural Science Foundation of China (Grant No. 21577065, 91543115), The National Key Research and Development Program of China (2018YFC0213802), National Development and Reform Commission (2014078), Environmental Protection Department of Jiangsu Province, China (2017022), and the Priority Academic Program Development of Jiangsu Higher Education Institutions.

Conflicts of Interest

The authors declare no conflict of interest.

References

  1. Kan, H.; Chen, R.; Tong, S. Ambient air pollution, climate change, and population health in China. Environ. Int. 2012, 42, 10–19. [Google Scholar] [CrossRef]
  2. Niu, X.; Ho, S.S.H.; Ho, K.F.; Huang, Y.; Sun, J.; Wang, Q.; Zhou, Y.; Zhao, Z.; Cao, J. Atmospheric levels and cytotoxicity of polycyclic aromatic hydrocarbons and oxygenated-PAHs in PM2.5 in the Beijing-Tianjin-Hebei region. Environ. Pollut. 2017, 231, 1075–1084. [Google Scholar] [CrossRef]
  3. Delfino, R.J.; Sioutas, C.; Malik, S. Potential role of ultrafine particles in associations between airborne particle mass and cardiovascular health. Environ. Health Perspect. 2005, 113, 934–946. [Google Scholar] [CrossRef]
  4. Morgan, T.E.; Davis, D.A.; Iwata, N.; Tanner, J.A.; Snyder, D.; Ning, Z.; Kam, W.; Hsu, Y.-T.; Winkler, J.W.; Chen, J.-C.; et al. Glutamatergic Neurons in Rodent Models Respond to Nanoscale Particulate Urban Air Pollutants in Vivo and in Vitro. Environ. Health Perspect. 2011, 119, 1003–1009. [Google Scholar] [CrossRef]
  5. Cohen, A.J.; Anderson, H.R.; Ostro, B.; Pandey, K.D.; Krzyzanowski, M.; Kunzli, N.; Gutschmidt, K.; Pope, A.; Romieu, I.; Samet, J.M.; et al. The global burden of disease due to outdoor air pollution. J. Toxicol. Environ. Health Part A Curr. Issues 2005, 68, 1301–1307. [Google Scholar] [CrossRef] [PubMed]
  6. Lim, S.S.; Vos, T.; Flaxman, A.D. A comparative risk assessment of burden of disease and injury attributable to 67 risk factors and risk factor clusters in 21 regions, 1990–2010: A systematic analysis for the Global Burden of Disease Study 2010 (vol 380, pg 2224, 2012). Lancet 2013, 381, 1276. [Google Scholar]
  7. Spurny, K.R. Chemical mixtures in atmospheric aerosols and their correlation to lung diseases and lung cancer occurence in the general population. Toxicol. Lett. 1996, 88, 271–277. [Google Scholar] [CrossRef]
  8. Sarnat, J.A.; Marmur, A.; Klein, M.; Kim, E.; Russell, A.G.; Sarnat, S.E.; Mulholland, J.A.; Hopke, P.K.; Tolbert, P.E. Fine particle sources and cardiorespiratory morbidity: An application of chemical mass balance and factor analytical source-apportionment methods. Environ. Health Perspect. 2008, 116, 459–466. [Google Scholar] [CrossRef] [PubMed]
  9. Dergham, M.; Lepers, C.; Verdin, A.; Cazier, F.; Billet, S.; Courcot, D.; Shirali, P.; Garcon, G. Temporal-spatial variations of the physicochemical characteristics of air pollution Particulate Matter (PM2.5–0.3) and toxicological effects in human bronchial epithelial cells (SEAS-2B). Environ. Res. 2015, 137, 256–267. [Google Scholar] [CrossRef]
  10. Gao, P.; Lei, T.; Jia, L.; Song, Y.; Lin, N.; Du, Y.; Feng, Y.; Zhang, Z.; Cui, F. Exposure and health risk assessment of PM2.5-bound trace metals during winter in university campus in Northeast China. Sci. Total Environ. 2017, 576, 628–636. [Google Scholar] [CrossRef]
  11. Satsangi, P.G.; Yadav, S.; Pipal, A.S.; Kumbhar, N. Characteristics of trace metals in fine (PM2.5) and inhalable (PM10) particles and its health risk assessment along with in-silico approach in indoor environment of India. Atmos. Environ. 2014, 92, 384–393. [Google Scholar] [CrossRef]
  12. Hu, X.; Zhang, Y.; Ding, Z.; Wang, T.; Lian, H.; Sun, Y.; Wu, J. Bioaccessibility and health risk of arsenic and heavy metals (Cd, Co, Cr, Cu, Ni, Pb, Zn and Mn) in TSP and PM2.5 in Nanjing, China. Atmos. Environ. 2012, 57, 146–152. [Google Scholar] [CrossRef]
  13. Jeng, H.A. Chemical composition of ambient particulate matter and redox activity. Environ. Monit. Assess. 2010, 169, 597–606. [Google Scholar] [CrossRef] [PubMed]
  14. Wang, S.; Ye, J.; Soong, R.; Wu, B.; Chan, A.W.H. Relationship between chemical composition and oxidative potential of secondary organic aerosol from polycyclic aromatic hydrocarbons. Atmos. Chem. Phys. 2018, 18, 3987–4003. [Google Scholar] [CrossRef]
  15. Weber, S.; Uzu, G.; Calas, A.; Chevrier, F.; Besombes, J.-L.; Charron, A.; Salameh, D.; Jezek, I.; Mocnik, G.; Jaffrezo, J.-L. An apportionment method for the oxidative potential of atmospheric particulate matter sources: Application to a one-year study in Chamonix, France. Atmos. Chem. Phys. 2018, 18, 9617–9629. [Google Scholar] [CrossRef]
  16. Huang, M.; Kang, Y.; Wang, W.; Chan, C.Y.; Wang, X.; Wong, M.H. Potential cytotoxicity of water-soluble fraction of dust and particulate matters and relation to metal(loid)s based on three human cell lines. Chemosphere 2015, 135, 61–66. [Google Scholar] [CrossRef]
  17. US Environmental Protection Agency, Office of Health and Environmental Assessment, Exposure Assessment Group. Exposure Factors Handbook; Final Report; US Environmental Protection Agency: Washington, DC, USA, 1997.
  18. Calcabrini, A.; Meschini, S.; Marra, M.; Falzano, L.; Colone, M.; De Berardis, B.; Paoletti, L.; Arancia, G.; Fiorentini, C. Fine environmental particulate engenders alterations in human lung epithelial A549 cells. Environ. Res. 2004, 95, 82–91. [Google Scholar] [CrossRef]
  19. Adamson, I.Y.; Prieditis, H.; Vincent, R. Pulmonary toxicity of an atmospheric particulate sample is due to the soluble fraction. Toxicol. Appl. Pharmacol. 1999, 157, 43–50. [Google Scholar] [CrossRef] [PubMed]
  20. Knasmuller, S.; Mersch-Sundermann, V.; Kevekordes, S.; Darroudi, F.; Huber, W.W.; Hoelzl, C.; Bichler, J.; Majer, B.J. Use of human-derived liver cell lines for the detection of environmental and dietary genotoxicants; current state of knowledge. Toxicology 2004, 198, 315–328. [Google Scholar] [CrossRef]
  21. Allen, J.L.; Oberdorster, G.; Morris-Schaffer, K.; Wong, C.; Klocke, C.; Sobolewski, M.; Conrad, K.; Mayer-Proschel, M.; Cory-Slechta, D.A. Developmental neurotoxicity of inhaled ambient ultrafine particle air pollution: Parallels with neuropathological and behavioral features of autism and other neurodevelopmental disorders. Neurotoxicology 2017, 59, 140–154. [Google Scholar] [CrossRef] [PubMed]
  22. Gonzalez-Maciel, A.; Reynoso-Robles, R.; Torres-Jardon, R.; Mukherjee, P.S.; Calderon-Garciduenas, L. Combustion-Derived Nanoparticles in Key Brain Target Cells and Organelles in Young Urbanites: Culprit Hidden in Plain Sight in Alzheimer’s Disease Development. J. Alzheimers Dis. 2017, 59, 189–208. [Google Scholar] [CrossRef] [PubMed]
  23. Ritz, B.; Lee, P.-C.; Hansen, J.; Lassen, C.F.; Ketzel, M.; Sorensen, M.; Raaschou-Nielsen, O. Traffic-Related Air Pollution and Parkinson’s Disease in Denmark: A Case-Control Study. Environ. Health Perspect. 2016, 124, 351–356. [Google Scholar] [CrossRef] [PubMed]
  24. Kwon, S.-H.; Kim, J.-A.; Hong, S.-I.; Jung, Y.-H.; Kim, H.-C.; Lee, S.-Y.; Jang, C.-G. Loganin protects against hydrogen peroxide-induced apoptosis by inhibiting phosphorylation of JNK, p38, and ERK 1/2 MAPKs in SH-SY5Y cells. Neurochem. Int. 2011, 58, 533–541. [Google Scholar] [CrossRef] [PubMed]
  25. Perrone, M.G.; Gualtieri, M.; Ferrero, L.; Lo Porto, C.; Udisti, R.; Bolzacchini, E.; Camatini, M. Seasonal variations in chemical composition and in vitro biological effects of fine PM from Milan. Chemosphere 2010, 78, 1368–1377. [Google Scholar] [CrossRef]
  26. Kang, Y.; Cheung, K.C.; Wong, M.H. Polycyclic aromatic hydrocarbons (PAHs) in different indoor dusts and their potential cytotoxicity based on two human cell lines. Environ. Int. 2010, 36, 542–547. [Google Scholar] [CrossRef]
  27. Zou, Y.; Jin, C.; Su, Y.; Li, J.; Zhu, B. Water soluble and insoluble components of urban PM2.5 and their cytotoxic effects on epithelial cells (A549) in vitro. Environ. Pollut. 2016, 212, 627–635. [Google Scholar] [CrossRef] [PubMed]
  28. Liu, F.L.; Lu, X.; Wu, M.L. Pollution characters and source apportionment of heavy metals in PM2.1 in Nanjing. China. Chin. J. Environ. Eng. 2014, 8, 652–658. [Google Scholar]
  29. Yang, W.; Yin, Y.; Wei, Y.; Chen, K. Characteristics and sources of metal elements in PM2.5 during hazy days in Nanjing. China. China Environ. Sci. 2010, 30, 12–17. [Google Scholar]
  30. Qi, L.; Zhang, Y.; Ma, Y.; Chen, M.; Ge, X.; Ma, Y.; Zheng, J.; Wang, Z.; Li, S. Source identification of trace elements in the atmosphere during the second Asian Youth Games in Nanjing, China: Influence of control measures on air quality. Atmos. Pollut. Res. 2016, 7, 547–556. [Google Scholar] [CrossRef]
  31. Zhou, S.; Yuan, Q.; Li, W.; Lu, Y.; Zhang, Y.; Wang, W. Trace metals in atmospheric fine particles in one industrial urban city: Spatial variations, sources, and health implications. J. Environ. Sci. 2014, 26, 205–213. [Google Scholar] [CrossRef]
  32. Yang, L.; Cheng, S.; Wang, X.; Nie, W.; Xu, P.; Gao, X.; Yuan, C.; Wang, W. Source identification and health impact of PM2.5 in a heavily polluted urban atmosphere in China. Atmos. Environ. 2013, 75, 265–269. [Google Scholar] [CrossRef]
  33. Nie, D.; Wu, Y.; Chen, M.; Liu, H.; Zhang, K.; Ge, P.; Yuan, Y.; Ge, X. Bioaccessibility and health risk of trace elements in fine particulate matter in different simulated body fluids. Atmos. Environ. 2018, 186, 1–8. [Google Scholar] [CrossRef]
  34. MohseniBandpi, A.; Eslami, A.; Shahsavani, A.; Khodagholi, F.; Alinejad, A. Physicochemical characterization of ambient PM2.5 in Tehran air and its potential cytotoxicity in human lung epithelial cells (A549). Sci. Total Environ. 2017, 593–594, 182–190. [Google Scholar] [CrossRef] [PubMed]
  35. Ge, X.; Li, L.; Chen, Y.; Chen, H.; Wu, D.; Wang, J.; Xie, X.; Ge, S.; Ye, Z.; Xu, J.; et al. Aerosol characteristics and sources in Yangzhou, China resolved by offline aerosol mass spectrometry and other techniques. Environ. Pollut. 2017, 225, 74–85. [Google Scholar] [CrossRef]
  36. Senaratne, I.; Shooter, D. Elemental composition in source identification of brown haze in Auckland, New Zealand. Atmos. Environ. 2004, 38, 3049–3059. [Google Scholar] [CrossRef]
  37. Taiwo, A.M.; Harrison, R.M.; Shi, Z. A review of receptor modelling of industrially emitted particulate matter. Atmos. Environ. 2014, 97, 109–120. [Google Scholar] [CrossRef]
  38. Chen, P.L.; Wang, T.J.; Hu, X.; Xie, M. Chemical Mass Balance Source Apportionment of Size-Fractionated Particulate Matter in Nanjing, China. Aerosol Air Qual. Res. 2015, 15, 1855–1867. [Google Scholar] [CrossRef]
  39. Pan, Y.; Wang, Y.; Sun, Y.; Tian, S.; Cheng, M. Size-resolved aerosol trace elements at a rural mountainous site in Northern China: Importance of regional transport. Sci. Total Environ. 2013, 461, 761–771. [Google Scholar] [CrossRef]
  40. Tian, H.Z.; Wang, Y.; Xue, Z.G.; Cheng, K.; Qu, Y.P.; Chai, F.H.; Hao, J.M. Trend and characteristics of atmospheric emissions of Hg, As, and Se from coal combustion in China, 1980–2007. Atmos. Chem. Phys. 2010, 10, 11905–11919. [Google Scholar] [CrossRef] [Green Version]
  41. Bukowiecki, N.; Lienemann, P.; Hill, M.; Figi, R.; Richard, A.; Furger, M.; Rickers, K.; Falkenberg, G.; Zhao, Y.; Cliff, S.S.; et al. Real-World Emission Factors for Antimony and Other Brake Wear Related Trace Elements: Size-Segregated Values for Light and Heavy Duty Vehicles. Environ. Sci. Technol. 2009, 43, 8072–8078. [Google Scholar] [CrossRef]
  42. Zhang, Y.; Wang, X.; Chen, H.; Yang, X.; Chen, J.; Allen, J.O. Source apportionment of lead-containing aerosol particles in Shanghai using single particle mass spectrometry. Chemosphere 2009, 74, 501–507. [Google Scholar] [CrossRef]
  43. Karnae, S.; John, K. Source apportionment of fine particulate matter measured in an industrialized coastal urban area of South Texas. Atmos. Environ. 2011, 45, 3769–3776. [Google Scholar] [CrossRef]
  44. Yang, S.; Song, X.; Zhen, M.; Wang, X.; Huang, C. Characteristic features of the water-soluble inorganic ions in PM2.5 in the process of a severe haze episode in Zhengzhou. China. J. Saf. Environ. 2016, 6, 348–353. [Google Scholar] [CrossRef]
  45. Zhang, Z.; Hu, G.; Yu, R.; Hu, Q.; Liu, X. Characteristics and sources apportionment of water-soluble ions in PM2.5 of Xiamen City, China. China. China Environ. Sci. 2016, 36, 1947–1954. [Google Scholar]
  46. Gao, H.; Wei, J.; Wang, Y. Seasonal Variation and Source Analysis of Water-soluble Inorganic Salts in PM2.5 in the Southern Suburbs of Beijing. China. Environ. Sci. 2018, 39, 1987–1993. [Google Scholar] [CrossRef]
  47. Li, W.; Bai, Z.; Shi, J.; Liu, A. Pollution Characteristics and Sources of Fine Particulate Matter in Ambient Air in Tianjin City. China. Res. Environ. Sci. 2010, 23, 394–400. [Google Scholar] [CrossRef]
  48. Arimoto, R.; Duce, R.A.; Savoie, D.L.; Prospero, J.M.; Talbot, R.; Cullen, J.D.; Tomza, U.; Lewis, N.F.; Ray, B.J. Relationships among aerosol constitutes from Asia and the North Pacific during PEM-West A. J. Geophys. Res. Atmos. 1996, 101, 2011–2023. [Google Scholar] [CrossRef]
  49. Wang, L.; Ma, Y.; Zheng, J.; Wang, Z.; Zhou, Y.-Y. Characterization Apportionment of Carbonaceous Aerosol and Water-soluble Ions in PM2.5 at Suburban Nanjing. China. Sci. Technol. Eng. 2015, 15, 91–99. [Google Scholar]
  50. Huang, X.H.H.; Bian, Q.J.; Louie, P.K.K.; Yu, J.Z. Contributions of vehicular carbonaceous aerosols to PM2.5 in a roadside environment in Hong Kong. Atmos. Chem. Phys. 2014, 14, 9279–9293. [Google Scholar] [CrossRef]
  51. Zhu, W.; Cheng, Z.; Luo, L.; Lou, S.; Ma, Y.; Yan, N. Investigation of fungal spore characteristics in PM2.5 through organic tracers in Shanghai, China. Atmos. Pollut. Res. 2018, 9, 894–900. [Google Scholar] [CrossRef]
  52. Shi, M.; Wu, H.; Zhang, S.; Li, H.; Liu, H. Weekly cycle of magnetic characteristics of the daily PM2.5 and PM2.5–10 in Beijing, China. Atmos. Environ. 2014, 98, 357–367. [Google Scholar] [CrossRef]
  53. Yang, H.; Yu, J.Z.; Ho, S.S.H.; Xu, J.H.; Wu, W.S.; Wan, C.H.; Wang, X.D.; Wang, X.R.; Wang, L.S. The chemical composition of inorganic and carbonaceous materials in PM2.5 in Nanjing, China. Atmos. Environ. 2005, 39, 3735–3749. [Google Scholar] [CrossRef]
  54. Chen, K.; Yin, Y.; Wei, Y. Characteristics of aerosols in PM2.5 in Nanjing. China. China Environ. Sci. 2010, 30, 1015–1020. [Google Scholar]
  55. Li, B.; Zhang, J.; Zhao, Y.; Yuan, S.; Zhao, Q.; Shen, G.; Wu, H. Seasonal variation of urban carbonaceous aerosols in a typical city Nanjing in Yangtze River Delta, China. Atmos. Environ. 2015, 106, 223–231. [Google Scholar] [CrossRef]
  56. Chen, Y.J.; Sheng, G.Y.; Bi, X.H.; Feng, Y.L.; Mai, B.X.; Fu, J.M. Emission factors for carbonaceous particles and polycyclic aromatic hydrocarbons from residential coal combustion in China. Environ. Sci. Technol. 2005, 39, 1861–1867. [Google Scholar] [CrossRef] [PubMed]
  57. Schauer, J.J.; Kleeman, M.J.; Cass, G.R.; Simoneit, B.R. Measurement of emissions from air pollution sources. 5.C1-C32 organic compounds from gasoline-powered motor vehicles. Environ. Sci. Technol. 2002, 35, 1716–1728. [Google Scholar] [CrossRef]
  58. Castro, L.M.; Pio, C.A.; Harrison, R.M.; Smith, D.J.T. Carbonaceous aerosol in urban and rural European atmospheres: Estimation of secondary organic carbon concentrations. Atmos. Environ. 1999, 33, 2771–2781. [Google Scholar] [CrossRef]
  59. He, Q.; Guo, W.; Zhang, G.; Yan, Y.; Chen, L. Characteristics and Seasonal Variations of Carbonaceous Species in PM2.5 in Taiyuan, China. Atmosphere 2015, 6, 850–862. [Google Scholar] [CrossRef]
  60. Borgie, M.; Dagher, Z.; Ledoux, F.; Verdin, A.; Cazier, F.; Martin, P.; Hachimi, A.; Shirali, P.; Greige-Gerges, H.; Courcot, D. Comparison between ultrafine and fine particulate matter collected in Lebanon: Chemical characterization, in vitro cytotoxic effects and metabolizing enzymes gene expression in human bronchial epithelial cells. Environ. Pollut. 2015, 205, 250–260. [Google Scholar] [CrossRef] [PubMed]
  61. de Kok, T.M.C.M.; Driece, H.A.L.; Hogervorst, J.G.F.; Briede, J.J. Toxicological assessment of ambient and traffic-related particulate matter: A review of recent studies. Mutat. Res. Rev. Mutat. Res. 2006, 613, 103–122. [Google Scholar] [CrossRef]
  62. Liu, Q.; Baumgartner, J.; Zhang, Y.; Schauer, J.J. Source apportionment of Beijing air pollution during a severe winter haze event and associated pro-inflammatory responses in lung epithelial cells. Atmos. Environ. 2016, 126, 28–35. [Google Scholar] [CrossRef]
  63. Bressi, M.; Sciare, J.; Ghersi, V.; Bonnaire, N.; Nicolas, J.B.; Petit, J.E.; Moukhtar, S.; Rosso, A.; Mihalopoulos, N.; Feron, A. A one-year comprehensive chemical characterisation of fine aerosol (PM2.5) at urban, suburban and rural background sites in the region of Paris (France). Atmos. Chem. Phys. 2013, 13, 7825–7844. [Google Scholar] [CrossRef]
  64. Cao, J.J.; Zhu, C.S.; Tie, X.X.; Geng, F.H.; Xu, H.M.; Ho, S.S.H.; Wang, G.H.; Han, Y.M.; Ho, K.F. Characteristics and sources of carbonaceous aerosols from Shanghai, China. Atmos. Chem. Phys. 2013, 13, 803–817. [Google Scholar] [CrossRef]
  65. Könczöl, M.; Ebeling, S.; Goldenberg, E.; Treude, F.; Gminski, R.; Gieré, R.; Grobéty, B.; Rothen-Rutishauser, B.; Merfort, I.; Mersch-Sundermann, V. Cytotoxicity and genotoxicity of size-fractionated iron oxide (magnetite) in A549 human lung epithelial cells: Role of ROS, JNK, and NF-κB. J. Chem. Res. Toxicol. 2011, 24, 1460–1475. [Google Scholar] [CrossRef] [PubMed]
  66. Moller, P.; Jacobsen, N.R.; Folkmann, J.K.; Danielsen, P.H.; Mikkelsen, L.; Hemmingsen, J.G.; Vesterdal, L.K.; Forchhammer, L.; Wallin, H.; Loft, S. Role of oxidative damage in toxicity of particulates. Free Radic. Res. 2010, 44, 1–46. [Google Scholar] [CrossRef] [PubMed]
  67. Deng, X.; Zhang, F.; Rui, W.; Long, F.; Wang, L.; Feng, Z.; Chen, D.; Ding, W. PM2.5-induced oxidative stress triggers autophagy in human lung epithelial A549 cells. Toxicol. In Vitro 2013, 27, 1762–1770. [Google Scholar] [CrossRef]
  68. Bai, R.; Guan, L.; Zhang, W.; Xu, J.; Rui, W.; Zhang, F.; Ding, W. Comparative study of the effects of PM1-induced oxidative stress on autophagy and surfactant protein B and C expressions in lung alveolar type II epithelial MLE-12 cells. Biochim. Biophys. Acta-Gen. Subj. 2016, 1860, 2782–2792. [Google Scholar] [CrossRef]
  69. Gehling, W.; Dellinger, B. Environmentally Persistent Free Radicals and Their Lifetimes in PM2.5. Environ. Sci. Technol. 2013, 47, 8172–8178. [Google Scholar] [CrossRef]
  70. Gehling, W.; Khachatryan, L.; Dellinger, B. Hydroxyl Radical Generation from Environmentally Persistent Free Radicals (EPFRs) in PM2.5. Environ. Sci. Technol. 2014, 48, 4266–4272. [Google Scholar] [CrossRef] [PubMed]
  71. Verma, V.; Polidori, A.; Schauer, J.J.; Shafer, M.M.; Cassee, F.R.; Sioutas, C. Physicochemical and Toxicological Profiles of Particulate Matter in Los Angeles during the October 2007 Southern California Wildfires. Environ. Sci. Technol. 2009, 43, 954–960. [Google Scholar] [CrossRef]
  72. Shafer, M.M.; Perkins, D.A.; Antkiewicz, D.S.; Stone, E.A.; Quraishi, T.A.; Schauer, J.J. Reactive oxygen species activity and chemical speciation of size-fractionated atmospheric particulate matter from Lahore, Pakistan: An important role for transition metals. J. Environ. Monit. 2010, 12, 704–715. [Google Scholar] [CrossRef] [PubMed]
  73. Daher, N.; Ruprecht, A.; Invernizzi, G.; De Marco, C.; Miller-Schulze, J.; Heo, J.B.; Shafer, M.M.; Shelton, B.R.; Schauer, J.J.; Sioutas, C. Characterization, sources and redox activity of fine and coarse particulate matter in Milan, Italy. Atmos. Environ. 2012, 49, 130–141. [Google Scholar] [CrossRef]
  74. Saffari, A.; Daher, N.; Shafer, M.M.; Schauer, J.J.; Sioutas, C. Seasonal and spatial variation in reactive oxygen species activity of quasi-ultrafine particles (PM0.25) in the Los Angeles metropolitan area and its association with chemical composition. Atmos. Environ. 2013, 79, 566–575. [Google Scholar] [CrossRef]
Figure 1. Position of the sampling point.
Environments 06 00042 g001
Figure 2. Enrichment factors of heavy metals in PM2.5 in summer and winter 2016 (Nanjing).
Environments 06 00042 g002
Figure 3. Relative percentages of ionic species in PM2.5.
Environments 06 00042 g003
Figure 4. Changes of organic carbon (OC), elemental carbon (EC), and OC/EC ratios in PM2.5 in summer and winter.
Environments 06 00042 g004
Figure 5. Cell viability of A549, Sh-Sy5y and HepG2 cells exposed to different concentrations of PM2.5. (* p < 0.05, ** p < 0.01: Significant differences between each treatment group and the control group was; # p < 0.05, ## p < 0.01: Significant differences between summer and winter samples).
Environments 06 00042 g005
Figure 6. The relative change in reactive oxygen species (ROS) production in A549 and Sh-Sy5y cells exposed to different levels of PM2.5. (* p < 0.05, ** p < 0.01: Significant differences between each treatment group and the control group was; # p < 0.05, ## p < 0.01: Significant differences between summer and winter samples).
Environments 06 00042 g006
Table 1. Average mass concentrations (ng/m3) and mass fractions (μg/g) of heavy metals in PM2.5 in summer and winter.
ElementsSummer (n = 33)Winter (n = 32)Mass Fraction Ratio Summer/Winter
Concentration (ng/m3)Mass Fraction (μg/g)Concentration (ng/m3)Mass Fraction (μg/g)
Al588.85 ± 284.9912,704.97 ± 6747.99755.05 ± 738.3912,559.83 ± 11,775.821.01
As3.37 ± 2.3165.95 ± 38.613.05 ± 1.9051.18 ± 27.051.29
Ba20.92 ± 38.82512.71 ± 103.5811.72 ± 4.99198.11 ± 78.772.59
Cd1.58 ± 1.2731.24 ± 26.831.17 ± 0.7119.18 ± 11.011.63
Co0.73 ± 0.9917.64 ± 3.630.47 ± 0.178.02 ± 3.542.20
Cr23.38 ± 7.50524.42 ± 244.9834.70 ± 20.37609.05 ± 434.210.86
Cu35.99 ± 19.86802.44 ± 507.7636.23 ± 29.95602.33 ± 391.261.33
Mn26.98 ± 11.65552.71 ± 183.1329.88 ± 14.90493.90 ± 214.841.12
Ni11.49 ± 3.56252.24 ± 98.977.86 ± 4.99139.49 ± 100.741.81
Pb86.16 ± 65.881742.57 ± 501.4548.92 ± 22.24799.80 ± 302.542.18
Sr4.12 ± 1.8386.49 ± 30.455.51 ± 2.2793.38 ± 40.030.93
V4.64 ± 3.2890.02 ± 57.892.95 ± 1.6750.17 ± 29.711.79
Zn678.16 ± 325.8614,979.87 ± 10,218.68724.70 ± 438.3212,784.79 ± 8830.231.17
Table 2. Correlation between heavy metals in PM2.5 (n = 65).
AlAsBaCdCoCrCuMnNiPbSrVZn
Al1
As0.1451
Ba−0.0340.0141
Cd0.1190.366 **−0.0241
Co−0.005−0.0330.0130.562 **1
Cr0.383 **0.152−0.0080.1330.0201
Cu0.1910.167−0.0350.388 **0.0690.311 *1
Mn0.2100.419 **0.0240.257 *0.0970.341 **0.1871
Ni0.320 **0.1510.2040.405 **0.1890.1570.576 **0.1541
Pb0.0630.115−0.0010.380 **0.1270.0980.452 **0.394 **0.338 **1
Sr0.489 **0.470 **0.0520.279 *0.1230.488 **0.348 **0.640 **0.254 *0.2071
V−0.0400.0160.0120.471 **0.303 *0.0480.263 *0.509 **0.403 **0.568 **0.1401
Zn0.152−0.092−0.0650.068−0.1190.2020.1410.1500.0770.0830.0720.2121
** Significantly correlated at the 0.01 level (both sides), * Significantly correlated at the 0.05 level (both sides).
Table 3. LC20 and LC50 (μg/mL) of PM2.5 in summer and winter.
A549 CellsHepG2 CellsSh-Sy5y Cells
LC20LC50LC20LC50LC20LC50
Summer96 (92–99)
(n = 30)
274 (250–291)
(n = 30)
66 (51–80)
(n = 27)
205 (173–274)
(n = 27)
98 (93–102)
(n = 22)
279 (249–310)
(n = 22)
Winter130 (127–133)
(n = 29)
323 (268–379)
(n = 29)
84 (64–103)
(n = 30)
268 (221–315)
(n = 30)
127 (62–167)
(n = 26)
312 (311–415)
(n = 26)

