Article

Firm Readiness Level for Innovation Projects: A New Decision-Making Tool for Innovation Managers

1
Department of Industrial Engineering, University of Santiago de Chile, 9170124 Santiago, Chile
2
Équipe de Recherche sur les Processus Innovatifs, ERPI, Université de Lorraine, ERPI, F-54000 Nancy, France
3
Innovation Way, F-54000 Nancy, France
*
Authors to whom correspondence should be addressed.
Adm. Sci. 2018, 8(1), 6; https://doi.org/10.3390/admsci8010006
Submission received: 5 January 2018 / Revised: 16 February 2018 / Accepted: 7 March 2018 / Published: 11 March 2018

Abstract

:
Innovation projects represent a major challenge for business managers due to their associated uncertainty degree. The already existing methodologies to support the innovation projects are aimed at piloting them and establishing the management stages in a flexible and agile way during their deployment. This paper proposes a complementary ex-ante methodology that seeks to aid the decision-making of companies to choose whether or not to launch a potential innovation project. This methodology evaluates to what extent the technological system of the company has the minimum required maturity degree of competencies to successfully achieve the innovation project. Thus, in first instance, an innovation project is characterized according to its novelty degree; both inside the company and in its environment. Subsequently, according to the previous characterization, the future project will have an impact on the technological system of the company. The capabilities of the firm are represented by a set of good practices associated with the innovation projects’ management that the company is able to deploy. Finally, the minimum maturity degree required by a particular project of these practices is determined. Then, the gap between the maturity requirement profile and the current profile of the company is established enabling to decide on the implementation of the project or not.

1. Introduction

An innovation is the implementation of a new or significantly improved product (good or service), or process, a new marketing method, or a new organizational method in business practices, workplace organization or external relations. The minimum requirement for an innovation is that the product, process, marketing method or organizational method must be new (or significantly improved) to the firm (Mortensen and Bloch 2005). So, Innovation presents a series of advantages for the economic development of companies (Atalay et al. 2013; Rosenbusch et al. 2011; Santos et al. 2014). But innovation is also closely linked to the concept of uncertainty and fuzziness, making the management of this process a complex task (Boly et al. 2016; Candi et al. 2013). Moreover, there is a direct relationship between novelty degree and complexity in innovation projects, leading this type of project to be managed differently than traditional projects. Indeed, the novelty degree represents a key difference between an innovation project and a traditional one (Garcia and Calantone 2002). Moreover, risk management in innovative projects is one of the most difficult tasks in project management due to high degree of uncertainty which is intrinsic to innovative projects (Batkovskiy et al. 2015). The principal risks in the phase of development and implementation of an innovative project include the risk of non-feasibility of the innovative idea, the risk of acceptability of the future product/process/service, the complexity of the global environment of the project and the incompleteness of the information available (Kapsali 2011; Morel et al. 2015). The latest studies associated with innovation project management seek to develop methodologies that better manage the characteristics of these projects. The flexibility in the tasks appears as one of the keys to correctly manage an innovation project (Kapsali 2011). In this sense, agile methodologies appear as a good option, providing flexibility through short iterations that allow adapting the project according to the feedback coming from the user (Schulz et al. 2017). Another well-known methodology is the Stage Gate proposed by Cooper, which evaluates the innovation project in different stages allowing decision making by continuous monitoring giving flexibility to the project (Cooper (1990, 2008, 2016)).
Good project management can help to achieve the project’s success. However, it does not totally avoid the failure risks (De Wit 1988). This is why adopting a correct innovative project management methodology is not enough to accomplish the project goals. The successful execution of an innovation project is linked to both the organizational dynamics of the company (Artto et al. 2011; Christiansen and Gasparin 2016) but also to the inherent complexity of the innovative project to be deployed; which directly impacts on the company’s technological system (Garcia and Calantone 2002). As a consequence, before launching an innovation project, it is necessary to verify to what extent the company is globally able to correctly implement it.
This research work is based on different scientific theories. First of all, by focusing on readiness level for an innovative project, we put forward a contingent vision of the company. Through this vision, we do not assess the viability of the project but the company’s ability to manage it. Henri Mintzberg (1979), the principal representative of the school of contingency, considers that there is no “good” organization, no “universal structure.” He argues that the structure of an organization depends on both its own characteristics and the nature of its environment. Thus, by making a parallel, we consider that a “good” innovation project does not exist in itself. A “good” project must be adapted to its environment and the company that has to manage it.
This matching between innovation project and company’s readiness level depends on the internal structuring of the company and therefore on its innovation capability through the practices it implements on a daily basis. By taking an interest in the internal practices/routines of companies, we adopt the Schumpeter tradition (Schumpeter 1934), via the “capability approach.” The capability approach describes what the company can do and how it seeks change and innovation to ensure continuity over time. From this point of view, the entrepreneur is an actor of change and the enterprise is the result of multiple sources of knowledge that are responsible for carrying out specific routines to provide goods and services (Zawislak et al. 2014).
Thus, we are in line with a contingent logic, through the application of the capacity approach to characterize a readiness level specific to each couple project/company.
This article proposes, then, a methodology to support the decision-making process before launching an innovation project by evaluating simultaneously the project complexity and the firm’s readiness level to support it. It allows the project manager to evaluate to what extent the company’s technological system has the sufficient maturity degree to execute a specific innovation project.
The proposed methodology is composed of four main stages. The first stage corresponds to the project characterization to quantify its complexity. To achieve this, the novelty degree of the innovation project is determined through the evaluation of four main factors that the project could impact on the firm’s technological system: product range, production process, distribution channels and customer market. This evaluation allows the project classification according to its complexity and its implementation difficulty. On a second stage, the practices composing the technological system of the company are identified by grouping them into five dimensions: work team, project process, financial structure, organization resources and market (Boly et al. 2014; Claire et al. 2014). Then, in a third stage, for each dimension, a maturity grid is proposed to evaluate each practice in order to determine the level of development of the company technological system. Finally, based on the classification of the project according to its complexity, a multicriteria analysis algorithm is proposed to calculate the minimum maturity level for each of the evaluated practices enabling the company to manage the project. Therefore, the project’s profile of exigence on the technological system is obtained. The methodology application will be illustrated through two case studies representing projects with different novelty degrees, showing the relevance of the proposed algorithm to determine the required profile according to project main features.
The present paper is structured as follows: Section 2 analyzes the different innovation project management methodologies and reviews the associated good practices. Section 3 proposes the methodology to evaluate the maturity degree of the company’s technological system and presents a multicriteria algorithm to determine the profile required by the innovation project. Then, Section 4 illustrates the proposed methodology by two cases of innovation projects and discuses managerial implications. To finish, Section 5 shows the conclusions and perspectives.

2. Overview of the Literature

2.1. Innovation Project Management

The Project Management Institute defines project management as the implementation of knowledge, skills, tools and technologies during the execution of the activities of a project in order to reach its requirements (Project Management Institute 2017). The correct order and execution of these activities are crucial to determine the success or failure of the project. Failures in project management cause loss of financial resources, limiting the company’s possibilities to generate profits (Eriksson et al. 2017). Indeed, failures of projects generate many economic losses for companies; in 2011 losses of 150 billion dollars per year were reached in the United States (Larson and Gray 2011). The failure probabilities increase when projects have a high innovation degree (García-Quevedo et al. 2018). So, project complexity degree is a determining factor in choosing the management approach. Furthermore, complexity affects different variables to be considered within the development of the project, such as: monitoring, control, development times and their evaluation, among others (San Cristóbal 2017). To manage the complexity properly, it is necessary to increase the flexibility of the project management model (Eriksson et al. 2017).
Innovation projects are a clear example of increasing the complexity degree of a project. Their management is strongly marked by the adoption of flexible strategies for project planning (Candi et al. 2013). However, this high flexibility degree in innovation projects management makes the decision-making process difficult. Salerno et al. (2015) propose a study based on the theory of contingency to define the most appropriate configuration according to innovation project characteristics to be executed. They analyzed 132 innovation projects, determining eight possible methodologies or procedures to configure the innovation projects management.
Stage-gate is one of the most recognized methodologies in innovative projects management. Based on the innovation process, Cooper (1990) has determined a series of key milestones that must be evaluated to decide if the project should continue. These milestones are defined as gates that will be opened once the evaluation is done to define how to proceed in the next stage. An evaluation template is defined in each stage, calculating a score to decide if the project could keep going normally or if it must be modified, recycled, among other decision options. The division of the process allows better control of uncertainty, which seems particularly suitable for innovative projects. In addition, Stage Gate has the primary interest in paying particular attention to the front-end phase of the innovation process, which is not necessarily the case in other models. Another group of methodologies commonly used in innovation projects management is agile methodologies (Tripp and Armstrong 2016). These methodologies are structured as a series of short cycles that allow rapid testing of project progress with users. These cycles allow a constant iteration to adapt the project to user needs, generating the necessary flexibility to manage the project complexity. One of the most used agile methodologies is SCRUM (Takeuchi and Nonaka 1986).
These methodologies help to manage innovation projects in a flexible way, however they are oriented to project implementation but they do not support the decision-making process for the project launch stage.

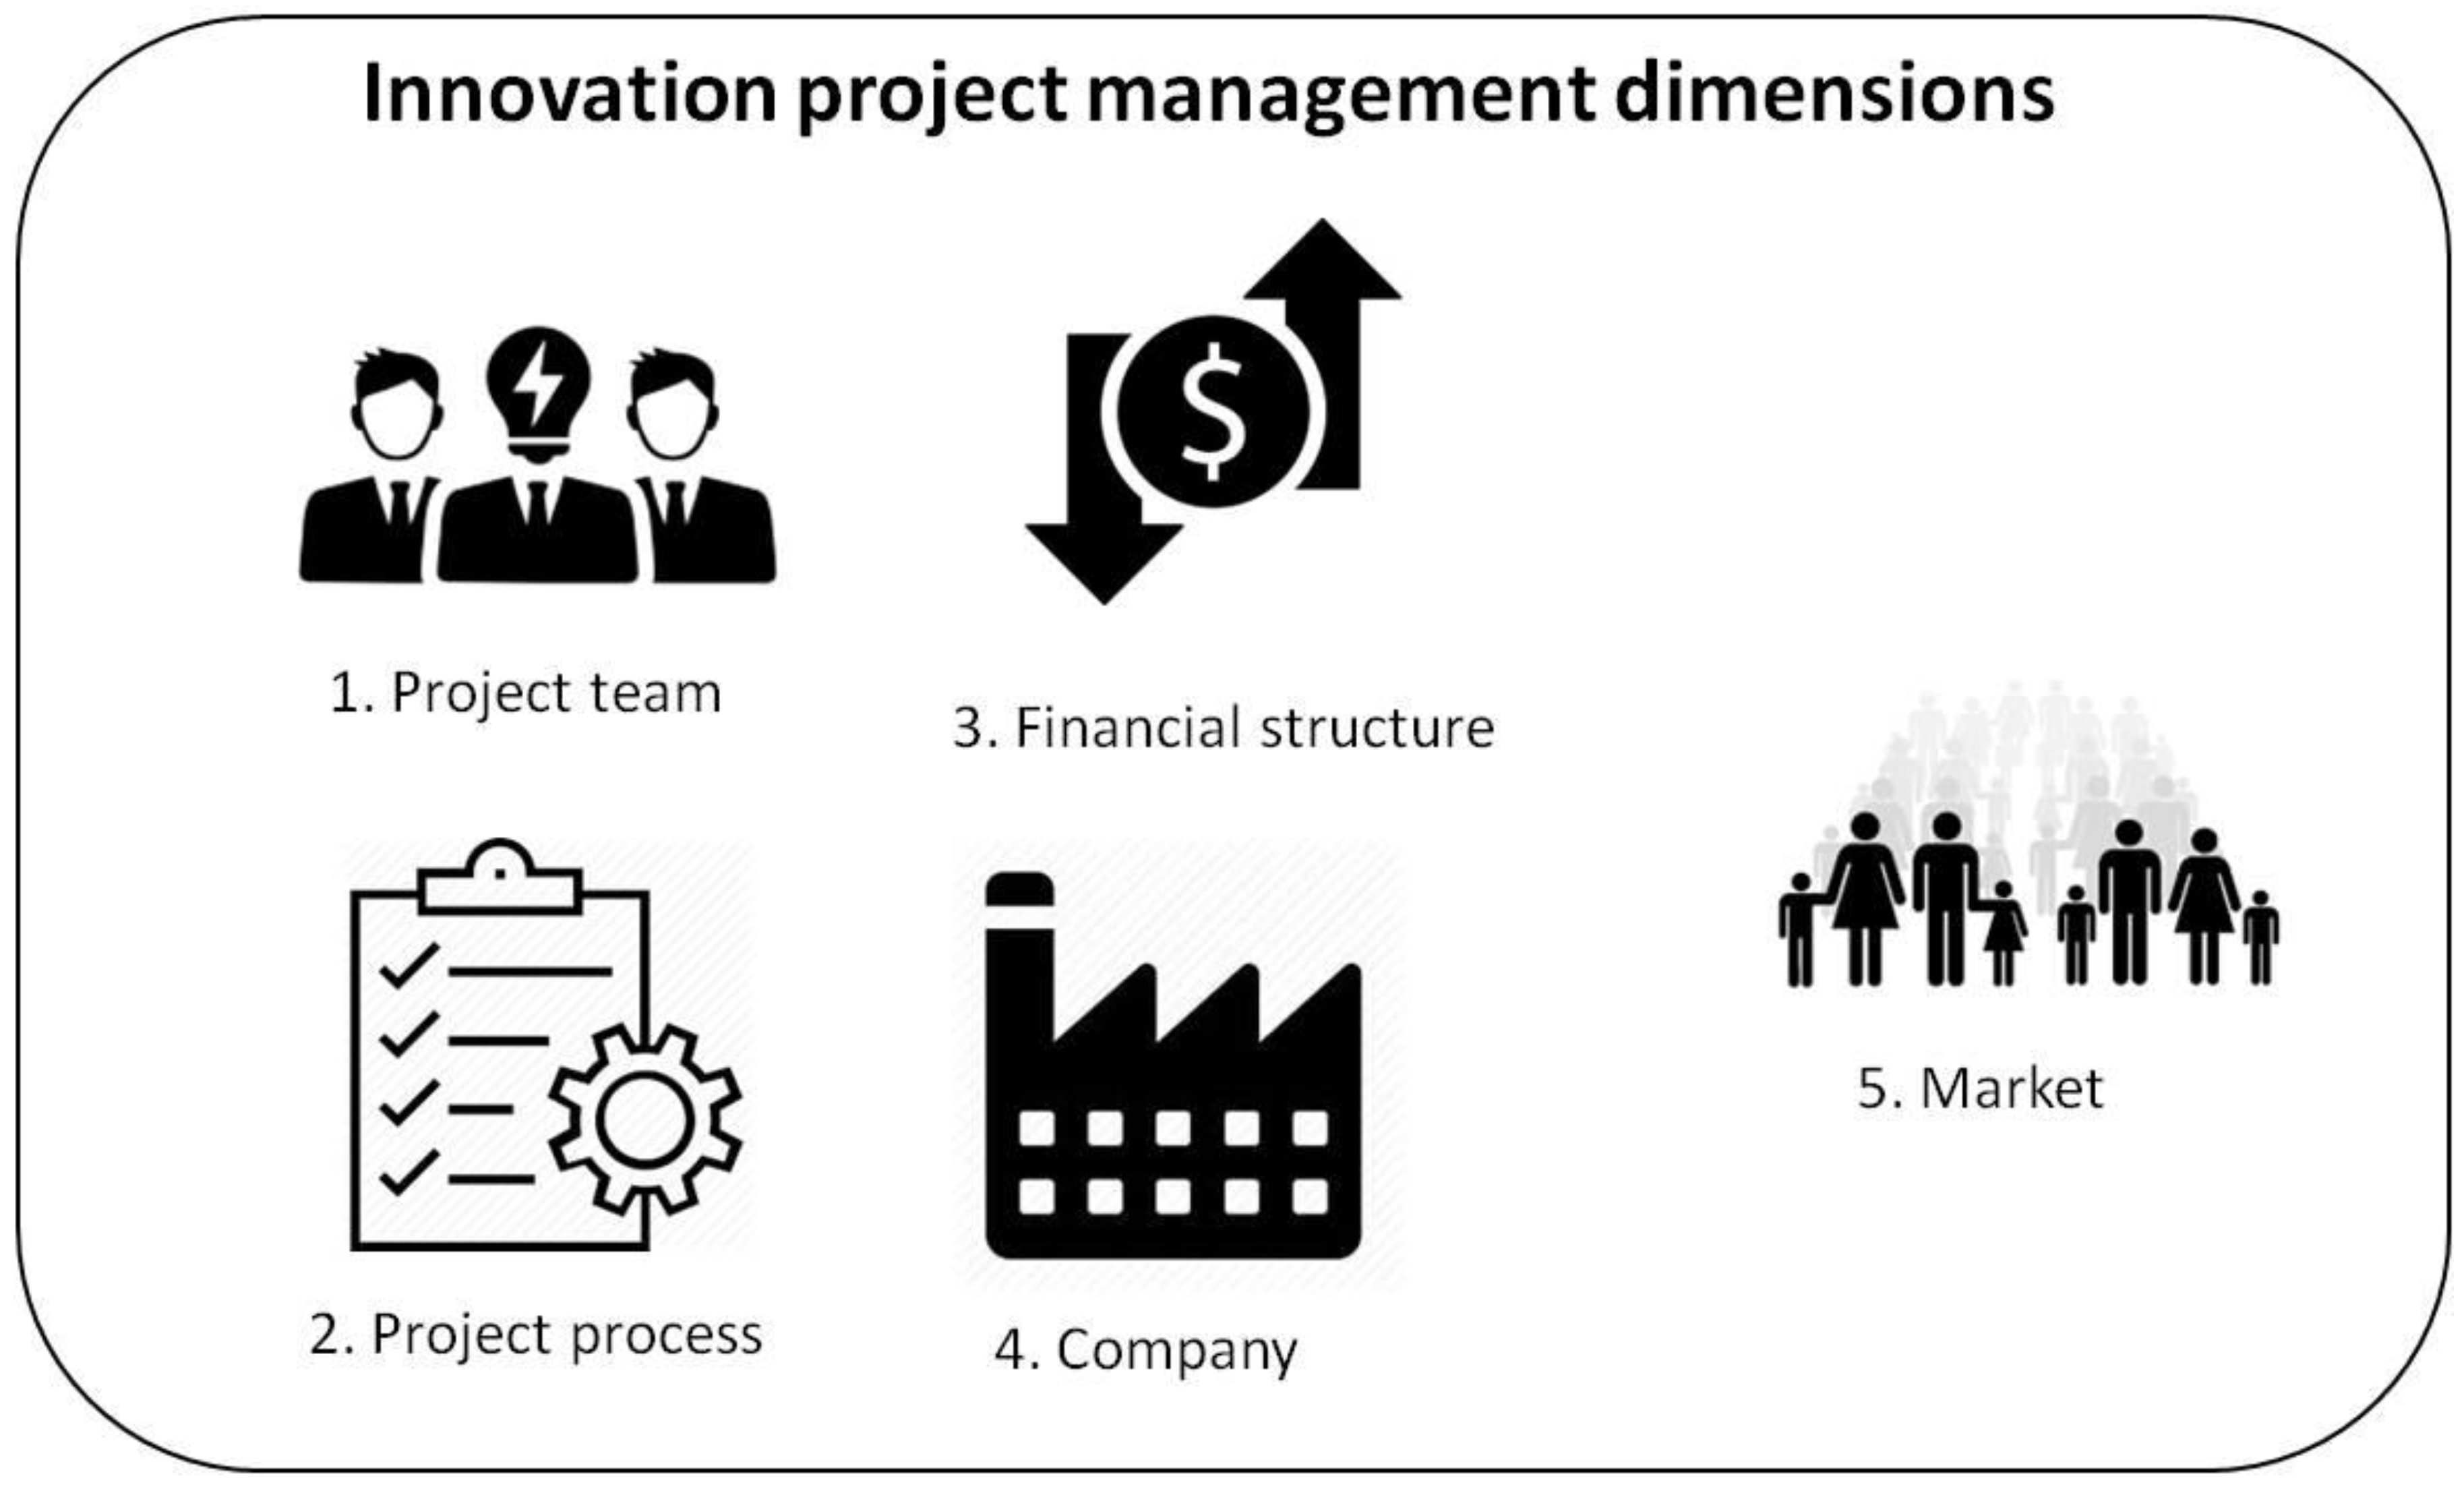
2.2. Best Practices in Innovation Projects

The project management process relies on many practices that increase the chances of success of the project. The study of (Fernandes et al. 2015) aims to identify a set of key project management improvement initiatives to be implemented by firms. Comparing the results of a literature review with the opinion of practitioners through semi-structured interviews, they put forward a list of 15 initiatives related to technical, organizational, managerial and cultural aspects of the project management.
For the same purpose, Besner and Hobbs (2012) identify a project management toolset through a survey on a sample of 2339 practitioners. Their results lead to the identification of 19 patterns of practices related to project management.
On the other hand, Radujković and Sjekavica (2017) identify the project management core skills considering management, organization, tools and technologies.
In the specific context of the innovative projects, Claire et al. (2014) highlight that the uncertainty, the learning process and the lack of information about the innovative projects are some characteristics strengthening the project management complexity. This is why the innovative project management requires a flexible approach integrating compromises on the project characteristics.
So, through the French FD X50-271 standard on the innovation management, the AFNOR (2013) (Association française de normalisation) considers that these management actions occur at two levels in the organizations: the strategic management and the operational management of innovative projects. Considering this second level, the AFNOR consider simultaneously the temporal steps of the project: formulation, feasibility, development, launching as well as the interacting dimensions of the organization: marketing, technology, regulations, finance and organization. So, 16 categories of good practices are recommended to improve the innovative project management (Table 1).
From another perspective, Mitchell et al. (2014) were interested in the selection criteria of the innovation projects. They identify the selection factors which can be assimilated to success factors, enabling the selection of the most promising projects in the early stages of the innovation process. These factors concern, on one hand, the project feasibility (technical, organizational and cultural) and, on the other hand, the potential opportunities created by the project (value, market, etc.…). In terms of good practices, this study reflects the importance of a global vision. An innovative project should be integrated into the global strategy of the firm and into its global organization.
Indeed, the success of an innovative project depends on the quality of its operational management but also on the capability of the organization to integrate the novelty induced by innovation (Boly et al. 2015; Claire et al. 2014). These researches put forward five management dimensions for the innovation project management defined as follows (Figure 1):
  • Project Team: Ability of the project manager (mainly) to conduct the project development.
  • Project process: Analysis of the information flow around the project.
  • Financial structure: Evaluation of the financial values.
  • Company: Analysis of the potential impact of the project on the organization.
  • Market: Evaluation of the conditions for market access.
Each of these management dimensions comprises a set of project management practices. Indeed, Claire et al. (2014) propose a list of 38 project management practices, classified according to these five management dimensions.
Based on the previous literature review, this study proposes a list of innovative project management practices inspired by all the mentioned studies (Table 2).

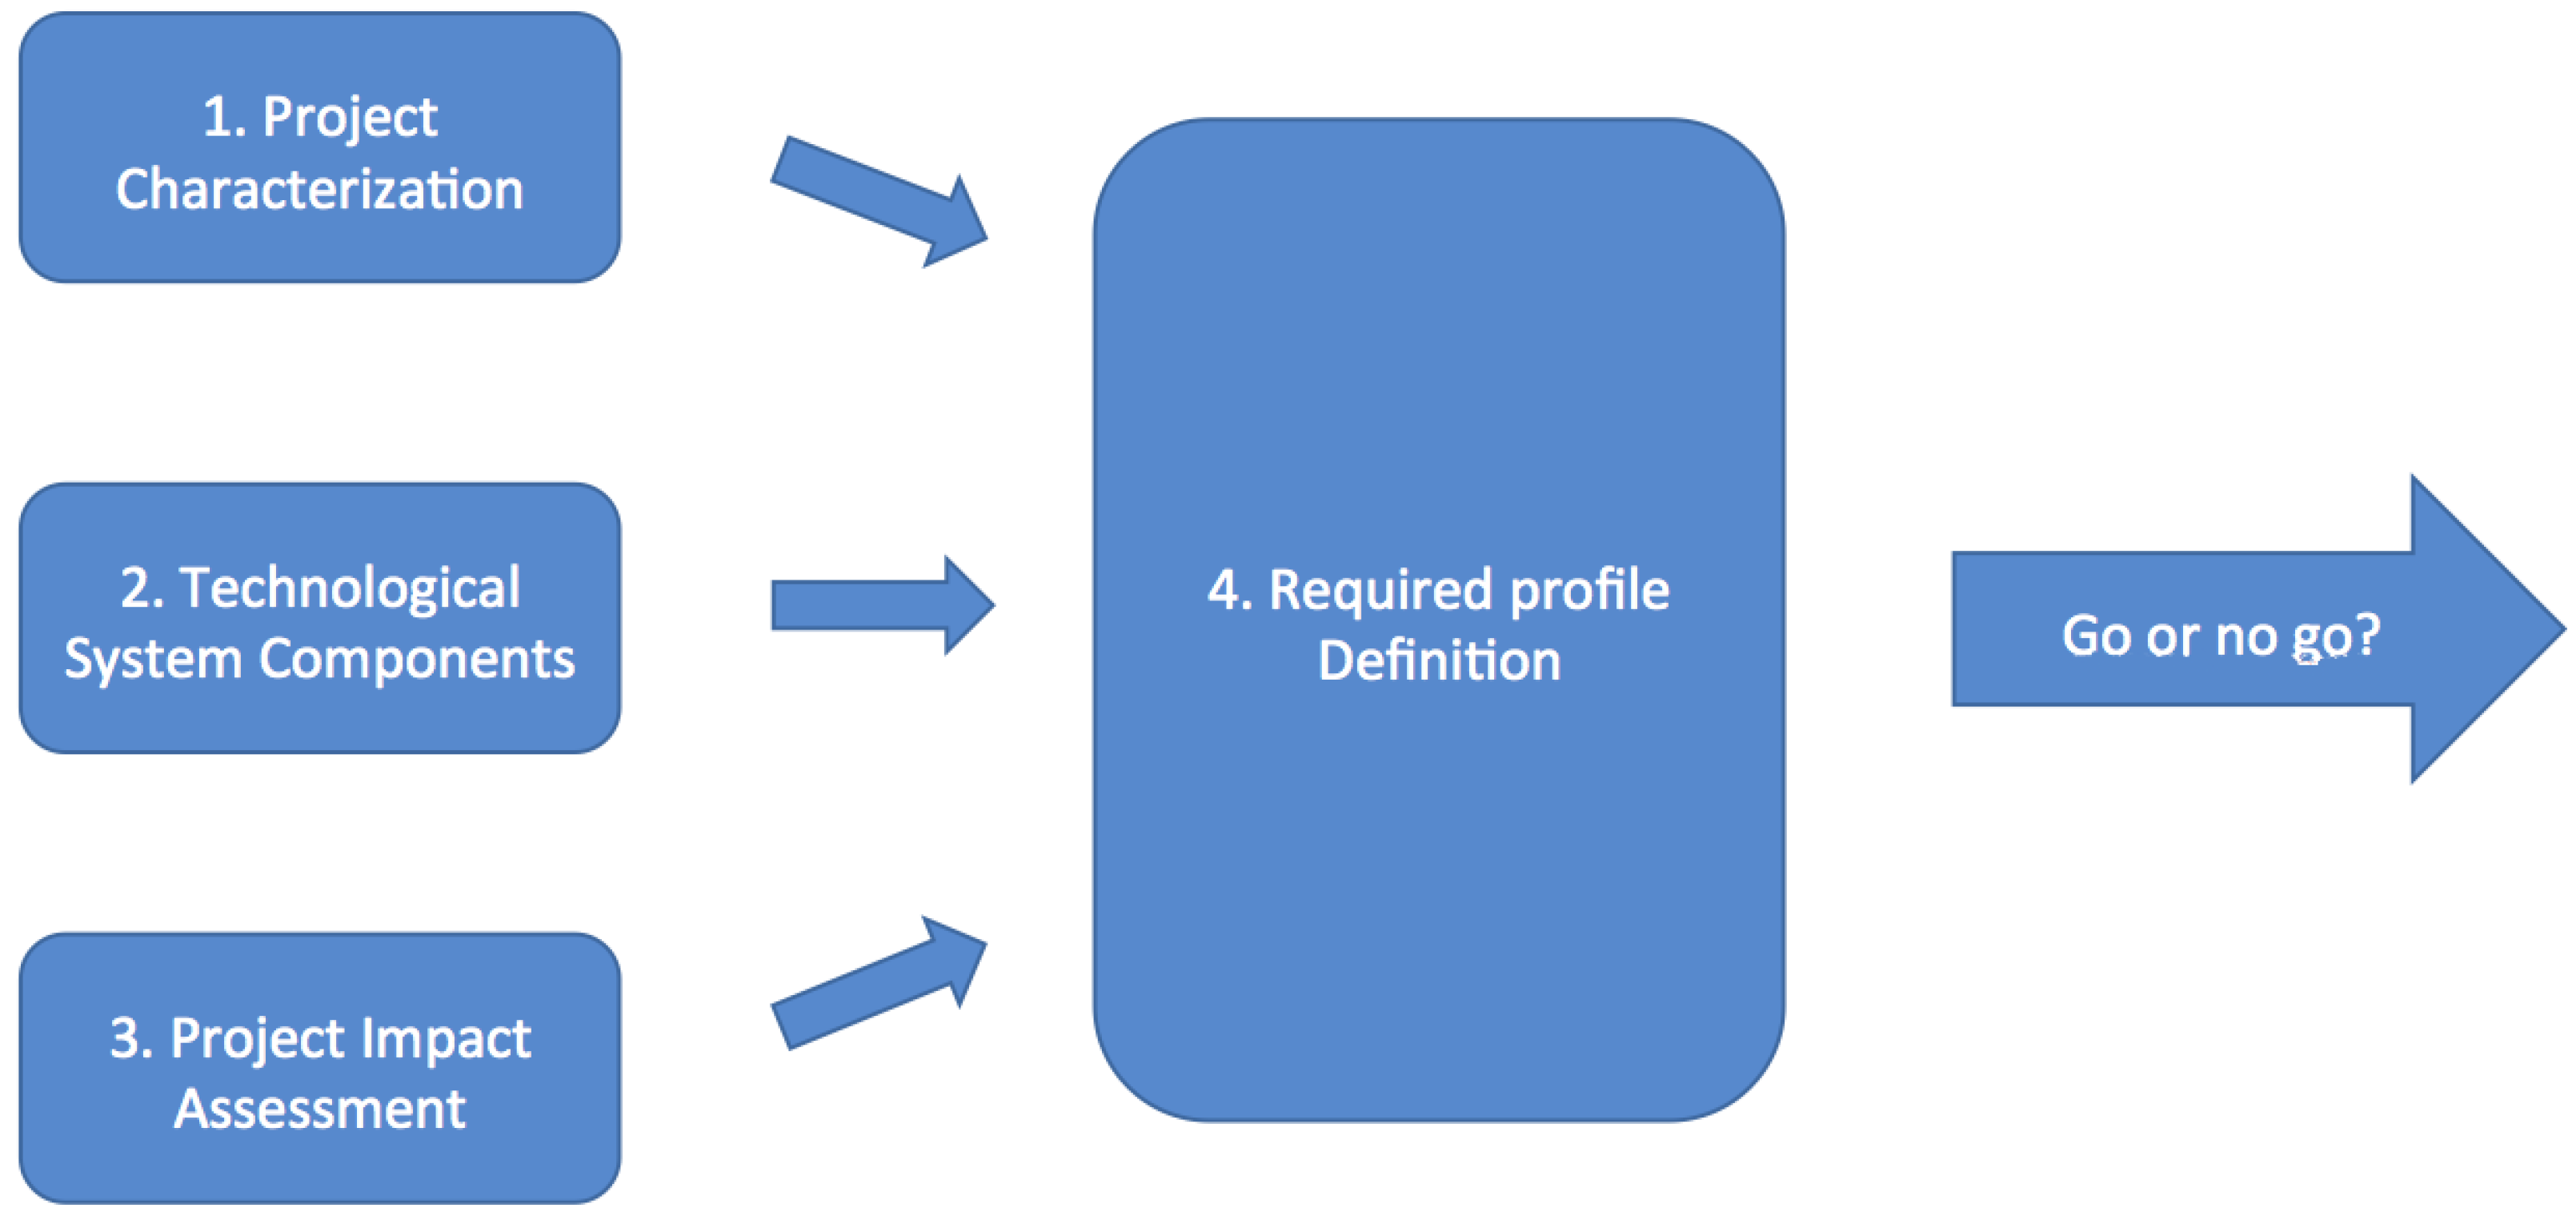
3. Methodology for Readiness Evaluation

The link between innovation, project complexity and technological system is reflected by the novelty degree. We consider that any innovation project has a more or less significant degree of novelty. This degree of novelty reflects a greater or lesser complexity in the management of this project, as well as a greater or lesser impact on the company’s overall technological system. Our methodology quantifies this novelty degree in order to identify the requirement levels in terms of project management practices. As mentioned in Section 1, the proposed methodology is structured into four stages as shown in Figure 2: 1- Project characterization, 2- Technological System identification, 3- Project impact assessment and 4- Required profile definition.

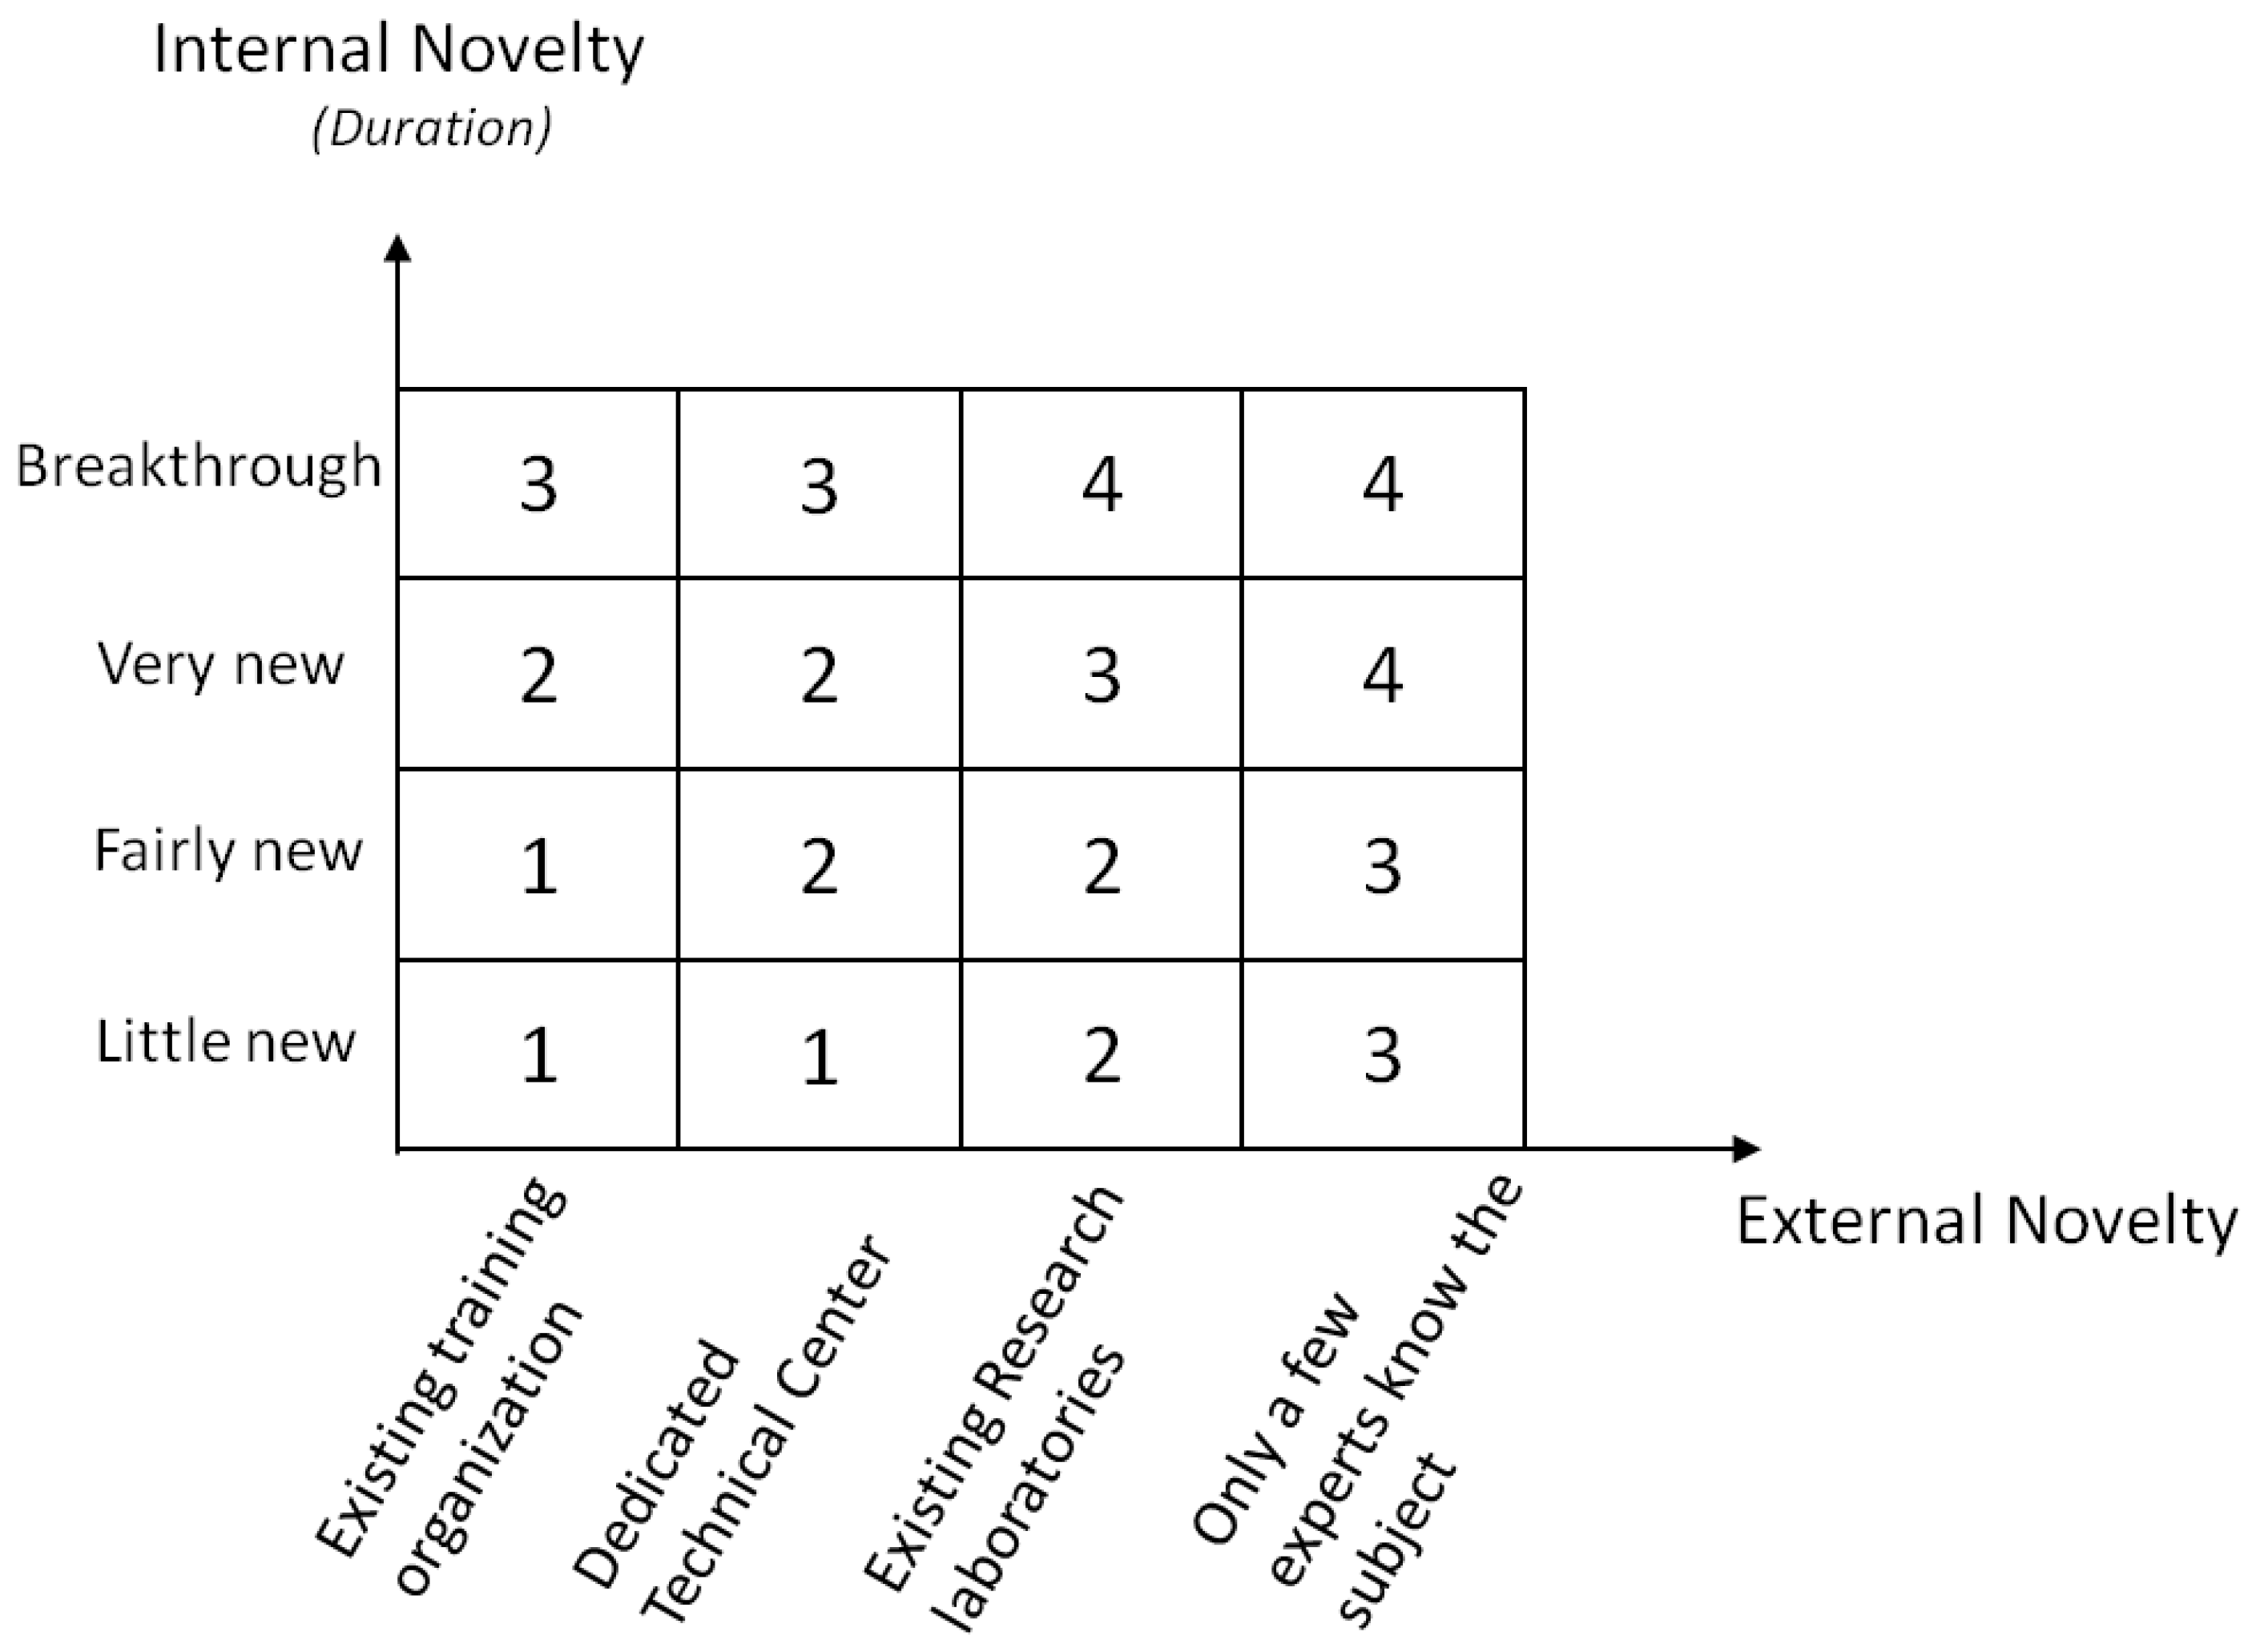
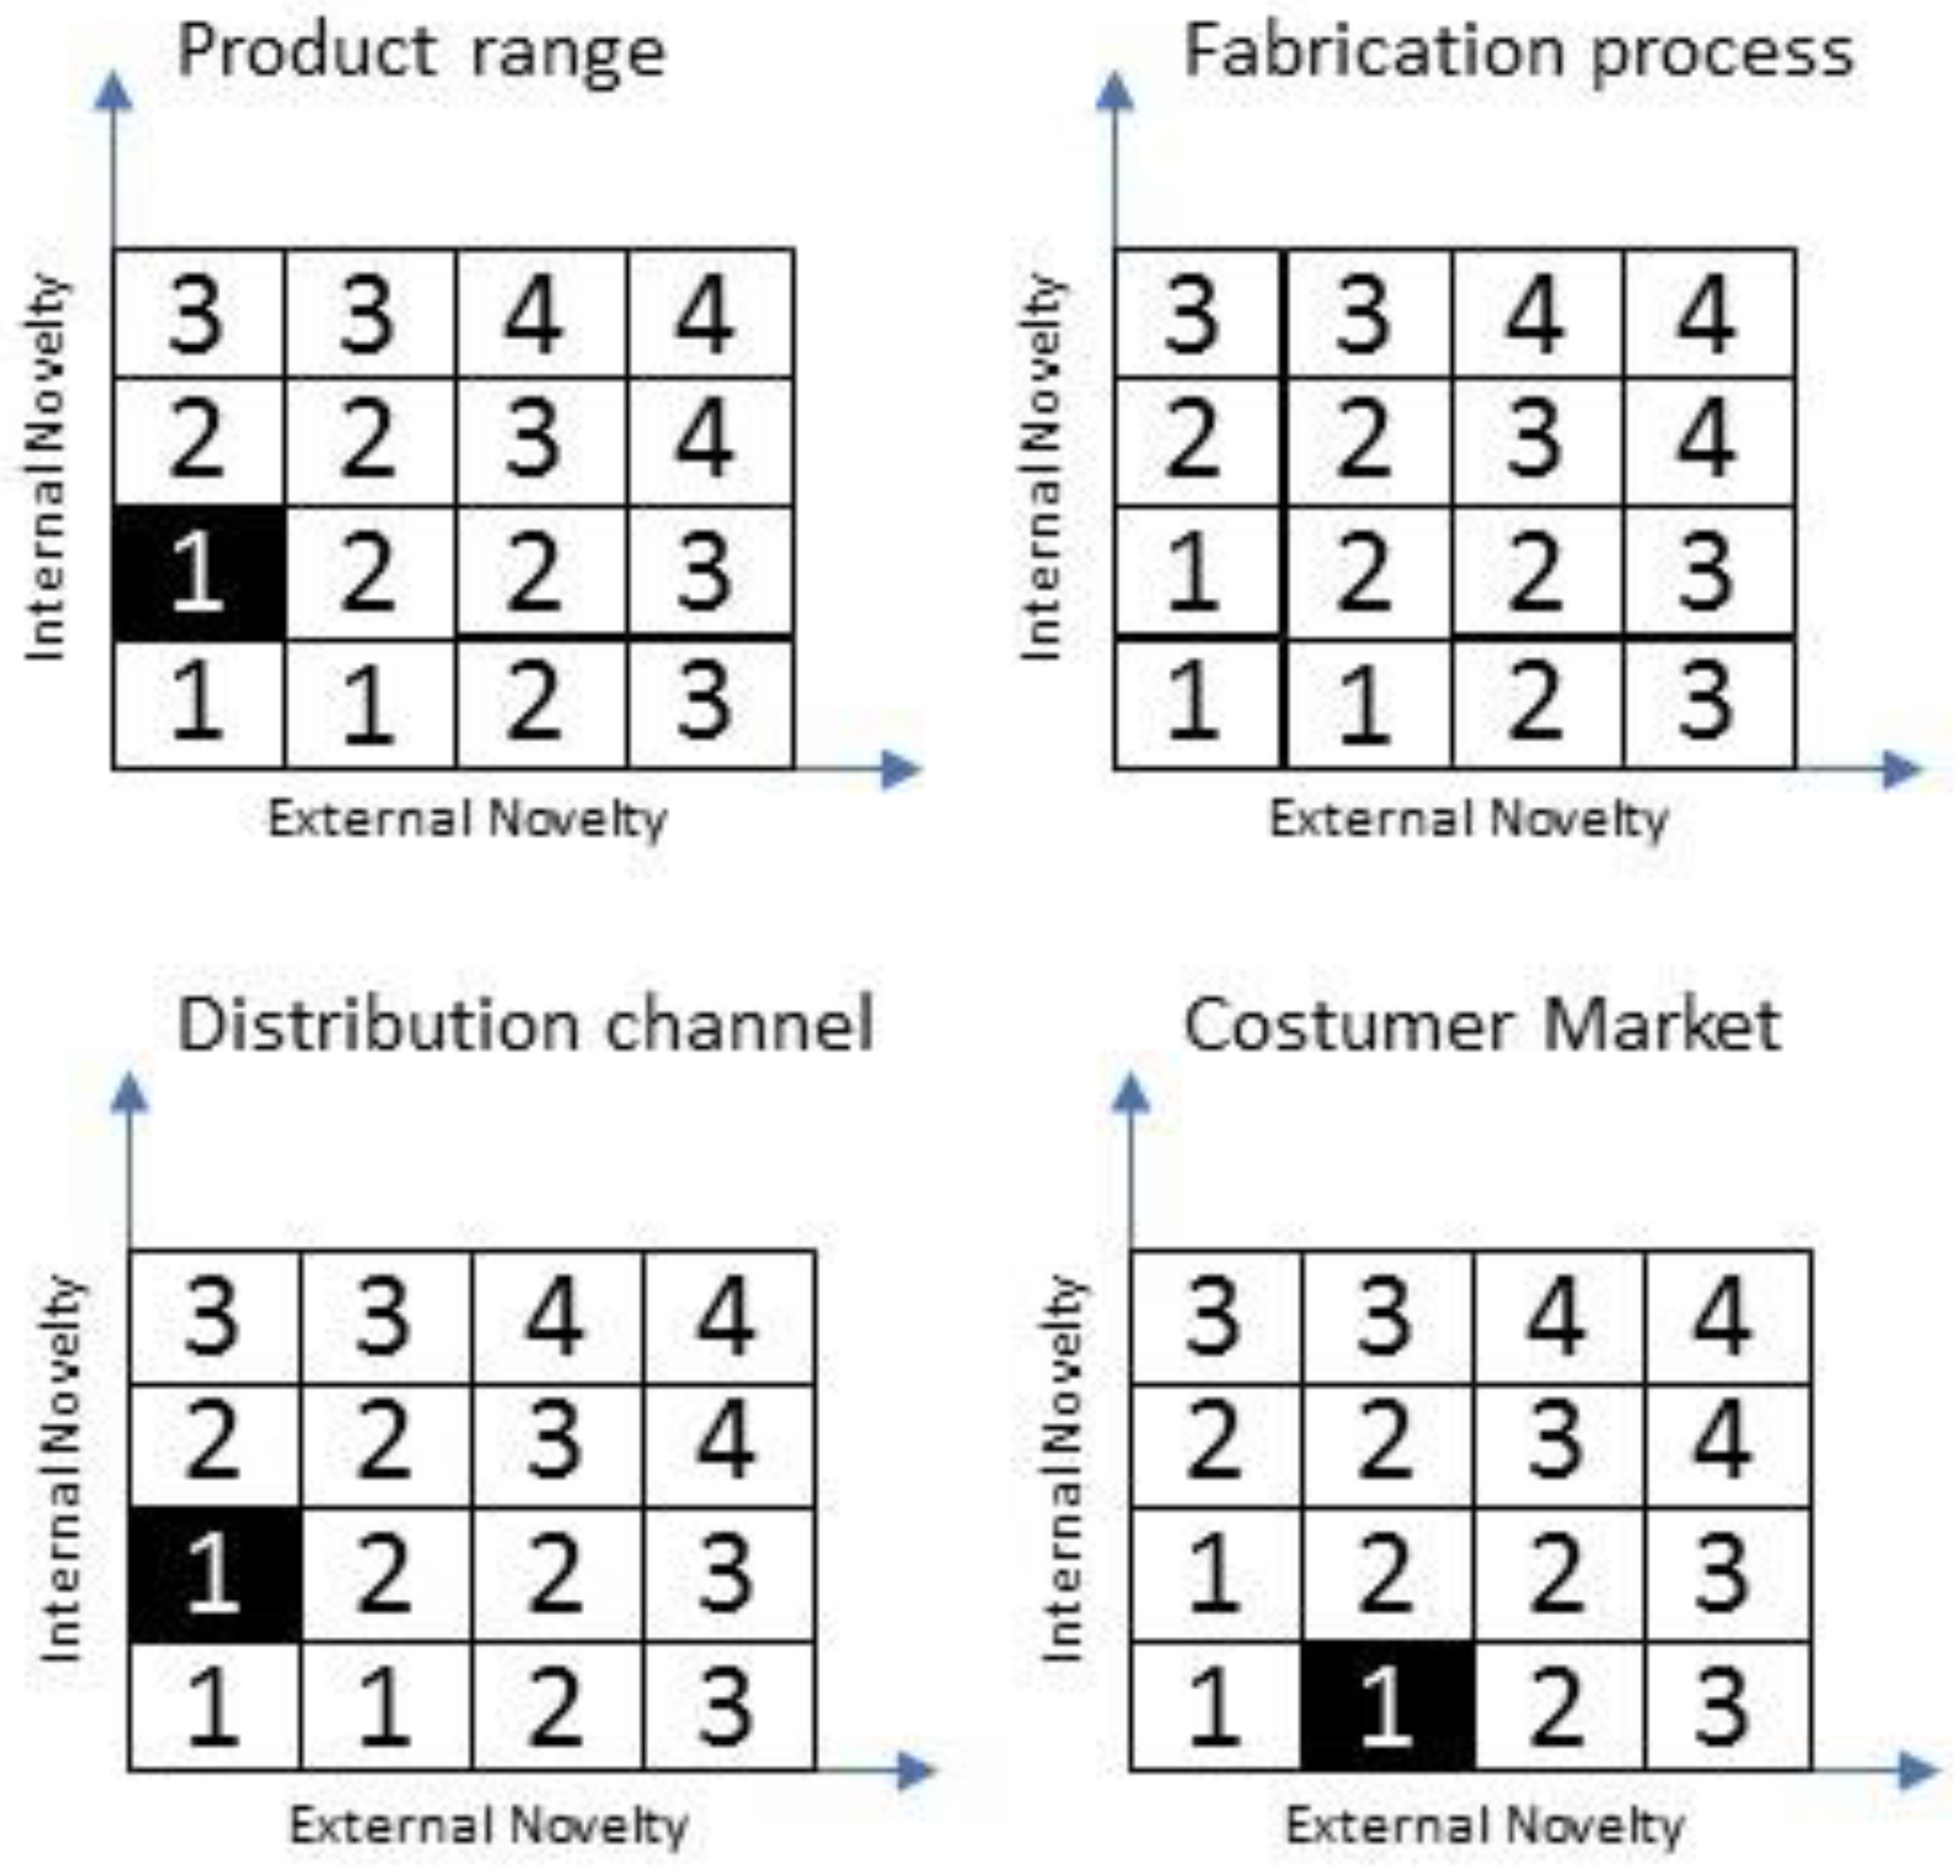
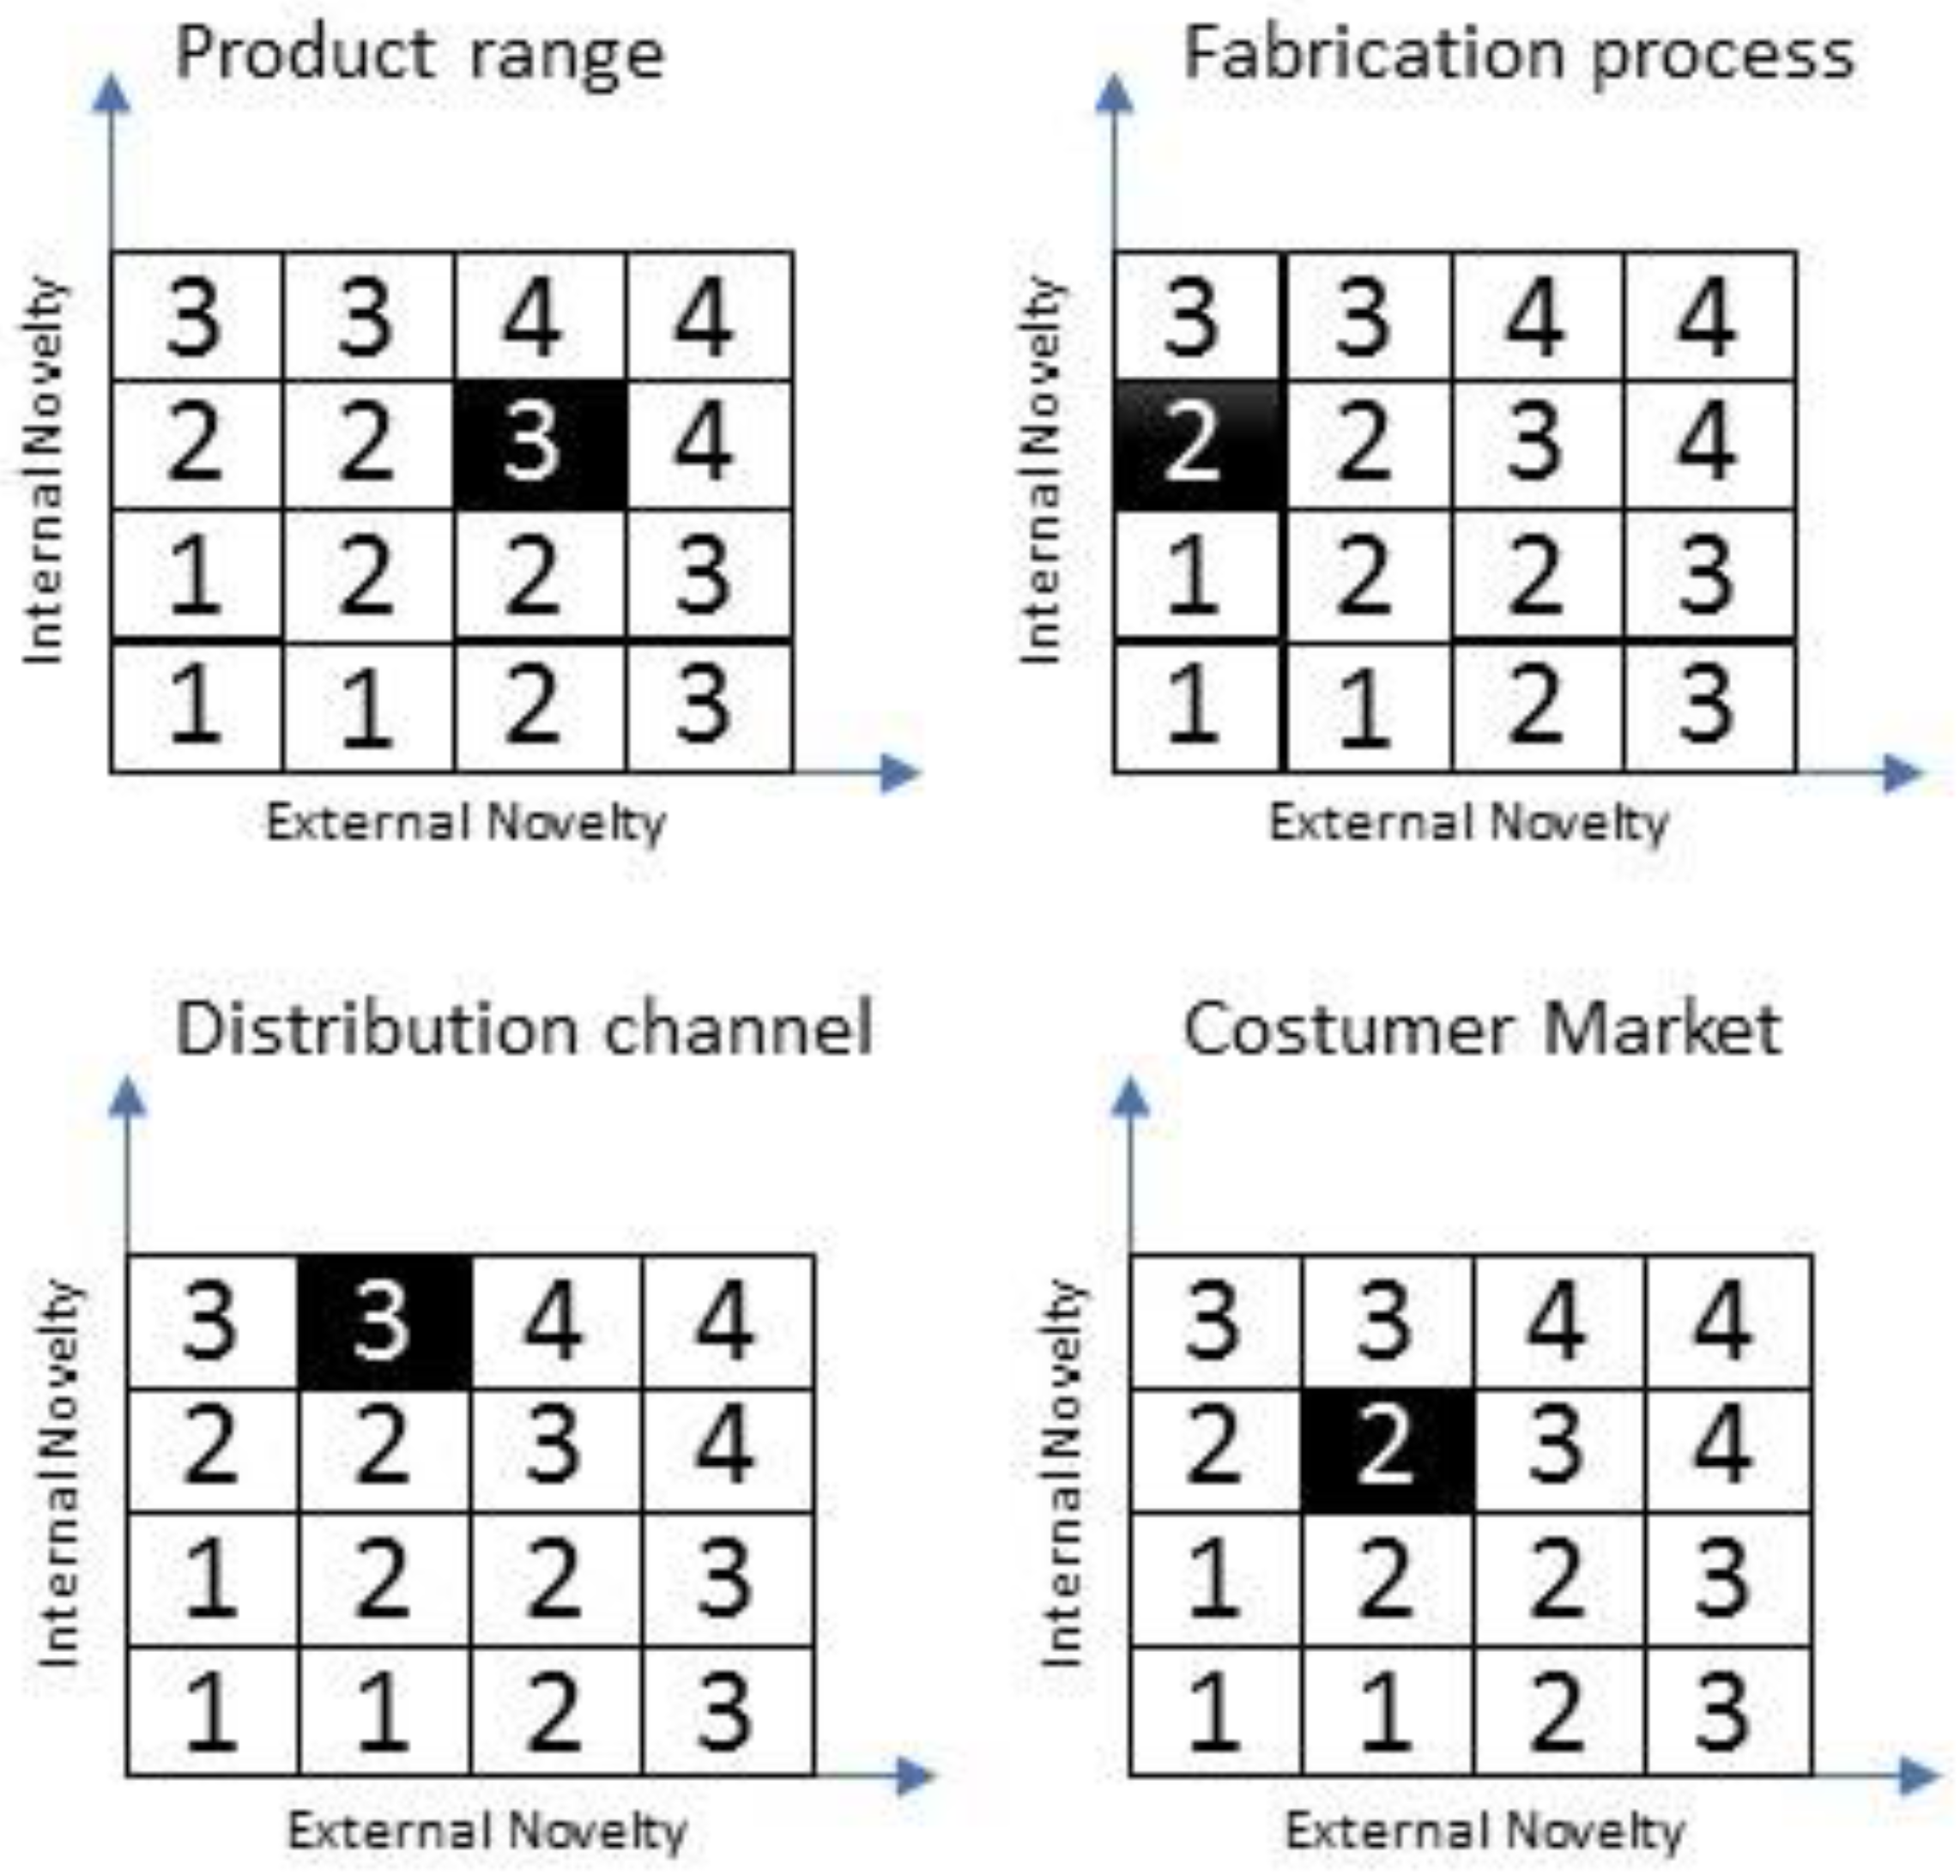
3.1. Stage 1: Project Characterization According to Its Complexity

The main characteristic of an innovative project is its complexity. A greater project complexity degree implies a more difficult management process, therefore, higher requirements for the company’s technological system. The authors propose a classification of innovation projects based on their novelty degree (Boly et al. 2012; Garcia and Calantone 2002). A novelty matrix is proposed (Figure 3) measuring on the x-axis the external novelty degree and on the y-axis the internal novelty degree. The internal axis evaluates the necessary preparation of the company and the estimated duration of the innovation project. The duration has to be adapted upon the considered sector. The external axis evaluates the knowledge sources necessary for project development (Garcia and Calantone 2002).
Brook and Pagnanelli (2014) postulate that the project novelty degree should impact the technological system of the company through the internal knowledge or in its relationship with the environment. And according to the definition of Mortensen and Bloch (2005), an innovation can concern a product/service, a process, a sales method, or an organizational method. So, the novelty of an innovation is integrated into one or more of these elements. That is why, relying on this definition, three variables are defined to quantify the internal impact of the project: product range (P), fabrication process (F) and distribution channel (S). We have chosen to keep only these three elements, because we consider that the organizational novelty can be considered as a potential combination of the other three. The external impact will be quantified through the variable customer market (C). Indeed, any change concerning the targeted market of the company represents a new challenge (Talke et al. 2009). These four variables are independent of each other. Therefore, each of these variables must be evaluated through a novelty matrix. Thus, the four assessment matrices originate a vector (P; F; S; C) with values between 1 and 4, depending on the novelty degree that the project has for the four variables (4 representing the higher novelty degree).

3.2. Stage 2: Technological System Components

In the Section 2.2 a framework for innovative project management practices was established. So, we can define the technological system of a company based on five dimensions that are decomposed into a good practices group (see Table 2). Each one of these practices represents an element to be evaluated in order to determine the development degree of the company’s technological system. Consequently, a maturity grid will be associated to each practice, constituting an evaluation matrix of dimension (38 × 4). The number 38 represents the practices to be evaluated and the number 4 shows the different maturity levels. The maturity grids are regularly used to measure the internal practices of the organizations (Antunes et al. 2014; Zhang et al. 2012; Wendler 2012). The maturity grids thus make it possible to describe in a progressive and gradual way the necessary stages to reach a level of maximum development concerning a considered activity (Maier et al. 2012). These maturity levels show the possible performance that the company can achieve in a particular practice starting with the worst possible level (lowest level of maturity) reaching an optimum level (total level maturity) (Table 3: example). It was decided to work with four levels by analogy to the innovative companies’ classification in four categories proposed by (Godet 2007).
One of the advantages of the maturity grid is that it defines each of the levels as descriptive texts that allow improving the understanding of the practice to be evaluated and decreases the subjectivity to make the evaluation.

3.3. Stage 3: Project Impact Assessment

The third necessary element to establish the methodology is the method to quantify the project impact on the technological system of the company. For this, a matrix is constituted based on the number of practices versus the 4 variables that can be affected by the project complexity.
( X p 1 X f 1 X s 1 X c 1 X p 38 X f 38 X s 38 X c 38 )
The elements of this matrix can take three values that represent the impact intensity per variable for each of the practices. These three degrees of intensity are: zero impact (value = 0), average impact (value = 0.5) and total impact (value = 1).

3.4. Stage 4: Requirement Profile Definition

Finally, the methodology proposes an algorithm to integrate the three elements defined in the previous stages and thus define the exigency profile of the innovation project on the technological system of the company. First, a gross impact score (GIS) is defined (Equation (1)), which is represented by the multiplication between the impact matrix and the variables vector.
( X p 1 X f 1 X s 1 X c 1 X p 38 X f 38 X s 38 X c 38 )     ( P F S C )
G I S i =   P X p i +   F   X f i +   S   X s i +   C   X c i
Moreover, if a variable is affected in the project characterization matrix and that variable also has an impact of at least 0.5 in the impact matrix, that variable is really affected in the corresponding practice. For example, if we have the characterization vector: (2; 1; 3; 0) and in the impact matrix the row corresponding to practice 1.1 is: (0; 1; 0.5; 1). In this practice, two variables are really affected corresponding to the fabrication process (F) and distribution channel (S), because these are the only variables having values different to zero for both the characterization vector and the impact matrix. The customer market variable (C), is not affected since in the characterization vector its value is zero, while the variable product range (P,) is not affected since in the impact matrix its value is zero, Then, if more variables are affected, greater will be complexity that the company must manage, therefore, to take into account this phenomenon, an index of complementary complexity (CCI) is proposed Table 4.
Then, the sum of the gross impact score and the complementary complexity index allows the calculation of the global impact that the project will have on the practices of the technological system.
G I S i +   C C I i =   G l o b a l   I m p a c t   I n d e x i
The Global Impact Index has a range of 0 to 20; however, the practices of the technological system are evaluated with a grid system of four levels maturity. Therefore, it is necessary to normalize the global impact range to the four-level scale of the maturity grids. This adjustment was made based on the opinion of experts and the feedback of a group of companies. The result is shown in the next table.
Moreover, the set of requirement levels for each of the 38 practices defines the project requirement profile on the company technological system. In this way, by comparing it with the evaluation made at the current maturity level of the company technological system, it will be known if it supports the project requirements.

4. Two Illustrative Case Studies: Innovative Projects in Different Firm Contexts

This section describes two different cases of application of the proposed methodology. They represent innovation projects with different characteristics, especially in terms of novelty degree.

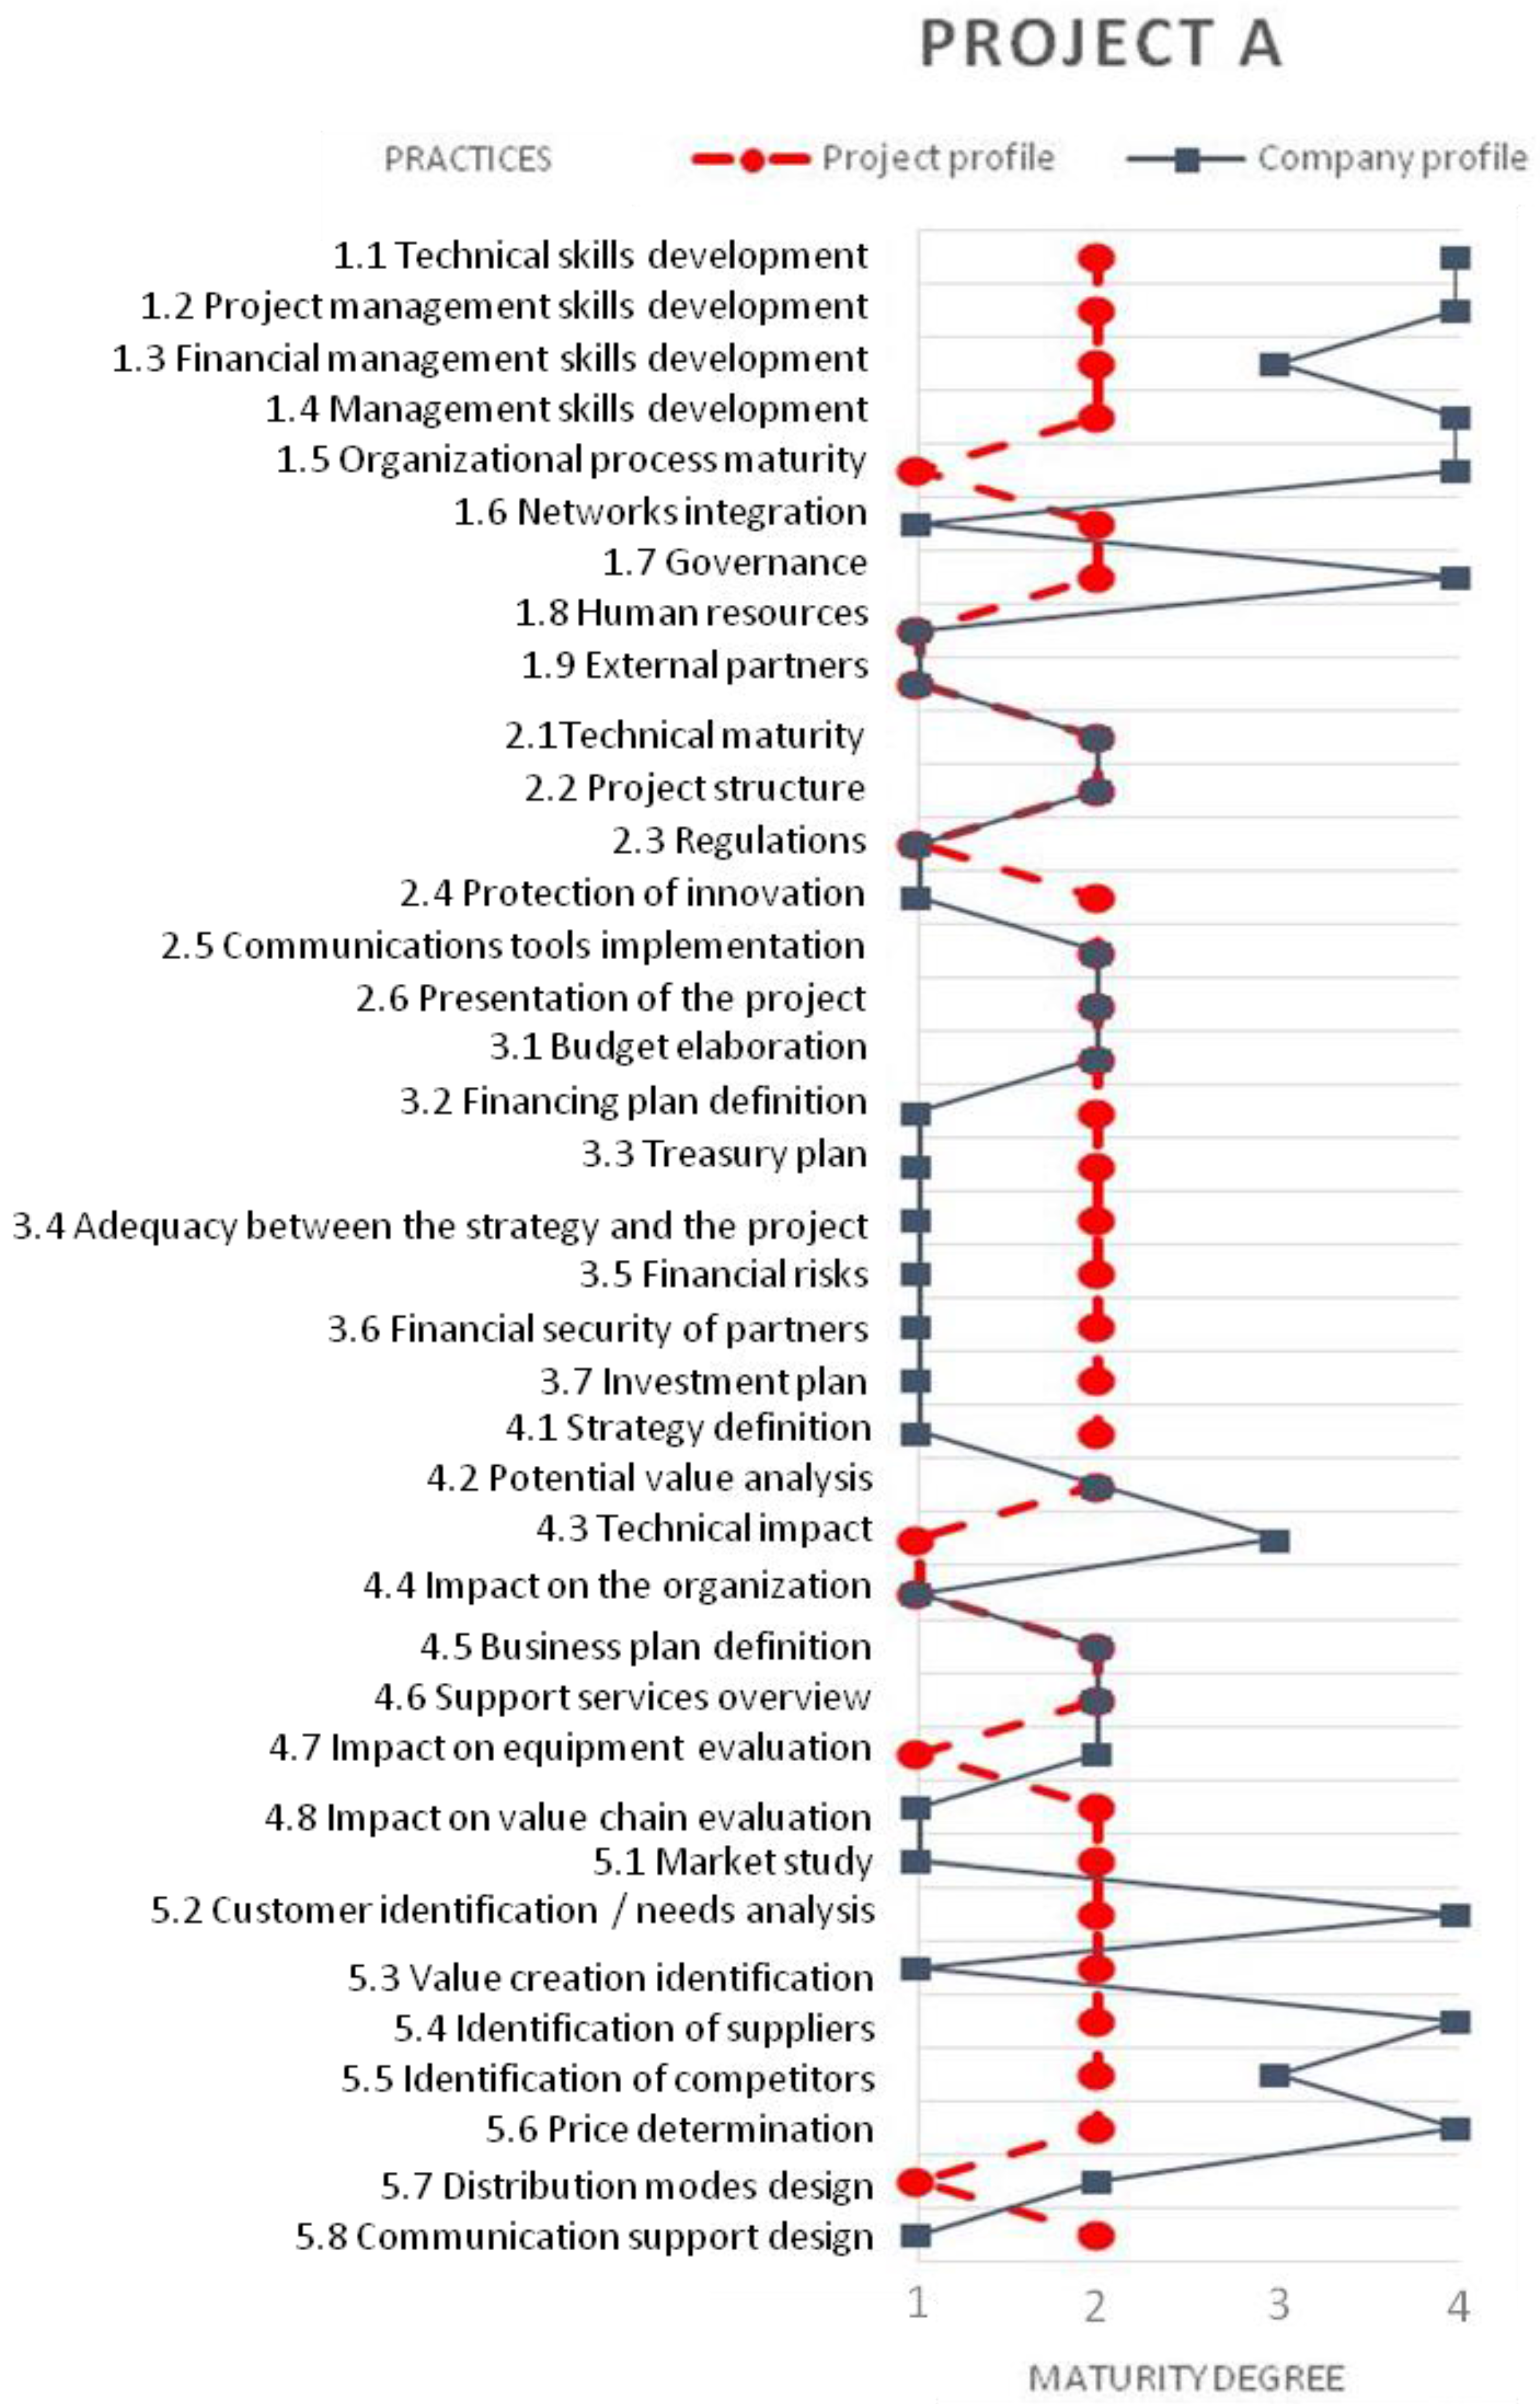
4.1. Case Study 1: Project A

The first case study concerns a start-up company within optical components sector, through the development and the commercialization of standard control solutions for all, professionals and manufacturers of spectacle lenses. The proposed innovation is based on the automatic detection of the lens axis and the visualization of the engravings on their frames; the company considers developing a product enabling to track the machining quality control and the lenses edging/mounting simultaneously.
In order to start the innovation project assessment, the project manager, together with a group of experts, characterizes the project according to the four variables defined in Stage 1. In this case, this project represents a weak novelty degree, for both the internal areas of the company as well as for its external environment. Figure 4 shows the variables of product range (P), distribution channel (S) and customer market (C), have a low impact evaluated by 1, whereas the variable fabrication process (F) is not affected, so has an impact of zero. Therefore, the resulting vector is (1; 0; 1; 1).
Regarding the company characteristics, it is necessary to evaluate the current maturity degree of the technological system and define the impact matrix. The project manager answered a survey based on the above described maturity grids to determine the maturity profile of the 38 practices that characterizes the company’s technological system as defined in Stage 2 of the methodology. The impact matrix is constructed from the opinion of an experts group, as an example the matrix for the 8 practices associated with the management level of market (practices 5.1 to 5.8, see Table 2) is evaluated as follows:
Impact   matrix   of   Market   =   ( 1 0 1   1 1 0 1   1 1 1 1 1 0 0.5 0 0.5 0 1 0 0 1 0.5 1 1 1 1 1 0.5 1 1 1 1 )
Then, using the impact matrix and the project characterization vector, the gross impact score and the complementary complexity index are defined. Using equation 1, the product of the impact matrix and the project characterization vector, allows obtaining a vector of 38 elements that shows the gross impact score of the project. Continuing with the example of management level of market, (practices 5.1 to 5.8), the GIS is shown for the eight associated practices.
( 1 0 1   1 1 0 1   1 1 1 1 1 0 0.5 0 0.5 0 1 0 0 1 0.5 1 1 1 1 1 0.5 1 1 1 1 ) ( 1 0 1 1 ) = ( 3 3 3 2 3 3 2 2.5 )   =   GIS
The complementary complexity index (CCI) is constructed by comparing the elements of each row of the impact matrix with the elements of the project characterization vector. If both in the matrix and in the vector the compared element is at least 0.5, it is considered that the associated variable is really affected. Then, according to Table 4, the complementary complexity index of each of 38 practices is determined. This index is shown below for the eight practices of the management level of market.
CCI = ( 3 3 3 3 3 3 2 3 )
Then the global impact is given by the sum between GIS and the complementary complexity index, doing this exercise for the eight practices associated with the market:
GIS + CCI = Global impact index
( 3 3 3 2 3 3 2 2.5 )   +   ( 3 3 3 3 3 3 2 3 ) = ( 6 6 6 5 6 6 4 5.5 )
Finally, according to global impact index, Table 5 allows calculating the project requirement level for the different practices. Of the practices associated with the market, only practice 5.7 (distribution mode design), shows a requirement level of 1 ([0; 4]), while the remaining seven practices are in the requirement range of 2 ([4; 8]). Figure 5 shows the comparison between the project requirement level (red line) and maturity level of the company technological system evaluated in Stage 2 (blue line).
In this case, the maturity degree of the company technological system is below the project requirement level in 12 of the 38 practices, i.e., by 31.5%. The most critical management level is the financial structure, since the company only covers one of the seven associated practices, considerably increasing the probability of project failure due to a lack of financial support. The potential recommendation for the company is that it has to work to strengthen its maturity level of the 12 practices that are below the project requirement level, giving priority to the practices associated with the financial structure.

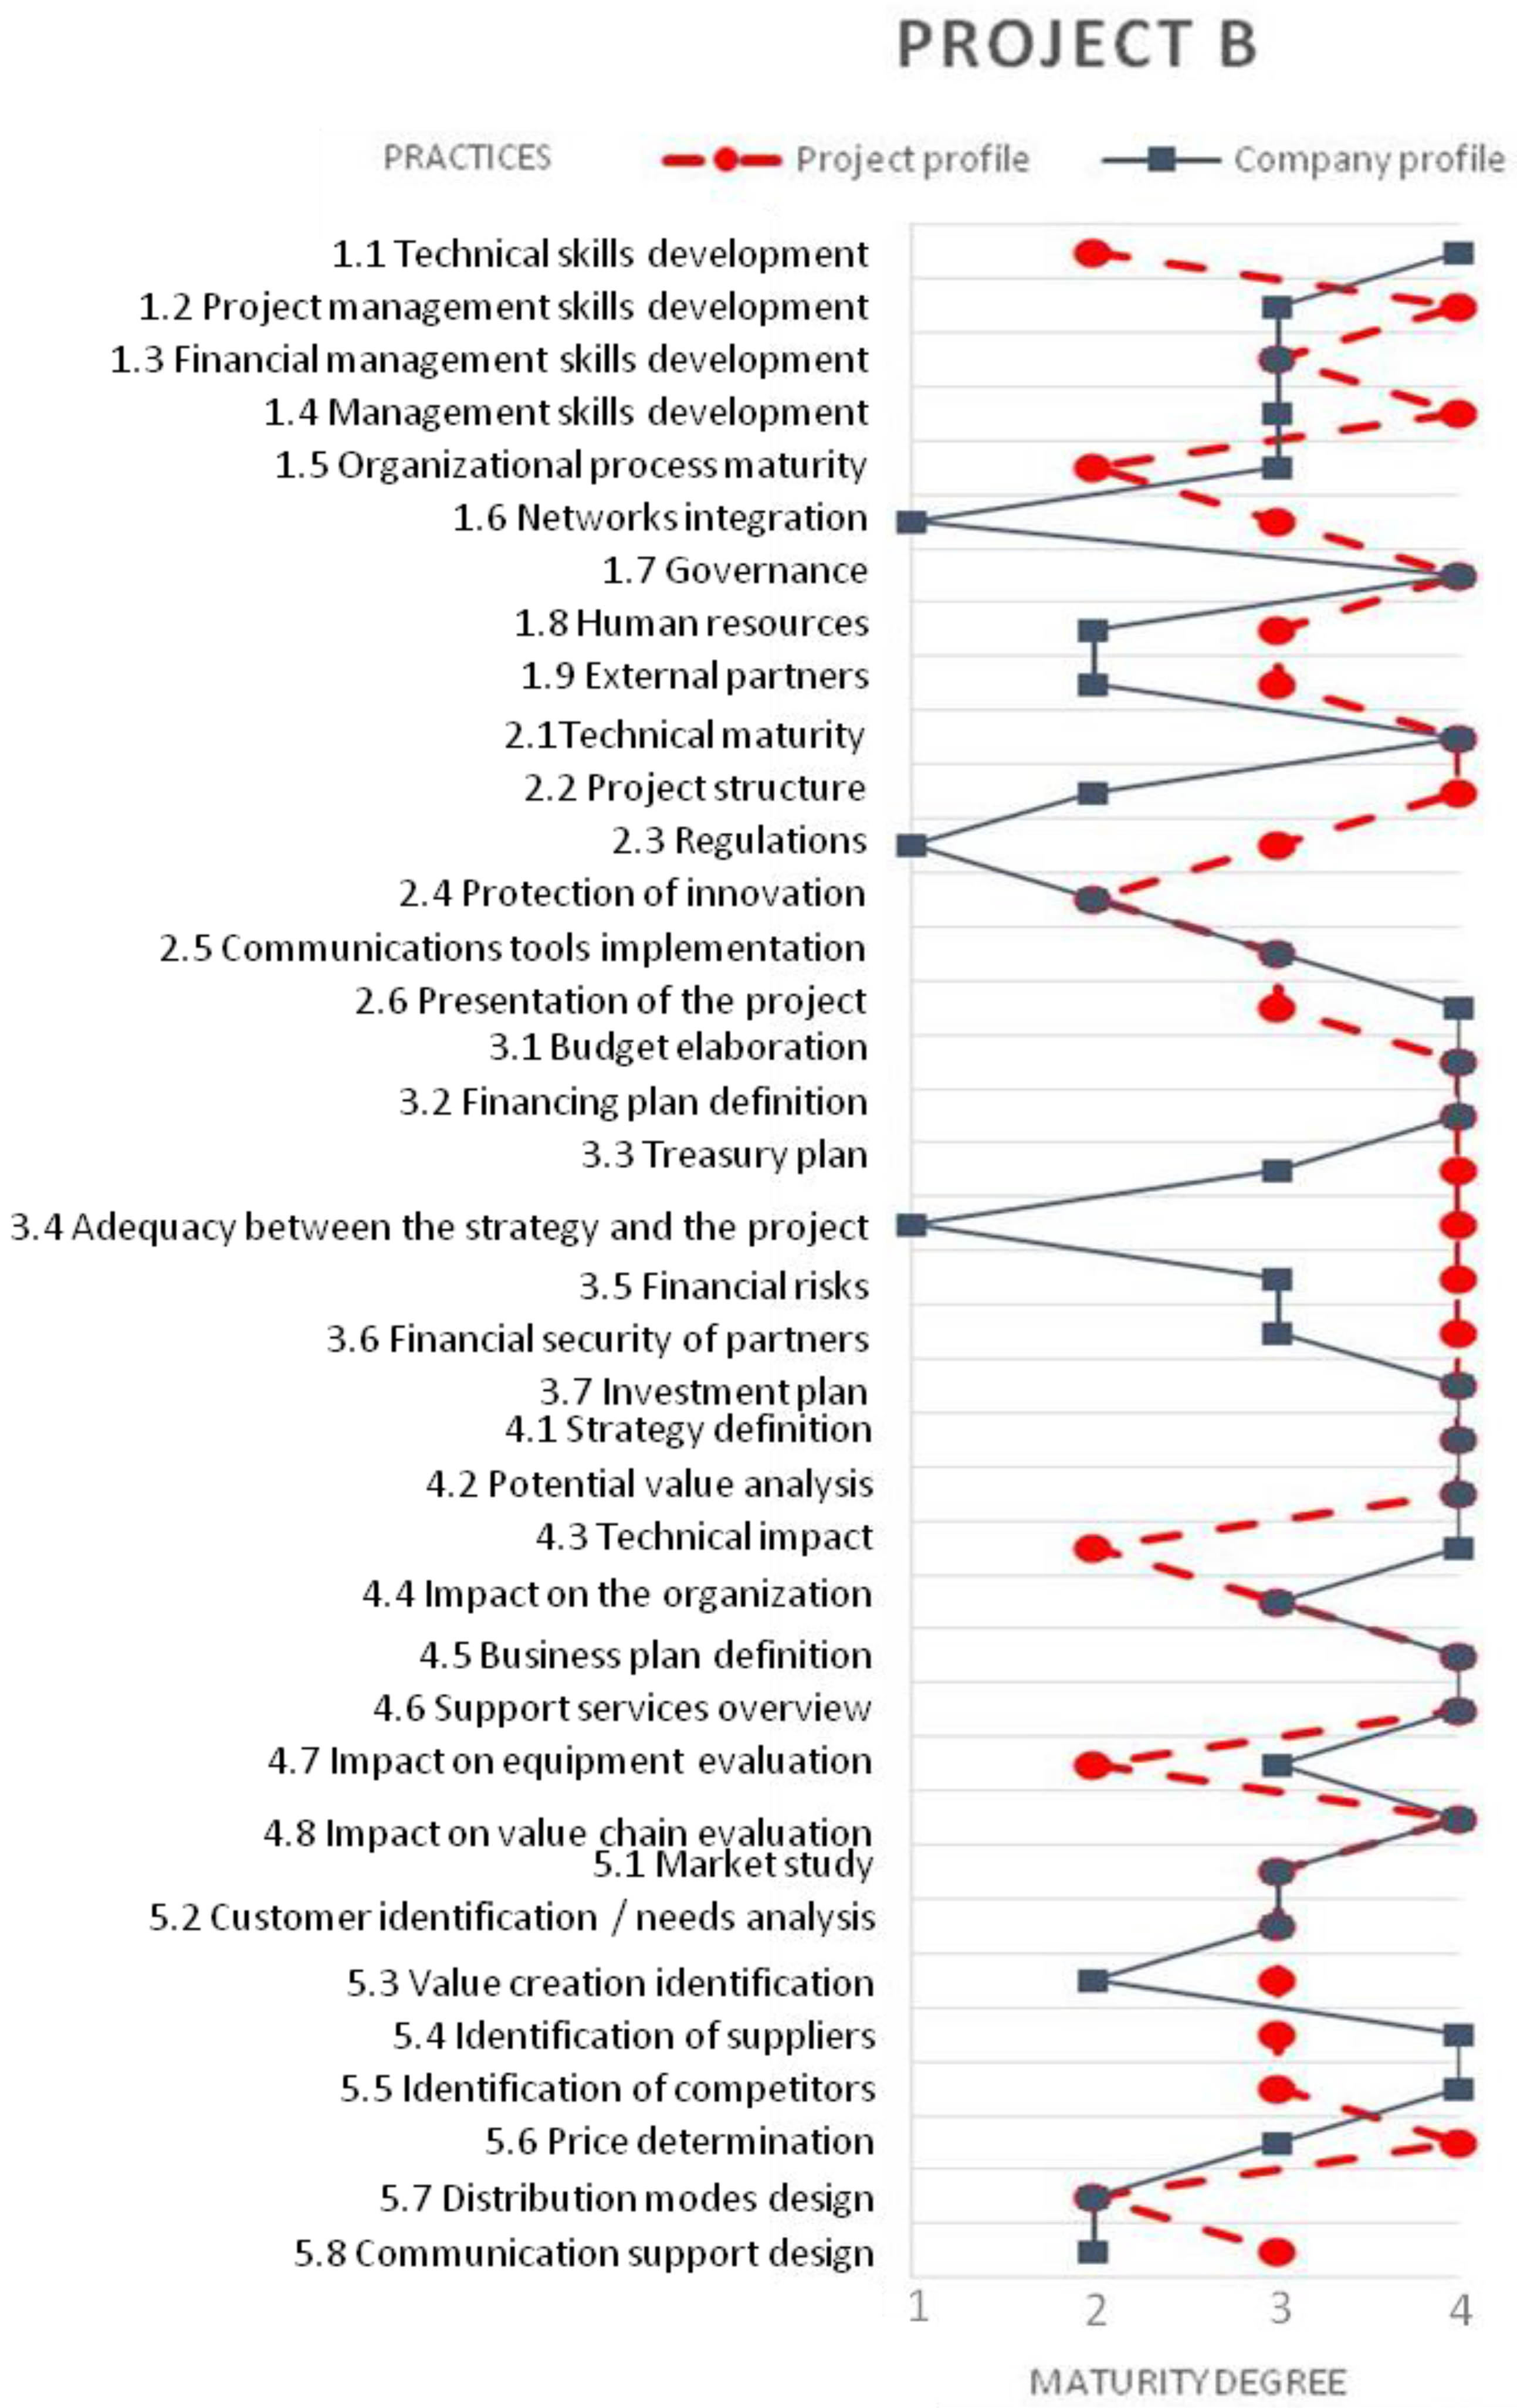
4.2. Case Study 2: Project B

The second case study also concerns a company in the high-technology sector. This company considers implementing the design, production and commercialization of an easy-to-use drone dedicated to professionals. It is controlled by a Smartphone application; the fully autonomous drone does fly from a predefined plan to make photographs and aerial mapping.
The project manager characterized the innovation project according to its novelty degree, obtaining the following vector (3; 2; 3; 2). Figure 6 shows the novelty matrix for the four variables, in this case there is an innovation project with a medium/high novelty degree.
This project shows a much more requirements profile than the previous project, mainly due to the differences in the project characterization vector of both cases. The company technological system does not support the project requirements in 14 of the 38 practices; the risk of this project is because the gaps are higher in Figure 7. Practice 3.4 of adequacy between the strategy and the project shows a maximum gap of three levels, while other three practices show a gap of two levels, making the feasibility of the company to develop the project properly minimal. Thus, the company needs to plan a list of activities to improve weak practices; the configuration of this action plan must be realized by analyzing the maturity grid in the selected practices, since it shows the necessary progress to achieve the required maturity level by the innovation project.

5. Conclusions

The innovation project management methodologies have focused on giving flexibility to the process during the development of the project, however following a proper project deployment does not enough to ensure a successful outcome. Thus, the methodology proposed in this paper appears as a complementary tool to know if the company is really able to manage a new project.
So, the company can make the decision to launch a new project knowing if its technological system can support this project. The evaluation of the development level of the company technological system can be applied at different times. Therefore, a company could evaluate its technological system before and after executing a project, allowing quantifying the degree of learning or the impact of a project on the company. So, the proposed tool offers a decision-making support but it also appears as a pedagogical tool. Indeed, the notion of learning is a very strong one in this research work, because the identification of gaps does not necessarily mean that the company should not lead the project. This makes it possible to highlight the critical points to be addressed in order to set up a learning and skills upgrading process.
Moreover, this methodology opens the possibility of generating a projects portfolio based on the capability of the company to manage the complexity of innovation projects. The proposed tool can also be used as a standardized evaluation indicator to compare different projects on a similar basis. On the basis of this comparison, the company could choose the most appropriate project(s) for its own situation. Arbitrations can thus be made based on the gaps associated with each project and in accordance with the global strategy of the company.
Finally, at this stage of the research work, project management was mainly considered in closed innovation mode, which is a limitation of our study. However, a collaborative scenario could be envisaged. Companies that have a development profile of their technological system lower than the minimum required by the project in some practices can be associated with other companies that cover the gaps. Thus, highly complex projects could be developed as open innovation between companies with complementary technological systems.
Some implications of the proposed methodology for innovation managers:
  • It gives a holistic vision of the project impacts, beyond the pure technical product features.
  • It allows a better comprehension of the company’s technological system and the way to manage it.
  • It could provide communication elements to the company team, about the impacts and challenges on the new project’s appropriation by the firm.
From a work perspective, field testing and feedback from innovation managers are very important to calibrate the proposed tool, mainly the impact matrix. In addition, the tool should consider integrating a mechanism to make decision-making flexible and dynamic in order to better adapt to the different characteristics of each project. Currently, some additional restrictions are being tested in the model. They are designed as conditional equations, i.e. they are activated only if the evaluated project complies with some defined characteristics. In this way, we seek to improve the adaptation of the proposed tool to the reality of companies when managing a new innovation project. Finally, as a perspective, there is the possibility of integrating an additional section in the tool to support the decision making to choose the most appropriate innovation project management methodology to implement, based on the characteristics of the company and the project.

Acknowledgments

This research work has been supported by the Research Chair PRINCIP, granted by the French “Innovation and Industry Fund” (F2I) and the Union of Metal Industries and Professions (UIMM).

Author Contributions

Daniel Galvez, Johan Claire, Manon Enjolras and Vincent Boly codesigned the conceptual framework of this research work. Johan Claire and Daniel Galvez designed and performed the experiments. Johan Claire, Daniel Galvez and Mauricio Camargo analyzed the results. Daniel Galvez, Manon Enjolras and Mauricio Camargo wrote the paper.

Conflicts of Interest

The authors declare no conflict of interest.

References

  1. AFNOR. 2013. FD X50-271—Management de l’innovation—Guide de mise en œuvre d’une démarche de management de l’innovation. La Plaine Saint-Denis Cedex: AFNOR Editions. [Google Scholar]
  2. Antunes, Pedro, Paulo Carreira, and Miguel Mira da Silva. 2014. Towards an energy management maturity model. Energy Policy 73: 803–14. [Google Scholar] [CrossRef]
  3. Artto, Karlos, Iiro Kulvik, Jarno Poskela, and Virpi Turkulainen. 2011. The integrative role of the project management office in the front end of innovation. International Journal of Project Management 29: 408–21. [Google Scholar] [CrossRef]
  4. Atalay, Murat, Nilgün Anafarta, and Fulya Sarvan. 2013. The Relationship between Innovation and Firm Performance: An Empirical Evidence from Turkish Automotive Supplier Industry. Procedia 75: 226–35. [Google Scholar] [CrossRef]
  5. Batkovskiy, Aleksandr Mihajlovich, Alina Valerevna Konovalova, Elena Georgievna Semenova, Valerij Yaroslavovich Trofimets, and Alena Vladimirovna Fomina. 2015. Risks of Development and Implementation of Innovative Projects. Mediterranean Journal of Social Sciences 6: 243. [Google Scholar] [CrossRef]
  6. Besner, Claude, and Brian Hobbs. 2012. An Empirical Identification of Project Management Toolsets and a Comparison among Project Types. Project Management Journal 43: 24–46. [Google Scholar] [CrossRef]
  7. Boly, Vincent, Laure Morel, and Mauricio Camargo. 2012. Improving performance evaluation metrics to manage innovative projects. International Journal of Technology Intelligence and Planning 8: 215–32. [Google Scholar] [CrossRef]
  8. Boly, Vincent, Laure Morel, N’Doli Guillaume Assielou, and Mauricio Camargo. 2014. Evaluating innovative processes in French firms: Methodological proposition for firm innovation capacity evaluation. Research Policy 43: 608–22. [Google Scholar] [CrossRef]
  9. Boly, Vincent, Mauricio Camargo, Daniel Galvez, and Johan Claire. 2015. How to Adapt the Innovation Process to the Context and Objectives of the Project. Paper presented at International Association for Management of Technology (IAMOT), Cape Town, South Africa, June 8–11. [Google Scholar]
  10. Boly, Vincent, Mauricio Camargo, and Laure Morel. 2016. Ingénierie de l’innovation, 3rd ed. Paris: Hermes Science Publications. [Google Scholar]
  11. Brook, Jacques W., and Fabrizio Pagnanelli. 2014. Integrating sustainability into innovation project portfolio management—A strategic perspective. Journal of Engineering and Technology Management 34: 46–62. [Google Scholar] [CrossRef]
  12. Candi, Marina, Jan van den Ende, and Gerda Gemser. 2013. Organizing innovation projects under technological turbulence. Technovation 33: 133–41. [Google Scholar] [CrossRef]
  13. Christiansen, John K., and Marta Gasparin. 2016. Managing Controversies in the Fuzzy Front End. Creativity and Innovation Management 25: 500–14. [Google Scholar] [CrossRef]
  14. Claire, Johan, Daniel Galvez, Vincent Boly, Mauricio Camargo, and Johan Claire Moselle. 2014. A New Innovation Project Maturity Assessment Methodology Based on Innovation Degree. Paper presented at 2014 International Conference on Engineering, Technology and Innovation (ICE), Bergamo, Italy, June 23–25; pp. 1–8. [Google Scholar]
  15. Cooper, Robert G. 1990. Stage-gate systems: A new tool for managing new products. Business Horizons 33: 44–54. [Google Scholar] [CrossRef]
  16. Cooper, Robert G. 2008. Perspective: The Stage-Gate® Idea-to-Launch Process—Update, What’s New and NexGen Systems. Journal of Product Innovation Management 25: 213–32. [Google Scholar] [CrossRef]
  17. Cooper, Robert G. 2016. Agile–Stage-Gate Hybrids. Research-Technology Management 59: 21–9. [Google Scholar] [CrossRef]
  18. De Wit, Anton. 1988. Measurement of project success. International Journal of Project Management 6: 164–70. [Google Scholar] [CrossRef]
  19. Eriksson, Per Erik, Johan Larsson, and Ossi Pesämaa. 2017. Managing complex projects in the infrastructure sector—A structural equation model for flexibility-focused project management. International Journal of Project Management 35: 1512–23. [Google Scholar] [CrossRef]
  20. Fernandes, Gabriela, Stephen Ward, and Madalena Araújo. 2015. Improving and embedding project management practice in organisations—A qualitative study. International Journal of Project Management 33: 1052–67. [Google Scholar] [CrossRef]
  21. Garcia, Rosanna, and Roger Calantone. 2002. A critical look at technological innovation typology and innovativeness terminology: A literature review. Journal of Product Innovation Management 19: 110–32. [Google Scholar] [CrossRef]
  22. García-Quevedo, José, Agustí Segarra-Blasco, and Mercedes Teruel. 2018. Financial constraints and the failure of innovation projects. Technological Forecasting and Social Change 127: 127–40. [Google Scholar]
  23. Godet, Michel. 2007. Manuel de prospective stratégique—Tome 2—3ème edition—L’Art et la méthode, 3rd ed. Paris: Editions Dunod. [Google Scholar]
  24. Kapsali, Maria. 2011. Systems thinking in innovation project management: A match that works. International Journal of Project Management 29: 396–407. [Google Scholar] [CrossRef]
  25. Larson, Erik W., and Clifford F. Gray. 2011. Project Management: The Managerial Process. New York: McGraw-Hill Irwin. [Google Scholar]
  26. Maier, Anja M., James Moultrie, and P. John Clarkson. 2012. Assessing Organizational Capabilities: Reviewing and Guiding the Development of Maturity Grids. IEEE Transactions on Engineering Management 59: 138–59. [Google Scholar] [CrossRef]
  27. Mintzberg, Henry. 1979. The Structuring of Organizations. Englewood Cliffs: Pearson. [Google Scholar]
  28. Mitchell, Rick, Robert Phaal, and Nicky Athanassopoulou. 2014. Scoring Methods for Prioritizing and Selecting Innovation Projects. Paper presented at PICMET ‘14 Conference: Portland International Center for Management of Engineering and Technology, Kanazawa, Japan, July 27–31; pp. 907–20. [Google Scholar]
  29. Morel, Laure, Mauricio Camargo, and Vincent Boly. 2015. Comment réussir le pilotage d’un projet d’innovation dans une PME/PMI. In le Grand Livre de l’Économie PME. Paris: LGDJ. [Google Scholar]
  30. Mortensen, Peter Stendahl, and Carter Walter Bloch. 2005. Oslo Manual: Guidelines for Collecting and Interpreting Innovation Data, 3rd ed. Paris: OECD Publishing. [Google Scholar]
  31. Project Management Institute. 2017. A Guide to the Project Management Body of Knowledge, 6th ed. Newtown Square: Project Management Institute. [Google Scholar]
  32. Radujković, Mladen, and Mariela Sjekavica. 2017. Project Management Success Factors. Procedia Engineering 196: 607–15. [Google Scholar]
  33. Rosenbusch, Nina, Jan Brinckmann, and Andreas Bausch. 2011. Is innovation always beneficial? A meta-analysis of the relationship between innovation and performance in SMEs. Journal of Business Venturing 26: 441–57. [Google Scholar] [CrossRef] [Green Version]
  34. Salerno, Mario Sergio, Leonardo Augusto de Vasconcelos Gomes, Débora Oliveira da Silva, Raoni Barros Bagno, and Simone Lara Teixeira Uchôa Freitas. 2015. Innovation processes: Which process for which project? Technovation 35: 59–70. [Google Scholar] [CrossRef]
  35. San Cristóbal, José Ramón. 2017. Complexity in Project Management. Procedia Computer Science 121: 762–66. [Google Scholar]
  36. Santos, David Ferreira Lopes, Leonardo Fernando Cruz Basso, Herbert Kimura, and Eduardo Kazuo Kayo. 2014. Innovation efforts and performances of Brazilian firms. Journal of Business Research 67: 527–35. [Google Scholar] [CrossRef]
  37. Schulz, Jörn, Fee Steinhoff, and Kathrin Jepsen. 2017. Strike While the Iron Is Hot: User Centricity Adapted to the Agile Innovation Development Process. Cham: Springer, pp. 349–65. [Google Scholar]
  38. Schumpeter, Joseph A. 1934. The Theory of Economic Development: An Inquiry Into Profits, Capital, Credit, Interest, and the Business Cycle. Piscataway: Transaction Publishers. [Google Scholar]
  39. Takeuchi, Hirotaka, and Ikujiro Nonaka. 1986. The New New Product Development Game. Harvard Business Review. Available online: https://hbr.org/1986/01/the-new-new-product-development-game (accessed on 9 March 2018).
  40. Talke, Katrin, Sören Salomo, Jaap E. Wieringa, and Antje Lutz. 2009. What about design newness? Investigating the relevance of a neglected dimension of product innovativeness. Journal of Product Innovation Management 26: 601–15. [Google Scholar]
  41. Tripp, John F., and Deborah J. Armstrong. 2016. Agile Methodologies: Organizational Adoption Motives, Tailoring and Performance. Journal of Computer Information Systems 58: 170–79. [Google Scholar] [CrossRef]
  42. Wendler, Roy. 2012. The maturity of maturity model research: A systematic mapping study. Information and Software Technology 54: 1317–39. [Google Scholar] [CrossRef]
  43. Zawislak, Paulo Antônio, Jorge Tello Gamarra, André Cherubini Alves, Denise Barbieux, and Fernanda Maciel Reichert. 2014. The different innovation capabilities of the firm: Further remarks upon the Brazilian experience. Journal of Innovation Economics & Management 1: 129–50. [Google Scholar]
  44. Zhang, Lianying, Jing He, and Xinxing Zhang. 2012. The Project Management Maturity Model and Application Based on PRINCE2. Procedia Engineering 29: 3691–97. [Google Scholar]
Figure 1. Dimensions of innovation project management (Boly et al. 2015; Claire et al. 2014).
Admsci 08 00006 g001
Figure 2. Maturity assessment methodology of the company’s technological system in relation to innovation project profile required.
Admsci 08 00006 g002
Figure 3. Project characterization matrix according to its novelty degree.
Admsci 08 00006 g003
Figure 4. Characterization of project A.
Admsci 08 00006 g004
Figure 5. Comparison between the maturity profile of the company’s technology system and the profile required by project A.
Admsci 08 00006 g005
Figure 6. Characterization of project B.
Admsci 08 00006 g006
Figure 7. Comparison between the maturity profile of the company’s technology system and the profile required by project B.
Admsci 08 00006 g007
Table 1. FD X50-271 standards—Innovative project management (source: AFNOR (2013)).
Project FormulationProject FeasibilityInnovation DevelopmentInnovation Launch
MarketingCa1/Position the project launched in relation to the needs identified by the innovationCb1/Identify the usage scenariosCc1/Validate the adequacy of innovation to needsCd1/Confirm value creation goals
TechnologyCa2/Make the state of the art and identify the solutions for the projectCb2/Study the technical feasibilityCc2/Develop the technical solutionCd2/Qualify innovation and its implementation
Legislative/financingCa3/Define intellectual property strategy and financial strategyCb3/Put in place funding and test partnershipsCc3/Ensure the legal and financial management of the projectCd3/Finalize Intellectual property and innovation financing
Organization/ManagementCa4/Formulate/structure the launched projectCb4/Organize the projectCc4/manage the innovation developmentCd4/Supervise the innovation launch
Table 2. Project management practices framework.
Level 1. Team ProjectSources
1.1 Technical skills development(AFNOR 2013; Boly et al. 2015; Claire et al. 2014; Fernandes et al. 2015; Radujković and Sjekavica, 2017)
1.2 Project management skills development(AFNOR 2013; Boly et al. 2015; Claire et al. 2014; Fernandes et al. 2015; Radujković and Sjekavica 2017)
1.3 Financial management skills development(AFNOR 2013; Boly et al. 2015; Claire et al. 2014; Fernandes et al. 2015; Radujković and Sjekavica 2017)
1.4 Management skills development (Boly et al. 2015; Claire et al. 2014; Fernandes et al. 2015; Radujković and Sjekavica 2017)
1.5 Organizational process maturity (AFNOR 2013; Boly et al. 2015; Claire et al. 2014; Fernandes et al. 2015)
1.6 Networks integration (AFNOR 2013; Besner and Hobbs 2012; Boly et al. 2015; Claire et al. 2014)
1.7 Governance (AFNOR 2013; Besner and Hobbs 2012; Boly et al. 2015; Claire et al. 2014)
1.8 Human resources (Boly et al. 2015; Claire et al. 2014; Fernandes et al. 2015; Radujković and Sjekavica 2017)
1.9 External partners (AFNOR 2013; Boly et al. 2015; Claire et al. 2014)
Level 2. Project Process
2.1Technical maturity (AFNOR 2013; Boly et al. 2015; Claire et al. 2014)
2.2 Project structure (Besner and Hobbs 2012; Boly et al. 2015; Claire et al. 2014; Fernandes et al. 2015)
2.3 Regulations (AFNOR 2013; Boly et al. 2015; Claire et al. 2014)
2.4 Protection of innovation (AFNOR 2013; Boly et al. 2015; Claire et al. 2014)
2.5 Communications tools implementation(Besner and Hobbs 2012; Boly et al. 2015; Claire et al. 2014; Radujković and Sjekavica 2017)
2.6 Presentation of the project (Boly et al. 2015; Claire et al. 2014)
Level 3. Financial structure
3.1 Budget elaboration(Besner and Hobbs 2012; Boly et al. 2015; Claire et al. 2014)
3.2 Financing plan definition(AFNOR 2013; Besner and Hobbs 2012; Boly et al. 2015; Claire et al. 2014; Mitchell et al. 2014)
3.3 Treasury plan (Besner and Hobbs 2012; Boly et al. 2015; Claire et al. 2014)
3.4 Adequacy between the strategy and the project(Boly et al. 2015; Claire et al. 2014; Fernandes et al. 2015; Mitchell et al. 2014)
3.5 Financial risks (Besner and Hobbs 2012; Boly et al. 2015; Claire et al. 2014; Radujković and Sjekavica 2017)
3.6 Financial security of partners (Besner and Hobbs 2012; Boly et al. 2015; Claire et al. 2014)
3.7 Investment plan (Boly et al. 2015; Claire et al. 2014)
Level 4. Company resources
4.1 Strategy definition(AFNOR 2013; Besner and Hobbs 2012; Boly et al. 2015; Claire et al. 2014; Fernandes et al. 2015; Mitchell et al. 2014)
4.2 Potential value analysis(AFNOR 2013; Boly et al. 2015; Claire et al. 2014)
4.3 Technical impact (AFNOR 2013; Boly et al. 2015; Claire et al. 2014; Mitchell et al. 2014)
4.4 Impact on the organization (Besner and Hobbs 2012; Boly et al. 2015; Claire et al. 2014; Mitchell et al. 2014)
4.5 Business plan definition(Boly et al. 2015; Claire et al. 2014)
4.6 Support services overview(Boly et al. 2015; Claire et al. 2014)
4.7 Impact on equipment evaluation(Boly et al. 2015; Claire et al. 2014; Mitchell et al. 2014)
4.8 Impact on value chain evaluation(Boly et al. 2015; Claire et al. 2014; Mitchell et al. 2014)
Level 5. Market
5.1 Market study (AFNOR 2013; Boly et al. 2015; Claire et al. 2014; Mitchell et al. 2014)
5.2 Customer identification / needs analysis(AFNOR 2013; Besner and Hobbs 2012; Boly et al. 2015; Claire et al. 2014; Mitchell et al. 2014)
5.3 Value creation identification(AFNOR 2013; Boly et al. 2015; Claire et al. 2014; Mitchell et al. 2014)
5.4 Identification of suppliers (Boly et al. 2015; Claire et al. 2014)
5.5 Identification of competitors (Boly et al. 2015; Claire et al. 2014; Mitchell et al. 2014)
5.6 Price determination (Boly et al. 2015; Claire et al. 2014)
5.7 Distribution modes design(Boly et al. 2015; Claire et al. 2014; Mitchell et al. 2014)
5.8 Communication support design(Besner and Hobbs 2012; Boly et al. 2015; Claire et al. 2014; Mitchell et al. 2014)
Table 3. Maturity grid associated with the practice: identification of competitors.
Practice 5.5: Identification of competitorsLevel 1Level 2Level 3Level 4
The competitors are not knownThe competitors are identifiedThe competitors are identified and pose a moderate risk that has been assessed with measurable criteriaA monitoring system is set up
Table 4. Complementary complexity index.
If One Variable Is AffectedIf Two Variables Are AffectedIf Three Variables Are AffectedIf Four Variables Are Affected
Complementary complexity index (CCI)0234
Table 5. Adjustment of global impact to four levels of the maturity grids.
Global Impact Index[0; 4][4; 8][8; 12][12; 20]
Project requirement level1234

