Female-Owned Innovative Startups in Italy: Status Quo and Implications

1
Dipartimento di Diritto ed Economia delle Attività Produttive, Università degli Studi di Roma “La Sapienza”, Rome 00185, Italy
2
Department UNISU, Niccolò Cusano University, Rome 00166, Italy
*
Author to whom correspondence should be addressed.
Adm. Sci. 2018, 8(4), 66; https://doi.org/10.3390/admsci8040066
Submission received: 23 August 2018
/
Revised: 12 October 2018
/
Accepted: 18 October 2018
/
Published: 29 October 2018
(This article belongs to the Special Issue Women in Business)
Abstract
:The aim of the paper is to provide an overview of the current literature of this business phenomenon with regard to gender studies and to point out what is substantially happening and what has happened in the Italian economic context. The main research questions were RQ1: How is the phenomenon of female Startups treated from a scientific point of view? RQ2: Which is the Italian situation of this phenomenon? The methodology used is both qualitative and explorative. A bidirectional analysis has been carried out for this purpose. In order to expand the first research question (RQ1), an analysis was carried out of the articles in the EBSCO database on the topic of female startups. In order to expand the second question (RQ2), an analysis was carried out on the data concerning the phenomenon of female startups, using the register of companies held at the Chambers of Commerce which were territorially competent. Our research, carried out within the Italian economic context, demonstrates how the phenomenon of Woman Startups (WSU), even if it is widely expanding, is inherent in all the typical elements of female entrepreneurship, as reported in the literature by gender scholars. The main factors that emerge for the WSU are the small size and the undercapitalization in the startup phase. This work contributes to the expansion of studies on the topic of startups in the context of gender and can be useful to the social context, new entrepreneurs, and practitioners of the sector.
1. Introduction
A startup can be defined as a particular type of innovation-focused company. In the Italian political order, a startup that has been established for no more than 60 months, has a turnover of less than 5 million Euros, has not distributed profits, and is not the result of any extraordinary operation, such as mergers or demergers, as well as having as an object social and prevalent innovative products and/or services with high technological value, is considered “innovative”. This special regulatory provision arises as a way to revamp the Italian economy, following the deep economic–financial crisis of 2007. Various changes have been made since 2012 to make the startups an effective tool to revamp and improve national business performance.
In addition to these active policy measures implemented by the Italian Government, the Italian Chambers of Commerce have implemented forms of quarterly monitoring/feedback through the collection of data of the companies relating to, for example, the period of incorporation, class of share capital, legal status, etc.
With regard to this last aspect, we considered it necessary to better analyze the reality of the national territory, after a survey of the scientific literature. Our first RQ aimed to define “The situation in the literature of female startups”. The starting point to answer our first question was the study conducted by Paoloni and Demartini (2016), in which, treating gender studies, they identify, schematize, and deepen the main problems that entrepreneurs have to face in carrying out their business. Our research was qualitative and started with the query, through some keywords, of the EBSCO database1. The cataloging of the research records according to the criteria of the Paoloni and Demartini (2016) study allowed us to understand which are the most recurring themes in international female startups and which of them academics have debated. The answer to RQ1 represents a benchmark of academic literature, for the subsequent study of data concerning the Italian economic context, namely the “Monitoring of the phenomenon in Italy”, our RQ2.
In order to structure the RQ2, some official data concerning Italian startups in the second quarter of 2018 were examined and processed, which can be consulted in the special section of the register of companies held at the Italian Chambers of Commerce.
Our first contribution in the Italian economic context was one of the few pieces of evidence on the topic of “gender startups”.
In order to expand on what we said, the present work is structured as follows: In the second section, the literature review will be carried out on the “gender startup”; the third section will illustrate the research methodology used to analyze the data of Italian startups, and the fourth section will show the results obtained from the analysis with regard to territorial distribution, consistency of the share capital, legal nature, and activity exercised by Italian female startups.
The present work will conclude with the contiguous observation between what the academics demonstrated and what emerged from the real data on Italian female startups, noting limitations and new and future implications of study.
2. Literature Review
For the analysis and subsequent observation of the results of the RQ1, research was conducted on the EBSCO portal; the focus of our research was “woman startups” and “female startups”. In order to analyze all the contributions to the topic, our keywords were structured to include all those results that could be left out by different typing within the search engine. The question on the DB concerned the research, combined with the words “wom * star *” (for woman startups) and “female star *” (for female startups), of academic articles from 2000 to today.
The research as a whole led to 216 results on women entrepreneurship, of which only 39 dealt with the theme of woman startups (WSU).
The cataloging of the results was possible, starting from a recent study conducted by Paoloni and Demartini (2016), which represents an important benchmark on the analysis of gender studies.
The authors’ work helped us to place each result on specific themes on gender studies. In the same way, in our research and analysis of the literature, we proceeded to treat the 39 results of the Woman Startups (WSU) according to the category they belong to.
A1 Corporate governance: This category includes those articles concerning the presence of women on boards of directors (Pesonen et al. 2009), board of statutory auditors or other company committees. A1 also includes research in the field of female careers (Healy et al. 2011; Tlaiss and Kauser (2011), the crystal ceiling phenomenon (Guillaume and Pochic 2009) or the phenomenon of “gender quotas”.
In our search in the A1 category, we had only one result: Ebersberger and Pirhofer (2011) observed, in the startup processes of female startups, the factors of academic entrepreneurship that influence company management. The results showed how an academic approach of women in management increases value only in large startups, but produces a limited effect in small female startups.
A2 Female entrepreneurship: Includes all research on women’s businesses, the family business, the relational capital with the activation of formal and informal relationships that a woman activates during the life cycle of her own company (Paoloni 2011), and the different problems she encounters in doing business.
Many articles in our research led to the A2 category. Elam and Terjesen (2010) observed the evolution of woman startups, taking into consideration macroeconomic variables, such as unemployment (unemployment), economic growth (economic growth), the health of the state (national wealth), and the degree of liberalization of economy (economic freedom). The results of the research show a distinct disadvantage and delay of woman startups in the industry sector; moreover, the disadvantage is even stronger in countries where there is a wage difference (gender wage inequality) widespread among the population, and finally, female leadership is not a symptom of success for startups.
Dechant and Lamky (2005) studied female entrepreneurship around the Gulf of Arabia (Saudi Arabia), using a sample of ten Woman Startups to observe the main obstacle factors to their business, such as capital and the finding of resources, commercial networks, and the balance between work and family (work/family balance). All this is even harder if we consider the cultural traditions of the countries of origin of the WSU, which are Islamic.
Welsh et al. (2013) studied, in the Sudanese reality, the type of support that the entrepreneurs get in relation to their personal problems, managerial skills, recourse to credit, and the level of education, the prediction of future work, and institutional support.
Barnir (2014) expanded on the effects that entrepreneurial improvisation and human capital have on common entrepreneurship. To do this, he used 3 impulse factors (impetus factors)—identified as business opportunities, mentor (guide), and the nature of work—and 4 human capital factors, namely education, employment size, managerial experience, and entrepreneurial skills.
Neil et al. (2015) dealt with women’s ability to repeat business initiatives through some unknown elements that allow them to start a creative process. The authors showed how the perception of an opportunity, combined with a strong entrepreneurial mentality, increases the likelihood of creating a new initiative. Finally, Welsh et al. (2016) studied the influence on the economic development phases (SEDs) of “family support” and “personal problem” in the female startups of Canada, China, Morocco, Poland, South Korea, and Turkey. The results are useful to developing policies that promote “woman-owned business startups”, understanding what barriers exist to female entrepreneurship, and what solutions to adopt at each phase (stage) for the development of the country. The themes of this latest contribution could also be merged into the A3 category, “Conflicts of interest”, dealing with issues such as “family support” or “personal problem”. However, due to the conclusive considerations above all on so-called “woman-owned business startups” and the relationships that the same entrepreneur is able to establish, we considered it significant to assimilate these themes to the type phenomenon of the Female Entrepreneurship treated in the A2.
A3 Conflicts of interest: Includes articles that expose and analyze the presence of conflicts between work and family, children, spouse, and how the career cycle of a woman almost always coincides with her biological cycle (Emslie and Hunt 2009; Kelan 2010; Wood and Newton 2006; McDonald et al. 2005; Ezzedeen and Ritchey 2009). It also includes inherent themes that expand on the coincidence between the age in which a company chooses its managers and their leaders and the age in which a woman generally decides to have children and is, therefore, less willing to sacrifice time to the family and more vulnerable to psychophysical fatigue. It also includes conflicts of interest between the organization of her life and that of work.
In our research, we only met one article dealing with the topic. Itani et al. (2011) offered an academic contribution by conducting a context study in Saudi Arabia where, through the analysis of female entrepreneurs present in the area, they tried to profile the local entrepreneur who encounters barriers in obtaining capital for their startup because of the gaps in the tools that should be their support, such as society and traditions, and personal and family reasons.
A4 Differences between men and women: It includes research aimed at highlighting situations of difference, for various reasons, between men and women, such as in sociopolitical contexts (Joshi et al. 2007; Swan 2010; Holvino 2010); socioeconomic (Aziz and Cunningham 2008; Van den Brink and Stobbe 2009; Van den Brink and Benschop 2012; Powell et al. 2009); geopolitical (Booysen and Nkomo 2010; Crump et al. 2007;Tienari et al. 2009; Jamali, 2009); and, finally, those differences concerning access to credit (Coleman and Robb 2009).A study of IFC & GPFI (2011)
In our research (Robinson and Finley 2007), we analyzed sex discrimination with regard to the phenomenon of entrepreneurship in rural Pennsylvania, the country with the highest number of rural residents. The authors note that women, more than men, find it difficult to find jobs in rural areas because of their need to balance work and family obligations. Muravyev et al. (2009) studied the difficulty of receiving funding for female businesses that are seen as less favored by men in providing loans. Robb and Coleman (2010) studied the financial strategy in new technology-based companies (new technology-based firms). The authors, in developing the research through the data of the Kauffman Firm Survey, found a strong financial imbalance in women’s businesses more than the male ones, both in the startup phase and in the following 4 years. Women entrepreneurs employed a significant level of leverage compared to an equally significant low level of equity during the startup phase. Lee and Marvel (2014) observed the difference between male and female startups through performance measurement. The results showed that male startups have a higher capitalization and a higher level of revenues compared to female startups. Derera et al. (2014) explore the credit capital market aimed at female entrepreneurship through a context study carried out in South Africa with an interview of 50 female entrepreneurs. The results of the research revealed that women entrepreneurs experience gender discriminatory practices in requesting funds from financial institutions, thus discouraging them from venturing into nontraditional and riskier sectors. Zartaloudis (2015) analyzed gender inequality through the impact of the European Employment Strategy (EES) on Greek and Portuguese employment policies (CEP and PEP). The survey period runs from 1995 to 2009 through 44 semistructured interviews on the time available between work and family and salary differences. Kodama and Odaki (2011) observed the gender gap between men and women in starting their startup through the involvement of management courses (programs) as a value driver tool for a lasting business. The results lead us to consider that the management programs for women reduce the gender gap in the startup of a new woman startup. Brana (2013) analyzed whether microcredit can be a solution to the problem of access to credit for female entrepreneurship. The study analyzed French data referring to the period 2000–2006, with a portfolio of 3640 observations. This study showed that the male gap is found among the clienteles of MFIs.
Alina (2011) investigated, through a context study carried out on companies in Romania, whether women’s businesses are more able to raise capital. The study focused on small and medium-sized startups (SMEs) and demonstrated that, in contrast to the observations of other authors, there were no significant differences between male and female startups in addressing the typical problems of the company at the beginning activities. Estrin and Mickiewicz (2011) compared the impact of institutions on female and male startups in starting a new business. The data that the authors used were from the Global Entrepreneurship Monitor survey (GEM) from 2001 to 2006 and included more than 2000 observations per year in 55 different countries. The results showed that women are more reluctant to undertake entrepreneurial activities in countries where the state sector is bigger with stronger policies.
Amatucci and Swartz (2011) studied the negotiation processes between entrepreneurs and private equity funds. The study showed how access to financial resources is one of the main topics for the growth and development of strategies for startup companies. The results showed that female startups receive a very small portion of the total investments of the EPs. Studies show that gender discrimination exists in the bargaining phases with the PE Fund even before finance is provided to the company. Armstrong (2011) studied the different approach that women and men have in the development of a new venture planning process. While men tend to have an approach linked to the effectiveness of the plan, women aim at a proprietary (owned) approach. The former is based on rational behavior of the individual, while the latter tends to have an irrational behavior linked to sensations. Coleman and Robb (2009) consider women’s businesses to be of vital importance to the US economic environment, and through data provided by the Kuffman Firm Survey, they compared credit access data for this category of companies. Through the multivariate analysis of the data, they showed that startups start their undercapitalized business and only a small percentage of female businesses use external equity resources.
A5 Discrimination: It is a relevant category that emphasizes situations of discrimination in the workplace—political, economic, and social (e.g., Czarniawska et al. (2013); Dick and Hyde (2006); Baines (2010); Davey (2008); Eriksson-Zetterquist and Styhre (2008); Bird (2011).
With regard to the research on gender startups, Sequeira et al. (2016) analyzed the change of new companies in the context of Japanese and Chinese female entrepreneurship. This study focused on the concept of female entrepreneurship and their behavior in two cultures with traditional expectations on the role of gender. Berger and Kuckertz (2016) showed the positive impact that startups have in the ecosystem of new business creation. They also showed the existence of significant differences with regard to the emergence of new businesses by men or women. The latter fail to fully express their potential within the startups’ ecosystem. The results of the article focused on a lack of attention at the metropolitan and national level of all those issues that act as a barrier to the birth of new entrepreneurs. Robb (2002) analyzed the survival of women’s and men’s businesses in the startup phase of their business. The analysis extended to the comparison of women and men, both by race and by provenance, and in all cases results showed the need to activate policy-makers for help and efficiency for a successful female entrepreneurship program.
Khan (2017) performed an overview of 80 female startups in Saudi Arabia. The report focused on the effects of motherhood and the challenges encountered in the entrepreneurial ecosystem, and also identified the role of the so-called “push or pull factors” for female startups.
A6 Other: As a residual category, it assembles all those articles that have not been included in the other previous categories.
In the residual category, we found only one record for our research. Moswete and Lacey (2015) dealt with local tourism in Botswana and looked at the phenomenon of female startups as a means of achieving the purpose of revamping the Botsawana safari.
Once the discussion of each category was concluded, the following table, which we have elaborated on, provides a quick illustration of how the individual results were allocated by category (Table 1):
3. Research Methodology
The research started with the analysis of the DB, made available, upon request, from the Register of Companies held at the Chambers of Commerce of Italy.
The research is based on data for the second quarter of 2018, where in Italy there were 9021 startups. The cartel consists of a summary sheet and an analytical sheet.
In the summary sheet, you can see the regional geographical distribution of startups on a national basis (Table A1).
From a first observation of the Italian startup data, it is possible to notice that only 5 out of 20 regions host a number of companies that exceed 6% of the national total. In ascending order, it is possible to identify them as follow:
- -
- Campania, with 661 startups, represents 7.33%;
- -
- Veneto, with 832 startups, represents 9.22%;
- -
- Emilia Romagna, with 889 startups, represents 9.85%;
- -
- Lazio, with 921 startups, represents 10.21%;
- -
- Lombardia, with 2.168 startups, represents 24.03%.
The data just reported will be significant in the rest of the work, when we compare the national data of startups with those exclusively reserved for female startups (woman startups—WSU).
The analytical sheet, on the other hand, proceeds to classify the companies according to the different criteria identified in the columns of the sheet. Its horizontal construction shows for each enterprise:
- -
- Denomination: Under which the full names of each company are indicated;
- -
- Legal Status: Under which the legal form chosen for the establishment of the startup is reported;
- -
- Fiscal Code: Where the number of legal personality attributed to each company is reported;
- -
- Province: Where is the abbreviation (acronym) of the province to which the startup belongs is reported;
- -
- Municipality: Where the name of the municipality to which the startup belongs is given in full;
- -
- Registration date in the startup section and the registration in the Business Register: As noted, the first can be prior, contextual, or after the second; additionally, the registration in the special section is maintained only for the period granted to startups (maximum one five-year period-time requirement), as well as the maintenance of the requisites required by law (residence, nondistribution of any profits, annual production value, R&D Expenses, etc.—substantial requirement);
- -
- Starting date of the effective exercise of the activity;
- -
- Ateco Code 2007: Identifies the business sector macroclass of each startup;
- -
- Sector: Although in a hasty manner, reducing the options to the categories: “Services”, “industry/crafts”, “trade”, “tourism”, and, from the second quarter of 2018 onwards, also “agriculture/fisheries”;
- -
- Activities: Provides alphanumeric abbreviation with more detailed information on the macroclass to which Ateco 2007 code belongs;
- -
- Class of production last year: Parameters identified by capital letters from A to H with values from 0 to 50,000,000 euros (Table A2);
- -
- Class of employees last year: Parameters identified by capital letters from A to F, with values at 0 over 250 (Table A3)
- -
- Company with a social vocation: Expresses the membership of a single startup in the sectors referred to in Article 2, paragraph 1 of Legislative Decree no. 155/2006, that is, operating in the sectors of social assistance, health care, social and health assistance, education, education and training, environmental and ecosystem protection, enhancement of cultural heritage, social tourism, university and postgraduate education, research and provision of cultural services, extrascholastic training aimed at preventing school dropout or educational and training success, and instrumental services to social enterprises. For this special type of startup, further benefits are envisaged with respect to those not belonging to the same category;
- -
- Enterprise with a high technological value in the energy sector: Expresses its belonging to the category of a single startup that has a high technological value in the energy field, or develops and markets exclusively innovative products or services with high technological value in the energy field. Those classified with the Ateco code “72.1—experimental research and development in the field of natural sciences and engineering” that do not operate in the energy field are excluded;
- -
- Class of capital: This important classification allows to identify the consistency of the subscribed capital for each startup. The values are expressed in Arabic numbers from 1 to 11 with values from 1 euro to over 5,000,000 euros (Table A4);
- -
- Website: Gives evidence of each company website;
- -
- requirements n. 1–2–3: For this important information, specific columns are dedicated within sheet 3, where the possession of the membership requirement is indicated or not within each single cell. The requirements in question refer to three of the substantive requirements summarized in the opening of the paragraph, in particular:
- requirement n. 1: Expresses the achievement of the 15% threshold of the greatest gap between costs and total value of production concerning R&D activity;
- requirement n. 2: Expresses the composition of the team, formed by 2/3 staff with a Master’s degree; or from 1/3 from PhD students, PhDs, or graduates, but with at least 3 years of experience in certified research activities;
- requirement n. 3: Expresses whether the company is a depository or licensee of industrial property, or owner of registered software.
- -
- Declaration date: This field expresses the date on which the startup has completed the information obligations scheduled every six months;
- -
- Female prevalence-or Youth-or Foreign: Each of the three selection fields is dedicated a specific column in the spreadsheet. The values expressed are “NO”, “Majority”, “Strong”, and “Exclusive” and are a function of the arithmetic average of the sum of the percentages of composition of the share capital and of the composition of the Board of Director (or sole Director) of the startup (Table A5).
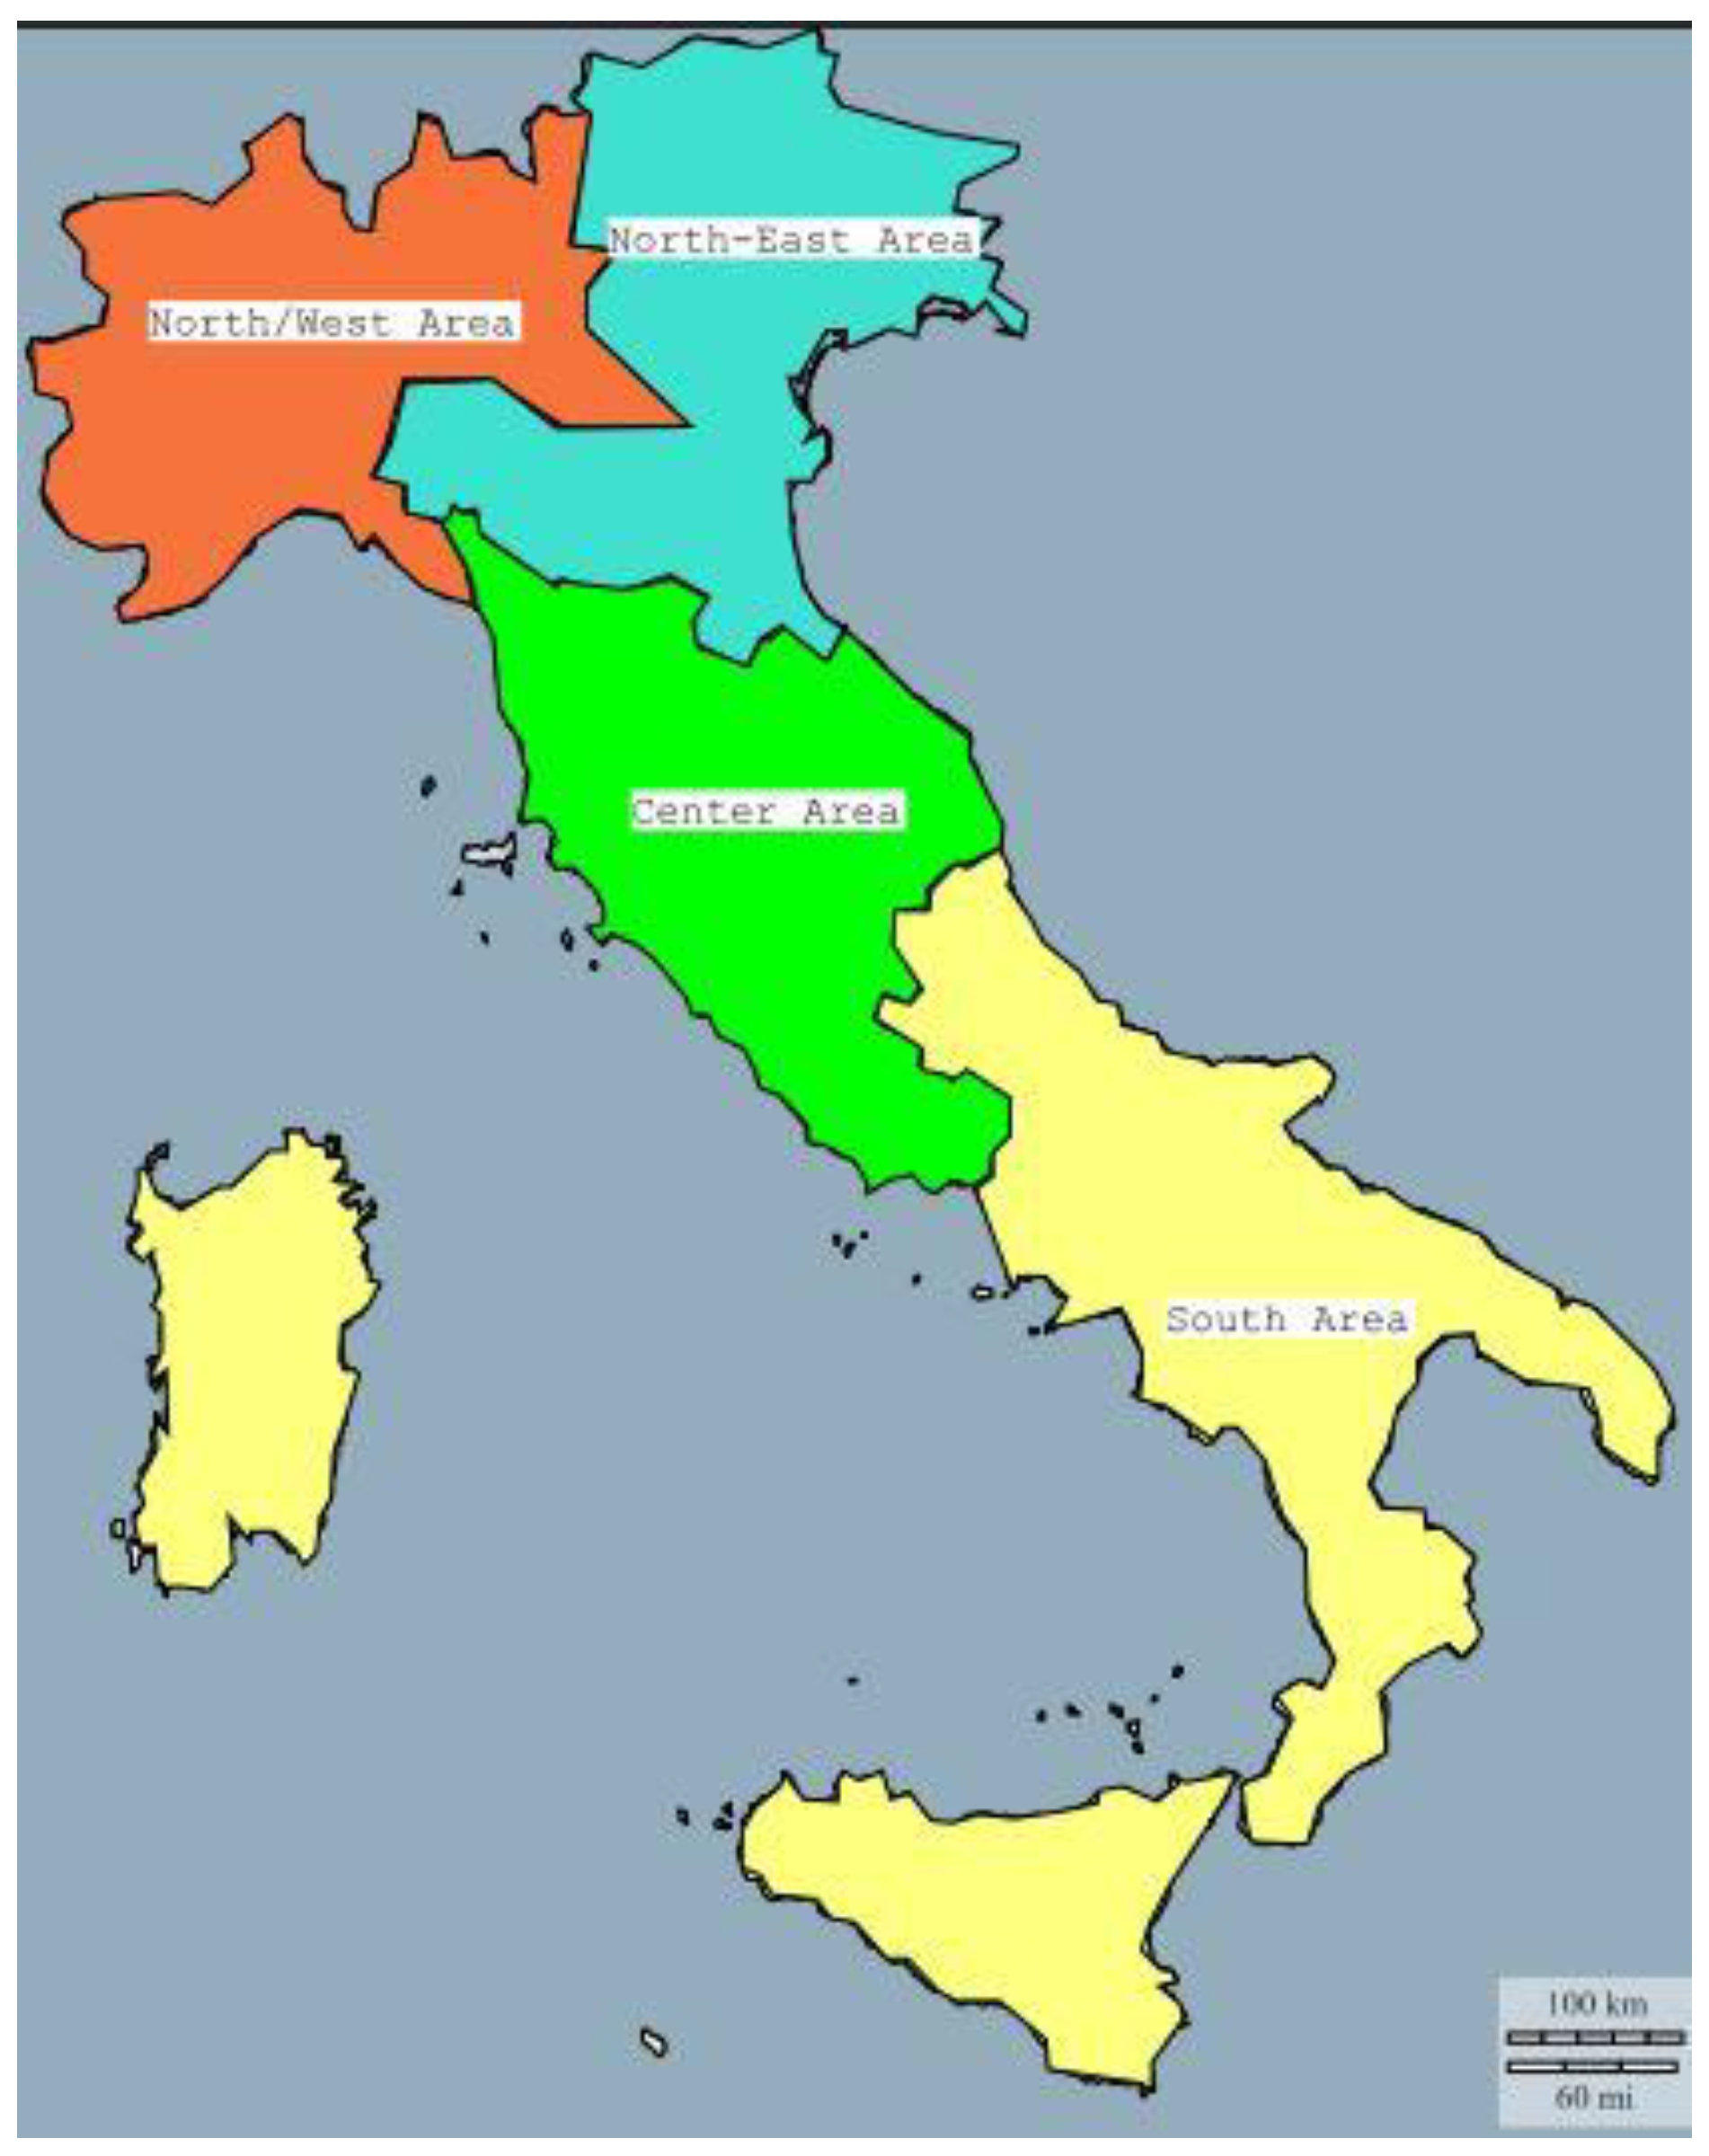
In order to proceed with a more detailed analysis of the data, we implemented the spreadsheet by reclassifying the startups by geographical area according to their province of origin. The criteria for subdividing the national territory on a provincial basis are the same as the ones used by the National Institute of Statistics (ISTAT) to provide periodic regional performance data of startup companies, that is, considering the North, the Center, and the South as the three main Italian geographical areas. The North includes the regions of the Northwest (Liguria, Lombardy, Piedmont, Valle d’Aosta) and those of the Northeast (Emilia-Romagna, Friuli-Venezia Giulia, Trentino-Alto Adige, Veneto). The Center includes the regions of Lazio, Marche, Tuscany, and Umbria. The South includes the regions of Southern Italy or South of Italy (Abruzzo, Basilicata, Calabria, Campania, Molise, Puglia) and those of insular Italy (Sardinia, Sicily).
Abruzzo is classified as Southern Italy for historical reasons, as it was part of the Kingdom of the Two Sicilies before the unification of Italy in 1861 (Figure 1):
4. Discussion
In this section, we will illustrate the data concerning the phenomenon of female startups in Italy. First of all, the WSU present in the Italian territory will be identified (Section 1) and then analyzed for each type of composition of the social structure that qualifies them as “feminine”, the consistency of the social capital (Section 2), the legal status (Section 3) and, finally, the type of activity exercised (Section 4).
4.1. Italian Woman Startups and Territorial Distribution
The Table 2 below geographically shows the number of startups present in the national territory and highlights how many of these are “pink”.
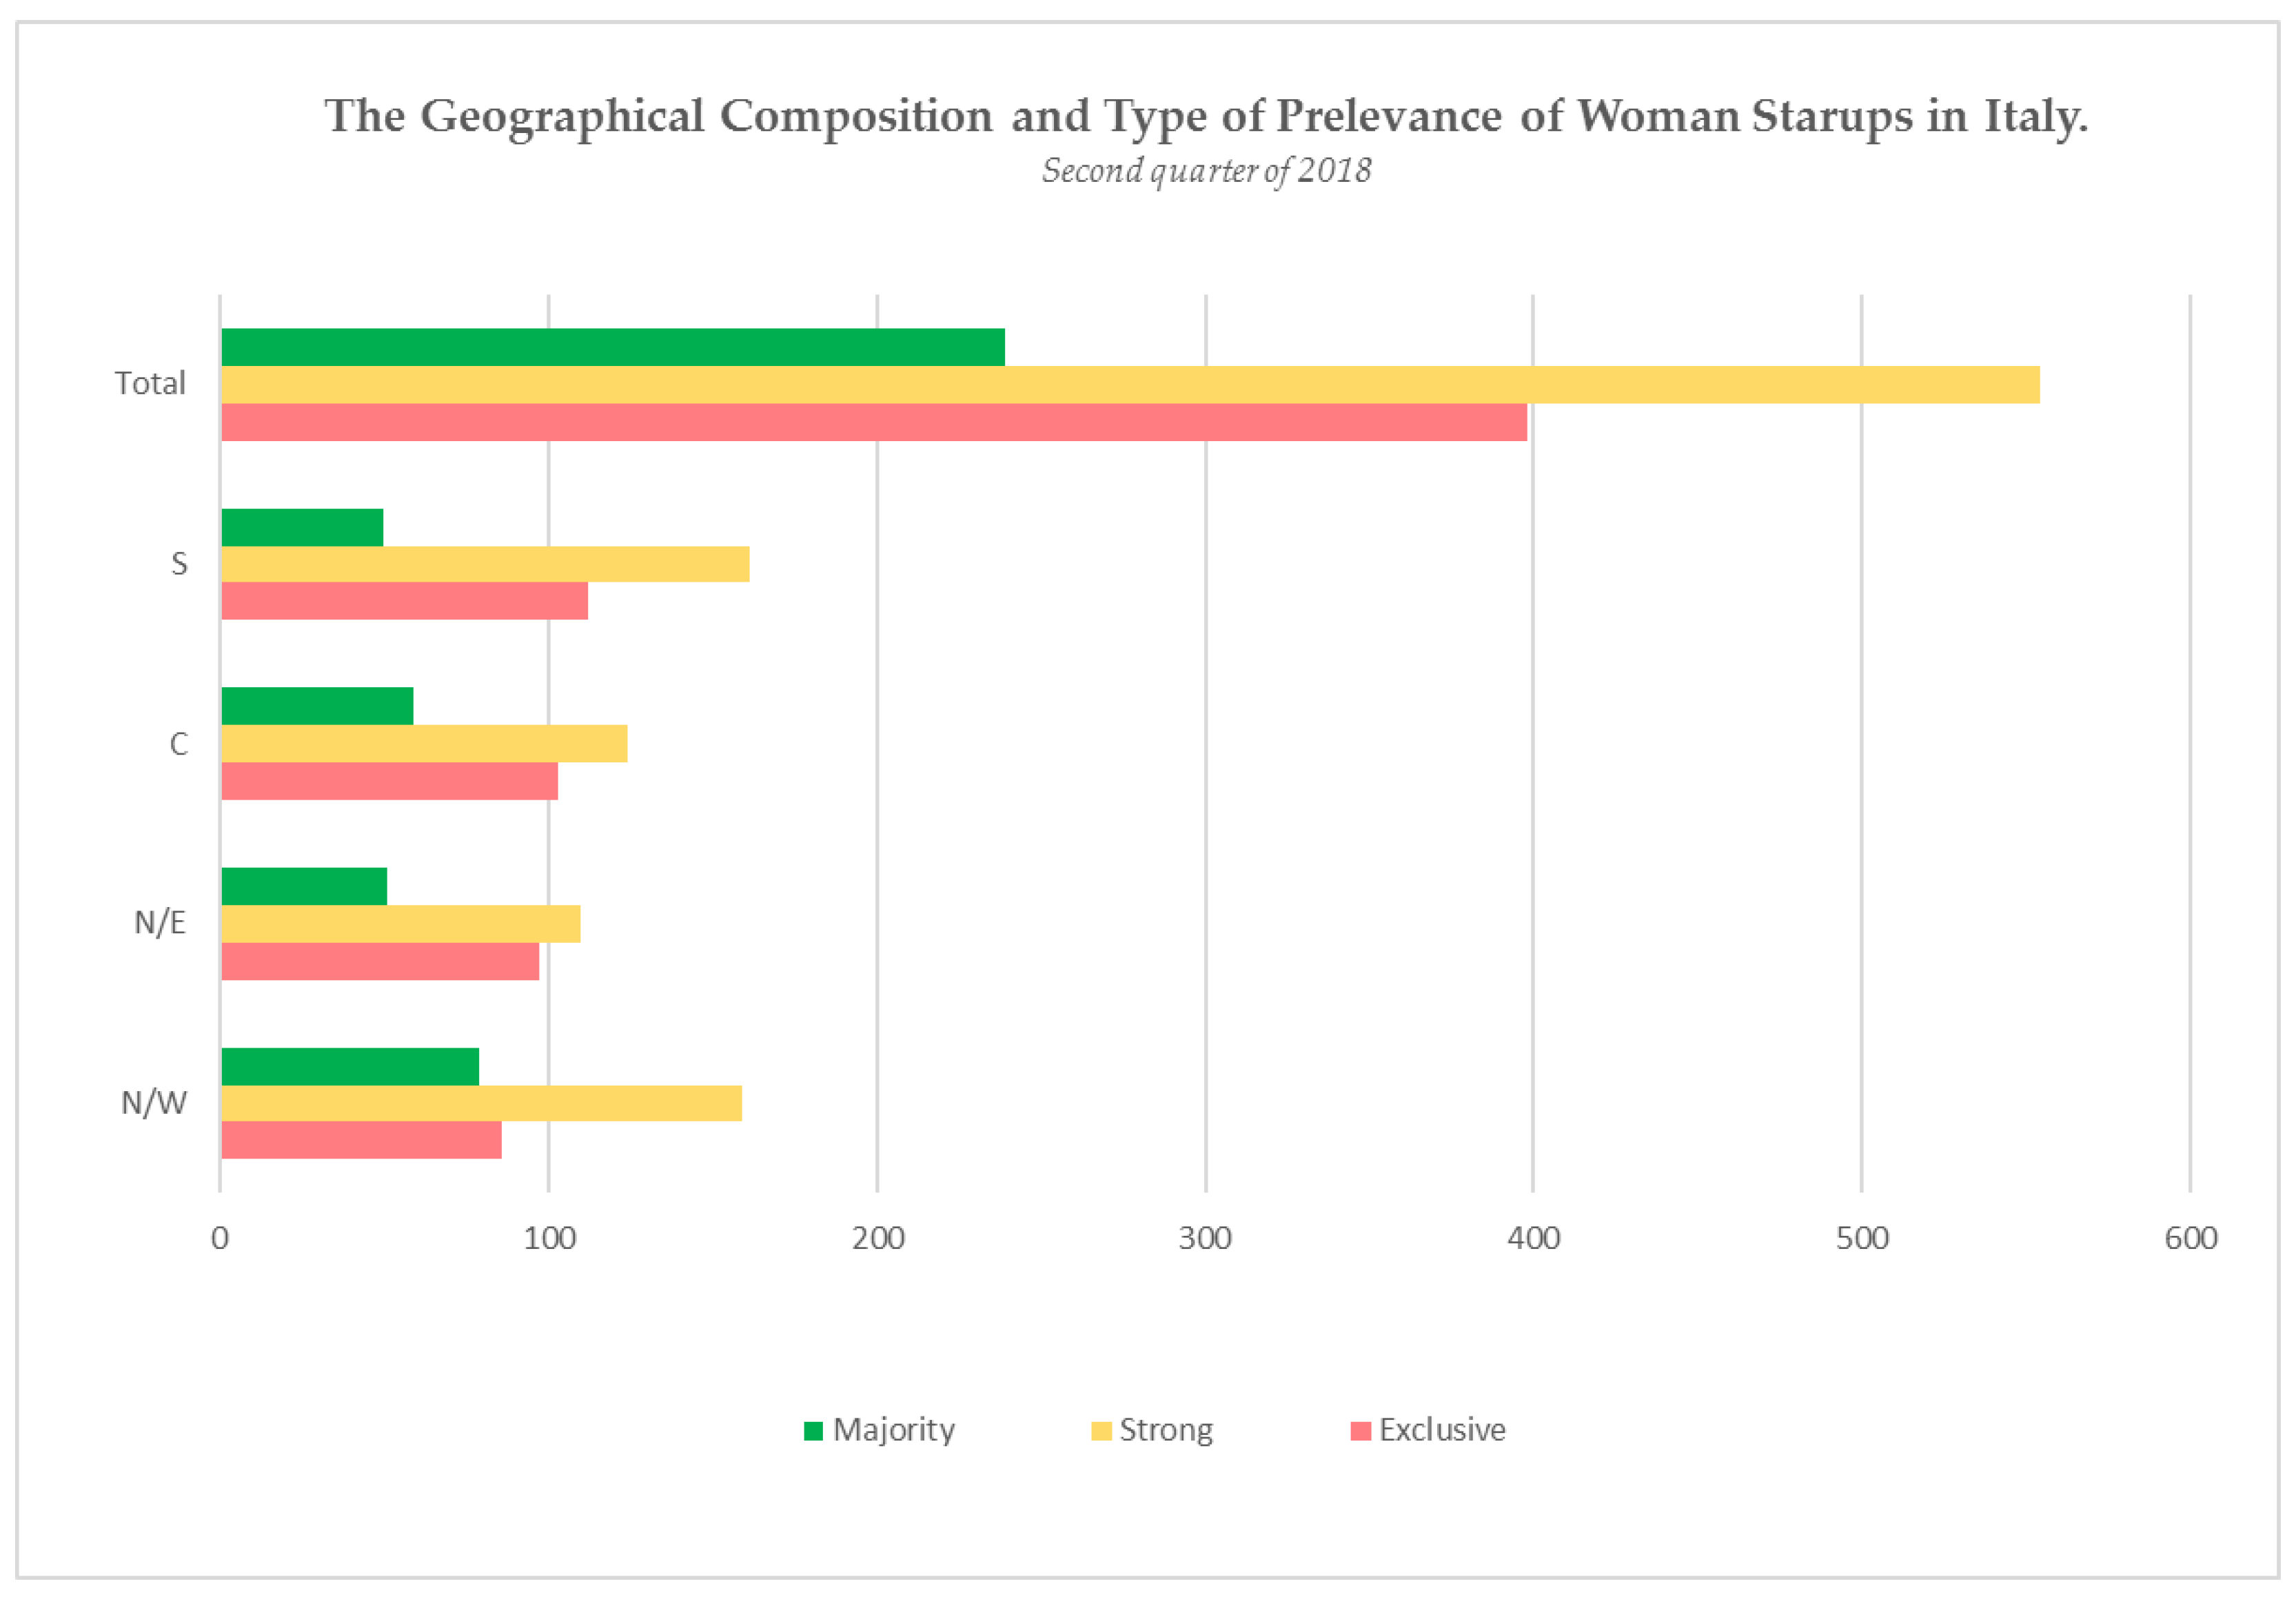
The data show that from 9021 Italian startups, only 1191 belong to the female sex, that is, only 13.20% of the total. The data are subsequently decomposed and observed according to the percentage of share capital and chair possessed in the Board of Director by women. Therefore, it can be noted that:
- -
- The WSU where pink representation is EXCLUSIVE (% of the share capital and % of Board of Director—or sole director—totalitarian) are 398 (33.42% of 1191);
- -
- The WSU where pink representation is STRONG (arithmetic mean among % of the social capital and % of belonging Board of Director—or sole director—to women in the company is superior to 66%) are 554 (46.51% of 1191);
- -
- The WSU where pink representation is MAJORITY (arithmetic mean among % of the social capital and % of belonging Board of Director—or sole director—to women in the company is superior to 50%) are 239 (20.07% of 1191).
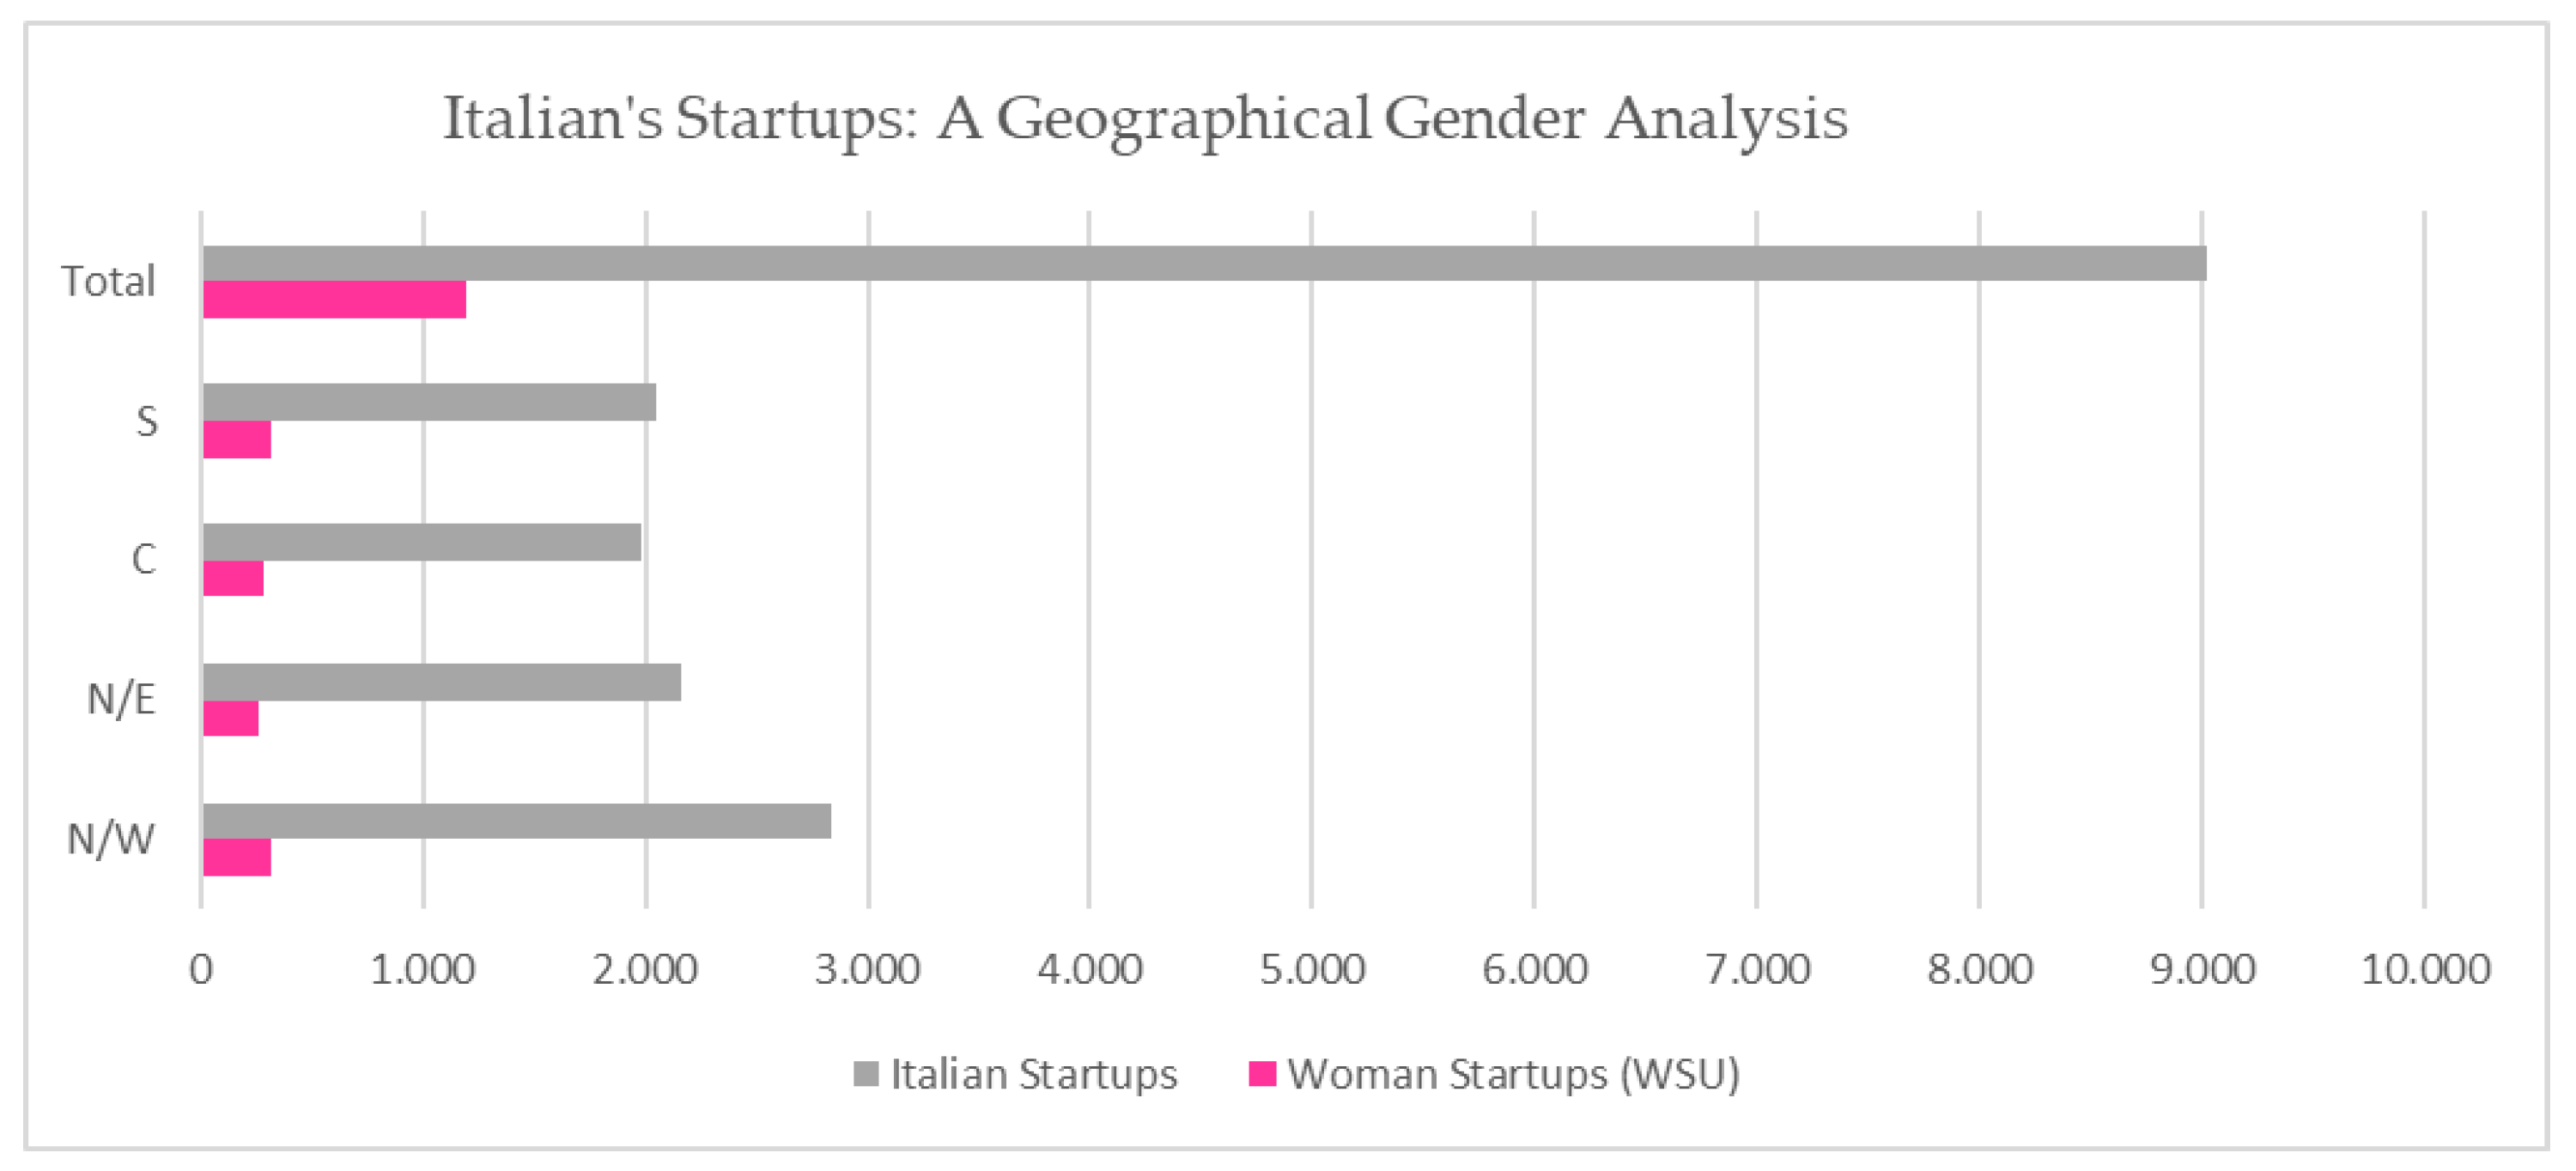
Further data that emerge and deserve to be analyzed are the geographical distribution of female startups compared to the totality of Italian startups.
In fact, unlike that of the considered startups overall, the geographical distribution of those female startups is nearly homogeneous in the whole national territory. In the Northwest of Italy there are 324 units, followed by the area of Southern Italy with 323 units (only one less than the largest area), in reversal of the emerging data for startups overall; then, there is the area of Central Italy with 286 units, and finally the Northeast of Italy with 258 units.
The graph below clearly shows the distribution: (Figure 2)
What that makes us think is that women have a fairer distribution throughout the country, in addition to the fact that the WSU do not follow the same general distribution of startups. In fact, while the distribution of Italian startups noted the maximum record in the N/W with 2834 units and the lowest record in C with 1977, creating a differential of 857 units (9.50% of the total), the presence of female startups goes from the maximum record in the N/W with 324 units to the lowest one in the N/E with 258 units, creating a spread of only 66 units (5.54% of the total), which represents a differential of almost 4 percentage points with the evidence on Italian startups overall.
Highlighting the number of Italian female startups and analyzing the composition and distribution, the graph that follows provides a useful combined evidence of the aspects just treated: (Figure 3).
From reading the graph, it is possible to understand how the WSU with exclusive, strong, and majority membership are present throughout the Italian national territory. In the following sections, we will analyze the WSU according to the class of social capital, juridical nature, and sector of activity of belonging.
4.2. The Consistency of the Italian Woman Startups Share Capital
The consistency of the share capital is one of the most delicate aspects related to the type of company being researched. The spreadsheet extracted from the register of companies, as already explained in the section dedicated to the research methodology, identifies the capital ranges and classifies them with Arabic numbers ranging from 1 to 11, in addition to a class dedicated to all those companies that have not declared the value (for a more schematic reading, see Table A4).
The national data for the second quarter of 2018 show that (Table 3):
In Italy, there are startups for each class of capital. However, the same statement does not apply to women who stop at Class 9, with only 3 startups with a share capital ranging from €1,000,000.01 to €2.5 million.
It is also noteworthy that female startups have a higher percentage of information deficiency. In fact, out of 1191 WSU, 34 have not declared the value of the share capital, which represents, in percentage terms, 2.85% of the total; against 137 out of 9021 startups overall, equivalent to 1.52% of the total.
With reference to mode, the most common social capital class for both startups overall and for women is Class 3, with a share capital of €5000.01 to €10,000. Observing the percentage data, Class 3 represents, for Italian startups overall, 42.65% of the total, while for the female ones, 45.68% of the total.
The same similarity between WSU and startups overall is not found with reference to the less recurring capital class. For Italian startups overall, the least common class is Class 11, which hosts only seven companies with a registered capital of more than 5,000,000 (0.08% of the total), while for female startups, considering that Class 10 and 11 do not include any company, the least recurring class is Class 9, which only houses three companies with a share capital from €1,000,000.01 to €2,500,000 (0.25% of the total).
With regard to the frequency of the share capital class of the Italian WSU, there is a similarity among Italian startups overall for this aspect, too.
The trend of the share capital classes, both for women and for Italian startups overall, is a “bell curve”: It gradually increases until reaching its peak in Class 3, and then slowly decreases until the minimum is reached, in Class 9 for women and in Class 11 for startups overall.
Below, we will see how Italian female startups, compared to Italian startups overall, are geographically localized in the Italian territory according to the share capital class criterion (Table 4):
In the N/W area, the highest capital class reached by the WSU is Class 8, which includes two companies with a share capital from €500,000.01 to €1,000,000
On the basis of the companies accepted, the classes of the N/W area in descending order are: Class 3 with 146 WSU; Class 4 with 78 WSU; Class 2 with 68 WSU; Class 5 with 17 WSU; Class 6 with 5 WSU; Classes 1 and 7 with 3 WSU each; and Class 8 with 2 WSU. Finally, only two WSU have not transmitted data to the register of companies relating to the size of their share capital.
In the N/E area, the highest capital class reached by the WSU is Class 9, which includes three companies with a share capital from €1,000,000.01 to €2.5 million.
On the basis of the companies accepted, the classes of the N/E area in descending order are: Class 3 with 124 WSU; Class 2 with 65 WSU; Class 4 with 39 WSU; Class 5 with 11 WSU; Class 6 with 4 WSU; Classes 1 and 9 with 3 WSU each; and Classes 7 and 8 with 2 WSU each. Finally, only five WSU have not transmitted the data to the register of companies relating to the size of their share capital.
In the C area, the highest capital class reached by the WSU is Class 8, which only includes one company with a share capital of €500,000.01 to €1,000,000.
On the basis of the companies accepted, the classes of the C area in descending order are: Class 3 with 124 WSU; Class 2 with 88 WSU; Class 4 with 50 WSU; Class 5 with 10 WSU; Class 7 with 2 WSU; and Classes 1 and 8 with 1 WSU each.
In the C area, there is a discontinuity in the classes; in fact, from Class 5, which includes ten companies, we immediately pass to Class 7, which includes 2 WSU. Class 6 is therefore vacant. Finally, only 10 WSU have not transmitted data to the register of companies relating to the size of their share capital.
In the S area, the highest capital class reached by the WSU is Class 8, which includes two companies with a share capital from €500,000.01 to €1,000,000.
On the basis of the companies accepted, the classes of the S area in descending order are: Class 3 with 150 WSU; Class 2 with 100 WSU; Class 4 with 37 WSU; Class 5 with 9 WSU; Class 6 with 5 WSU; Class 1 with 3 WSU; and Class 8 with 2 WSU.
In the Southern Italy area, there is a discontinuity in the classes; in fact, from Class 6, which includes 5 WSU, we immediately pass to Class 8, which includes 2 WSU. Capital class 7 is therefore vacant.
Finally, 17 WSU have not transmitted the data to the register of companies relating to the size of their share capital.
Some comparative considerations can be developed with regard to the four territorial areas analyzed:
- -
- The most “crowded” class among the four areas is Class 3, that is, the one that welcomes companies with a share capital from €5000.01 to €10,000;
- -
- The lowest level of information is reached by WSU in Southern Italy, reaching the peak of 17 WSU out of 323. The figure of the “nonreporting” represents 5.26% of the total number of WSU in Southern Italy;
- -
- The highest level of information is reached by WSU in N/W Italy, with only 2 WSU out of 324. The “nonreporting” figure represents 0.62% of the total number of WSU in N/W Italy.
The data obtained about the composition of the share capital classes of the startups mainly concern their territorial composition. To this, the analysis of the type of WSU that composes each class is added.
In the following tables, an observation was made that takes into account the type of WSU and its location in the Italian territory (Table 5):
The significant datum that emerges from the aforementioned tables is the fact that the WSU of the “Exclusive” type, that is, those companies in which the totality of the share capital and the chairs in administration belong to women, reach Class 9 (maximum class of social capital achieved by Italian WSU), with 2 WSU in N/E Italy. In addition, the continuity of female companies with an “Exclusive” type of composition is up to Class 5, which hosts companies for each of the four territorial areas.
For the “Strong” WSU, the highest class reached is Class 9, with 1 WSU in the N/E, while for the “Majority” type, the highest class achieved is Class 8, with the coexistence of WSU in all territorial areas. With regard to this last aspect, it should be noted that for the “Strong” type, the continuity of the class occurs in Class 5, since the subsequent vacancies are in at least one of the territorial areas. For the “Majority” type, on the other hand, the continuity of the share capital is reached in Class 8. However, it is strange that the class interval between Classes 8 and 4 has at least one vacancy in at least one of the territorial areas, as well as that after Class 8, where continuity is reached, no “Majority” female startups are found.
4.3. Legal Status of Italian Female
The analysis just conducted on the social capital classes of the individual WSU by geographic area is useful for the subsequent issue that we will analyze: The legal nature adopted by the company.
The spreadsheet that contains the information in the special section of the business register provides nine legal types of business2.
The following table shows for every company legal form, how many startups and how many WSU are present in the Italian economic context (Table 6):
The data highlight the presence of companies for each type of legal nature, albeit at least minimal, as in the case of the European Group of Economic Interest (EEIG) and European Company (EC), where there is only one startup. As far as the object of our research is concerned, there is less diversification of a business legal nature: In Italy there are no WSU with a legal status of EEIG, WSU constituted on the basis of laws of another stratum, and WSU with a juridical nature of European Companies.
The majority of Italian women’s startups are set up as limited liability companies (with 941 units out of 1191, representing 79.01% of the total), followed by simplified limited liability companies (with 205 units out of 1191, representing 17.21% of the total), cooperative companies (with 36 units out of 1191, representing 3.02% of the total), single-member limited liability companies (with 4 units out of 1191, representing 0, 34% of the total), limited liability consortium companies (with 3 units out of 1191, representing 0.25% of the total), and, finally, joint-stock companies (with 2 units out of 1191, representing 0.17% of total).
The following table shows the territorial distribution of the WSU according to the legal status (Table 7):
On closer inspection:
- -
- 941 LLC: 279 are in the N/W area, 214 are in the N/E area, 219 are in the C area, and 229 are in the S area. This type of legal status represents the most relevant for the national territory, constituting, on a local territorial base: 86.11% of the female enterprises in the N/W area; 82.95% of female businesses in the N/E area; 76.57% of female businesses in the C area; and 70.90% of female businesses in the S area;
- -
- 205 SLLC: 40 are in the N/W area, 37 are in the N/E area, 53 are in the C area, and 75 are in the S area. This type of legal nature constitutes, for the national territory, on a local territorial basis: 12.35% of the female enterprises present in the N/W area; 14.34% of female businesses in the N/E area; 18.53% of female businesses in the C area; and 23.22% of female businesses in the S area;
- -
- 36 CC: 2 are in the N/W area, 5 are in the N/E area, 12 are in the C area, and 17 are in the S area. This type of legal status constitutes, for the national territory, on a local territorial basis: 0.62% of the female enterprises present in the N/W area; 1.94% of female businesses in the N/E area; 4.20% of female businesses in the C area; and 5.26% of female businesses in the S area;
- -
- 4 LLC-SS: In each of the four territorial areas there is 1 WSU. This type of juridical nature, although only present with one unit in each territorial area, has a different weight on the composition of the local economy or represents: 0.31% of the female enterprises present in the N/W and S areas; 0.39% of female businesses in the N/E area; and 0.35% of female businesses in the C area;
- -
- 3 LLCC: One unit per territorial area is found everywhere except in the C area, where there is no WSU of this nature. Even this typology, although present in equal measure in three territorial areas, has a different weight on the composition of the local economy or represents: 0.31% of the female enterprises present in the N/W and S areas; and 0.39% of female businesses in the N/E area.
- -
- 2 JSC: Only one unit is present in the N/W area and in the C area. This typology represents, on a local territorial base: 0.31% of the female enterprises present in the N/W area; and 0.35% of the female enterprises present in the C area.
Keeping the analysis, the following tables show the sort of juridical nature chosen by each single type of WSU, that is, “Exclusive”–“Strong” or “Majority” type (Table 8):
With regard to the “Exclusive” category, which is more representative for our research, the most recurring legal nature is that of a limited liability company with 275 units (sum per line). Then follow the legal nature of a simplified limited liability company with 92 units, that of a cooperative with 25 units, that of a limited liability company with sole shareholder with 4 units, and, finally, that of a limited liability consortium company with only 2 units.
Before going on to review the treatment of the “Strong” and “Majority” typologies of WSU, it should be noted that these also follow the same orientation as the “Exclusive” type, preferring the legal status of a company with limited responsibility, except in particular cases that we will soon deal with.
For the “Strong” category, as mentioned above, the most recurring legal nature is that of a limited liability company with 452 units (sum per line). Then follow the legal nature of a simplified limited liability company with 89 units, that of a cooperative company with 11 units, and, finally, that of a limited liability consortium company and that of a joint-stock company with only 1 unit each.
Concluding on the legal nature of the startups, the “Majority” category also prefers the nature of a limited liability company, reaching 214 units. There is also the nature of a simplified limited liability company with 24 units and, finally, the nature of joint stock company with only 1 unit.
4.4. Business Activities Carried Out by Italian Female Startups
In this section, we will discuss female startups from the point of view of the activity carried out. We will first illustrate to which of the macrosectors of activity the single startups belong, by ATECO code, and then we will deal in particular with those with high technological value in the energetic scope and, finally, the new phenomenon of so-called social enterprises.
With reference to the business sector, the Italian Chambers of Commerce classify startups in five macro sectors3 and, in addition, a residual one that welcomes companies, for which it was not possible to trace that belonging.
The data for the second quarter of 2018 show us that (Table 9):
Observing the data, it is possible to notice that Italian startups overall operate mainly in the services sector (75.07%), and so do Italian WSU (75.06%), while the sectors in which female startups, in percentage terms on the total, are prevalent compared to startups overall are:
- -
- The agriculture sector, where they represent 0.92% of the total against 0.65% of the generic startup observation;
- -
- The commerce sector, where they represent 5.71% of the total against 4.40% of the generic startup observation;
- -
- The tourism sector, where they represent 1.68% of the total against 1.02% of the generic startup observation.
The sector where the percentages of composition on the total see female startups in the minority compared to startups overall is the Industry and Crafts Industry. Female startups in this sector represent 16.54%, while an observation in the absence of gender difference tells us that this sector represents 18.50% of the total of Italian startups.
It is also useful to note that the degree of lack of information on the sector of activity of the WSU is very low: Of the 1191 female startups, only one has not declared its sector of activity.
As for the distribution in the Italian national territory of the startups operating in the various sectors, the following table provides clear evidence of the territorial location area (Table 10):
From the data provided, it can be observed that:
In the N/W Area, in order of frequency, we find:
- -
- 254 WSU in the sector of services, representing 78.40% of the WSU allocated in the local area;
- -
- 44 WSU in the sector of industry and craftsmanship, representing 13.58% of the WSU allocated in the local area;
- -
- 19 WSU in the commerce sector, representing 5.86% of the WSU allocated in the local territory;
- -
- 5 WSU in the tourism sector, representing 1.54% of the WSU allocated in the local area;
- -
- 2 WSU in the agriculture/fishing sector, representing 0.62% of the WSU allocated in the local territory.
None of the 324 WSU allocated in the N/W area failed to declare their sector to which they belong.
In the N/E Area, in order of frequency, we find:
- -
- 182 WSU in the sector of services, representing 70.54% of the WSU allocated in the local area;
- -
- 61 WSU in the sector of industry and handicraft, representing 23.64% of the WSU allocated in the local area;
- -
- 10 WSU in the commerce sector, representing 3.88% of the WSU allocated in the local territory;
- -
- 4 WSU in the tourism sector, representing 1.55% of the WSU allocated in the local area;
- -
- 1 WSU in the agriculture/fisheries sector, representing 0.39% of the WSU allocated in the local territory.
None of the 258 WSU allocated in the N/E failed to declare their sector to which they belong.
In the C Area, in order of frequency, we find:
- -
- 215 WSU in the sector of services, representing 75.17% of the WSU allocated in the local territory;
- -
- 50 WSU in the sector of industry and handicraft, representing 17,48% of the WSU allocated in the local area;
- -
- 16 WSU in the trade sector, representing 5.59% of the WSU allocated in the local territory;
- -
- 2 WSU each in the tourism sector and in the agricultural/fishing sector, representing, for each sector, 0.70% of the WSU allocated in the local area.
The only WSU that has failed to communicate its sector of membership was in the C area, thus representing 0.35% of the 286 woman startups present in the area in question.
In the S Area, in order of frequency, we find:
- -
- 243 WSU in the sector of services, representing 75.23% of the WSU allocated in the local territory;
- -
- 42 WSU in the sector of industry and craftsmanship, representing 13.00% of the WSU allocated in the local area;
- -
- 23 WSU in the trade sector, representing 7.12% of the WSU allocated in the local area;
- -
- 9 WSU in the tourism sector, representing 2.79% of the WSU allocated in the local area;
- -
- 6 WSU in the agriculture/fishing sector, representing 1.86% of the WSU allocated in the local territory
None of the 323 woman startups allocated in the N/E area failed to declare their sector to which they belong.
The analysis of the data obtained leads us to state that regardless of where the WSU is located, in each of the four territorial areas in Italy there are more WSU frequencies of services, followed by those of industry and crafts, then trade, and tourism, and, lastly, that operate in agriculture and fishing.
After the observation of the geographical location of the individual WSU, a further aspect that, with regard to the type of activity, must be dealt with is what kind of WSU (“Exclusive”, “Strong”, and “Majority”) operates in each business sector.
The following table provides a first numerical evidence of the phenomenon (Table 11):
The classification of the type of WSU by sector of activity represents a predominance of the “Strong” type.
For each sector it emerges that:
- 1In AGRICULTURE/FISHING, there are 6 WSU of the “Strong” type, 3 of the “Exclusive” type, and 2 of the “Majority” type;
- In TRADE, there are 34 WSU of the “Strong” type, 26 of the “Exclusive” type, and 8 of the “Majority” type;
- In INDUSTRY/CRAFTSMANSHIP, there are 97 WSU of the “Strong” type, 59 of the “Exclusive” type, and 41 of the “Majority” type;
- In SERVICES, there are 406 WSU of the “Strong” type, 304 of the “Exclusive” type, and 184 of the “Majority” type;
- In TOURISM, there are 11 WSU of the “Strong” type, 5 of the “Exclusive” type, and 4 of the “Majority” type; the only WSU that has failed to declare in the sector it belongs to, finally, belongs to the “Exclusive” type.
Once the general discussion on the sector of activity of the WSU is concluded, the analysis of the two particular phenomena concerning the startups’ activity can now be considered: High-tech companies in the energy sector and social enterprises.
Startups with a high technological value in the energy field are all those companies that increase, in the national context, the value of the so-called “Green Economy”. With the following data, we will analyze, according to gender studies, where these companies are located and what kind of female composition they have.
Generally speaking, it is possible to observe how many of the startups with a high technological value in the energy sector in Italy are owned and managed by women.
The data for the second quarter of 2018 show that (Table 12):
Only 1262 of the 9021 (13.99%) startups on the national territory are characterized by a high technological value in the energy field. With regard to gender studies, of the 1262 startups with a high technological value in the energy field, only 185 are female. The latter represent 15.53% of the 1191 WSU allocated in Italy.
Given the minimum percentage of presence in Italy, we can now move on to observe the location of this particular type of business (Table 13):
With regard to the territorial area where the companies are located, it can therefore be noted that with respect to the total of WSU present in the area, those of “high technological value in the energetic field” are:
- -
- In the N/W area: 42 WSU, or 12.96% of the total;
- -
- In the N/E area: 38 WSU, or 14.73% of the total;
- -
- In the C area: 47 WSU, or 16.43% of the total;
- -
- In the S area: 58 WSU, or 17.96% of the total.
Regardless of the lack of national presence of companies with characteristics that today should be much more developed, what arouses curiosity is the fact that companies that have a high technological content in the energy field are located more in South and Central Italy than in the northern areas, which have always been considered more developed.
As for the type of the 185 WSU belonging to the sector of high technological content in the energy field, it is possible to observe that (Table 14):
- -
- Out of the 42 WSU allocated in the N/W area, 7 are of the “Exclusive” type, 24 are of the “Forte” type, and 11 are of the “Majority” type;
- -
- Out of the 38 WSU allocated in the N/E area, 12 are of the “Exclusive” type, 16 are of the “Forte” type, and 10 are of the “Majority” type;
- -
- Out of the 47 WSU allocated in the C area, 12 are of the “Exclusive” type, 25 are of the “Strong” type, and 10 are of the “Majority” type;
- -
- Out of the 58 WSU allocated in the S area, 20 are of the “Exclusive” type, 23 are of the “Strong” type, and 15 are of the “Majority” type;
Considering the data shown above, it can be said that with regard to the type of composition of the company structure and the management chairs, the WSU with a high technological content in the energy sector in Italy are predominantly of the “Forte” type, with 88 WSU, followed by the “Exclusive” type, with 51 WSU, and, finally, the “Majority” type, with 46 WSU.
The last type of company that remains to be explored in this section dedicated to the business sector of gender startups is being or not in a social vocation.
This particular typology was foreseen within the DL 179/2012, which introduced the innovative tool of startups in the national legal system. Innovative startups with a social vocation are considered all those companies operating in the sectors referred to in art. 2, paragraph 1, of Legislative Decree no.155/20064.
The table below provides a first analysis of gender startup for this particular sector of activity in the national context (Table 15):
The results extracted from the special section of the Business Register, for the second quarter of 2018, show that socially-driven startups represent a real minority in the Italian economic context—only 190 startups with a social vocation out of 9021 Italian startups. With regard to gender studies, female startups with a social vocation represent, with 54 WSU out of 1191, 4.53% of Italian female startups.
This first analysis allows us to observe, then, how this particular type of business is distributed throughout the country. The table below provides numerical evidence (Table 16):
- -
- In the N/W area: Out of 89 social vocation startups, 26 are female and represent 8.02% of the 324 WSU present;
- -
- In the N/E area: Out of 34 social vocation startups, 9 are female and represent 3.49% of the 258 WSU present;
- -
- In the C area: Out of the 31 social vocation startups, 11 are female and represent 3.85% of the 286 WSU present;
- -
- In the S area: Out of the 36 socially-driven startups, 8 are female and represent 2.48% of the 323 WSU present.
Now that the geographic observation on female startups with a social vocation in the Italian territory is over, we are going to discuss this particular business phenomenon according to its composition, looking at what type of female startups, be it “Exclusive”–“Strong” or “Majority”, they belong to.
The following table shows, for each type of gender startup, how many belong to companies with a social vocation (Table 17):
From the reading of the data, it emerges that the prevalent type of female startups with a social vocation is the “Strong” type, with 28 startups, followed by the “Exclusive” one, with 18 startups, and, finally, the “Majority” typology, with 8 startups.
5. Conclusions
The startups have now become an important vehicle for the development of the Italian economic fabric. Our research, starting from the actual state of international literature on this particular business phenomenon, then developed through the analysis of the Italian economic context. This made it possible to make an important contribution to gender studies, first with the monitoring of the situation of Italian startups and then by centralizing the focus of analysis on an important issue under development: The so-called “woman startups”.
From a scientific point of view, the phenomenon of female Startups (RQ1) confirms the lack of contributions to the Corporate Governance of woman startups. Only one contribution (Ebersberger and Pirhofer 2011) deals with company management, identifying the academic approach of women as a success factor for large female startups. In our opinion, the lack of academic contributions to the subjects and the functioning of corporate governance occurs for a structural reason of the startup and not for gender issues. As a rule, startups are SMEs and, as such, do not include integrated governance systems. The absence of complex organizational structures is also demonstrated by the results found in the A2 category, which deals with the different problems encountered by the entrepreneur in doing business. Most of the results (Welsh et al. 2013, 2016; Neil et al. 2015) show that most women who own startups face the difficulties of their business alone, without strong business. In addition, by comparing the results that emerged in Paoloni-Demartini’s study (2016) on female entrepreneurship, and therefore not only on the startup focus, we find the same difficulties common to the entrepreneur in starting up their business. These concern above all the difficulty in facing the startup phase of the company, the undercapitalization of the company, and the difficulties in accessing credit (Dechant and Lamky 2005). In the gender gap and discrimination factors, it is observed that the WSU are discouraged from operating in traditional sectors such as industry (Elam and Terjesen 2010), but rather, very often, they operate in sectors where the business risk is higher. The gender gap phenomenon often emerges from contributions dealing with institutional factors (Itani et al. 2011) listed in the A3 category.
As for the Italian situation of the phenomenon of female startups (RQ2), the second quarter of 2018 registered the presence of 1191 Woman Startups (WSU) out of 9021 Italian startups. The most common type of female startups in Italy, with 554 companies, is the “Strong” type. Woman startups belong to this type when the arithmetic average among the women present in the company’s share capital and the percentage of chair ownership in the administrative body exceeds 66%. Followed by that, with 398 companies, is the “Exclusive” type, where the result of the report just described for the determination of the female presence is 100%. Finally, with 239 companies, there is the “Majority” type, where the arithmetic average among the women present in the company’s equity and the number of chairs in the administrative body belonging to them is more than 50%.
An important fact of our research is the geographical distribution of Italian WSU that are distributed with minimal differences between north and south. The number of WSU in the north and south cancels the geographical gap, as their presence is almost the same in both Northern and Southern Italy: There are 324 WSU in the N/W area, while there are 323 WSU in the S area. As regards the consistency of the WSU’s share capital, our research shows a greater presence of female startups in class 3 (544 units out of 1191 Italian WSU), with a share capital of between 5000 and 10,000 euros. The data that emerge from our study prove that Italian WSU are structured with very weak equity (equity), an aspect already confirmed in the literature (Muravyev et al. 2009; Robb and Coleman 2010), which often allows the entrepreneur to establish only one company in the form of SRLs (SLLC: Semplified Limied Company) with an equity greater than € 1.00 but less than € 10,000. This type of company allows greater ease of starting up the business activity, but implies a higher business risk related to the responsibilities of the entrepreneur.
A peculiarity related to the study of the consistency of the social capital of Italian female startups is their so-called “bell” trend. Starting from Class 1, they reach the peak in Class 3 and then gradually decrease until they reach Class 9. Moreover, in reaching the highest class in terms of value, there are no vacant classes, so continuity between the capital classes of the WSU is observed.
The 3 WSU in Class 9 all belong to Northeast (N/E) Italy; moreover, two of these are of the “Exclusive” type, while the remaining one is of the “Strong” type.
The undercapitalization of the WSU also implies a further problem related to credit. In Italy, most companies are bank-oriented; therefore, to receive credit capital, they must offer numerous guarantees that, at present, the data of our research show that the WSU do not possess.
As regards the legal form adopted by Italian WSU, our analysis shows a preference, with 941 companies out of 1191, of the legal form of a limited liability company. This is followed, with 205 companies out of 1191, by the form created ad hoc for startups, or the limited-liability one, simplified where a single euro of social capital is sufficient for its establishment. Then, there is the form of a cooperative society with 36 WSU. Finally, with nonsignificant numbers, the types of responsibility are identified with a single shareholder, a consortium with limited liability, and the form of a joint-stock company. There are no European Economic Interest Groups (EEIGs), Companies Established on the basis of the laws of another State, and the so-called European women’s predominantly European companies. In our opinion, the data highlight the small size of Italian female startups that choose more and more forms that give a limited responsibility to the social structure to the detriment of all those forms that allow a more widespread corporate base, as well as a simpler international comparison.
What has just been written is then confirmed by the fact that the only 2 WSU constituted in the form of a joint stock company are of the “Strong” type, and the other is of the “Majority” type.
Concluding on the last topic dealt with in this contribution for Italian female startups, we can see how most of these choose the service sector.
The female startups operating in the services sector are 894 and represent 75.06% of the 1191 Italian WSU. Then follow the 197 female companies operating in the Industry/Craft sector and representing 16.54% of the 1191 Italian WSU. Then, there are, in a residual order, the WSU present in the Commerce sector (5.71%), in the Tourism sector (1.68%), and, finally, in the Agriculture sector (0.92%). Only 0.08% of Italian WSU has not declared the sector in which it operates.
In our research, we also deal with the presence, in the Italian economic context, of WSU that operate in particular sectors of activity, such as those with a high technological value in the Energetic field and those in CD social vocation. The first ones, with 185 companies, represent 15.53% of the total of Italian WSU, while the latter, even for their particular business purpose and for their recent introduction into the Italian legal system, with only 54, represent 4.53% of the 1191 Italian female startups.
The limits of our research are undoubtedly traceable in the small dimensions of Italian female startups and in the fact that these are constantly evolving. In addition to this aspect, we must note the absence of good governance systems that allow us to observe the efficiency of their work and operation.
A further limitation is of a territorial nature, as our research is concentrated only on Italian companies.
This contribution aims to be the starting point for future research aimed at the development of female startups over time. First of all, we will present analyses through case studies, then we will analyze some main performance factors and organizational models, and then evolve the study on foreign entities in order to bring to terms a complete comparative analysis on gender startups.
Author Contributions
Conceptualization, Paola Paoloni; Data curation, Giuseppe Modaffari.
Funding
This research received no external funding.
Conflicts of Interest
The authors declare no conflict of interest.
Appendix A

Table A1.
Shows the geographical distribution of Italians startups in the second quarter of 2018.
| Italian Region | Number of Startups |
|---|---|
| ABRUZZO | 213 |
| BASILICATA | 90 |
| CALABRIA | 194 |
| CAMPANIA | 661 |
| EMILIA-ROMAGNA | 889 |
| FRIULI-VENEZIA GIULIA | 209 |
| LAZIO | 921 |
| LIGURIA | 165 |
| LOMBARDIA | 2168 |
| MARCHE | 370 |
| MOLISE | 40 |
| PIEMONTE | 482 |
| PUGLIA | 342 |
| SARDEGNA | 167 |
| SICILIA | 469 |
| TOSCANA | 402 |
| TRENTINO-ALTO ADIGE | 233 |
| UMBRIA | 155 |
| VALLE D’AOSTA | 19 |
| VENETO | 832 |
| ITALY | 9021 |
Table A2.
Shows the startups classification to value of production cluster.
| Value of Production | Class of Production |
|---|---|
| 0–100.000 euro | A |
| 100.001–500.000 euro | B |
| 500.001–1.000.000 euro | C |
| 1.000.001–2.000.000 euro | D |
| 2.000.001–5.000.000 euro | E |
| 5.000.001–10.000.000 euro | F |
| 10.000.001–50.000.000 euro | G |
| Over 50.000.000 euro | H |
| Not Available |
Table A3.
Shows the class of Italian startups’ number of employees.
| Number of Employees | Class of Employees |
|---|---|
| 0–4 | A |
| 5–9 | B |
| 10–19 | C |
| 20–49 | D |
| 50–249 | E |
| Over 250 | F |
| Not Available |
Table A4.
Shows the class of Italians startups’ nominal value of capital.
| Nominal Value of Capital | Class of Capital |
|---|---|
| 1 euro | 1 |
| From 1 up to 5.000 euro | 2 |
| From 5.000 up to 10.000 euro | 3 |
| From 10.000 up to 50.000 euro | 4 |
| From 50.000 up to 100.000 euro | 5 |
| From 100.000 up to 250.000 euro | 6 |
| From 250.000 up to 500.000 euro | 7 |
| From 500.000 up to 1.000.000 euro | 8 |
| From 1.000.000 up to 2.500.000 euro | 9 |
| From 2.500.000 up to 5.000.000 euro | 10 |
| Over 5.000.000 euro | 11 |
Table A5.
Shows the composition of share sapital and of board of directors (or sole director) to consider the orevalence of Italian startups: Majority, Strong, and Exclusive.
Table A5.
Shows the composition of share sapital and of board of directors (or sole director) to consider the orevalence of Italian startups: Majority, Strong, and Exclusive.
| Prelevance: Female/Youth/Foreing | Description |
|---|---|
| NO | [% of (Female or Youth or Foreign) Share Capital+ % (Female or Youth or Foreign) Director]/2 ≤ 50% |
| Mayority | [% of (Female or Youth or Foreign) Share Capital+ % (Female or Youth or Foreign) Director]/2 > 50% |
| Strong | [% of (Female or Youth or Foreign) Share Capital+ % (Female or Youth or Foreign) Director]/2 > 66% |
| Exclusive | [% of (Female or Youth or Foreign) Share Capital+ % (Female or Youth or Foreign) Director]/2 = 100% |
| Not Available |
References
- Alina, Bădulescu. 2011. Start-up financing sources: Does gender matter? Some evidence for EU and Romania. The Annals of the University of Oradea 207: 644–9. [Google Scholar]
- Amatucci, Frances M., and Ethné Swartz. 2011. Through a fractured lens: Women entrepreneurs and the private equity negotiation process. Journal of Developmental Entrepreneurship 16: 333–50. [Google Scholar] [CrossRef]
- Armstrong, Craig E. 2011. Thinking and slacking or doing and feeling? Gender and the interplay of cognition and affect in new venture planning. Journal of Developmental Entrepreneurship 16: 213–26. [Google Scholar] [CrossRef]
- Aziz, Shahnaz, and Jamie Cunningham. 2008. Workaholism, work stress, work-life imbalance: Exploring gender’s role. Gender in Management: An International Journal 23: 553–66. [Google Scholar] [CrossRef]
- Baines, Donna. 2010. Gender mainstreaming in a development project: Intersectionality in a post-colonial un-doing? Gender, Work & Organization 17: 119–49. [Google Scholar]
- Barnir, Anat. 2014. Gender differentials in antecedents of habitual entrepreneurship: Impetus factors and human capital. Journal of Developmental Entrepreneurship 19: 1450001. [Google Scholar] [CrossRef]
- Berger, Elisabeth SC, and Andreas Kuckertz. 2016. Female entrepreneurship in startup ecosystems worldwide. Journal of Business Research 69: 5163–68. [Google Scholar] [CrossRef]
- Bird, Sharon R. 2011. Unsettling universities’ incongruous, gendered bureaucratic structures: A case-study approach. Gender, Work & Organization 18: 202–30. [Google Scholar]
- Booysen, Lize AE, and Stella M. Nkomo. 2010. Gender role stereotypes and requisite management characteristics: The case of South Africa. Gender in Management: An International Journal 25: 285–300. [Google Scholar] [CrossRef]
- Brana, Sophie. 2013. Microcredit: An answer to the gender problem in funding? Small Business Economics 40: 87–100. [Google Scholar] [CrossRef]
- Coleman, Susan, and Alicia Robb. 2009. A comparison of new firm financing by gender: Evidence from the Kauffman Firm Survey data. Small Business Economics 33: 397. [Google Scholar] [CrossRef]
- Crump, Barbara J., Keri A. Logan, and Andrea McIlroy. 2007. Does gender still matter? A study of the views of women in the ICT industry in New Zealand. Gender, Work & Organization 14: 349–70. [Google Scholar]
- Czarniawska, Barbara, Ulla Eriksson-Zetterquist, and David Renemark. 2013. Women and work in family soap operas. Gender, Work & Organization 20: 267–82. [Google Scholar]
- Davey, Kate Mackenzie. 2008. Women’s accounts of organizational politics as a gendering process. Gender, Work & Organization 15: 650–71. [Google Scholar]
- Dechant, Kathleen, and Asya Al Lamky. 2005. Toward an understanding of Arab women entrepreneurs in Bahrain and Oman. Journal of Developmental Entrepreneurship 10: 123–40. [Google Scholar] [CrossRef]
- Derera, Evelyn, Pepukayi Chitakunye, Charles O’Neill, and Amandeep Tarkhar-Lail. 2014. Gendered lending practices: Enabling South African women entrepreneurs to access start-up capital. Journal of Enterprising Culture 22: 313–30. [Google Scholar] [CrossRef]
- Dick, Penny, and Rosie Hyde. 2006. Consent as resistance, resistance as consent: Re-reading part-time professionals’ acceptance of their marginal positions. Gender, Work & Organization 13: 543–64. [Google Scholar]
- Ebersberger, Bernd, and Christine Pirhofer. 2011. Gender, management education and the willingness for academic entrepreneurship. Applied Economics Letters 18: 841–44. [Google Scholar] [CrossRef]
- Elam, Amanda, and Siri Terjesen. 2010. Gendered institutions and cross-national patterns of business creation for men and women. The European Journal of Development Research 22: 331–48. [Google Scholar] [CrossRef]
- Emslie, Carol, and Kate Hunt. 2009. ‘Live to work’ or ‘work to live’? A qualitative study of gender and work–life balance among men and women in mid-life. Gender, Work & Organization 16: 151–72. [Google Scholar]
- Eriksson-Zetterquist, Ulla, and Alexander Styhre. 2008. Overcoming the glass barriers: Reflection and action in the ‘Women to the Top’ programme. Gender, Work & Organization 15: 133–60. [Google Scholar]
- Estrin, Saul, and Tomasz Mickiewicz. 2011. Institutions and female entrepreneurship. Small Business Economics 37: 397. [Google Scholar] [CrossRef]
- Ezzedeen, Souha R., and Kristen G. Ritchey. 2009. Career advancement and family balance strategies of executive women. Gender in Management: An International Journal 24: 388–411. [Google Scholar] [CrossRef] [Green Version]
- Guillaume, Cécile, and Sophie Pochic. 2009. What would you sacrifice? Access to top management and the work–life balance. Gender, Work & Organization 16: 14–36. [Google Scholar]
- Hancock, Amber. 2012. ‘It’s a macho thing, innit?’ Exploring the effects of masculinity on career choice and development. Gender, Work & Organization 19: 392–415. [Google Scholar]
- Healy, Geraldine, Harriet Bradley, and Cynthia Forson. 2011. Intersectional sensibilities in analysing inequality regimes in public sector organizations. Gender, Work & Organization 18: 467–87. [Google Scholar]
- Holvino, Evangelina. 2010. Intersections: The simultaneity of race, gender and class in organization studies. Gender, Work & Organization 17: 248–77. [Google Scholar]
- Itani, Hanifa, Yusuf M. Sidani, and Imad Baalbaki. 2011. United Arab Emirates female entrepreneurs: Motivations and frustrations. Equality, Diversity and Inclusion: An International Journal 30: 409–24. [Google Scholar] [CrossRef]
- Jamali, Dima. 2009. Constraints and opportunities facing women entrepreneurs in developing countries: A relational perspective. Gender in Management: An International Journal 24: 232–51. [Google Scholar] [CrossRef]
- Joshi, Heather, Gerry Makepeace, and Peter Dolton. 2007. More or less unequal? Evidence on the pay of men and women from the British Birth Cohort Studies. Gender, Work & Organization 14: 37–55. [Google Scholar]
- Kelan, Elisabeth K. 2010. Gender logic and (un) doing gender at work. Gender, Work & Organization 17: 174–94. [Google Scholar]
- Khan, Muhammad. 2017. Saudi Arabian Female Startups Status Quo. International Journal of Entrepreneurship 21: 1–27. [Google Scholar]
- Kirkwood, Jodyanne. 2009. Motivational factors in a push-pull theory of entrepreneurship. Gender in Management: An International Journal 24: 346–64. [Google Scholar] [CrossRef]
- Kodama, Naomi, and Kazuhiko Odaki. 2011. Gender difference in the probability of success in starting business turns negligible when controlling for the managerial experience. Applied Economics Letters 18: 1237–41. [Google Scholar] [CrossRef]
- Lee, In Hyeock, and Matthew R. Marvel. 2014. Revisiting the entrepreneur gender–performance relationship: A firm perspective. Small Business Economics 42: 769–86. [Google Scholar] [CrossRef]
- Lewis, Patricia, and Ruth Simpson. 2010. Meritocracy, difference and choice: Women’s experiences of advantage and disadvantage at work. Gender in Management: An International Journal 25: 165–69. [Google Scholar] [CrossRef]
- McDonald, Paula, Kerry Brown, and Lisa Bradley. 2005. Explanations for the provision-utilisation gap in work-life policy. Women in Management Review 20: 37–55. [Google Scholar] [CrossRef] [Green Version]
- Moswete, Naomi, and Gary Lacey. 2015. “Women cannot lead”: Empowering women through cultural tourism in Botswana. Journal of Sustainable Tourism 23: 600–17. [Google Scholar] [CrossRef]
- Muravyev, Alexander, Oleksandr Talavera, and Dorothea Schäfer. 2009. Entrepreneurs’ gender and financial constraints: Evidence from international data. Journal of Comparative Economics 37: 270–86. [Google Scholar] [CrossRef]
- Neill, Stern, Lynn Metcalf, and Jonathan L. York. 2015. Seeing what others miss: A study of women entrepreneurs in high-growth startups. Entrepreneurship Research Journal 5: 293–322. [Google Scholar] [CrossRef]
- Paoloni, Paola. 2011. La Dimensione Relazionale delle Imprese Femminili (trans. The Relationship Dimension of Female Firms). Milano Francoangeli. [Google Scholar]
- Paoloni, Paola, and Paola Demartini. 2016. Studi di genere, un’analisi della letteratura, in Paoloni P. (a cura di) I Mondi delle Donne, Edicusano. [Google Scholar]
- Pesonen, Sinikka, Janne Tienari, and Sinikka Vanhala. 2009. The boardroom gender paradox. Gender in Management: An International Journal 24: 327–45. [Google Scholar] [CrossRef]
- Powell, Abigail, Barbara Bagilhole, and Andrew Dainty. 2009. How women engineers do and undo gender: Consequences for gender equality. Gender, Work & Organization 16: 411–28. [Google Scholar]
- Robb, Alicia M. 2002. Entrepreneurial performance by women and minorities: The case of new firms. Journal of Developmental Entrepreneurship 7: 383–97. [Google Scholar]
- Robb, Alicia M., and Susan Coleman. 2010. Financing strategies of new technology-based firms: A comparison of women-and men-owned firms. Journal of Technology Management & Innovation 5: 30–50. [Google Scholar]
- Robinson, Sherry, and John Finley. 2007. Rural Women’s Self-Employment: A Look at Pennsylvania. Academy of Entrepreneurship Journal 13: 21–30. [Google Scholar]
- Sequeira, Jennifer M., Zhengjun Wang, and Joseph Peyrefitte. 2016. Challenges to New Venture Creation and Paths to Venture Success: Stories from Japanese and Chinese Women Entrepreneurs. Journal of Business Diversity 16: 42–59. [Google Scholar]
- Swan, Elaine. 2010. “A testing time, full of potential?” Gender in management, histories and futures. Gender in Management: An International Journal 25: 661–75. [Google Scholar] [CrossRef]
- Tienari, Janne, Charlotte Holgersson, Susan Meriläinen, and Pia Höök. 2009. Gender, management and market discourse: The case of gender quotas in the Swedish and Finnish media. Gender, Work & Organization 16: 501–21. [Google Scholar]
- Tlaiss, Hayfaa, and Saleema Kauser. 2011. The impact of gender, family, and work on the career advancement of Lebanese women managers. Gender in Management: An International Journal 26: 8–36. [Google Scholar] [CrossRef]
- Tyler, Melissa, and Laurie Cohen. 2008. Management in/as comic relief: Queer theory and gender performativity in The Office. Gender, Work & Organization 15: 113–32. [Google Scholar]
- Van den Brink, Marieke, and Yvonne Benschop. 2012. Gender practices in the construction of academic excellence: Sheep with five legs. Organization 19: 507–24. [Google Scholar] [CrossRef]
- Van den Brink, Marieke, and Lineke Stobbe. 2009. Doing gender in academic education: The paradox of visibility. Gender, Work & Organization 16: 451–70. [Google Scholar]
- Welsh, Dianne HB, Esra Memili, Eugene Kaciak, and Saddiga Ahmed. 2013. Sudanese women entrepreneurs. Journal of Developmental Entrepreneurship 18: 1350013. [Google Scholar] [CrossRef]
- Welsh, Dianne HB, Eugene Kaciak, and Narongsak Thongpapanl. 2016. Influence of stages of economic development on women entrepreneurs’ startups. Journal of Business Research 69: 4933–40. [Google Scholar] [CrossRef]
- Wood, Glenice J., and Janice Newton. 2006. Childlessness and women managers: ‘choice’, context and discourses. Gender, Work & Organization 13: 338–58. [Google Scholar]
- Zartaloudis, Sotirios. 2015. Money, Empowerment and Neglect–The E uropeanization of Gender Equality Promotion in G reek and Portuguese E mployment Policies. Social Policy & Administration 49: 530–47. [Google Scholar]
| 1 | Available to www. search.ebscohost.com. |
| 2 | The legal status concerns: European Group of Economic Interest (EEIG); Limited Liability Company; Limited Liability Company with Sole Shareholder; Simplified Limited Liability Company; Limited Liability Consortium Company; Cooperative Company; Company Formed under the laws of another State; European company; Joint Stock Company. |
| 3 | The Sectors are: AGRICULTURE/FISHING: It includes all the startups belonging to the primary sector operating in agriculture or in the industry; TRADE: Welcomes all those startups that, through process innovation, manage to improve the demand and supply of companies belonging to the secondary sector, acting as inter mediation between the subjects; INDUSTRY/CRAFTSMANSHIP: It welcomes all those startups that, through product and process innovation, operate in the secondary sector. All those companies that operate economic activity aimed at transforming the input into final output belong to this category. For example, we find companies that manufacture new products in the field of construction, computers and electronic equipment, means of transport, or even in the field of interior design. SERVICES: It welcomes all those startups that, through product and process innovation, operate in the tertiary sector. This category includes all those companies that offer IT services, intellectual activities, business consultancy, or specialized research and development activities; TOURISM: It welcomes all those startups that, through their activity, provide innovative services within this particular branch of the tertiary sector. Companies included in this category provide accommodation services and those typical of travel agencies and tour operator. |
| 4 | We refer to the following activities: Social assistance; health; education, education and training; protection of the environment and the ecosystem; enhancement of cultural heritage; social tourism; university and postgraduate education; research and provision of cultural services; extrascholastic training, aimed at preventing early school-leaving and scholastic and educational success; instrumental services to social enterprises, rendered by bodies composed in excess of seventy percent by organizations that carry out a social enterprise. |
Figure 1.
Geographical Macroarea.

Figure 2.
Distribution and the geographical location of Italian woman startups (WSU) in the s.q. 2018.
Figure 2.
Distribution and the geographical location of Italian woman startups (WSU) in the s.q. 2018.

Figure 3.
Composition, distribution, and type of relevance of woman startups in Italy.

Table 1.
Summary of Literature.
| Category | Description | Nr. Results | Nr. WSU’s Results |
|---|---|---|---|
| A1 | Includes those articles concerning the presence of women on boards of directors, board of statutory auditors or other company committees. A1 also includes research in the field of female careers, the crystal ceiling phenomenon or the phenomenon of “gender quotas”; | 8 | 1 |
| A2 | Includes all the researches on women’s businesses, the family business, the relational capital with the activation of formal and informal relationships that a woman activates during the life cycle of her own company and the different problems she encounters in doing business | 50 | 16 |
| A3 | Includes articles that expose and analyze the presence of conflicts between work and family, children, husband and how the career cycle of a woman almost always coincides with her biological cycle | 25 | 1 |
| A4 | Includes those researches aimed at highlighting situations of difference, for various reasons, between men and women, such as in socio-political contexts; socio- economic; geopolitical; and finally those differences concerning access to credit | 56 | 15 |
| A5 | It is a relevant category that emphasizes situations of discrimination in the workplace, political, economic and social | 22 | 4 |
| A6 | As a residual category it assembles all those articles that have not been included in the other previous categories | 55 | 2 |
| Total | 216 | 39 |
Table 2.
Composition for geographical macroarea of women startups (WSU) and their type of relevance.
Table 2.
Composition for geographical macroarea of women startups (WSU) and their type of relevance.
| Geographical Macro-Area | Number of Italian Startup | Number of “Pink” Startups in Italy | Relevance Exclusive | Relevance Strong | Relevance Mayority |
|---|---|---|---|---|---|
| N/W | 2834 | 324 | 86 | 159 | 79 |
| N/E | 2163 | 258 | 97 | 110 | 51 |
| C | 1977 | 286 | 103 | 124 | 59 |
| S | 2047 | 323 | 112 | 161 | 50 |
| Total | 9021 | 1191 | 398 | 554 | 239 |
Table 3.
Class of Italian startups and the Italian woman startups’ share capital.
| Class of Share Capital | Italy | |||
|---|---|---|---|---|
| Italian Startups | Woman Italian Startups | |||
| unit | % | unit | % | |
| 1 | 106 | 1.18% | 10 | 0.84% |
| 2 | 1859 | 20.61% | 321 | 26.95% |
| 3 | 3829 | 42.45% | 544 | 45.68 |
| 4 | 2015 | 22.34% | 204 | 17.13% |
| 5 | 512 | 5.68% | 47 | 3.95% |
| 6 | 282 | 3.13% | 14 | 1.18% |
| 7 | 125 | 1.39% | 7 | 0.59% |
| 8 | 83 | 0.92% | 7 | 0.59% |
| 9 | 55 | 0.61% | 3 | 0.25% |
| 10 | 11 | 0.12% | 0 | 0.00% |
| 11 | 7 | 0.08% | 0 | 0.00% |
| Undeclared | 137 | 1.52% | 34 | 2.85% |
| Total | 9021 | 100% | 1191 | 100% |
Table 4.
Class of Italian startups and Italian woman startups’ share capital for geographical macroarea.
Table 4.
Class of Italian startups and Italian woman startups’ share capital for geographical macroarea.
| Class of Share Capital | N/W Area | N/E Area | C Area | S Area | ||||||||||||
|---|---|---|---|---|---|---|---|---|---|---|---|---|---|---|---|---|
| Italian Startups | Woman Italian Startups | Italian Startups | Woman Italian Startups | Italian Startups | Woman Italian Startups | Italian Startups | Woman Italian Startups | |||||||||
| unit | % | unit | % | unit | % | unit | % | unit | % | unit | % | unit | % | unit | % | |
| 1 | 40 | 1.14% | 3 | 0.93% | 24 | 1.11% | 3 | 1.16% | 27 | 1.37% | 1 | 0.35% | 15 | 0.73% | 3 | 0.93% |
| 2 | 457 | 16.13% | 68 | 20.99% | 420 | 19.42% | 65 | 25.19% | 423 | 21.40% | 88 | 30.77% | 559 | 27.31% | 100 | 30.96% |
| 3 | 1171 | 41.32% | 146 | 45.06% | 878 | 40.59% | 124 | 48.06% | 854 | 43.20% | 124 | 43.36% | 926 | 45.24% | 150 | 46.44% |
| 4 | 755 | 26.64% | 78 | 24.07% | 501 | 23.16% | 39 | 15.12% | 438 | 22.15% | 50 | 17.48% | 321 | 15.68% | 37 | 11.46% |
| 5 | 180 | 6.35% | 17 | 5.25% | 145 | 6.70% | 11 | 4.26% | 96 | 4.86% | 10 | 3.50% | 91 | 4.45% | 9 | 2.79% |
| 6 | 107 | 3.78% | 5 | 1.54% | 85 | 3.93% | 4 | 1.55% | 49 | 2.48% | 0 | 0.00% | 41 | 2.00% | 5 | 1.55% |
| 7 | 47 | 1.66% | 3 | 0.93% | 31 | 1.43% | 2 | 0.78% | 27 | 1.37% | 2 | 0.70% | 20 | 0.98% | 0 | 0.00% |
| 8 | 36 | 1.27% | 2 | 0.62% | 27 | 1.25% | 2 | 0.78% | 16 | 0.81% | 1 | 0.35% | 4 | 0.20% | 2 | 0.62% |
| 9 | 18 | 0.64% | 0 | 0.00% | 23 | 1.06% | 3 | 1.16% | 5 | 0.25% | 0 | 0.00% | 9 | 0.44% | 0 | 0.00% |
| 10 | 4 | 0.14% | 0 | 0.00% | 3 | 0.14% | 0 | 0.00% | 3 | 0.15% | 0 | 0.00% | 1 | 0.05% | 0 | 0.00% |
| 11 | 4 | 0.14% | 0 | 0.00% | 1 | 0.05% | 0 | 0.00% | 1 | 0.05% | 0 | 0.00% | 1 | 0.05% | 0 | 0.00% |
| Undeclared | 15 | 0.53% | 2 | 0.62% | 25 | 1.16% | 5 | 1.94% | 38 | 1.92% | 10 | 3.50% | 59 | 2.88% | 17 | 5.26% |
| Total | 2834 | 100.00% | 324 | 100.00% | 2163 | 100.00% | 258 | 100.00% | 1977 | 100.00% | 286 | 100.00% | 2047 | 100.00% | 323 | 100.00% |
Table 5.
Type of Italian woman startups (WSU) to geographical macroarea and to class of share capital.
Table 5.
Type of Italian woman startups (WSU) to geographical macroarea and to class of share capital.
| Class of Share Capital | Prelevance Exclusive | Prelevance Strong | Prelevance Mayority | |||||||||
|---|---|---|---|---|---|---|---|---|---|---|---|---|
| N/W | N/E | C | S | N/W | N/E | C | S | N/W | N/E | C | S | |
| 1 | 2 | 3 | 1 | 2 | 1 | 0 | 0 | 1 | 0 | 0 | 0 | 0 |
| 2 | 27 | 32 | 35 | 46 | 28 | 26 | 39 | 47 | 13 | 7 | 14 | 7 |
| 3 | 46 | 42 | 47 | 45 | 65 | 52 | 53 | 82 | 35 | 30 | 24 | 23 |
| 4 | 7 | 7 | 10 | 6 | 51 | 20 | 25 | 15 | 20 | 12 | 15 | 16 |
| 5 | 3 | 5 | 3 | 1 | 10 | 6 | 3 | 7 | 4 | 0 | 4 | 1 |
| 6 | 0 | 2 | 0 | 1 | 2 | 1 | 0 | 2 | 3 | 1 | 0 | 2 |
| 7 | 0 | 0 | 0 | 0 | 1 | 2 | 1 | 0 | 2 | 0 | 1 | 0 |
| 8 | 0 | 0 | 0 | 0 | 0 | 1 | 0 | 1 | 2 | 1 | 1 | 1 |
| 9 | 0 | 2 | 0 | 0 | 0 | 1 | 0 | 0 | 0 | 0 | 0 | 0 |
| 10 | 0 | 0 | 0 | 0 | 0 | 0 | 0 | 0 | 0 | 0 | 0 | 0 |
| 11 | 0 | 0 | 0 | 0 | 0 | 0 | 0 | 0 | 0 | 0 | 0 | 0 |
| Undeclared | 1 | 4 | 7 | 11 | 1 | 1 | 3 | 6 | 0 | 0 | 0 | 0 |
| Total | 86 | 97 | 103 | 112 | 159 | 110 | 124 | 161 | 79 | 51 | 59 | 50 |
Table 6.
Legal form of Italian startups and Italian woman startups.
| Startups (Company) Legal Form | Italy | |||
|---|---|---|---|---|
| Italian Startups | Woman Italian Startups | |||
| unit | % | unit | % | |
| European Group of Economic Interest (EEIG) | 1 | 0.01% | 0 | 0.00% |
| Limited Liability Company (LLC) | 7702 | 85.38% | 941 | 79.01% |
| Limited Liability Company with Sole Shareholder (LLC-SS) | 49 | 0.54% | 4 | 0.34% |
| Simplified Limited Liability Company (SLLC and in Italy S.r.l.s) | 1037 | 11.50% | 205 | 17.21% |
| Limited Liability Consortium Company (LLCC) | 11 | 0.12% | 3 | 0.25% |
| Cooperative Company (CC) | 144 | 1.60% | 36 | 3.02% |
| Company Formed under the laws of another State (CFLAS) | 6 | 0.07% | 0 | 0.00% |
| European company (EC) | 1 | 0.01% | 0 | 0.00% |
| Joint Stock Company (JSC) | 70 | 0.78% | 2 | 0.17% |
| Total | 9021 | 100.00% | 1191 | 100.00% |
Table 7.
Legal form of Italian startups and Italian woman startups for geographical macroarea.
| Startups (Company) Legal Form | N/W Area | N/E Area | C Area | S Area | ||||||||||||
|---|---|---|---|---|---|---|---|---|---|---|---|---|---|---|---|---|
| Italian Startups | Woman Italian Startups | Italian Startups | Woman Italian Startups | Italian Startups | Woman Italian Startups | Italian Startups | Woman Italian Startups | |||||||||
| unit | % | unit | % | unit | % | unit | % | unit | % | unit | % | unit | % | unit | % | |
| EEIG | 0 | 0.00% | 0 | 0.00% | 0 | 0.00% | 0 | 0.00% | 0 | 0.00% | 0 | 0.00% | 1 | 0.05% | 0 | 0.00% |
| LLC | 2542 | 89.70% | 279 | 86.11% | 1908 | 88.21% | 214 | 82.95% | 1660 | 83.97% | 219 | 76.57% | 1592 | 77.77% | 229 | 70.90% |
| LLC-SS | 14 | 0.49% | 1 | 0.31% | 15 | 0.69% | 1 | 0.39% | 7 | 0.35% | 1 | 0.35% | 13 | 0.64% | 1 | 0.31% |
| SLLC and in Italy S.r.l.s | 218 | 7.69% | 40 | 12.35% | 199 | 9.20% | 37 | 14.34% | 250 | 12.65% | 53 | 18.53% | 370 | 18.08% | 75 | 23.22% |
| LLCC | 4 | 0.14% | 1 | 0.31% | 3 | 0.14% | 1 | 0.39% | 0 | 0.00% | 0 | 0.00% | 4 | 0.20% | 1 | 0.31% |
| CC | 12 | 0.42% | 2 | 0.62% | 26 | 1.20% | 5 | 1.94% | 46 | 2.33% | 12 | 4.20% | 60 | 2.93% | 17 | 5.26% |
| CFLAS | 3 | 0.11% | 0 | 0.00% | 2 | 0.09% | 0 | 0.00% | 0 | 0.00% | 0 | 0.00% | 1 | 0.05% | 0 | 0.00% |
| EC | 0 | 0.00% | 0 | 0.00% | 0 | 0.00% | 0 | 0.00% | 1 | 0.05% | 0 | 0.00% | 0 | 0.00% | 0 | 0.00% |
| JSC | 41 | 1.45% | 1 | 0.31% | 10 | 0.46% | 0 | 0.00% | 13 | 0.66% | 1 | 0.35% | 6 | 0.29% | 0 | 0.00% |
| Total | 2834 | 100% | 324 | 100% | 2163 | 100% | 258 | 100% | 1977 | 100% | 286 | 100% | 2047 | 100% | 323 | 100% |
Table 8.
Type of Italian woman startups (WSU) to geographical macroarea and to type of legal form.
| Startups (Company) Legal Form | Prelevance Exclusive | Prelevance Strong | Prelevance Mayority | |||||||||
|---|---|---|---|---|---|---|---|---|---|---|---|---|
| N/W | N/E | C | S | N/W | N/E | C | S | N/W | N/E | C | S | |
| EEIG | 0 | 0 | 0 | 0 | 0 | 0 | 0 | 0 | 0 | 0 | 0 | 0 |
| LLC | 65 | 72 | 68 | 70 | 140 | 95 | 101 | 116 | 74 | 47 | 50 | 43 |
| LLC-SS | 1 | 1 | 1 | 1 | 0 | 0 | 0 | 0 | 0 | 0 | 0 | 0 |
| SLLC and in Italy S.r.l.s | 18 | 19 | 25 | 30 | 17 | 14 | 20 | 38 | 5 | 4 | 8 | 7 |
| LLCC | 1 | 1 | 0 | 0 | 0 | 0 | 0 | 1 | 0 | 0 | 0 | 0 |
| CC | 1 | 4 | 9 | 11 | 1 | 1 | 3 | 6 | 0 | 0 | 0 | 0 |
| CFLAS | 0 | 0 | 0 | 0 | 0 | 0 | 0 | 0 | 0 | 0 | 0 | 0 |
| EC | 0 | 0 | 0 | 0 | 0 | 0 | 0 | 0 | 0 | 0 | 0 | 0 |
| JSC | 0 | 0 | 0 | 0 | 1 | 0 | 0 | 0 | 0 | 0 | 1 | 0 |
| Total | 86 | 97 | 103 | 112 | 159 | 110 | 124 | 161 | 79 | 51 | 59 | 50 |
Table 9.
Business sector of Italian startups and Italian woman startups.
| Startups (Company) Business Sector | Italy | |||
|---|---|---|---|---|
| Italian Startups | Woman Italian Startups | |||
| unit | % | unit | % | |
| AGRICULTURE/FISHING | 59 | 0.65% | 11 | 0.92% |
| TRADE | 397 | 4.40% | 68 | 5.71% |
| INDUSTRY/CRAFTSMANSHIP | 1669 | 18.50% | 197 | 16.54% |
| SERVICES | 6772 | 75.07% | 894 | 75.06% |
| TOURISM | 92 | 1.02% | 20 | 1.68% |
| Undeclared | 32 | 0.35% | 1 | 0.08% |
| Total | 9021 | 100.00% | 1191 | 100.00% |
Table 10.
Business sector of Italian startups and Italian woman startups for geographical macroarea.
Table 10.
Business sector of Italian startups and Italian woman startups for geographical macroarea.
| Startups (Company) Business Sector | N/W Area | N/E Area | C Area | S Area | ||||||||||||
|---|---|---|---|---|---|---|---|---|---|---|---|---|---|---|---|---|
| Italian Startups | Woman Italian Startups | Italian Startups | Woman Italian Startups | Italian Startups | Woman Italian Startups | Italian Startups | Woman Italian Startups | |||||||||
| unit | % | unit | % | unit | % | unit | % | unit | % | unit | % | unit | % | unit | % | |
| AGRICULTURE/FISHING | 17 | 0.60% | 2 | 0.62% | 12 | 0.55% | 1 | 0.39% | 8 | 0.40% | 2 | 0.70% | 22 | 1.07% | 6 | 1.86% |
| TRADE | 146 | 5.15% | 19 | 5.86% | 72 | 3.33% | 10 | 3.88% | 74 | 3.74% | 16 | 5.59% | 105 | 5.13% | 23 | 7.12% |
| INDUSTRY/CRAFTSMANSHIP | 429 | 15.14% | 44 | 13.58% | 613 | 28.34% | 61 | 23.64% | 329 | 16.64% | 50 | 17.48% | 298 | 14.56% | 42 | 13.00% |
| SERVICES | 2209 | 77.95% | 254 | 78.40% | 1442 | 66.67% | 182 | 70.54% | 1541 | 77.95% | 215 | 75.17% | 1580 | 77.19% | 243 | 75.23% |
| TOURISM | 25 | 0.88% | 5 | 1.54% | 18 | 0.83% | 4 | 1.55% | 20 | 1.01% | 2 | 0.70% | 29 | 1.42% | 9 | 2.79% |
| Undeclared | 8 | 0.28% | 0 | 0.00% | 6 | 0.28% | 0 | 0.00% | 5 | 0.25% | 1 | 0.35% | 13 | 0.64% | 0 | 0.00% |
| Total | 2834 | 100% | 324 | 100% | 2163 | 100% | 258 | 100% | 1977 | 100% | 286 | 100% | 2047 | 100% | 323 | 100% |
Table 11.
Type of Italian woman startups (WSU) to geographical macroarea and to type of business sector.
Table 11.
Type of Italian woman startups (WSU) to geographical macroarea and to type of business sector.
| Startups (Company) Business Sector | Prelevance Exclusive | Prelevance Strong | Prelevance Mayority | |||||||||
|---|---|---|---|---|---|---|---|---|---|---|---|---|
| N/W | N/E | C | S | N/W | N/E | C | S | N/W | N/E | C | S | |
| AGRICULTURE/FISHING | 2 | 0 | 0 | 1 | 0 | 0 | 1 | 5 | 0 | 1 | 1 | 0 |
| TRADE | 6 | 5 | 8 | 7 | 11 | 3 | 6 | 14 | 2 | 2 | 2 | 2 |
| INDUSTRY/CRAFTSMANSHIP | 10 | 23 | 16 | 10 | 21 | 25 | 25 | 26 | 13 | 13 | 9 | 6 |
| SERVICES | 67 | 68 | 78 | 91 | 124 | 80 | 90 | 112 | 63 | 34 | 47 | 40 |
| TOURISM | 1 | 1 | 0 | 3 | 3 | 2 | 2 | 4 | 1 | 1 | 0 | 2 |
| Undeclared | 0 | 0 | 1 | 0 | 0 | 0 | 0 | 0 | 0 | 0 | 0 | 0 |
| Total | 86 | 97 | 103 | 112 | 159 | 110 | 124 | 161 | 79 | 51 | 59 | 50 |
Table 12.
Italian startups and Italian woman startups operating in the high technology energy sector.
Table 12.
Italian startups and Italian woman startups operating in the high technology energy sector.
| High Technology-Based Startups in the Energy Sector | Italy | |||
|---|---|---|---|---|
| Italian Startups | Woman Italian Startups | |||
| unit | % | unit | % | |
| YES | 1262 | 13.99% | 185 | 15.53% |
| NO | 7759 | 86.01% | 1006 | 84.47% |
| Total | 9021 | 100% | 1191 | 100% |
Table 13.
Italian startups and Italian woman startups operating in the high technology energy sector for geographical macroarea.
Table 13.
Italian startups and Italian woman startups operating in the high technology energy sector for geographical macroarea.
| High Technology-Based Startups in the Energy Sector | N/W Area | N/E Area | C Area | S Area | ||||||||||||
|---|---|---|---|---|---|---|---|---|---|---|---|---|---|---|---|---|
| Italian Startups | Woman Italian Startups | Italian Startups | Woman Italian Startups | Italian Startups | Woman Italian Startups | Italian Startups | Woman Italian Startups | |||||||||
| unit | % | unit | % | unit | % | unit | % | unit | % | unit | % | unit | % | unit | % | |
| YES | 348 | 12.28% | 42 | 12.96% | 345 | 15.95% | 38 | 14.73% | 284 | 14.37% | 47 | 16.43% | 285 | 13.92% | 58 | 17.96% |
| NO | 2486 | 87.72% | 282 | 87.04% | 1818 | 84.05% | 220 | 85.27% | 1693 | 85.63% | 239 | 83.57% | 1762 | 86.08% | 265 | 82.04% |
| Total | 2834 | 100% | 324 | 100% | 2163 | 100% | 258 | 100% | 1977 | 100% | 286 | 100% | 2047 | 100% | 323 | 100% |
Table 14.
Type of Italian woman startups (WSU) to geographical macroarea and Italian companies that operate, or not, in the high technology energy sector.
Table 14.
Type of Italian woman startups (WSU) to geographical macroarea and Italian companies that operate, or not, in the high technology energy sector.
| High Technology-Based Startups in the Energy Sector | Prelevance Exclusive | Prelevance Strong | Prelevance Mayority | |||||||||
|---|---|---|---|---|---|---|---|---|---|---|---|---|
| N/W | N/E | C | S | N/W | N/E | C | S | N/W | N/E | C | S | |
| YES | 7 | 12 | 12 | 20 | 24 | 16 | 25 | 23 | 11 | 10 | 10 | 15 |
| NO | 79 | 85 | 91 | 92 | 135 | 94 | 99 | 138 | 68 | 41 | 49 | 35 |
| Total | 86 | 97 | 103 | 112 | 159 | 110 | 124 | 161 | 79 | 51 | 59 | 50 |
Table 15.
Italian startups and Italian woman startups with social vocation.
| Startups with Social Vocation (in Italy-cd. Startups a Vocazione Sociale | Italy | |||
|---|---|---|---|---|
| Italian Startups | Woman Italian Startups | |||
| unit | % | unit | % | |
| YES | 190 | 2.11% | 54 | 4.53% |
| NO | 8831 | 97.89% | 1137 | 95.47% |
| Total | 9021 | 100% | 1191 | 100% |
Table 16.
Italian startups and Italian woman startups with social vocation for geographical macroarea.
Table 16.
Italian startups and Italian woman startups with social vocation for geographical macroarea.
| Startups with Social Vocation (in Italy-cd. Startups a Vocazione Sociale) | N/W Area | N/E Area | C Area | S Area | ||||||||||||
|---|---|---|---|---|---|---|---|---|---|---|---|---|---|---|---|---|
| Italian Startups | Woman Italian Startups | Italian Startups | Woman Italian Startups | Italian Startups | Woman Italian Startups | Italian Startups | Woman Italian Startups | |||||||||
| unit | % | unit | % | unit | % | unit | % | unit | % | unit | % | unit | % | unit | % | |
| YES | 89 | 3.14% | 26 | 8.02% | 34 | 1.57% | 9 | 3.49% | 31 | 1.57% | 11 | 3.85% | 36 | 1.76% | 8 | 2.48% |
| NO | 2745 | 96.86% | 298 | 91.98% | 2129 | 98.43% | 249 | 96.51% | 1946 | 98.43% | 275 | 96.15% | 2011 | 98.24% | 315 | 97.52% |
| Total | 2834 | 100% | 324 | 100% | 2163 | 100% | 258 | 100% | 1977 | 100% | 286 | 100% | 2047 | 100% | 323 | 100% |
Table 17.
Type of Italian woman startups (WSU) with or without social vocation to geographical macroarea.
Table 17.
Type of Italian woman startups (WSU) with or without social vocation to geographical macroarea.
| Startups with Social Vocation (in Italy-cd. Startups a vocazione) | Prelevance Exclusive | Prelevance Strong | Prelevance Mayority | |||||||||
|---|---|---|---|---|---|---|---|---|---|---|---|---|
| N/W | N/E | C | S | N/W | N/E | C | S | N/W | N/E | C | S | |
| YES | 6 | 5 | 3 | 4 | 15 | 4 | 5 | 4 | 5 | 0 | 3 | 0 |
| NO | 80 | 92 | 100 | 108 | 144 | 106 | 119 | 157 | 74 | 51 | 56 | 50 |
| Total | 86 | 97 | 103 | 112 | 159 | 110 | 124 | 161 | 79 | 51 | 59 | 50 |
© 2018 by the authors. Licensee MDPI, Basel, Switzerland. This article is an open access article distributed under the terms and conditions of the Creative Commons Attribution (CC BY) license (http://creativecommons.org/licenses/by/4.0/).
Share and Cite
MDPI and ACS Style
Paoloni, P.; Modaffari, G. Female-Owned Innovative Startups in Italy: Status Quo and Implications. Adm. Sci. 2018, 8, 66. https://doi.org/10.3390/admsci8040066
AMA Style
Paoloni P, Modaffari G. Female-Owned Innovative Startups in Italy: Status Quo and Implications. Administrative Sciences. 2018; 8(4):66. https://doi.org/10.3390/admsci8040066
Chicago/Turabian StylePaoloni, Paola, and Giuseppe Modaffari. 2018. "Female-Owned Innovative Startups in Italy: Status Quo and Implications" Administrative Sciences 8, no. 4: 66. https://doi.org/10.3390/admsci8040066
Note that from the first issue of 2016, this journal uses article numbers instead of page numbers. See further details here.