The Psychology of Queuing for Self-Service: Reciprocity and Social Pressure

1
NICE Information Service Company, Seoul 07292, Korea
2
KAIST College of Business, Seoul 302455, Korea
3
Department of Industrial Engineering, Seoul National University, Seoul 08826, Korea
*
Author to whom correspondence should be addressed.
Adm. Sci. 2018, 8(4), 75; https://doi.org/10.3390/admsci8040075
Submission received: 24 October 2018
/
Revised: 14 November 2018
/
Accepted: 21 November 2018
/
Published: 26 November 2018
(This article belongs to the Special Issue Behavioral Dimensions of Operations Management)
Abstract
:Many services are provided in the form of self-service. In self-service, customers simultaneously become the sole producer and a consumer of a service. Using a scenario-based experiment, we examine the psychology of queuing for self-service, and how inter-customer interaction affects service operation efficiency. We assumed that customers could decide how long they would use a service, and that length of usage increases the value of the service, such as in experience stores where customers try out newly released electronic products. Subjects decide how long they will use a service under different conditions of waiting time and social pressure. We found that generalized reciprocity influenced decisions on service time. Customers who had waited for service for long time chose to use the service for long time when it became their turn, and vice versa—subjects reciprocated the previous customer’s service usage behavior. We also show that the presence of social pressure affects customers’ service usage behavior. Under social pressure, customers tend to reciprocate the negative behavior of a previous customer less.
1. Introduction
Advances in technology have enabled self-service technology (SST) to develop rapidly, and many service providers have been adopting it to increase productivity and efficiency. Self-service enables the management of services with minimal manpower and cost, because customers effectively become temporary employees during the process. For example, a banking transaction via an ATM costs $0.36, compared with $1.15 for the same transaction with an onsite employee (Moon and Frei 2000). Therefore, many services, such as banking, movie ticketing, and airport check-in, have recently been converted to self-service. The concept of self-service is not limited to SST-based transactions; it can also refer to activities in which shoppers and potential customers can test a product or experience a service by themselves. An “experience store” is a representative concept of this form of self-service, and is often used as a marketing strategy. Apple’s stores are probably the most famous example: customers can have a hands-on experience with Apple’s products, touching (or listening) to them and using them, and employees do not necessarily need to be with customers throughout the service process. In 2007, Apple’s stores generated 4.3 times more sales per square foot per year than BestBuy, by introducing this type of experience store. Many other IT organizations, including Amazon, Microsoft, and Samsung, have also recently started opening their own similar stores.
Our research looks at a setting of self-service where the length of usage increases the value of the service, as in experience stores. In this setting, the majority of customers would want to take their time to experience products. The longer the time customers spend with the product, the more they would learn about the product—i.e., the value of the service increases. Other possible examples include using public goods, such as a hair dryer.
As more customers become familiar with using self-service and face longer waiting times for self-service, improving the productivity of self-service has become one of service providers’ main concerns. To improve service productivity, many researchers have applied human resource management (HRM) strategies to customers who are actively involved in the production and delivery of services (Mills et al. 1983; Bowen 1986; Goodwin 1988). In 2015, when the Apple watch was introduced, Apple’s management was so concerned with the productivity of the self-service function that the company limited customers to spending a maximum of 15 min each to check out the new product. Our research also examines ways to improve the productivity of self-service, but approaches the problem from a behavioral perspective. We studied behavioral factors that could affect the behavior of customers when they use self-service. More specifically, we investigated how interactions between customers in a queue affect customers’ decisions about how long to spend on such an experience.
Zhou and Soman (2003) looked at a similar problem, and explored the psychology of queuing. They found that people compare their position in a queue with others’ positions. Therefore, having a large number of people behind a customer decreases the probability that these people would decide to leave a queue after spending some time in it, because this time spent in it resulted in positive affection experiences. Our research explores the impact of people behind and people ahead of the focal customer on the focal customer’s decision on service usage. Using a scenario-based experiment (Rungtusanatham et al. 2011), we show that the service usage of the person ahead of the focal customer affects that of the focal customer through reciprocity. It is known that people reciprocate one’s action to a third party, even in anonymous situations (Gray et al. 2014). We found that service time (i.e., time spent waiting by the person behind the focal customer) is also subject to reciprocity—customers who have waited a long time tend to use the service longer than customers who have waited a short time. Furthermore, we also show that social pressure influences these customers’ service usage decision. Because of social pressure, customers tend to reciprocate any negative behavior of the previous customer less.
2. Literature Review and Hypotheses
2.1. Customer Behavior in Service Organizations
In service organizations, productivity relates strongly to the way customers participate (Lovelock and Young 1979). When customers are involved in the creation of a service product, studies treat customers as “partial” employees, and investigate ways to manage them to improve service performance. In this approach, customers’ willingness to co-produce a service product becomes a central factor. For instance, Mills et al. (1983) looked at increasing service productivity in a situation in which customers were involved in critical transactions, and provided with information necessary to start the service. They suggested that service productivity (transaction times and labor costs) could be improved by motivating not only employees, but also client–employee units. Bowen (1986) argued that human resource management (HRM) strategies developed for employees could be successfully applied to customers. He suggested strategies to create a favorable climate for service, and developed HRM practices to provide customers with role clarity, capability, and motivation. Goodwin (1988) applied organizational behavioral concepts, such as role clarity and rewards, to cause customers to behave in a desired way.
In self-service, a customer becomes a sole producer and a consumer at the same time. In this case, previous studies have focused on customers’ intentions to use SST and how attributes of SST influences customer productivity. Langeard et al. (1981) found that time and control are important factors in customers’ choosing self-service options. Meuter et al. (2000) showed that some customers prefer self-service to avoid interaction with employees. Dabholkar and Bagozzi (2002) suggested different aspects of SST should be promoted according to the characteristics of their target customers. Kim et al. (2014) studied four attributes of SST (i.e., ease of use, performance, fun, sense of presence) and found these four attributes have a positive effect on customer productivity.
Managing customers’ interactions with each other during the service process is important for several reasons. First, customers potentially influence the satisfaction and dissatisfaction levels of other customers. Martin and Pranter (1989) suggested that managers should promote positive interpersonal encounters between customers. Zhou and Soman (2003) showed that the number of customers behind a focal customer negatively affects the reneging decision (decision to drop out of a queue) through a social comparison. Furthermore, interactions between customers can influence service productivity; experienced customers can be a role model for novice customers, and help them learn more quickly. Customers can also advise each other, with good advice benefitting service flow and bad advice slowing it (Goodwin 1988).
Our paper considers inter-customer interactions in a self-service waiting line. Our focus is on customers’ decisions on service usage time, and how the people in front of and behind a focal customer influence these decisions. Specifically, we studied whether behavioral factors, such as reciprocity and social pressure, influence customers’ behavior in a self-service setting.
2.2. Reciprocity
Reciprocity is a social norm of returning a positive action with another positive action, and vice versa. Reciprocity is distinct from pure altruism and hostility in that it is conditional (Perugini and Gallucci 2001). It is not merely helping or punishing behavior, but is a conditional response to a specific previous context in which the behavior occurred. Cooperative reciprocal tendencies are called positive reciprocity, and retaliatory reciprocal tendencies are called negative reciprocity (Fehr and Gächter 2000). Positive reciprocity can be described as rewarding a first mover’s favor, and negative reciprocity can be described as punishing a first mover’s unfavorable treatment. Berg et al. (1995) showed evidence of positive reciprocity by using a trust game, and Güth et al. (1982) showed negative reciprocity by using an ultimatum game. Strong reciprocity is a form of reciprocity involving a cost of rewarding or punishing previous behavior, even when no individual long-term economic benefit is at stake. Strong reciprocity acts as a powerful incentive for cooperation, even in one-time interactions and when no reputational advantage exists. Strong reciprocators unconditionally reward those who cooperate and punish those who defect (Fehr and Fischbacher 2003).
Reciprocity generally involves tit-for-tat exchanges between two persons. However, it can also be extended to indirect reciprocity that engages a third party. Indirect reciprocity has two operational mechanisms (Boyd and Richerson 1989): (i) downstream reciprocity, which is a reciprocating action by a third party (if A helps B, then C helps A); and (ii) upstream reciprocity, which is a reciprocating action to a third party (if A helps B, then B helps C). Indirect reciprocity has been identified as an important mechanism in the evolution of cooperation between unrelated individuals (Nowak and Sigmund 2005). Many studies have used behavioral experiments to identify an enhancement of helping behavior by upstream reciprocity (for example: Dufwenberg et al. 2001; Greiner and Levati 2005; Gray et al. 2014).
Imagine that customers are waiting for service and are free to decide their own service usage time, as they are in experience stores. In this situation, one customer’s service time becomes the next customer’s waiting time. That is, customer B must wait during the service time of customer A. In turn, the service time of customer B becomes the waiting time of customer C. Although the specific members of a queue generally are there for a one-time event and represent a reputation-free environment, we expect that service usage time is subject to indirect reciprocity. If the customer ahead of the focal customer finishes quickly, the focal customer has a short wait and will repay this favor to the customer next in line by finishing quickly as well. In other words, if the previous customer has a short service time, the next customer will also have a short service time (i.e., positive reciprocity). Conversely, if the customer ahead of the focal customer dawdles, the focal customer will, too, passing this unfavorable treatment on the next customer (i.e., negative reciprocity). Therefore, we formulated the following hypothesis:
Hypothesis 1.
Service time will be subject to indirect reciprocity. The previous service user’s service time and the current service user’s service time will be positively correlated.
2.3. Social Pressure
People often change their activities and actions if others are observing them. The presence of others has been known to induce social pressure and affect decisions toward being more prosocial (Latané 1981). This is consistent with the view that people are concerned about others’ perceptions of them, especially in terms of morality and reputation that may be beneficial in future interactions. Others do not have to be really present to induce prosocial behavior. Allport (1985) showed that a subtle cue, such as the imagined or implied presence of others, had a similar effect, even when such a cue had no connection to real observation and future benefit. Haley and Fessler (2005) implemented a visual cue (an eye staring image) in an anonymous dictator game, and identified increases in prosocial behavior. Bateson et al. (2006) verified the effect in a real-world setting. He attached an image of a pair of eyes to an honesty box that was used to collect money for drinks in a university coffee room. He found that people paid around three times more than they did without the image.
In a self-service environment, the presence of many people in a waiting line can exert pressure on a service user, who will then decide as a prosocial act to use the service for a shorter time. We expect this behavior in response to even a subtle cue, i.e., an image of many people in a waiting line, in a scenario-based experiment. Therefore, we hypothesized the following:
Hypothesis 2.
The service time of a service user will be shorter when he or she perceives the presence of many people waiting in a line.
Malmendier et al. (2014) pointed out that extrinsic factors, such as social image, self-image, or social pressure appear to be important determinants in driving reciprocal behavior. However, it is not yet clear whether social pressure influences indirect reciprocal behavior positively or negatively. The positive reciprocity we consider is about altruistically rewarding a third party because of a previous cooperative interaction. It is a form of prosocial behavior. However, negative reciprocity is about punishing an innocent third party because of a previous negative interaction. This is considered antisocial behavior. Because social pressure increases prosocial behavior and decreases antisocial behavior, we expect that when social pressure is present, it enhances positive reciprocity and reduces negative reciprocity. Therefore, we hypothesize the following:
Hypothesis 3.
Social pressure has an impact on the intensity of reciprocity. Positive reciprocity is enhanced and negative reciprocity is weakened in the presence of social pressure.
Figure 1 summarizes our hypotheses.
3. Experimental Design
We conducted a scenario-based, role-playing experiment. All participants were asked to imagine they were customers queuing for self-service. We assumed that customers needed to decide on their service usage time within nine minutes (maximum service time), and that the value of the service increased with service time, as in experience stores. No context for the type of self-service was provided, to try to avoid context-related bias. The two experimental factors that were varied in the full-factorial design were the length of waiting time (three levels: 3, 6, and 9 min), and the presence of social pressure (two levels: pressure and no pressure). This experimental design depicts possible types of customer interactions between a focal customer and fellow customers who are in the same line awaiting self-service. There were three waiting periods—3 min, 6 min, and 9 min—that captured generous, fair, and greedy behavior in the service usage of a person ahead of a waiting focal customer. The two social pressure conditions, pressure (P) and no pressure (NP), captured a situation in which a few or many people waited behind the focal customer while he or she used the service. The experiment was conducted on Amazon’s Mechanical Turk (MTurk)—screenshots of the interface are in the Appendix A.
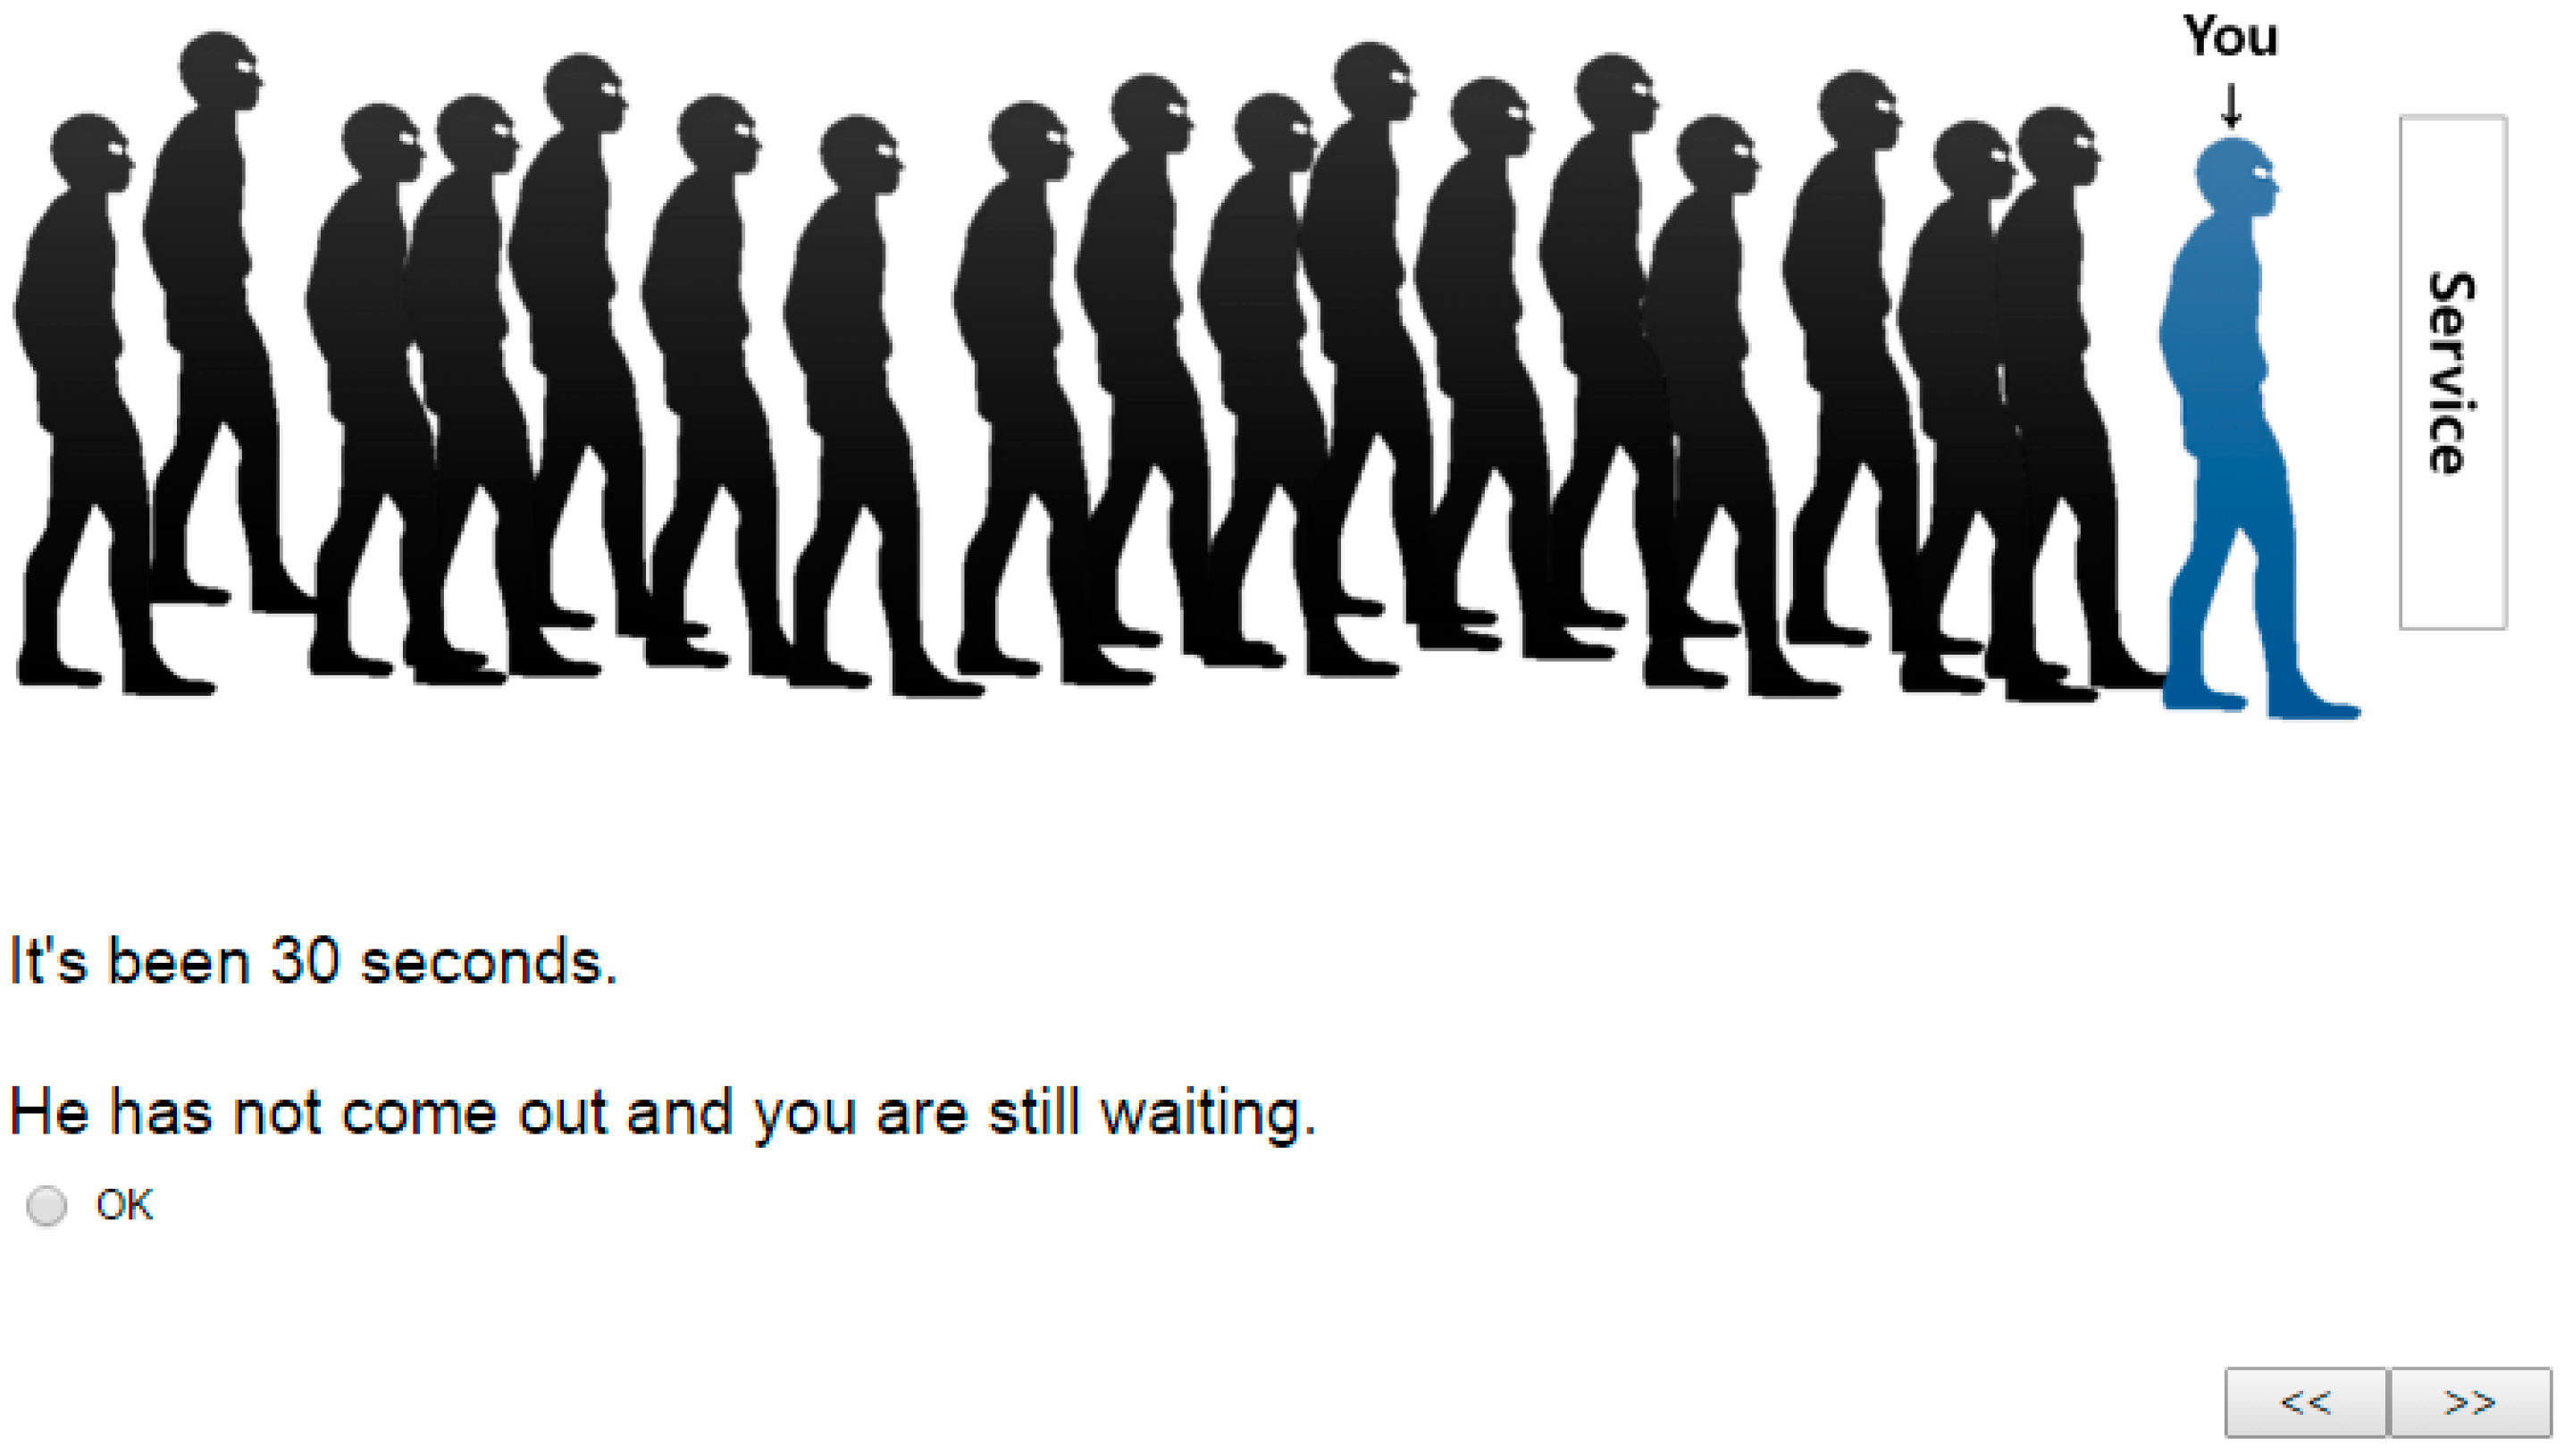
The experiment began with an introductory page of instructions. Participants were asked to imagine they were waiting in a line for self-service. They were told the service could be used for a maximum of 9 min, which was easily enough time for it. After the instructions, participants saw a page with an image of people waiting in line in which the participant was marked as having just moved into position to use the service next after the person in front of them finished. The position was marked as “you” and colored differently to visualize the participant’s position (see Figure 2). On the same page, participants were asked how much time they would perceive as fair amount for service usage, given that 9 min was easily enough to complete the service. Then, without knowing the total duration of their wait, participants were assumed to wait for the service. To lend realism to their waiting, they were asked to click “ok” and “next” buttons to pass 30 s of waiting time and therefore to move on to the next page of waiting. They repeated these actions until their turn to use the service. For example, subjects in the 6-min condition had to click and move 12 pages to reach their turn. When their turn finally came after the assigned waiting time, they were informed of their turn, and the page showed an image of the participant’s character using the service. To induce social pressure, we included an image of people waiting behind the participant’s position as a social cue. We also made sure that the image included people’s eyes because Emery (2000) showed that gaze had a strong impact to induce a social cue. In the pressure condition, we used an image of 16 people behind the participant’s position (Figure 2), but in the no pressure condition, we used an image of one person.1
After completion of the waiting scenario, subjects were asked a set of questions. First, they were asked to indicate how they perceived the length of the service time used by the person ahead (short to long, using the 7-point Likert scale). Next, we used two questions to measure perceived fairness: the first used greedy, fair, and generous as a scale; the second question used selfish, fair, and grateful as a scale. Next, participants were asked to decide how long they would use the service within a range of 1 to 9 min. We also posed questions to check social pressure manipulation; participants were asked whether they were aware of people waiting behind them, and whether their presence affected their decisions. Lastly, they answered a question to check their attentiveness, i.e., instructional manipulation check (IMC) questions in Oppenheimer et al. (2009), and answered a demographic survey (see Appendix A for the IMC question used). The IMC question was designed to test whether participants were reading and following the instructions thoroughly; the question was useful to detect attentive participants and increase the statistical power of the analysis.
We implemented our experimental design using Qualtrics and conducted the experiment online using Amazon’s Mechanical Turk (MTurk). We recruited only MTurk workers with high reputations (above 90% approval ratings) without any other restrictions (Peer et al. 2014). Geographical restriction was also not imposed. Lee et al. (2018) used this platform in reporting the validity of conducting behavioral operations management experiments. Our experiment used 278 workers, who were randomly assigned to one of the experimental conditions. Most workers lived in the United States and India; 99 lived in the United States, 164 lived in India, and the rest of workers (15) were from other geographical locations. Of the total, 151 were female and 127 were male. Their ages varied from 17 to 70. The experiment took less than 10 min, and we paid $0.10 for participation. Buhrmester et al. (2011) found that even at low compensation rates, such as 1–50 cents, payment levels did not affect data quality, but could slow data collection.
4. Results
4.1. Valid Data
We first filtered out the invalid data from the 278 responses we collected. First, to prevent duplicate participation, we removed responses with Internet Protocol (IP) addresses that appeared more than once. Second, we removed the responses of inattentive workers who gave wrong answers to the IMC question. Excluding data from duplicate participations and inattentive workers are commonly used with MTurk studies (Goodman et al. 2013). Lastly, we removed inconsistent responses. Responses were deemed inconsistent if answers given at the beginning were out of line with answers at the end. For example, at the beginning, participants answered how long they perceived as a fair amount of service time, and at the same time were told that 9 min was easily enough time to use the service. At the end, they were also asked whether the length of time (3, 6, and 9 min) they actually waited was a fair waiting time. Based on the participants’ answers to these two questions, we removed those responses in which participants evaluated the waiting time as very generous (greedy) despite a given condition’s waiting time that was longer (shorter) than the service time the participant perceived as fair at the beginning. For example, rating a waiting time of 9 min as very generous at the outset and later rating 3 min of service time as fair is inconsistent. After removing all invalid data, 206 responses remained, and were used to draw meaningful conclusions from the analysis of the data.
4.2. Manipulation Check
As noted, there were three assigned waiting time conditions: 3, 6, and 9 min. To lend realism to these situations, we asked participants to click through numerous pages until they got their turn, and the number of pages this involved was determined by each participant’s assigned waiting time conditions. After the waiting period, they were asked how fair they perceived their waiting time (the service time of the person ahead), from 1 (greedy) to 7 (generous). If our manipulation was effective, answers to this fairness question should differ significantly across the various specified waiting time conditions. We used a nonparametric test, because the assumptions of an analysis of variance (ANOVA) test were violated. These violations were that the data in the 9-min condition did not follow normality (Shapiro–Wilk W test, p < 0.001), and the data did not have equal variance across waiting time conditions (Bartlett’s test, p < 0.001). The test results showed that perceptions of fairness differed significantly across the assigned waiting conditions (Chi-squared (2) = 59.57, p < 0.0001). Table 1 summarizes the sample sizes and the perceived fairness scores across the three waiting time conditions.
We assigned participants different images of the two social pressure conditions to induce a different degree of social pressure (16 people behind a participant’s character versus 1 person behind them). At the end of the experiment, we asked participants if they were aware of people waiting behind them (Yes = 1, No = 0). We found that significantly fewer participants who were presumed to be pressured answered “No” compared with participants presumed not under pressure, indicating that the social pressure manipulations were effective.
4.3. Reliability Check
We measured perceived fairness using two questions, based on a 7-point scale; the first question used greedy, fair, and generous as a scale, and the second question used selfish, fair, and grateful. We checked the reliability of participants’ answers to these two questions. Cronbach’s alpha was 0.891, which indicated the two questions reliably measured perceived fairness.
4.4. Results
Table 2 provides an overview of subjects’ decisions on service time across different conditions. We first checked whether subject’s decision on service time was influenced by their nationality or ethnic group, and we found no significant effect of either. We used an ANOVA to test the differences across three waiting time conditions, and t-tests to test the difference between two specified social pressure conditions. We also ran a regression analysis, in which we used decisions on service time as a dependent variable, and used dummy variables for each conditions (Model 1 in Table 3). To test the interaction effect between the specified conditions for waiting times and social pressure, we also added an interaction term between the two to the regression model (Model 2 in Table 3).
The average decision on service time aggregated over the social pressure conditions was 3.98 min, 4.59 min, and 5.00 min, respectively, for the 3-, 6-, and 9-min waiting time conditions. The decisions about service time differed significantly across waiting time conditions (p < 0.01). Also, the coefficients of the 6- and 9-min dummy variables in the regression model were positive and significant (Model 1 in Table 3), indicating that the service time decisions increased with the lengths of time spent waiting. This implies that participants who waited longer decided to use the service longer when it was their turn, and vice versa. In other words, participants made their service time decisions in a reciprocal way, which supports Hypothesis 1.
The average decisions on service time aggregated over waiting time conditions were 4.42 min and 4.67 min, respectively, in the pressure and no-pressure conditions, and did not differ significantly. Similarly, the coefficient of the pressure dummy variable in the regression model was not significant. There was no difference in the service time decisions between the two social pressure conditions, and participants who were under more social pressure did not necessarily use the service for a shorter time, rejecting Hypothesis 2.
Next, we tested the interaction between waiting time and social pressure. In the pressure condition, the service time decisions did not differ significantly across the waiting time conditions (p = 0.30). In contrast, in the no-pressure condition, decisions on service time differed significantly across the waiting time conditions (p < 0.01). Reciprocal behavior lapsed when participants faced social pressure. We also used a correlation between the waiting time and the service time decision to measure the intensity of indirect reciprocity (Stanca 2009). A high correlation coefficient value means a subject’s decision on service time is highly positively related to his or her waiting time, implying stronger reciprocal behavior. The correlation coefficient was higher under the no-pressure condition (0.35) than in the pressure condition (0.12), and this again showed that reciprocal behavior weakened with social pressure. We also examined where the significant interaction came from. We found that the decisions about service time varied significantly across social pressure conditions (p < 0.05) only in the 9-min waiting time condition. There was no difference in the other waiting time conditions. The regression analysis also supports this, because the social pressure condition was significant only when it interacted with the 9-min condition (Model 2 in Table 3). In the 9-min condition, participants used the service for significantly shorter times under social pressure compared with an absence of social pressure. This implies that social pressure made participants use shorter service times only when the waits were longest. In other words, social pressure prevented participants from behaving in a negative reciprocal way, but it did not affect positive reciprocal behavior. Negative acts were reciprocated less when social pressure existed, but positive acts were reciprocated in the same way regardless of the presence of social pressure. This partially supports Hypothesis 3.
4.5. The Influence of Service Context
We also conducted a supplementary experiment to test whether the context of this specific type of self-service influenced our earlier results. In the main experiment, we intentionally avoided using a specific context to avoid context-related bias. In the supplementary experiment, we asked subjects to imagine that they were the customers in a queue, waiting to try out a newly released phone by themselves.2 The rest of the experimental design was identical to the main experiment.
Table 4 shows the results of the regression analysis of the supplementary experiment. First, the coefficients of both the 6- and 9-min dummy variables were positive and significant. The longer waiting times led to longer service time decisions, and participants decided service usage time in a reciprocal way, again supporting Hypothesis 1. Second, the coefficient of social pressure became negative and significant. Unlike in the earlier experiment, social pressure shortened the service time decision, which now supports Hypothesis 2. Third, the interaction terms of the social pressure and waiting time conditions were not significant. Social pressure had an insignificant impact on reciprocity, rejecting Hypothesis 3. In summary, in the context of shopping for a new phone, decisions on service time were also subject to generalized reciprocity. However, the context led to a difference in the impact of social pressure compared with the abstract context; social pressure shortened time usage, but did not affect the intensity of generalized reciprocity.
5. Conclusions
Using a scenario-based experiment, we examined customer behavior in a waiting line for self-service, in which customers could decide their own service usage time. We studied reciprocity and social pressure as two behavioral factors that could potentially influence customers’ behavior while waiting in line. First, we found that service time was subject to generalized reciprocity. There was a positive relationship between participants’ waiting time and their service usage time decisions. When customers perceived that a person ahead of them used the service greedily, they also used the service greedily, and vice versa. This behavior did not depend on the context of the self-service. Second, we predicted that many people waiting behind the focal customer would operate under social pressure, and make the focal customer use the service for a shorter time. Our results showed that the effect of social pressure depended on the context. In the abstract context of the main experiment, the presence of social pressure did not influence the customers’ decisions on service usage time. However, in the more specific context of trying out a newly released phone, it shortened the decisions about service time across all waiting time conditions. Third, we investigated the impact of social pressure on generalized reciprocity. In the abstract contract, we found social pressure inhibited participants from behaving in a negative reciprocal way, but did not affect positive reciprocal behavior. Under social pressure, customers did not retaliate for waiting in line for a long time (negative reciprocity). However, in the context of trying out a new phone, social pressure did not influence a degree of generalized reciprocity. In summary, we found strong support for generalized reciprocity in waiting times, but the effect of social pressure on decisions about service time was rather context-specific.
Our results can be directly applied to a setting of self-service where the length of usage increases the value of the service, such as in experience stores. We also believe that our results could provide some insights to other self-service examples, at least indirectly. In this case, we need to assume that customers are not pressed for time. The problem then becomes how much customers try to hurry or take time when using self-service. For example, at an ATM machine, when customers wait for long time, they may take their time and not try very hard to hurry to use the machine during their turn. On the other hand, when they wait for short time, they may also try to hurry and use the service for short time as well. Further, if customers are aware of many people in a waiting line, they may try hard to hurry due to social pressure. Future research could examine whether generalized reciprocity or social pressure affect decisions about service time in other self-service examples.
Previous research in queuing has focused on mathematical queuing models, and only a handful of studies (Goodwin 1988; Martin and Pranter 1989; Zhou and Soman 2003) have investigated the psychology of queuing from behavioral perspectives. This study contributes to service operations literature by investigating customer interaction while waiting in line for self-service. Our findings offer some practical guidelines to operate self-service waiting lines more effectively. Because service time is subject to generalized reciprocity, it would be important to intervene when the waiting times in a queue start to lengthen because of potential negative reciprocity. Interventions like employee assistance are necessary to break up this chain and improve service efficiency. Further, it would be important to design the queuing environment in a way to emphasize to each customer/user that others are waiting in line. In such instances, social pressure may also work to induce more prosocial behavior. As a result, negative reciprocal behavior may be reduced and overall service usage time may be shortened.
The question remains of how generalizable this study is to a real environment of waiting and standing in line. This unanswered question is a limitation of our study, which nevertheless offers a direction for future research. Our research based on a scenario-based experiment represents a first step toward investigating customers’ interactive behavior in the self-service environment. Our experimental design was successful in inducing participants to perceive different lengths of waiting periods across different waiting time conditions, and to feel social pressure. Nevertheless, future research may use a field experiment to validate our results, by making participants physically wait and observe the reactions of people behind them. We also measured decisions on service usage time by asking a question about the participants’ willingness to wait. Again, future research that uses a field experiment could observe actual service usage time and study the effect of customers’ interactions on that usage time. In this situation, it would be necessary to carefully consider an individual’s characteristics and his past experiences with the service. For example, participants may lack the skills to operate self-service equipment or software, or may have had bad experiences that influence their decisions on service time. Also, our research focused on service efficiency by investigating service usage time as a key dependent variable. Future research could expand its scope by considering the level of customer satisfaction as well.
Author Contributions
Formal analysis, H.K.; Methodology, H.K. and Y.S.L.; Supervision, Y.S.L. and K.S.P.; Writing—original draft, H.K.; Writing—review & editing, Y.S.L. and K.S.P.
Funding
This research received no external funding.
Conflicts of Interest
The authors declare no conflict of interest.
Appendix A. Experimental Design under the 3-Min Waiting Time and Pressure Condition
<Page 1: Introduction>

<Page 2>

<Page 3>

<Pages 4~8: Waiting situation>


<Page 9: Subjects’ turn>

<Page 10: Manipulation check questions>

<Page 11: Instructional manipulation check (IMC) question>

<Page 12: Demographic questions>

References
- Allport, Gordon Willard. 1985. The historical background of social psychology. In Handbook of Social Psychology, 3rd ed. Edited by Gardner Lindzey and Elliot Aronson. New York: Random House, vol. 1, pp. 1–46. [Google Scholar]
- Bateson, Melissa, Daniel Nettle, and Gilbert Roberts. 2006. Cues of being watched enhance cooperation in a real-world setting. Biology Letters 2: 412–14. [Google Scholar] [CrossRef] [PubMed]
- Berg, Joyce, John Dickhaut, and Kevin McCabe. 1995. Trust, reciprocity, and social history. Games and Economic Behavior 10: 122–42. [Google Scholar] [CrossRef]
- Bowen, David E. 1986. Managing customers as human resources in service organizations. Human Resource Management 25: 371–83. [Google Scholar] [CrossRef]
- Boyd, Robert, and Peter J. Richerson. 1989. The evolution of indirect reciprocity. Social Networks 11: 213–36. [Google Scholar] [CrossRef]
- Buhrmester, Michael, Tracy Kwang, and Samuel D. Gosling. 2011. Amazon’s Mechanical Turk a new source of inexpensive, yet high-quality data? Perspectives on Psychological Science 6: 3–5. [Google Scholar] [CrossRef] [PubMed]
- Dabholkar, Pratibha A., and Richard P. Bagozzi. 2002. An attitudinal model of technology-based self-service: Moderating effects of consumer traits and situational factors. Journal of the Academy of Marketing Science 30: 184–201. [Google Scholar] [CrossRef]
- Dufwenberg, Martin, Uri Gneezy, Werner Güth, and Eric Van Damme. 2001. Direct vs indirect reciprocity: An experiment. Homo Oeconomicus 18: 19–30. [Google Scholar]
- Emery, Nathan J. 2000. The eyes have it: The neuroethology, function and evolution of social gaze. Neuroscience & Biobehavioral Reviews 24: 581–604. [Google Scholar]
- Fehr, Ernst, and Urs Fischbacher. 2003. The nature of human altruism. Nature 425: 785–91. [Google Scholar] [CrossRef] [PubMed]
- Fehr, Ernst, and Simon Gächter. 2000. Fairness and retaliation: The economics of reciprocity. The Journal of Economic Perspectives 14: 159–81. [Google Scholar] [CrossRef]
- Goodman, Joseph K., Cynthia E. Cryder, and Amar Cheema. 2013. Data collection in a flat world: The strengths and weaknesses of Mechanical Turk samples. Journal of Behavioral Decision Making 26: 213–24. [Google Scholar] [CrossRef]
- Goodwin, Cathy. 1988. “I can do it myself:” Training the service consumer to contribute to service productivity. Journal of Services Marketing 2: 71–78. [Google Scholar] [CrossRef]
- Gray, Kurt, Adrian F. Ward, and Michael I. Norton. 2014. Paying it forward: Generalized reciprocity and the limits of generosity. Journal of Experimental Psychology: General 143: 247–54. [Google Scholar] [CrossRef] [PubMed]
- Greiner, Ben, and M. Vittoria Levati. 2005. Indirect reciprocity in cyclical networks: An experimental study. Journal of Economic Psychology 26: 711–31. [Google Scholar] [CrossRef]
- Güth, Werner, Rolf Schmittberger, and Bernd Schwarze. 1982. An experimental analysis of ultimatum bargaining. Journal of Economic Behavior & Organization 3: 367–88. [Google Scholar]
- Haley, Kevin J., and Daniel MT Fessler. 2005. Nobody’s watching? Subtle cues affect generosity in an anonymous economic game. Evolution and Human Behavior 26: 245–56. [Google Scholar] [CrossRef]
- Kim, Taehee, Min Cheol Kim, Geewoon Moon, and Kyungro Chang. 2014. Technology-based self-service and its impact on customer productivity. Services Marketing Quarterly 35: 255–69. [Google Scholar] [CrossRef]
- Langeard, Eric, John EG Bateson, C. H. Lovelock, and Pierre Eiglier. 1981. Service Marketing: New Insights from Consumers and Managers. Cambridge: Marketing Science Institute. [Google Scholar]
- Latané, Bibb. 1981. The psychology of social impact. American Psychologist 36: 343–56. [Google Scholar] [CrossRef]
- Lee, Yun Shin, Yong Won Seo, and Enno Siemsen. 2018. Running behavioral operations experiments using Amazon’s Mechanical Turk. Production and Operations Management 27: 973–89. [Google Scholar] [CrossRef]
- Lovelock, Christopher H., and Robert F. Young. 1979. Look to consumers to increase productivity. Harvard Business Review 57: 168–78. [Google Scholar]
- Malmendier, Ulrike, Vera L. te Velde, and Roberto A. Weber. 2014. Rethinking reciprocity. Annual Review of Economics 6: 849–74. [Google Scholar] [CrossRef]
- Martin, Charles L., and Charles A. Pranter. 1989. Compatibility management: Customer-to-customer relationships in service environments. Journal of Services Marketing 3: 5–15. [Google Scholar] [CrossRef]
- Meuter, Matthew L., Amy L. Ostrom, Robert I. Roundtree, and Mary Jo Bitner. 2000. Self-service technologies: Understanding customer satisfaction with technology-based service encounters. Journal of Marketing 64: 50–64. [Google Scholar] [CrossRef]
- Mills, Peter K., Richard B. Chase, and Newton Margulies. 1983. Motivating the client/employee system as a service production strategy. Academy of Management Review 8: 301–10. [Google Scholar] [CrossRef] [PubMed]
- Moon, Youngme, and Frances X. Frei. 2000. Exploding the self-service myth. Harvard Business Review 78: 26–27. [Google Scholar]
- Nowak, Martin A., and Karl Sigmund. 2005. Evolution of indirect reciprocity. Nature 437: 1291–98. [Google Scholar] [CrossRef] [PubMed]
- Oppenheimer, Daniel M., Tom Meyvis, and Nicolas Davidenko. 2009. Instructional manipulation checks: Detecting satisficing to increase statistical power. Journal of Experimental Social Psychology 45: 867–72. [Google Scholar] [CrossRef]
- Peer, Eyal, Joachim Vosgerau, and Alessandro Acquisti. 2014. Reputation as a sufficient condition for data quality on Amazon Mechanical Turk. Behavioral Research Methods 46: 1023–31. [Google Scholar] [CrossRef] [PubMed]
- Perugini, Marco, and Marcello Gallucci. 2001. Individual differences and social norms: The distinction between reciprocators and prosocials. European Journal of Personality 15: 19–35. [Google Scholar] [CrossRef]
- Rungtusanatham, M., Cynthia Wallin, and Stephanie Eckerd. 2011. The vignette in a scenario-based role-playing experiment. Journal of Supply Chain Management 47: 9–16. [Google Scholar] [CrossRef]
- Stanca, Luca. 2009. Measuring indirect reciprocity: Whose back do we scratch? Journal of Economic Psychology 30: 190–202. [Google Scholar] [CrossRef] [Green Version]
- Zhou, Rongrong, and Dilip Soman. 2003. Looking back: Exploring the psychology of queuing and the effect of the number of people behind. Journal of Consumer Research 29: 517–30. [Google Scholar] [CrossRef]
| 1 | To completely remove social pressure, it would make sense to have an image with no one behind the participant’s character. However, we had to have at least one person behind the participant’s character to test his or her reciprocal behavior to this next person (Hypothesis 1). |
| 2 | This may have led the participants to imagine that service staff is not immediately around to help them. |
Figure 1.
Hypotheses.

Figure 2.
Waiting page.


Table 1.
Perceived fairness.
| Waiting Time Condition (Min) | Sample Size | Average Fairness Scores | Standard Error | chi-Squared | p-Value |
|---|---|---|---|---|---|
| 3 | 74 | 4.66 | 1.24 | 59.57 | p < 0.01 |
| 6 | 71 | 3.83 | 0.79 | ||
| 9 | 61 | 2.73 | 1.41 |
Table 2.
Service time decisions.
| 3 Min | 6 Min | 9 Min | F Value of ANOVA | p-Value | |
|---|---|---|---|---|---|
| Pressure | 4.03 | 4.67 | 4.56 | 1.22 | 0.30 |
| No pressure | 3.93 | 4.51 | 5.56 | 7.24 | <0.01 |
| Total | 3.98 | 4.59 | 5.00 | 5.30 | <0.01 |
| t-test | −0.26 | −0.37 | 1.95 | - | - |
| p-value | 0.60 | 0.64 | 0.03 | - | - |
Table 3.
Results of regression analysis.
| Model 1 | Model 2 | |||||
|---|---|---|---|---|---|---|
| Coeff. | S.E | p-Value | Coeff. | S.E | p-Value | |
| Constant | 4.08 | 0.24 | <0.01 | 3.93 | 0.29 | <0.01 |
| 6 min | 0.60 | 0.30 | 0.05 | 0.58 | 0.41 | 0.16 |
| 9 min | 1.03 | 0.31 | <0.01 | 1.62 | 0.45 | <0.01 |
| Pressure | −0.21 | 0.25 | 0.41 | 0.09 | 0.41 | 0.82 |
| 6 min × Pressure | 0.06 | 0.59 | 0.92 | |||
| 9 min × Pressure | −1.09 | 0.61 | 0.08 | |||
Table 4.
Results of regression analysis of the supplementary experiment.
| Model 1 | Model 2 | |||||
|---|---|---|---|---|---|---|
| Coeff. | S.E | p-Value | Coeff. | S.E | p-Value | |
| Constant | 4.64 | 0.24 | <0.01 | 4.53 | 0.30 | 0.00 |
| 6 min | 1.16 | 0.29 | <0.01 | 1.35 | 0.42 | <0.01 |
| 9 min | 1.30 | 0.29 | <0.01 | 1.46 | 0.41 | <0.01 |
| Pressure | −0.48 | 0.24 | 0.04 | −0.25 | 0.42 | 0.55 |
| 6 min × Pressure | −0.36 | 0.59 | 0.54 | |||
| 9 min × Pressure | −0.32 | 0.59 | 0.58 | |||
© 2018 by the authors. Licensee MDPI, Basel, Switzerland. This article is an open access article distributed under the terms and conditions of the Creative Commons Attribution (CC BY) license (http://creativecommons.org/licenses/by/4.0/).
Share and Cite
MDPI and ACS Style
Kim, H.; Lee, Y.S.; Park, K.S. The Psychology of Queuing for Self-Service: Reciprocity and Social Pressure. Adm. Sci. 2018, 8, 75. https://doi.org/10.3390/admsci8040075
AMA Style
Kim H, Lee YS, Park KS. The Psychology of Queuing for Self-Service: Reciprocity and Social Pressure. Administrative Sciences. 2018; 8(4):75. https://doi.org/10.3390/admsci8040075
Chicago/Turabian StyleKim, Hanyeong, Yun Shin Lee, and Kun Soo Park. 2018. "The Psychology of Queuing for Self-Service: Reciprocity and Social Pressure" Administrative Sciences 8, no. 4: 75. https://doi.org/10.3390/admsci8040075
Note that from the first issue of 2016, this journal uses article numbers instead of page numbers. See further details here.