Carbon Dioxide Uptake by Cement-Based Materials: A Spanish Case Study


1
Spanish Institute of Cement and its Applications (IECA), C/José Abascal, 53, 28003 Madrid, Spain
2
CIMNE–MADRID (UPC), P General Martínez Campos, 41, 9, 28010 Madrid, Spain
3
Department of Geological and Mines Engineering, Mine and Energy Engineering School, Technical University of Madrid (UPM), C/Ríos Rosas, 21, 28003 Madrid, Spain
4
Oficemen, C/José Abascal, 53, 28003 Madrid, Spain
*
Author to whom correspondence should be addressed.
Appl. Sci. 2020, 10(1), 339; https://doi.org/10.3390/app10010339
Submission received: 12 December 2019
/
Revised: 26 December 2019
/
Accepted: 28 December 2019
/
Published: 2 January 2020
(This article belongs to the Special Issue Carbon Capture and Utilization)
Abstract
:Featured Application
IPCC’s Guidelines for National Greenhouse Gas Inventories do not take into account the net CO2 emissions due to the Portland cement clinker manufacturing; i.e., the amount emitted as a consequence of the calcination process of the raw material in the clinker production less the CO2 absorption occurred by the concrete carbonation. This article points out that it is clear that the net assessment should be taken into account in the future climatic models.
Abstract
The European parliament has declared a global “climate and environmental emergency” on 28 November 2019. Given that, climate change is a clear strategic issue all around the world. Then, greenhouse gas emissions are reported by each country to the United Nations Framework Convention on Climate Change (UNFCCC) every year. In addition, The Intergovernmental Panel on Climate Change (IPCC) in the “2006 IPCC Guidelines for National Greenhouse Gas Inventories” give the procedure to calculate and manage the national greenhouse gases (GHG) emissions. However, these guidelines do not provide any method to consider the net carbon dioxide emissions to the atmosphere (released in clinker fabrication minus those due to concrete carbonation) by the Portland cement clinker industry. This topic should be implemented in the climatic models of the next IPCC assessment report. This paper provides an easy procedure of estimating net CO2 emissions proposed in the “recarbonation project” (simplified method); that is to say, carbon dioxide uptake during the service-life stage is considered as the 20% of the CO2 released by the calcination (process emissions), whereas the end-of-life and secondary usage is only the 3% of the CO2 released by calcination. The outcome of this study reveals that 31,290.753 tons of carbon dioxide will be absorbed by the cement-based materials produced in Spain with the cements manufactured from 2005 to 2015.
1. Introduction
According to The Intergovernmental Panel on Climate Change (IPCC) [1,2], from 1750 until 2011, the CO2 emissions coming from the use of fossil fuels and cement production released an average of about 375 GtC year−1 (from 345 to 405). Between 2002 and 2011, the average emission of fossil fuels and cement production stood at 8.3 GtC year−1 (from 7.6 to 9.0), showing an annual growth of 3.2%, which is greater than what was recorded in the 1990s, which was 1%. In 2011 alone, the fossil fuel emissions amounted to 9.5 GtC year−1 (from 8.7 to 10.3) [2]. Figure 1 shows the anthropogenic world emissions of greenhouse gases (GHG) by economic sectors. It must be pointed out that the anthropogenic emissions of greenhouse gases (GHG) have almost doubled in the past 50 years (Figure 2). In that same period, CO2 emissions in the cement sector have increased fourfold.
The economic sectors that most affect the direct world emissions of greenhouse gases (GHG) are the electricity and heat production (25%), industry (21%), and transport (14%). All of them represent 60% of the global direct GHG emissions (Figure 1). In particular, the effect of the electricity, heat production, and transport (39%) could be reduced by means of technological improvements (better thermal insulations, usage of the hydrogen power, fuel cells, electrical engines, and so on). Therefore, a lower contribution of these economic sectors would be expected in the near future. With regard to the industrial sector, such reduction of emissions of greenhouse gases (GHG) is a sensitive matter.
On the other hand, indirect emissions of greenhouse gases (GHG) are mainly due to buildings (12%) and industry (11%). Considering together direct and indirect emissions of both economic sectors, the impact of buildings (18.4%) and industry (32%) became of great significance.
Figure 2 shows the evolution of the world emissions of greenhouse gases (GHG) from 1970 to 2010 by economic sectors. In the last decade (2000–2010), the increase in emissions attributed to industry (+45%) and energy (+36%) was higher than three quarters (+81%). These data suggest the need to implement technological measures to reduce the mentioned emissions.
In order to register the contribution of the European countries to the EU record of emissions, the Union’s registers guarantee exact accounting of all the emission rights allocated as a result of the European Union Emissions Trading System (EU ETS). The register keeps a record of the ownership of the emission rights that appear in the electronic accounts in the same way that a bank keeps a record of customers and their respective funds.
The European Union Transactions Log (EUTL) automatically checks, records, and authorizes all the operations between union account records. This guarantees that all the transfers comply with the EU ETS standards. The EUTL is the successor to the Community Independent Transaction Log (CITL), which performed the same function before the union register was introduced.
The data contained in the union records include the 31 countries that take part in the European Union Emissions Trading System (EU ETS), which is merely an online database that stores the accounts of holders of fixed installations. According to the data, the Portuguese industry subject to emission rights emitted 4.6 million tons of carbon dioxide in 2015 (total absolute gross CO2 emissions without biomass emissions), which is 31.25% less than in 2005 (6.7 million tons of carbon dioxide).
2. Effect of Emissions on Atmospheric CO2 and Global Temperature
Figure 3 shows the trends in the world average temperatures on the surface, land, and oceans combined between 1850 and 2012 [1]. It is evident that from 1950 up to now, there is an increase in the world average temperatures on the surface, land, and oceans.
The sea surface temperature is a climate change indicator that increased during the 20th century and continues to rise. From 1901 through 2015, the temperature rose at an average rate of 0.07 °C per decade. Sea surface temperature has been particularly higher during the last 30 years than at any other period since 1880. Apparently, sea surface temperature appears to have cooled between 1880 and 1910. Nevertheless, it increased particularly between 1910 and 1940 and from 1970 to the present. Finally, it should be considered that changes in sea surface temperature vary regionally. Given that, some few areas have experienced cooling, whereas most of the world’s oceans have reported temperature rise.
In addition, global land temperature is considered as a climate change indicator. In this respect, 2015 was the warmest year, and 2006–2015 the warmest decade reported worldwide since 1880 (Figure 3). In addition, the global average surface temperature has risen at an average rate of 0.08 °C per decade since 1901.
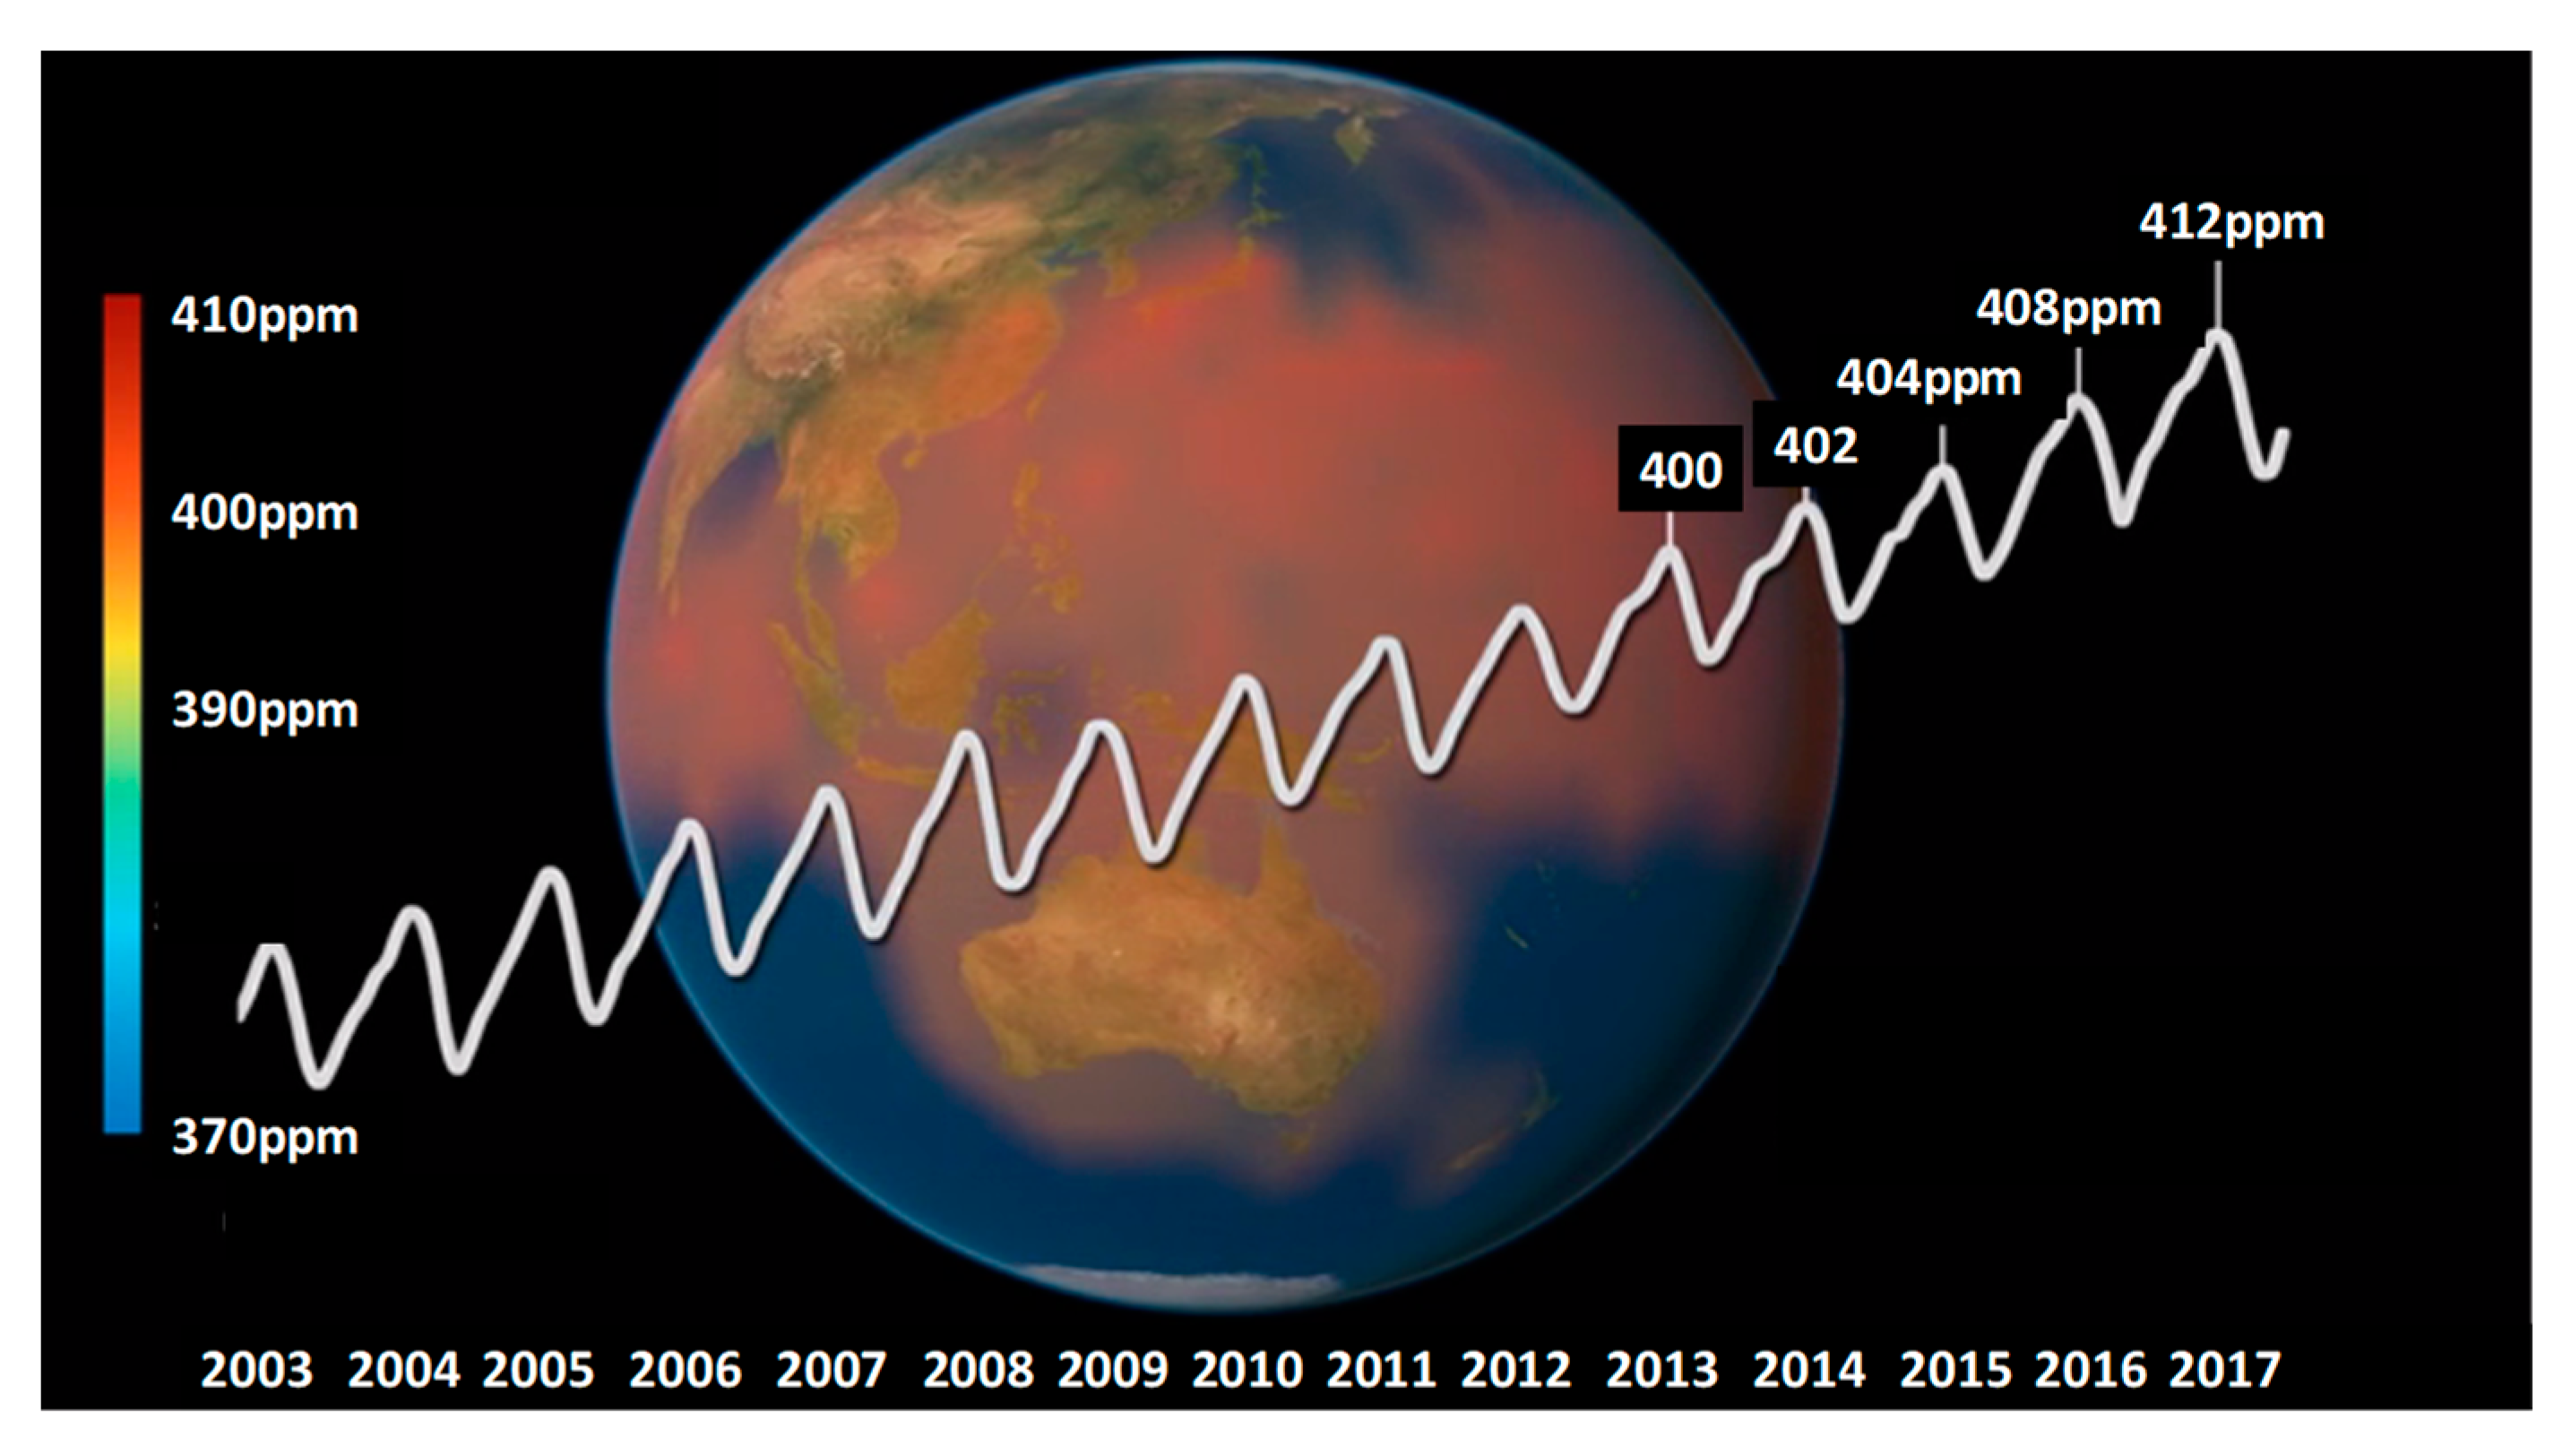
Carbon dioxide, CO2, is a gas that exists in the air in a proportion of 0.03–0.04% in volume. Figure 4 shows the way that this gas has evolved historically in the atmosphere ranging from 280 ppm in the preindustrial era to 400 ppm at the present time. Therefore, the rate at which this gas increases in the atmosphere is around 1–2 ppm/year. The data to obtain such conclusions come from ice core studies and recent air monitoring measurements. In addition, global atmospheric concentrations of methane, nitrous oxide, and other manufactured greenhouse gases have risen over the last years. Obviously, the current global atmospheric concentrations of carbon dioxide are soared to unprecedented levels compared with the last years.
It is well known that the carbon dioxide concentrations have increased significantly since the beginning of the industrial era. Carbon dioxide concentrations have risen from 280 ppm in the late 1700s to 401 ppm in 2015, as reported recently in some places. This huge increase (43%) is attributed mainly to human activities.
The most abundant greenhouse gas (GHG) in the atmosphere is the water vapor. However, the human activities have a small direct influence on the water vapor atmospheric concentrations. On the contrary, the human activities have a clear indirect influence through irrigation and deforestation.
3. Carbon Dioxide Emissions by the Cement Sector
Currently, cement production is considered as responsible for approximately 7.4% of the global carbon dioxide emission (2.9 Gtons in 2016). Thus, the cement industry will play a key role in reducing carbon dioxide emissions to minimize climate change. The cement industry has hugely reduced the carbon dioxide emissions per ton of cement from the last century (Figure 5) [4,5], but the cement production is growing worldwide due to the economic growth, notably in developing countries.
In 2016, the worldwide cement production was about 4.65 Gt (Figure 5) [4], where China produced 52% and the rest of Asia produced 28.5% of the world’s production. Europe (The European Cement Association (CEMBUREAU) members) only manufactures 5.3% of the world’s cement. Several CO2 management approaches have been used in the last years in order to lower the climatic change impact and according to the project developed by the World Business Council for Sustainable Development and the Cement Sustainability Initiative (WBCSD-CSI) named “Getting the Numbers Right” (GNR), The European Union (EU28) cement industry has significantly decreased the environmental impact [5]. Table 1 shows such sharp decline from 2005 to 2015.
Carbon dioxide emissions per ton of clinker are approximately about 825–890 kg CO2 (Figure 6) [5], when a modern clinker kiln technology is considered. The worldwide average is about 840 kg CO2. Nevertheless, the medium-term target on carbon dioxide emission levels should be lower than 400 kg per ton of cement. Emission levels of around 350–410 kg per ton of cement have been suggested [6]. The cement industry is working hard to achieve this target by increasing clinker substitution (production of blended cements), the use of alternative fuels and raw materials, and thermal energy efficiency measures. Based on the use of the same technologies of clinker fabrication, these measures will lead to lowering the global average carbon dioxide emissions from 630 kg CO2/t cement in 2015 to around 550 kg CO2/t cement in 2050, which is far away from the target threshold level of 400 kg per ton of cement. In particular, García-Gusano et al. [7] suggested that the Spanish cement industry is able to lower the carbon dioxide emissions between 2010 and 2050 without carbon capture and storage (CCS) by only 21%. Nevertheless, for this account, carbon dioxide uptake by the mortar and concrete should be taken into account. The use of low CO2-intensity cements combined with the consideration of the carbon dioxide uptake by mortars and concretes will allow the sector to meet 550 kg CO2/ton of cement target in 2050.
Figure 6 shows the gross carbon dioxide emissions for grey clinker from 2005 to 2015. The gross carbon dioxide emissions are the direct carbon dioxide emissions, excluding on-site electricity production, minus emissions from biomass fuel sources.
Figure 7 shows the CO2 emissions due to the process and the combustion per ton of cement in several countries from 1990 to 2003 [8]. The weighted average of the carbon dioxide emissions is only decreasing at a slow pace. On one hand, the European countries are proposing new cements including a higher amount of additions, but on the other hand, the USA, among other countries, continues using mainly OPC with a very high clinker/cement ratio. The effort made in the European countries is reflected in The European Prestandard prEN 197-1:2019 with the incorporation of new types of cements. For instance, Germany has reduced the clinker/cement ratio dramatically in the last years (green line in Figure 7). This country is reducing the CEM I production, while at the same time the CEM II production increases. Another good example is found in the Spanish data (light blue line in Figure 7). In the year 1996, the Spanish emissions were lower than 0.8 kg CO2 per ton of cement as a consequence of using siliceous fly ash, natural pozzolan, blast-furnace slag, and limestone as cement constituents. Currently, this parameter is about 0.7 kg CO2 per ton of cement. This trend is good and could be improved in the coming years.
Finally, Figure 8 provides information on the direct carbon dioxide emissions due to the cement production in the period from 1970 to 2050. In addition, the figure shows the prediction in carbon dioxide emissions in the coming decades with the corrected trend if actions on carbon capture were undertaken [9].
In the year 1970, 500 million tons of carbon dioxide emissions were reported by the cement industry. Carbon dioxide emissions have more than doubled during the period from 1970 to 2000. The cement industry has trebled its carbon dioxide emissions in the last 40 years (from 1970 to 2010). The prediction in carbon dioxide emissions in the coming decades will depend on the degree of implementation of carbon capture and storage (CCS) techniques in the cement sector.
Carbon capture and storage (CCS) is a technology that can capture carbon dioxide emissions produced from the calcination and the use of fossil fuels in the clinker kiln, preventing the carbon dioxide from entering the atmosphere. Furthermore, the use of carbon capture and storage techniques with renewable biomass is a type of carbon abatement technology. That is, it can be used to remove carbon dioxide from the atmosphere. In particular, capture technologies allow the separation of carbon dioxide from gases produced in the clinkerization process by pre-combustion capture, post-combustion capture, and/or oxyfuel combustion.
4. Carbon Dioxide Uptake by Concrete
Most of the carbon dioxide emissions from the Spanish Portland cement industry come from the calcination of limestone (60–64%) rather than from fuel combustion. On the other hand, part of these emissions is uptake by the mortar and concrete due to their carbonation during their exposition to the environment. The chemistry of carbonation has been reviewed in many papers [10,11,12]. In summary, carbonation is produced because carbon dioxide is a gas present in the atmosphere that penetrates throughout the capillary pore network of concretes and mortars, where it is dissolved in the pore solution and reacts with calcium ions [10] and other alkaline species [11,12] produced by the Portland cement paste. Calcium carbonate has a very low solubility; then, it precipitates. With regard to the pozzolanic constituents present in the cement as well as ground granulated blast-furnace slag, they decrease the amount of calcium hydroxide in the binder due to the lower content in clinker when they are used, but they increase the amount of C-S-H gel. In addition, they lower the Ca/Si ratio of the C-S-H gel [13]. Consequently, the amount of calcium hydroxide that is able to be carbonated and the composition of the C-S-H gel depend on the type and amount of the cement constituents (fly ash, natural pozzolana, ground granulated blast-furnace slag, and so on) [14]. Additionally, blast-furnace slag has some components that contribute to the carbon dioxide uptake by the Portland cement paste present in mortars and concretes [15]. Therefore, the carbonation increases in cement-based materials with ground granulated blast-furnace slag [16,17] in relation to their clinker content.
Some studies have been performed to determine the carbon dioxide uptake in order to ensure a better carbon dioxide emissions balance. For instance, a Swiss study estimated that about 9.4–10.1% of the calcination and fuel carbon dioxide emissions of the Portland cement utilized in 2010 [18] were uptake during the concrete structures’ service life. This means that about 6% of the carbon dioxide emissions coming from the calcination were uptake (considering that the ratio of the carbon dioxide emission from calcination and fuel is 60:40).
A worldwide study has estimated a carbon dioxide uptake of 43% of the CO2 emissions from the production of Portland cement by concretes and mortars from 1930 to 2013 [19]. This study considers the service life period, end-of-life stage, and secondary use after demolition. In addition, it assumes a degree of carbonation of about 80% in the carbonated area. Other papers suggested a full carbon dioxide uptake (100% uptake) of the one emitted by calcination [20,21].
However, more conservative studies proposed lower carbon dioxide uptake levels [22,23,24]. A previous Spanish project reported much lower carbon dioxide uptake values (3–4%) as a consequence of the lower surface/volume ratio considered (S/V = 3) in the concrete elements for a degree of carbonation measured at one year of exposure [25]. These results were updated to 10.8–11.2% of the carbon dioxide produced annually during the calcination process, considering the degree of carbonation measured after four years of exposure [15].
The present paper covers some background of carbon dioxide uptake and also includes the results of the simplest method proposed by the “recarbonation project” sponsored by The Portland Cement Association (PCA), The European Cement Association (CEMBUREAU), The Cement Sustainability Initiative (CSI), and Cementa in 2018 [26]. This methodology is applied to the cement-based materials used in Spain first during their service life, and secondly, after the end-of-life and secondary usage stages.
5. Methodology
The method followed to calculate the carbon dioxide uptake by the Spanish cement industry is the one proposed by the “recarbonation project” sponsored by The Portland Cement Association (PCA), The European Cement Association (CEMBUREAU), The Cement Sustainability Initiative (CSI), and Cementa in 2018 [26]. This procedure provides a simplified calculation for estimating the annual uptake of CO2 in concrete during its use stage on a national basis. In this paper, the annual uptake in the end-of-life stage and secondary use is also considered. The annual carbon dioxide uptake (ACDU) values are related to the reported calcination CO2 emissions. Therefore, yearly carbon dioxide uptake in the use stage has been calculated by applying Equation (1) and during the end-of-life and secondary use by applying Equation (2). Based on the study performed by the IVL [26], we have considered the following α and β parameters: α = 0.20 and β = 0.03.
ACDU (service life) = α × IPCC reported calcination emissions
ACDU (end-of-life) = β × IPCC reported calcination emissions
Such a method has been applied to the cements produced in Spain from 2005 to 2015, independently of their final use.
6. Results and Discussion
6.1. Maximum Amount of Carbon Dioxide that Can Be Absorbed
The maximum amount of carbon dioxide that can be absorbed according to EN [27] is calculated by applying Equation (3), and the result is shown in Table 2.
where CO2,max: maximum amount of carbon dioxide that can be absorbed, kg CO2/kg cement; CaOreactive: kg CaO/kg binder × 100, and this value is taken as 65% (average value of the Spanish clinkers); binder: amount of cement (kg); MCO2: 44.0 g/mol; MCaO: 56.1 g/mol.
CO2,max = (CaOreactive/100) × binder × (MCO2/MCaO)
However, it does not consider the possible carbonation of other Portland cement components [11,12] such as the alkaline compounds forming alkaline carbonates Equation (4).
where CaO: kg CaO/kg Portland cement × 100; 0.7 × (SO3)CaSO4: kg CaO released from CaSO4/kg Portland cement × 100; Na2O: kg Na2O/kg Portland cement × 100; K2O: kg K2O/kg Portland cement × 100; MCO2: 44 g/mol; MCaO: 56 g/mol; MNa2O: 62 g/mol; and MK2O: 94 g/mol.
CO2,max = (MCO2/MCaO) × (CaO − 0.7 × (SO3)CaSO4) + (MCO2/MNa2O) × Na2O + (MCO2/MK2O) × K2O
If we apply Equation (3) to a CEM I with 95% clinker that contains 65% CaO reagent, it holds that the maximum amount of carbon dioxide that can be absorbed, according to EN, is equal to CO2,max = (65/100) × 0.95 × (44/56) = 0.49 kg CO2/kg CEM I. This value only applies to cement with 95% clinker (CEM I) [28]. As far as other cements are concerned, this value will drop in proportion to the clinker content. Table 2 has been prepared in order to be able to rapidly display the maximum amount of carbon dioxide that the different can EN 197-1 cements could be absorb in theoretical and unreal circumstances.
In fact, to calculate the maximum amount of carbon dioxide that can be absorbed for a cement, it could be considered that 100% of the Ca (OH)2 of the portlandite (CH) and of the aluminates (AFt, AFm) is carbonated, but only 50% of the C-S-H gel might be carbonated. Considering that in a cement paste with 65.3% of CaO, 31.4% of such CaO is bound to C-S-H gel and the rest is bound to portlandite, Ca(OH)2, AFm and AFt phases, it would be necessary to take into account that only a maximum of 76% of the CaO in the Portland cement clinker could be carbonated Equation (5).
where C: clinker content in the cement, kg clinker/kg Portland cement × 100; CaO: CaO content in the Portland cement clinker (~0.65); MCO2: 44 g/mol; and MCaO: 56 g/mol.
CaO (carbonated) = 100 × (33.9/65.3) + 50 × (31.4/65.3) = 76%
Fraction of the cement able to be carbonated = 0.76 × C × CaO × (MCO2/MCaO)
6.2. Carbon Dioxide Uptake by the Spanish Cements
The amount of carbon dioxide that can be absorbed during the service life (Figure 9) of a product manufactured with cement is calculated with a fixed conservative value using the simplified methodology. This value could either be 15% or 20% [27] of the CO2 emissions owing to the process of calcination that is a long way from the maximum theoretical value of carbon dioxide that can be absorbed (around 490 kg of CO2 per tonne in the case of a cement without addition, CEM I).
The Spanish domestic data for CO2 emissions have been used to directly apply the simplified methodology to estimate CO2 absorption (Figure 10). Such emissions have fallen from 2005 to 2015 as a consequence of the drop in clinker production (Figure 11).
Figure 12 evidences the decrease of the carbon dioxide combustion emissions intensity from 336 kgCO2/tclinker in 2005 to 308 kgCO2/tclinker in 2015. In addition, the carbon dioxide process emissions intensity from 529 kgCO2/tclinker in 2005 to 522 kgCO2/tclinker in 2015.
The taxonomy report [29] proposes a limit value for clinker production of 766 kgCO2/tclinker. This value is lower than the reported for the Spanish clinkers shown in Figure 12. Such report also suggests threshold values for other parameters (clinker/cement ratio < 0.65; kgCO2/tcement < 498, and kWh/tcement < 85). This proposal was presented with very strict limits on CO2 emissions and energy demand in cement production. Therefore, it will be very difficult to meet in many cases, particularly in CEM I production [28].
All in all, if a factor of 0.20 is applied to the CO2 calcination emissions Equation (1) (which is what is proposed in the IVL simplified methodology [26]), given that, CO2 absorption in Spanish cement manufacturing plants attributed to the service life period has been estimated at 27,358.481 tons of CO2 in the period from 2005 to 2015 (Figure 13). In a similar way, the CO2 absorption estimation during the end-of-life and secondary use was calculated by using Equation (2), and the results are also given in Figure 13.
The CO2 total amount for the end-of-life and secondary use between 2005 and 2015 is estimated at 3,932,272 tons of CO2. Summing up, it can be said that the total amount of carbon dioxide uptake of the Spanish cement industry from 2005 to 2015 is 31,290,753 tons of CO2 (Figure 13).
Figure 13 shows the carbon dioxide uptake by the cement-based materials produced with the Spanish cement manufactured between 2005 and 2015 considering the IVL simplified methodology [26]. (Only the CO2 emitted as a result of the decarbonation process is taken into account, i.e., emissions due to fuel are not considered).
Climate models have been improved since the Fourth Assessment Report of the Intergovernmental Panel on Climate Change (AR4). The ability of climate models to simulate temperature increase has enhanced in many significant aspects, though not all. Given that, the climate models evaluated by Working Group I to the Fifth Assessment Report of the Intergovernmental Panel on Climate Change (AR5) do not take into account the net carbon dioxide emissions of the cement industry [30]. Therefore, all the models can be improved by adding this parameter.
6.3. Carbon Dioxide Indicators for Concretes
Figure 14 collects the results of the kgcement/(m3 × MPa) indicator for 40 commercial concretes made in Spain [31]. This indicator, among others, is proposed to measure the environmental impact of the construction materials [29]. The results range from 5 to 14 kgcement/(m3 × MPa). Most of the CEM I and half of the CEM II/A-V cements [28] range between 5 and 8 kgcement/(m3 × MPa). As consequence, the higher the 28-day compressive strength, the lower the carbon dioxide indicator defined as kgcement/(m3 × MPa). In addition, high-strength and high-performance concretes led to the design of slender concrete elements than using normal concrete. Given that, a lower amount of concrete is necessary. Consequently, it can be underlined that the global environmental impact of using this type of concrete is lower.
Blended cements, which are recommended for aggressive environments because they are able to provide a longer service life of the concrete structures, exhibited higher carbon dioxide indicator values. Therefore, we share the view that the scientist should better suggest more adequate carbon dioxide indicators in which the concrete durability would be seen as a capital aspect. In addition, new cement types [32] and concrete designs [33] are developed in order to progress in accordance with the climate change actions [34].
Finally, it is believed that the net assessment with regard to the anthropogenic CO2 emissions of the cement sector should be taken into account in future climatic models due to the great significance of the clinker production. For instance, in 2016, the estimated contribution of the cement industry to the anthropogenic CO2 emissions was 7.4% (2.9 Gtons CO2) of world carbon dioxide emissions (39 Gtons CO2). However, if we take into account the CO2 uptake by applying the simplified methodology, such contribution is now estimated to be 6.3%, as shown in Equation (7).
where total CO2 emissions in 2016: 2.9 Gtons CO2; and process CO2 emissions in 2016: 0.64 × 2.9 Gtons CO2 = 1.86 Gtons CO2.
Net CO2 emissions = (Total CO2 emissions) − (0.23 × Process CO2 emissions)
In this case, it is assumed that 64% of the total carbon dioxide emissions are due to the calcination process. Therefore, the net CO2 emissions in 2016 are 2.47 Gtons CO2.
7. Conclusions
The conclusions reached with this study are as follows:
- Carbon dioxide absorption attributed to the Spanish cements produced from 2005 to 2015 was estimated at 31,290,753 tons when using the simplified methodology, i.e., applying a factor of 0.20 during the service life and 0.03 for the end-of-life and secondary use.
- The net carbon dioxide emissions related to the Portland cement clinker industry (CO2 released in clinker fabrication minus CO2 uptake by concrete carbonation) should be implemented in the climatic models of the next IPCC assessment report.
- This simplified model developed by experts in the mortar and concrete carbonation field should be validated by each country. Thus, it will allow the national climate change offices to implement these methodologies in the national greenhouse gas inventories.
Author Contributions
Conceptualization, C.A. and M.Á.S.; methodology, C.A. and M.Á.S.; software, M.Á.S.; formal analysis, M.Á.S.; investigation, C.A. and M.Á.S.; resources, A.Z.; data curation, M.Á.S.; writing—original draft preparation, M.Á.S.; writing—review and editing, A.Z., P.M., C.A., and M.Á.S.; visualization, A.Z. and P.M., supervision, P.M.; project administration, P.M.; funding acquisition, P.M. All authors have read and agreed to the published version of the manuscript.
Funding
This research was funded by Oficemen.
Acknowledgments
The authors want to thank Commission C1 “Climatic change” of Oficemen for the support and recommendations provided during the realization of this study. Authors also want to thank the Intergovernmental Panel on Climate Change permission to publish Figure 3 (Figure SPM.1 (a) from IPCC, 2013: Summary for Policymakers. In: Climate Change 2013: The Physical Science Basis. Contribution of Working Group I to the Fifth Assessment Report of the Intergovernmental Panel on Climate Change).
Conflicts of Interest
The authors declare no conflict of interest.
References
- The Intergovernmental Panel on Climate Change. IPCC 2013: Summary for Policymakers. In Climate change 2013: The Physical Science Basis. Contribution of Working Group I to the Fifth Assessment Report of the Intergovernmental Panel on Climate Change, 1st ed.; Stocker, T.F., Qin, D., Plattner, G.-K., Tignor, M.M.B., Allen, S.K., Boschung, J., Nauels, A., Xia, Y., Bex, V., Midgley, P.M., Eds.; Cambridge University Press: New York, NY, USA, 2013; pp. 1–203. [Google Scholar]
- The Intergovernmental Panel on Climate Change (IPCC). Climate Change 2014: Mitigation of Climate Change. Contribution of Working Group III to the Fifth Assessment Report of the Intergovernmental Panel on Climate Change, 1st ed.; Edenhofer, O.R., Pichs-Madruga, Y., Sokona, E., Farahani, S., Kadner, K., Seyboth, A., Adler, I., Baum, S., Brunner, P., Eickemeier, B., et al., Eds.; Cambridge University Press: New York, NY, USA, 2014; pp. 1–1523. [Google Scholar]
- The European Space Agency. Available online: http://www.esa.int/Applications/Observing_the_Earth/Methane_and_carbon_dioxide_on_the_rise (accessed on 9 December 2019).
- The European Cement Association (CEMBUREAU). Activity Report, 1st ed.; CEMBUREAU: Brussels, Belgium, 2017; pp. 1–42. Available online: https://cembureau.eu/media/1716/activity-report-2017.pdf (accessed on 16 October 2019).
- World Business Council for Sustainable Development (WBCSD); Cement Sustainability Initiative’s (CSI). Cement Industry Energy and CO2 Performance. Getting the Numbers Right (GNR) Project, 1st ed.; World Business Council for Sustainable Development: Geneva, Switzerland, 2018; Available online: http://www.wbcsdcement.org/index.php/key-issues/climate-protection/gnr-database (accessed on 10 September 2019).
- Elzinga, D.; Bennett, S.; Best, D.; Burnard, K.; Cazzola, P.; D’Ambrosio, D.; Dulac, J.; Fernandez Pales, A.; Hood, C.; LaFrance, M.; et al. Energy Technology Perspectives 2015: Mobilising Innovation to Accelerate Climate Action, 1st ed.; International Energy Agency (IEA) Publications: Paris, France, 2015; pp. 1–412. [Google Scholar]
- García-Gusano, D.; Herrera, I.; Garraín, D.; Lechón, Y.; Cabal, H. Life Cycle Assessment of the Spanish Cement Industry: Implementation of Environmental-Friendly Solutions. Clean Technol. Environ. Policy 2014, 17, 59–73. [Google Scholar] [CrossRef]
- Hoenig, V.; Hoppe, H.; Emberger, B. Carbon Capture Technology—Options and Potentials for the Cement Industry, 1st ed.; European Cement Research Academy (ECRA): Düsseldorf, Germany, 2007; pp. 1–96. [Google Scholar]
- International Energy Agency (IEA). Energy Technology Perspectives. Scenarios & Strategies to 2050, 1st ed.; IEA/OECD: Paris, France, 2006. [Google Scholar]
- Morandeau, A.; Thiery, M.; Dangla, P. Investigation of the carbonation mechanism of CH and CSH in terms of kinetics, microstructure changes and moisture properties. Cem. Concr. Res. 2014, 56, 153–170. [Google Scholar] [CrossRef] [Green Version]
- Sevelsted, T.F.; Skibsted, J. Carbonation of C–S–H and C–A–S–H samples studied by 13C, 27Al and 29Si MAS NMR spectroscopy. Cem. Concr. Res. 2015, 71, 56–65. [Google Scholar] [CrossRef]
- Zhou, Q.; Glasser, F. Kinetics and mechanism of the carbonation of ettringite. Adv. Cem. Res. 2000, 12, 131–136. [Google Scholar] [CrossRef]
- Taylor, H.F.W. Cement Chemistry, 2nd ed.; Thomas Telford: London, UK, 1997; pp. 1–459. [Google Scholar]
- Goñi, S.; Gaztañaga, M.; Guerrero, A. Role of cement type on carbonation attack. J. Mater. Res. 2002, 17, 1834–1842. [Google Scholar] [CrossRef]
- Andrade, C.; Sanjuán, M.A. Updating Carbon Storage Capacity of Spanish Cements. Sustainability 2018, 10, 4806. [Google Scholar] [CrossRef] [Green Version]
- Sanjuán, M.A.; Estévez, E.; Argiz, C.; del Barrio, D. Effect of curing time on granulated blast-furnace slag cement mortars carbonation. Cem. Concr. Compos. 2018, 90, 257–265. [Google Scholar] [CrossRef]
- Sanjuán, M.A.; Piñeiro, A.; Rodríguez, O. Ground granulated blast furnace slag efficiency coefficient (k value) in concrete. Applications and limits. Mater. Constr. 2011, 61, 303–313. [Google Scholar] [CrossRef] [Green Version]
- Nygaard, P.V.; Leemann, A. Carbon Dioxide Uptake of Reinforced Concrete Structures Due to Carbonation. Abteilung Beton/Bauchemie. Cemsuisse projekt 201106, 1st ed.; EMPA: Dübendorf, Switzertland, 2012; pp. 1–65. [Google Scholar]
- Xi, F.; Davis, S.J.; Ciais, P.; Crawford-Brown, D.; Guan, D.; Pade, C.; Shi, T.; Syddall, M.; Lv, J.; Ji, L.; et al. Substantial global carbon uptake by cement carbonation. Nat. Geosci. 2016, 9, 880–883. [Google Scholar] [CrossRef] [Green Version]
- Steinour, H.H. Some effects of carbon dioxide on mortars and concrete discussion. J. Am. Concr. Inst. 1959, 30, 905–907. [Google Scholar] [CrossRef] [Green Version]
- Pade, C.; Guimaraes, M. The CO2 uptake of concrete in a 100 year perspective. Cem. Concr. Res. 2007, 37, 1348–1356. [Google Scholar] [CrossRef]
- Gajda, J.; Miller, F.M. Concrete as a Sink for Atmospheric Carbon Dioxide: A Literature Review and Estimation of CO2 Absorption by Portland Cement Concrete. R&D Serial N°2255, 1st ed.; PCA: Chicago, IL, USA, 2000. [Google Scholar]
- Talukdar, S.; Banthia, N.; Grace, J.; Cohen, S. Carbonation in concrete infrastructure in the context of global climate change: Part 2—Canadian urban simulations. Cem. Concr. Compos. 2012, 34, 931–935. [Google Scholar] [CrossRef]
- Andersson, R.; Fridh, K.; Stripple, H.; Häglund, M. Calculating CO2 Uptake for Existing Concrete Structures during and after Service Life. Environ. Sci. Technol. 2013, 47, 11625–11633. [Google Scholar] [CrossRef] [PubMed]
- Galán, I.; Andrade, C.; Mora, P.; Sanjuán, M.A. Sequestration of CO2 by Concrete Carbonation. Environ. Sci. Technol. 2010, 44, 3181–3186. [Google Scholar] [CrossRef] [PubMed]
- Stripple, H.; Ljungkrantz, C.; Gustafsson, T. CO2 Uptake in Cement-Containing Products. Background and Calculation Models for IPCC Implementation, 1st ed.; Report number: B 2309; IVL Swedish Environmental Research Institute: Stockholm, Sweden, 2018; pp. 20–30. Available online: https://cembureau.eu/media/1753/ivl-report-co2-uptake-in-cement-containing-products-isbn-number-b2309.pdf (accessed on 16 October 2019).
- CEN. Sustainability of Construction Works—Environmental Product Declarations—Product Category Rules for Concrete and Concrete Elements. Annex BB (Informative). CO2 Uptake by Carbonation—Guidance on Calculation; European Committee for Standardization (CEN): Brussels, Belgium, 2016. [Google Scholar]
- Sanjuán, M.A.; Argiz, C. The new European standard on common cements specifications, EN-197-1:2011. Mater. Constr. 2012, 62, 425–430. [Google Scholar] [CrossRef] [Green Version]
- EU Technical Expert Group on Sustainable Finance. Financing a Sustainable European Economy. Taxonomy Technical Report, 1st ed.; European Commission: Brussels, Belgium, 2019; pp. 191–196. Available online: https://ec.europa.eu/info/sites/info/files/business_economy_euro/banking_and_finance/documents/190618-sustainable-finance-teg-report-taxonomy_en.pdf (accessed on 16 October 2019).
- Flato, G.; Marotzke, J.; Abiodun, B.; Braconnot, P.; Chou, S.C.; Collins, W.; Cox, P.; Driouech, F.; Emori, S.; Eyring, V.; et al. Evaluation of Climate Models. In Climate Change 2013: The Physical Science Basis. Contribution of Working Group I to the Fifth Assessment Report of the Intergovernmental Panel on Climate Change, 1st ed.; Stocker, T.F., Qin, D., Plattner, G.-K., Tignor, M., Allen, S.K., Boschung, J., Nauels, A., Xia, Y., Bex, V., Midgley, P.M., Eds.; Cambridge University Press: Cambridge, UK, 2013; pp. 741–866. [Google Scholar]
- Andrade, C.; Sanjuán, M.A.; Rebolledo, N. Reliability calibration by carbonation exposure class deemed-to-satisfy prescriptions of Spanish concretes. Concreto Construções 2018, 91, 97–102. Available online: http://ibracon.org.br/Site_revista/Concreto_Construcoes/ebook/edicao91/files/assets/basic-html/index.html#102 (accessed on 16 October 2019).
- Jeon, E.-D.; Lee, K.-U.; Lee, C.-K. Development of a New Clean Development Mechanism Methodology for the Quantification of Greenhouse Gas in Calcium Sulfoaluminate Cement. Sustainability 2019, 11, 1482. [Google Scholar] [CrossRef] [Green Version]
- Wang, X.-Y. Impact of Climate Change on the Optimization of Mixture Design of Low-CO2 Concrete Containing Fly Ash and Slag. Sustainability 2019, 11, 3394. [Google Scholar] [CrossRef] [Green Version]
- Pearce, T.D.; Rodríguez, E.H.; Fawcett, D.; Ford, J.D. How Is Australia Adapting to Climate Change Based on a Systematic Review? Sustainability 2018, 10, 3280. [Google Scholar] [CrossRef] [Green Version]
Figure 1.
World emissions of greenhouse-effect gases (GHG) by economic sectors [2]. Definition of AFOLU: Agriculture, Forestry and Other Land Use.
Figure 1.
World emissions of greenhouse-effect gases (GHG) by economic sectors [2]. Definition of AFOLU: Agriculture, Forestry and Other Land Use.

Figure 2.
World emissions of greenhouse gases (GHG) by sectors, in gigatons of CO2 equivalent annually [2].
Figure 2.
World emissions of greenhouse gases (GHG) by sectors, in gigatons of CO2 equivalent annually [2].

Figure 3.
Irregularity observed in the world average temperatures on the surface, land and oceans combined between 1850 and 2012 (Reproduced with permission from The Intergovernmental Panel on Climate Change, IPCC, 2013: Summary for Policymakers. In: Climate Change 2013: The Physical Science Basis. Contribution of Working Group I to the Fifth Assessment Report of the Intergovernmental Panel on Climate Change; Figure SPM.1 (a) Observed global mean combined land and ocean surface temperature anomalies, from 1850 to 2012 from three data sets. annual mean values. published by Cambridge University Press [1]).

Figure 4.
World carbon cycle: concentrations of carbon dioxide in the atmosphere [3].
Figure 4.
World carbon cycle: concentrations of carbon dioxide in the atmosphere [3].

Figure 5.
World cement production in 2016 by region and main countries (4.65 Gt) [4].
Figure 5.
World cement production in 2016 by region and main countries (4.65 Gt) [4].
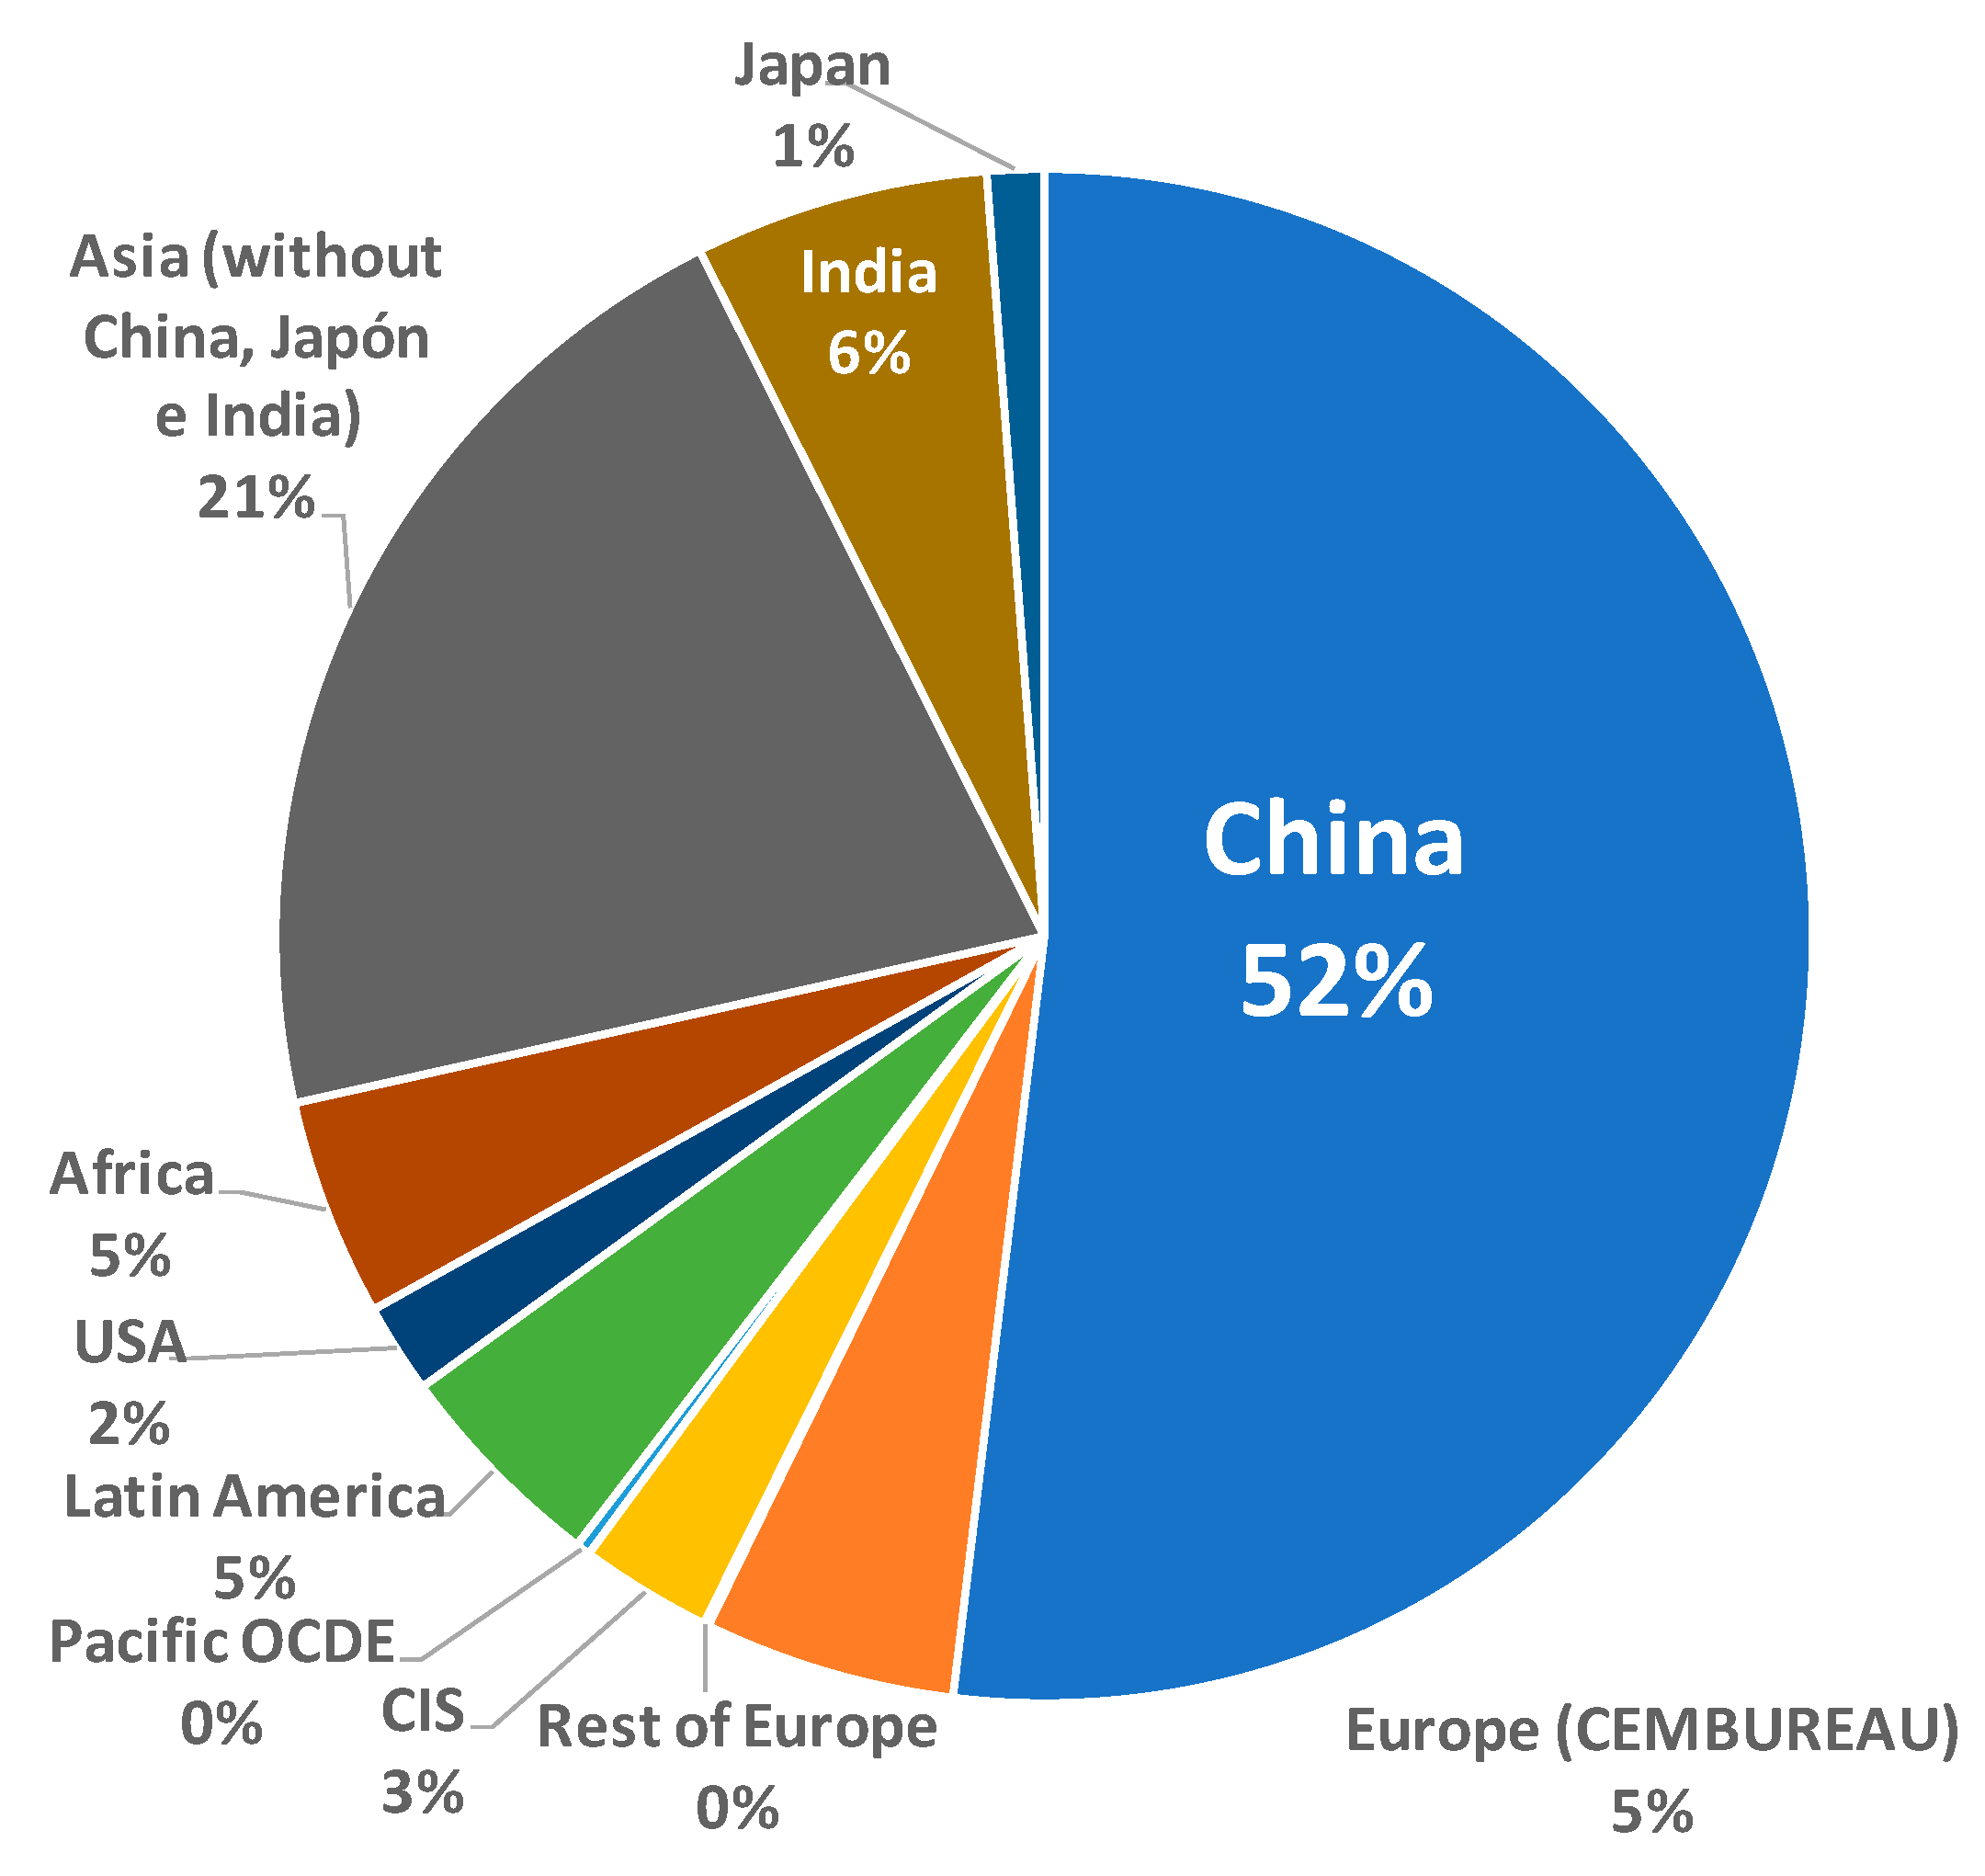
Figure 6.
Gross carbon dioxide emissions for grey clinker from 2005 to 2015 [5].
Figure 6.
Gross carbon dioxide emissions for grey clinker from 2005 to 2015 [5].

Figure 7.
CO2 emissions due to the calcination process and the combustion per ton of cement in some countries [8].
Figure 7.
CO2 emissions due to the calcination process and the combustion per ton of cement in some countries [8].

Figure 8.
Direct CO2 emissions due to cement production (1970–2050) [9].
Figure 8.
Direct CO2 emissions due to cement production (1970–2050) [9].
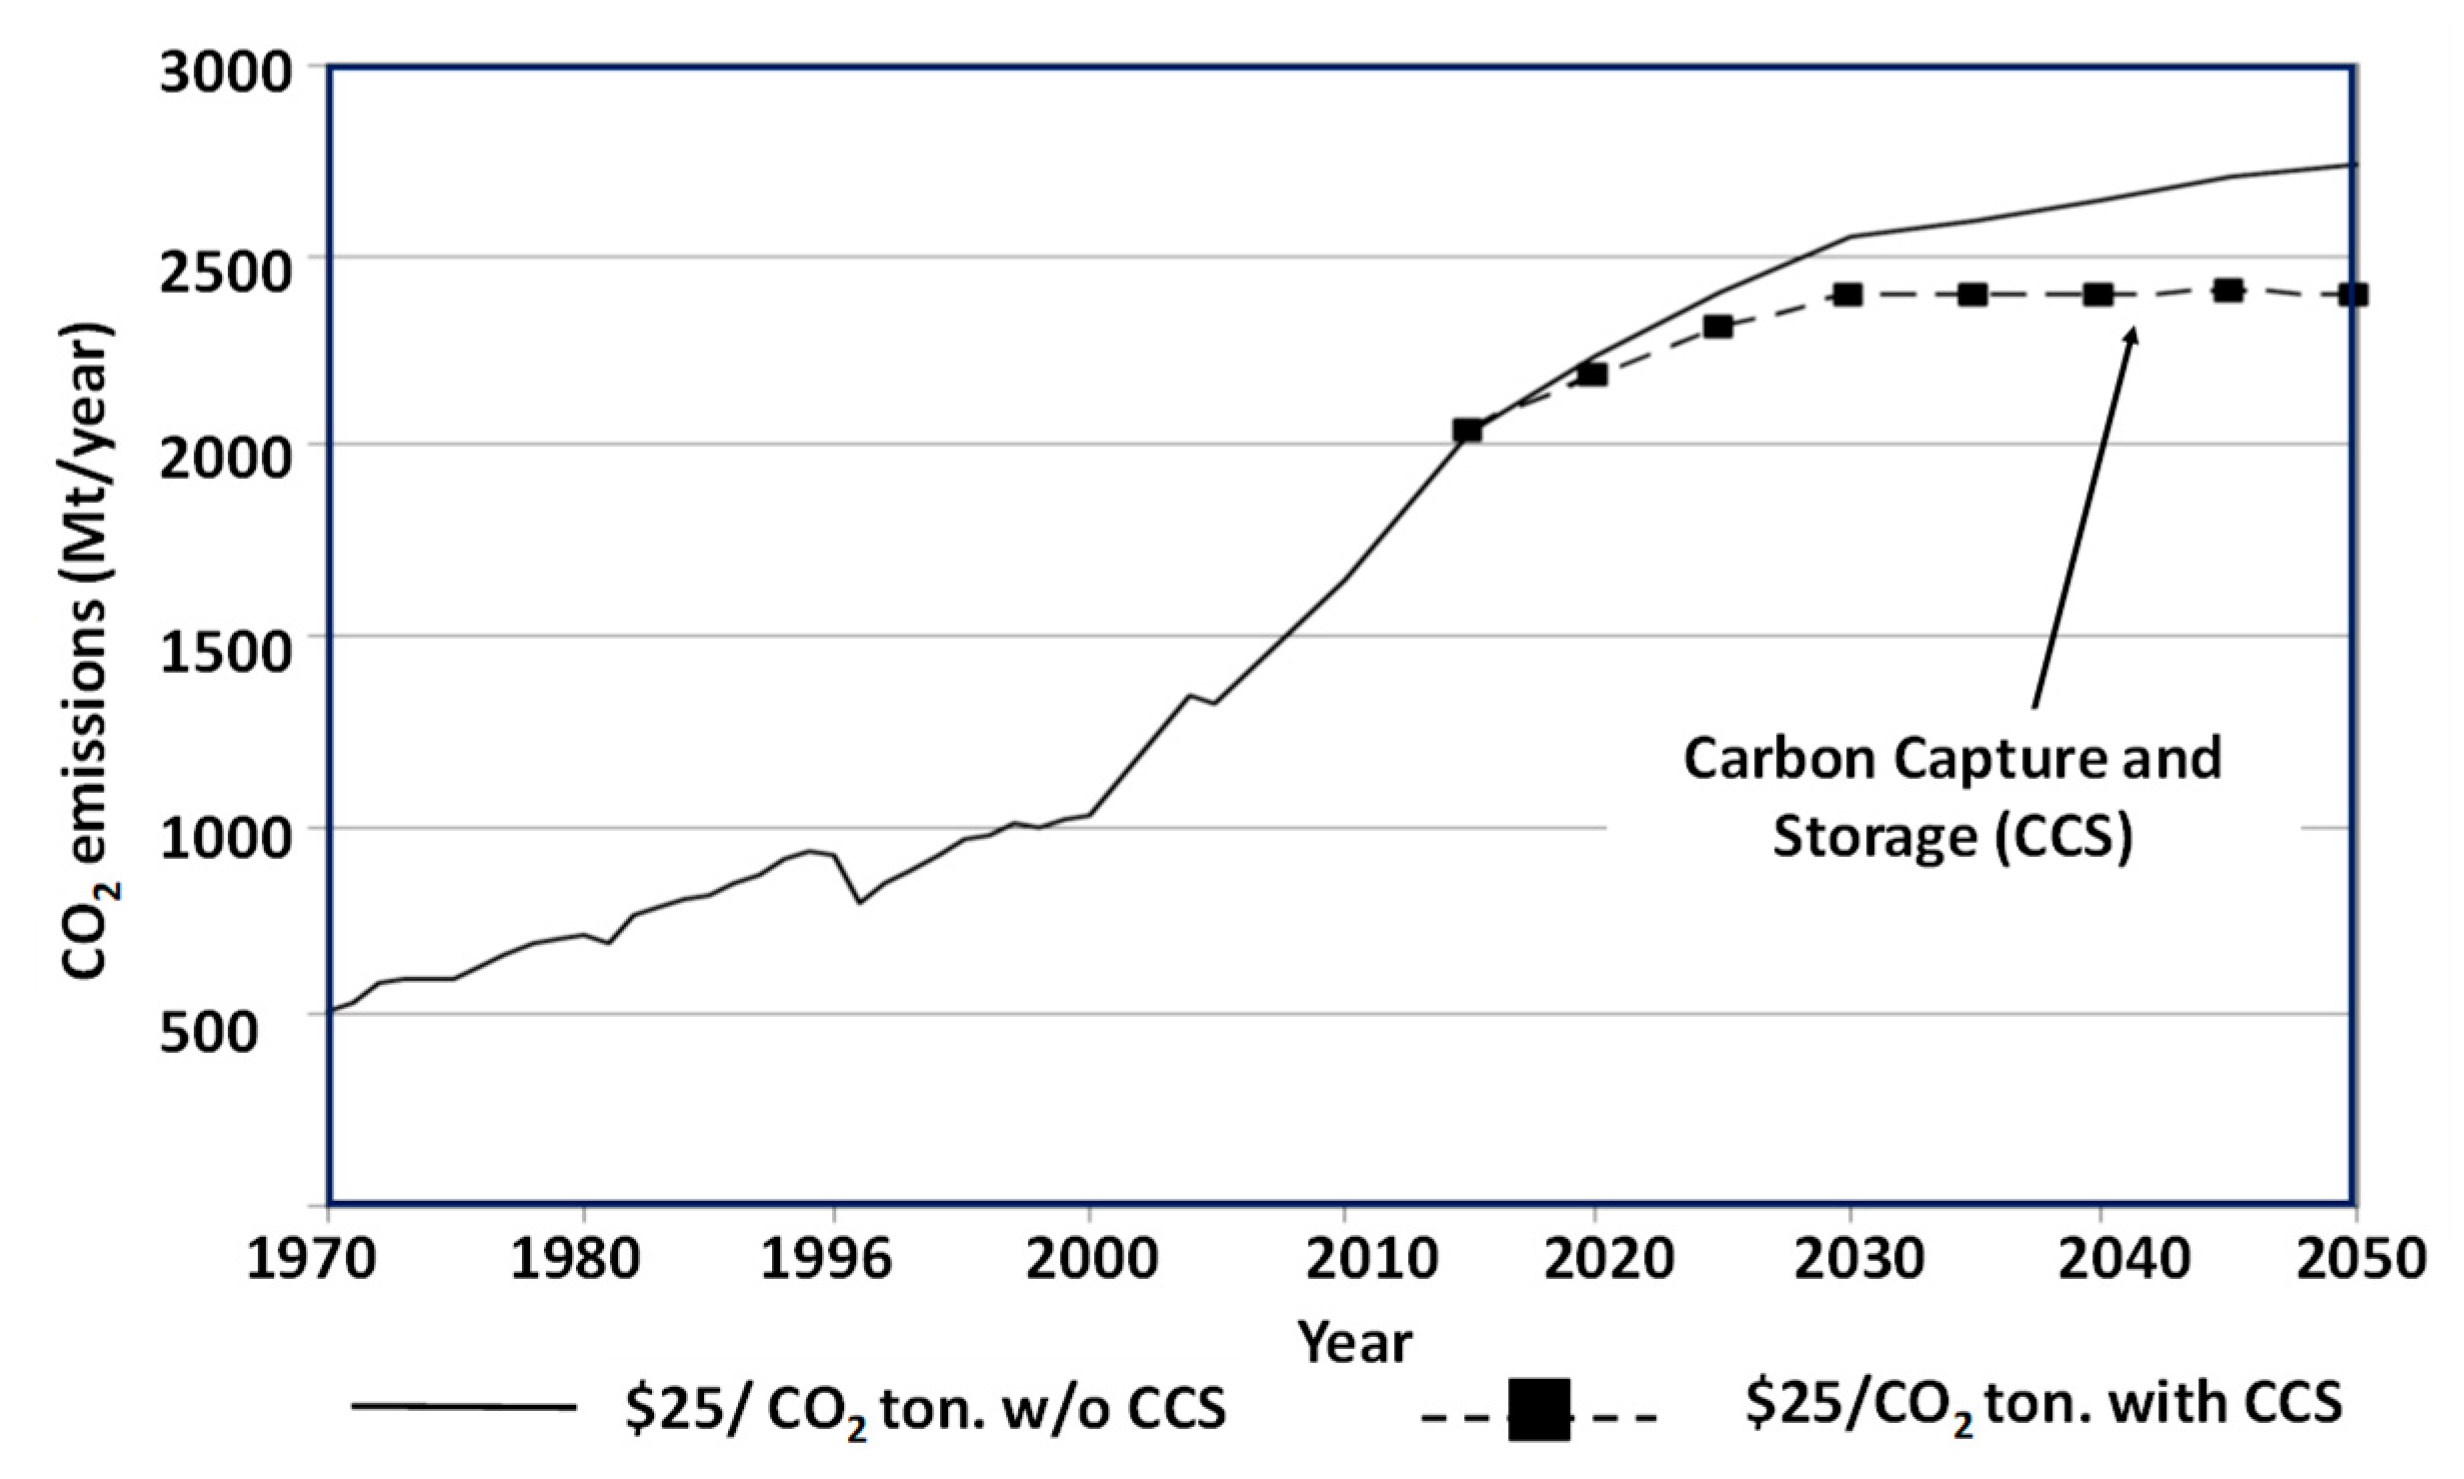
Figure 9.
Circular economy in the cement production sector.

Figure 10.
Absolute CO2 emissions (tons) evolution from 2005 to 2015 for the Spanish clinker production: process emissions (bars in blue); fuel emissions (bars in orange).
Figure 10.
Absolute CO2 emissions (tons) evolution from 2005 to 2015 for the Spanish clinker production: process emissions (bars in blue); fuel emissions (bars in orange).

Figure 11.
Clinker production (tons): grey clinker (bars in blue); white clinker (bars in orange).

Figure 12.
CO2 global emissions intensity (tCO2/tclinker). Evolution from 2005 to 2015 of the Spanish clinker production.
Figure 12.
CO2 global emissions intensity (tCO2/tclinker). Evolution from 2005 to 2015 of the Spanish clinker production.

Figure 13.
Carbon dioxide uptake by the cement-based materials produced with the Spanish cement manufactured between 2005 and 2015 considering the IVL simplified methodology [26].
Figure 13.
Carbon dioxide uptake by the cement-based materials produced with the Spanish cement manufactured between 2005 and 2015 considering the IVL simplified methodology [26].

Figure 14.
Carbon dioxide indicator, kgcement/(m3 × MPa), for 40 Spanish commercial concretes.


Table 1.
Objectives to decrease the carbon dioxide emissions in the European cement industry [5].
Table 1.
Objectives to decrease the carbon dioxide emissions in the European cement industry [5].
| Carbon Dioxide Emissions Reduction (Per Ton of Clinker or Cementitious) | Grey Clinker | Cementitious |
|---|---|---|
| Gross carbon dioxide emissions | −9% | Data −13% |
| Net carbon dioxide emissions | −17% | −21% |
Table 2.
Maximum amount of carbon dioxide, CO2 max, that the different cements (EN 197-1:2011) can absorb.
Table 2.
Maximum amount of carbon dioxide, CO2 max, that the different cements (EN 197-1:2011) can absorb.
| Main Types | Type Name | Type Notation | Clínker, K | Minor Additional Constituents | Factor (Kcement/KCEM I) | Factor (Kcement/KCEM I) | CO2,max, |
|---|---|---|---|---|---|---|---|
| kg CO2/tcement | |||||||
| CEM I | Portland cement | CEM I | 95–100 | 0–5 | 95/95 = 1 | 1 | 490 |
| CEM II | Portland slag cement | CEM II/A-S CEM II/B-S | 80–88 | 0–5 | 80/95–94/95 | 0.84–0.99 | 410–480 |
| 65–79 | 0–5 | 65/95–79/95 | 0.68–0.83 | 340–410 | |||
| Portland/silica fume cement | CEM II/A-D | 90–94 | 0–5 | 90/95–94/95 | 0.95–0.99 | 460–480 | |
| Portland pozzolana cement | CEM II/A-P | 80–94 | 0–5 | 80/95–94/95 | 0.84–0.99 | 410–480 | |
| CEM II/B-P | 65–79 | 0–5 | 65/95–79/95 | 0.68–0.83 | 340–410 | ||
| CEM II/A-Q | 80–94 | 0–5 | 80/95–94/95 | 0.84–0.99 | 410–480 | ||
| CEM II/B-Q | 65–79 | 0–5 | 65/95–79/95 | 0.68–0.83 | 340–410 | ||
| Portland–fly ash cement | CEM II/A-V | 80–94 | 0–5 | 80/95–94/95 | 0.84–0.99 | 410–480 | |
| CEM II/B-V | 65–79 | 0–5 | 65/95–79/95 | 0.68–0.83 | 340–410 | ||
| CEM II/A-W | 80–94 | 0–5 | 80/95–94/95 | 0.84–0.99 | 410–480 | ||
| CEM II/B-W | 65–79 | 0–5 | 65/95–79/95 | 0.68–0.83 | 340–410 | ||
| Portland-burnt shale cement | CEM II/A-T | 80–94 | 0–5 | 80/95–94/95 | 0.84–0.99 | 410–480 | |
| CEM II/B-T | 65–79 | 0–5 | 65/95–79/95 | 0.68–0.83 | 340–410 | ||
| Portland limestone cement | CEM II/A-L | 80–94 | 0–5 | 80/95–94/95 | 0.84–0.99 | 410–480 | |
| CEM II/B-L | 65–79 | 0–5 | 65/95–79/95 | 0.68–0.83 | 340–410 | ||
| CEM II/A-LL | 80–94 | 0–5 | 80/95–94/95 | 0.84–0.99 | 410–480 | ||
| CEM II/B-LL | 65–79 | 0–5 | 65/95–79/95 | 0.68–0.83 | 340–410 | ||
| Portland composite cement | CEM II/A-M | 80–88 | 0–5 | 80/95–94/95 | 0.84–0.99 | 410–480 | |
| CEM II/B-M | 65–79 | 0–5 | 65/95–79/95 | 0.68–0.83 | 340–410 | ||
| CEM III | Blast furnace cement | CEM III/A | 35–64 | 0–5 | 35/95–64/95 | 0.37–0.67 | 180–330 |
| CEM III/B | 20–34 | 0–5 | 20/95–34/95 | 0.21–0.36 | 100–180 | ||
| CEM III/C | 5–19 | 0–5 | 5/95–19/95 | 0.05–0.20 | 30–100 | ||
| CEM IV | Pozzolanic cement | CEM IV/A | 65–89 | 0–5 | 65/95–89/95 | 0.68–0.94 | 340–460 |
| CEM IV/B | 45–64 | 0–5 | 45/95–64/95 | 0.47–0.67 | 230–330 | ||
| CEM V | Composite cement | CEM V/A | 40–64 | 0–5 | 40/95–64/95 | 0.42–0.67 | 210–330 |
| CEM V/B | 20–38 | 0–5 | 20/95–38/95 | 0.21–0.40 | 100–200 |
© 2020 by the authors. Licensee MDPI, Basel, Switzerland. This article is an open access article distributed under the terms and conditions of the Creative Commons Attribution (CC BY) license (http://creativecommons.org/licenses/by/4.0/).
Share and Cite
MDPI and ACS Style
Sanjuán, M.Á.; Andrade, C.; Mora, P.; Zaragoza, A. Carbon Dioxide Uptake by Cement-Based Materials: A Spanish Case Study. Appl. Sci. 2020, 10, 339. https://doi.org/10.3390/app10010339
AMA Style
Sanjuán MÁ, Andrade C, Mora P, Zaragoza A. Carbon Dioxide Uptake by Cement-Based Materials: A Spanish Case Study. Applied Sciences. 2020; 10(1):339. https://doi.org/10.3390/app10010339
Chicago/Turabian StyleSanjuán, Miguel Ángel, Carmen Andrade, Pedro Mora, and Aniceto Zaragoza. 2020. "Carbon Dioxide Uptake by Cement-Based Materials: A Spanish Case Study" Applied Sciences 10, no. 1: 339. https://doi.org/10.3390/app10010339
Note that from the first issue of 2016, this journal uses article numbers instead of page numbers. See further details here.