A New Method of Low Amplitude Signal Detection and Its Application in Acoustic Emission


1
Institute of Advanced Technologies, Togliatti State University, Samara region 445020, Russia
2
Department of Mechanical and Industrial Engineering, Norwegian University of Science and Technology—NTNU, 7491 Trondheim, Norway
*
Author to whom correspondence should be addressed.
Appl. Sci. 2020, 10(1), 73; https://doi.org/10.3390/app10010073
Submission received: 4 December 2019
/
Revised: 15 December 2019
/
Accepted: 16 December 2019
/
Published: 20 December 2019
(This article belongs to the Special Issue Elastic Waves and Acoustic Emission for Innovative Monitoring of Structures and Engineering Systems)
Abstract
:Featured Application
Acoustic emission signal detection, seismology, ultrasonic inspections, non-destructive condition monitoring.
Abstract
A novel methodology is proposed to enhance the reliability of detection of low amplitude transients in a noisy time series. Such time series often arise in a wide range of practical situations where different sensors are used for condition monitoring of mechanical systems, integrity assessment of industrial facilities and/or microseismicity studies. In all these cases, the early and reliable detection of possible damage is of paramount importance and is practically limited by detectability of transient signals on the background of random noise. The proposed triggering algorithm is based on a logarithmic derivative of the power spectral density function. It was tested on the synthetic data, which mimics the actual ultrasonic acoustic emission signal recorded continuously with different signal-to-noise ratios (SNR). Considerable advantages of the proposed method over established fixed amplitude threshold and STA/LTA (Short Time Average / Long Time Average) techniques are demonstrated in comparative tests.
1. Introduction
Acoustic emission (AE) has become a widespread method of nondestructive testing, condition monitoring and structural integrity assessment for timely maintenance of dynamic mechanical systems (bearings [1,2,3,4] and gearboxes [5,6,7]) and quasi-statically loaded industrial facilities (pressure vessels [8,9,10], pipelines [11], etc.). In general, AE transient displacements arise at the surface of the solid body in response to rapid structural rearrangements occurring locally during plastic deformation, fracture (including environmentally assisted degradation) or phase transformations. The process of AE generation at the source in structural metals and alloys bears a lot of similarity to that of the earthquakes and is driven by local elastic stress relaxations [12,13]. As damage proceeds, AE appears as a random time series comprising of arbitrarily spaced individual pulses of different amplitudes and shapes, depending on the properties of the source. The amplitude of AE bursts can vary by several orders of magnitude in the dynamic range exceeding 100 dB. Pulses with a high signal-to-noise ratio (SNR) are easily detectable by any of the existing methods. As opposed to this, small amplitude signals are often not resolved from background noise and are therefore lost for any analytics. On the other hand, if the trigger level is set too low, false alarms are recorded due to noise fluctuations. Unidentified false triggering burdens the data analysis and can potentially result in dangerous misinterpretations and wrong decision-making. In fact, the AE sensitivity and the dynamic range are lower and bound by the inevitable background electronic noise that poses the main challenge for low amplitude signal detection. The AE analysis—like the analysis of a seismic time series—starts from signal detection, which is of paramount importance for further processing.
Various data processing and onset picking algorithms have been proposed in the literature to minimise the localisation error and determine the most likely location of the source in different geometries [14,15,16,17]. Plenty of trigger algorithms have been developed and used in seismology and to a much lesser extent, in the specific AE field. The simplest (and the “oldest”) method is the amplitude-based threshold method [18], where an event is marked when the pre-set amplitude threshold is exceeded by the signal from the pre-amplifier output. Variations of this method include the envelope and/or root-mean-square threshold triggers, which are less sensitive to spike noise but are rarely used in practice. Although this method has been successfully used in many applications where the SNR is considerably high (e.g., >10 dB), its accuracy deteriorates rapidly as the SNR reduces [19]. A common in the AE field practice of counting the AE activity as a number of AE events per unit time or a total number of AE events suffers particularly strongly from the arbitrariness of the threshold setting, resulting in irrecoverable errors in AE data and their interpretations. Despite its obvious limitations associated with poor detection of the first arrival and incapability to detect the low amplitude events [14,18], the fixed threshold is still the only one implemented in the existing commercial AE apparatus and is, therefore, the most widely used triggering method.
The more precise and sophisticated schemes evolved in AE and seismic analysis include a variety of adaptive methods, pattern recognition, and neural network-based approaches. These methods are conventionally based on the features of the signal measured in time or frequency domain or using a more extensive set of features extracted in the time-frequency space.
Among the time-domain approaches, the Short Time Average/Long Time Average (STA/LTA) technique [20,21] or/and its modified versions [22] (see [23] for comparison) remain to be the most widely used method in seismology for decades. Multiple modifications of this algorithm have been reviewed in detail in [22,24]. In this method, the ratio of continuously calculated amplitude (or envelope or average energy) of a recorded signal realisation in two consecutive moving time windows—a short-term window and a subsequent long-term window—is calculated and used as a criterion for signal detecting [20,21,25]. Despite the simplicity, this method also requires the careful data-driven setting of parameters, including a trigger threshold level and lengths of both STA and LTA windows [26]. Similarly to the amplitude threshold, the too low trigger setting can give rise to many false alarms while the high threshold may result in missing low amplitude events. The value of the optimal activation threshold depends on the total noise level, its nonstationarity and the presence of spurious noise.
Many modern time-domain approaches rely on statistical procedures including a group of autoregressive methods (AR) and cross-correlation methods [27,28], the CUSUM (cumulative sum) algorithm—a simple yet efficient sequential analysis technique developed for change detection in time series [29], fractal dimension-based algorithms [30,31], higher-order statistics [32], e.g., those using the short-term kurtosis to long-term kurtosis ratio [33] or its improved version employing the discrete wavelet representation [34]. Besides, the Akaike Information Criterion (AIC) [35] should be highlighted as an effective statistical procedure devised to determine the transition point in a time series between noise and a coherent signal (see [36] for the efficient implementation of the AIC for p-phase picking). This criterion has become a core component in a family of hybrid methods combining benefits of different techniques, e.g., AR-AIC picker [37,38,39], or empirical mode decomposition EMD-AIC picker [40,41]. Finally, a group of methods exploiting artificial intelligence in the form of neural networks [42,43] should be mentioned as an emerging trend in contemporary signal detection arena. These methods have proved to be useful in many situations, but require the adequate training of the network, which is not always possible or is resource-consuming.
The use of multiple promising spectral wavelet-based algorithms, in both continuous (CWT) and discrete (DWT) forms, for signal picking has been reviewed in [19,44] with a focus on AE applications for signal characterisation [45], denoising [46,47,48], phase picking and source location [38,45,49,50,51,52,53]. A simple adaptive picking method based on the detection of abrupt changes in the signal energy was proposed in [54]. The sliding power spectral density (PSD) method was employed to separate noise and signal containing realisations in the continuous seismic waveform [55]. It was particularly shown that the PSD-based method could outperform the STA/LTA technique by detecting a higher number of low amplitude events while keeping the number of false triggers reasonably small.
Finishing this brief—and by no means all-inclusive—survey of currently available signal detection algorithms, we would like to highlight specific reviews by Küperkoch et al. [24] and Sharma et al. [56], who also conclude that despite the vast amount of research in this field, the event-picking algorithms have not yet fully come of age. Commonly and unfortunately, when background noise is high and the signal quality is poor, most techniques tend to fail or become very computationally intensive. Therefore, while a wealth of techniques have been devised for signal detection, the main challenge is still on hold, and in practice, only relatively simple trigger algorithms are broadly accepted. This motivated us to seek for a “data-driven”, practical, and yet robust procedure providing consistent and reliable picks of low amplitude signal buried into background noise in automated schemes.
2. Materials and Methods
Because of the widespread use of the fixed thresholding and STA/LTA triggering algorithms, these two have become the most popular benchmarks for probing new signal detectors and phase pickers. Therefore, they were chosen for the comparative analysis in the present work. Besides, the optimised method by Lomax et al. [57] is also tested for comparison. This method was chosen for three reasons: (i) it has been designed to work with continuous, broadband streaming data; (ii) it uses a characteristic function based on a combination of the signal and its time derivative at successive samples, and (iii) it has been extensively documented for implementation, and therefore seemed suitable for the purpose of this study [58]. As will become clear, this method is similar in a sense to our algorithm, which is footed on the synergy of the time-frequency signal decomposition and the abrupt change in the PSD when the transient signal appears in the background noise. In the proposed method, the original AE stream is transformed into a time-dependent parameter φ, which was defined in [59] and used for increasing the signal-to-noise ratio and finding the weak events in seismic time series. It then was shown effective for finding AE events in a noisy time series recorded during micro-indentation testing [60]. Unlike the previous reports, the present work deals with signal detection, and its key novelty lies in the proposed strategy pairing the φ-parameter with a decision function, which is then tuned for precise AE arrival time picking and signal end detection in a robust and reproducible way. The new steps implemented in the algorithm are detailed and highlighted in the next section.
Algorithm for Detecting Weak Signals (φ-Method)
The electric signal at the output of the AE amplifier depends on many factors. First, it depends strongly on the sensor frequency response and the media transfer function [61]. The electric signal at the output can be expressed as a convolution integral of the dynamic source function , which is represented by the average stress drop (in a tensorial form) at the source location, with the total transfer function A(t), i.e.,
where combines the transfer function of the media, in which the elastic waves propagate, and of the apparatus. Using the transfer function formalism, the latter equation in the Fourier domain transforms into a simple product (c.f. [62])
with tilde denoting the respective spectral density functions. Eitzen and Wadley [63] noticed that by far the most important consequence of the transfer function formalism is that information about the source is passed frequency by frequency to the output through the transfer function.
The AE detector is constructed as:
with - the frequency band. Obviously, this parameter equals to zero when the sources are stationary, and their properties (the PSD, to be more specific) do not change with time, and φ(t) is nonzero when the sources evolve: the faster the spectral density of the sources changes, the higher the absolute value of φ(t). The logarithmic derivative “amplifies” the changes in the AE PSD when the stationary background noise changes to a mixture of noise and transient signal components. Besides, in constructing the function φ(t) in the form of Equation (3) we were motivated by the long-standing desire to reduce or eliminate the influence of the transfer function on the AE descriptive parameter. By plugging Equation (2) into Equation (3), one can see that the φ-function is essentially free from this influence, provided is a function of frequency, and this function does not change in time (the condition that is often met in laboratory experiments or in-field AE inspections):
The beauty of the last expression is that it no longer involves the transfer function, and the introduced φ-parameter depends primarily on the dynamics of the evolution of the source function .
Using a sliding window with a user-defined size and step, Equation (3) transforms the original time series into a new train of pulses with a substantially enhanced SNR. Figure 1 illustrates the AE transient waveform (a) and the corresponding shape of the φ-parameter (b).
According to a proposed detection scheme, events are distinguished by a decision function g(m) defined at a pre-set constant level has:
where h is a detection threshold. The procedure and guidelines for its determination are outlined in detail below. Hereinafter, the index m denotes discrete time. The beginning and the end of the i-th event, and , respectively, are defined as:
Using the φ-parameter, the decision function is calculated by successively performing the following steps:
- Zeroing the negative part of .
- Recursive smoothing of the resulting vector.
- Normalisation.
These steps are discussed below in detail. We should notice here, that the choice of the detection threshold h, Figure 1c, is particularly significant to the algorithm performance. Conventionally, it is chosen to minimise the total error rate subject to bounded false-alarm and missed-detection probabilities, c.f. [64]. The threshold optimisation problem itself is an area of burgeoning research which is beyond the scope of the present paper. Since we did not apply any optimisation technique to the other methods used for comparison, we did not try to optimise the h value in our approach too. It is obtained through the visual analysis of the decisive function in a pretty much the same way as the parameters are chosen in the STA/TLA algorithm.
The simplest detection option is to use the φ-parameter itself as the decision function and compare it with a certain threshold level h. However, the small fluctuations in φ, which are clearly visible in Figure 1b can lead to false alarms. To eliminate false triggering, the φ-parameter is smoothed by the recursive averaging procedure (the recursive version is recommended for computational cost-effectiveness):
where the subscript index a denotes averaging, M is the length of the smoothing window, is the original time series and is the smoothed time series, which is used as a decision function at the level h, as illustrated in Figure 1c. The expression (7) differs from the commonly used recursive formulas by the squared value in the numerator of the first term in the right-hand side. Squaring the value works as a gaining factor “amplifying” the high-amplitude readings and “smoothing” the low-amplitude points close to the noise level. This allows highlighting the events against the background of a very smooth noise. Figure 1c shows the result of the smoothing of the φ-parameter originally displayed in Figure 1b. Another characteristic feature of the φ-parameter is that it exhibits, with necessity, two peaks-positive at the beginning and negative at the end of the signal, which is shown in Figure 1b as being separated by the time interval covering the signal length. When the sliding window starts to sense the signal in the region where the noticeable change in the power spectrum occurs, the positive peak arises. The negative peak occurs when the signal dies out at the end of the sliding window, Figure 1b. Since the squaring procedure applies during smoothing, Equation (7), the false-negative peak is inverted into a positive one. To avoid this, all negative readings are nullified before smoothing.
After smoothing, the decision function is normalised to unity and the event detection proceeds according to Equations (4) and (5). As a result, one obtains the onset and end event times, and , respectively. Once the event is detected, the and values can be used to calculate the temporal and spectral signal characteristics for further analysis.
The final step in the detection procedure, which is not absolutely necessary, but which is practically recommended for improving the accuracy of arrival picking, is the shift of and values backwards in time by the step s, as shown Figure 1, where the meaning of s is graphically illustrated by a green dashed line broken between (a) and (b). This shift compensates for the time lag, which arises inevitably in the calculation and smoothing of the -function. For any practical situation, it can be simply adjusted for the best accuracy, but as a general rule, the shift value s must be not less than the size of the smoothing window M. As the SNR decreases, an increasingly large width of the smoothing window M is beneficial for detection. At the same time, the picked onset of the event shifts more and more to the right along the time scale with respect to the actual known position of the signal. Accordingly, to compensate for this increasing time lag, the increasing values of temporal shift s are chosen manually.
Thus, in summary, compared to the previously reported procedure focused solely on the φ-parameter definition [59], the proposed method includes the following new steps pivotal for signal detection:
- The calculation of the decision function from the φ-parameter (involving zeroing the negative part of φ, recursive smoothing and normalizing steps);
- The calculation of the start and end times (as well as the amplitudes) of events from the decisive function;
- The use of an amplitude filter to cut off false alarms;
- The “left shift” of the obtained times to compensate for the delay caused by the smoothing window used for calculating φ;
- The use of an amplitude filter to cut off false events.
Results of the application of the proposed algorithm and its testing against several other popular signal detection techniques are discussed in the next section.
3. Results
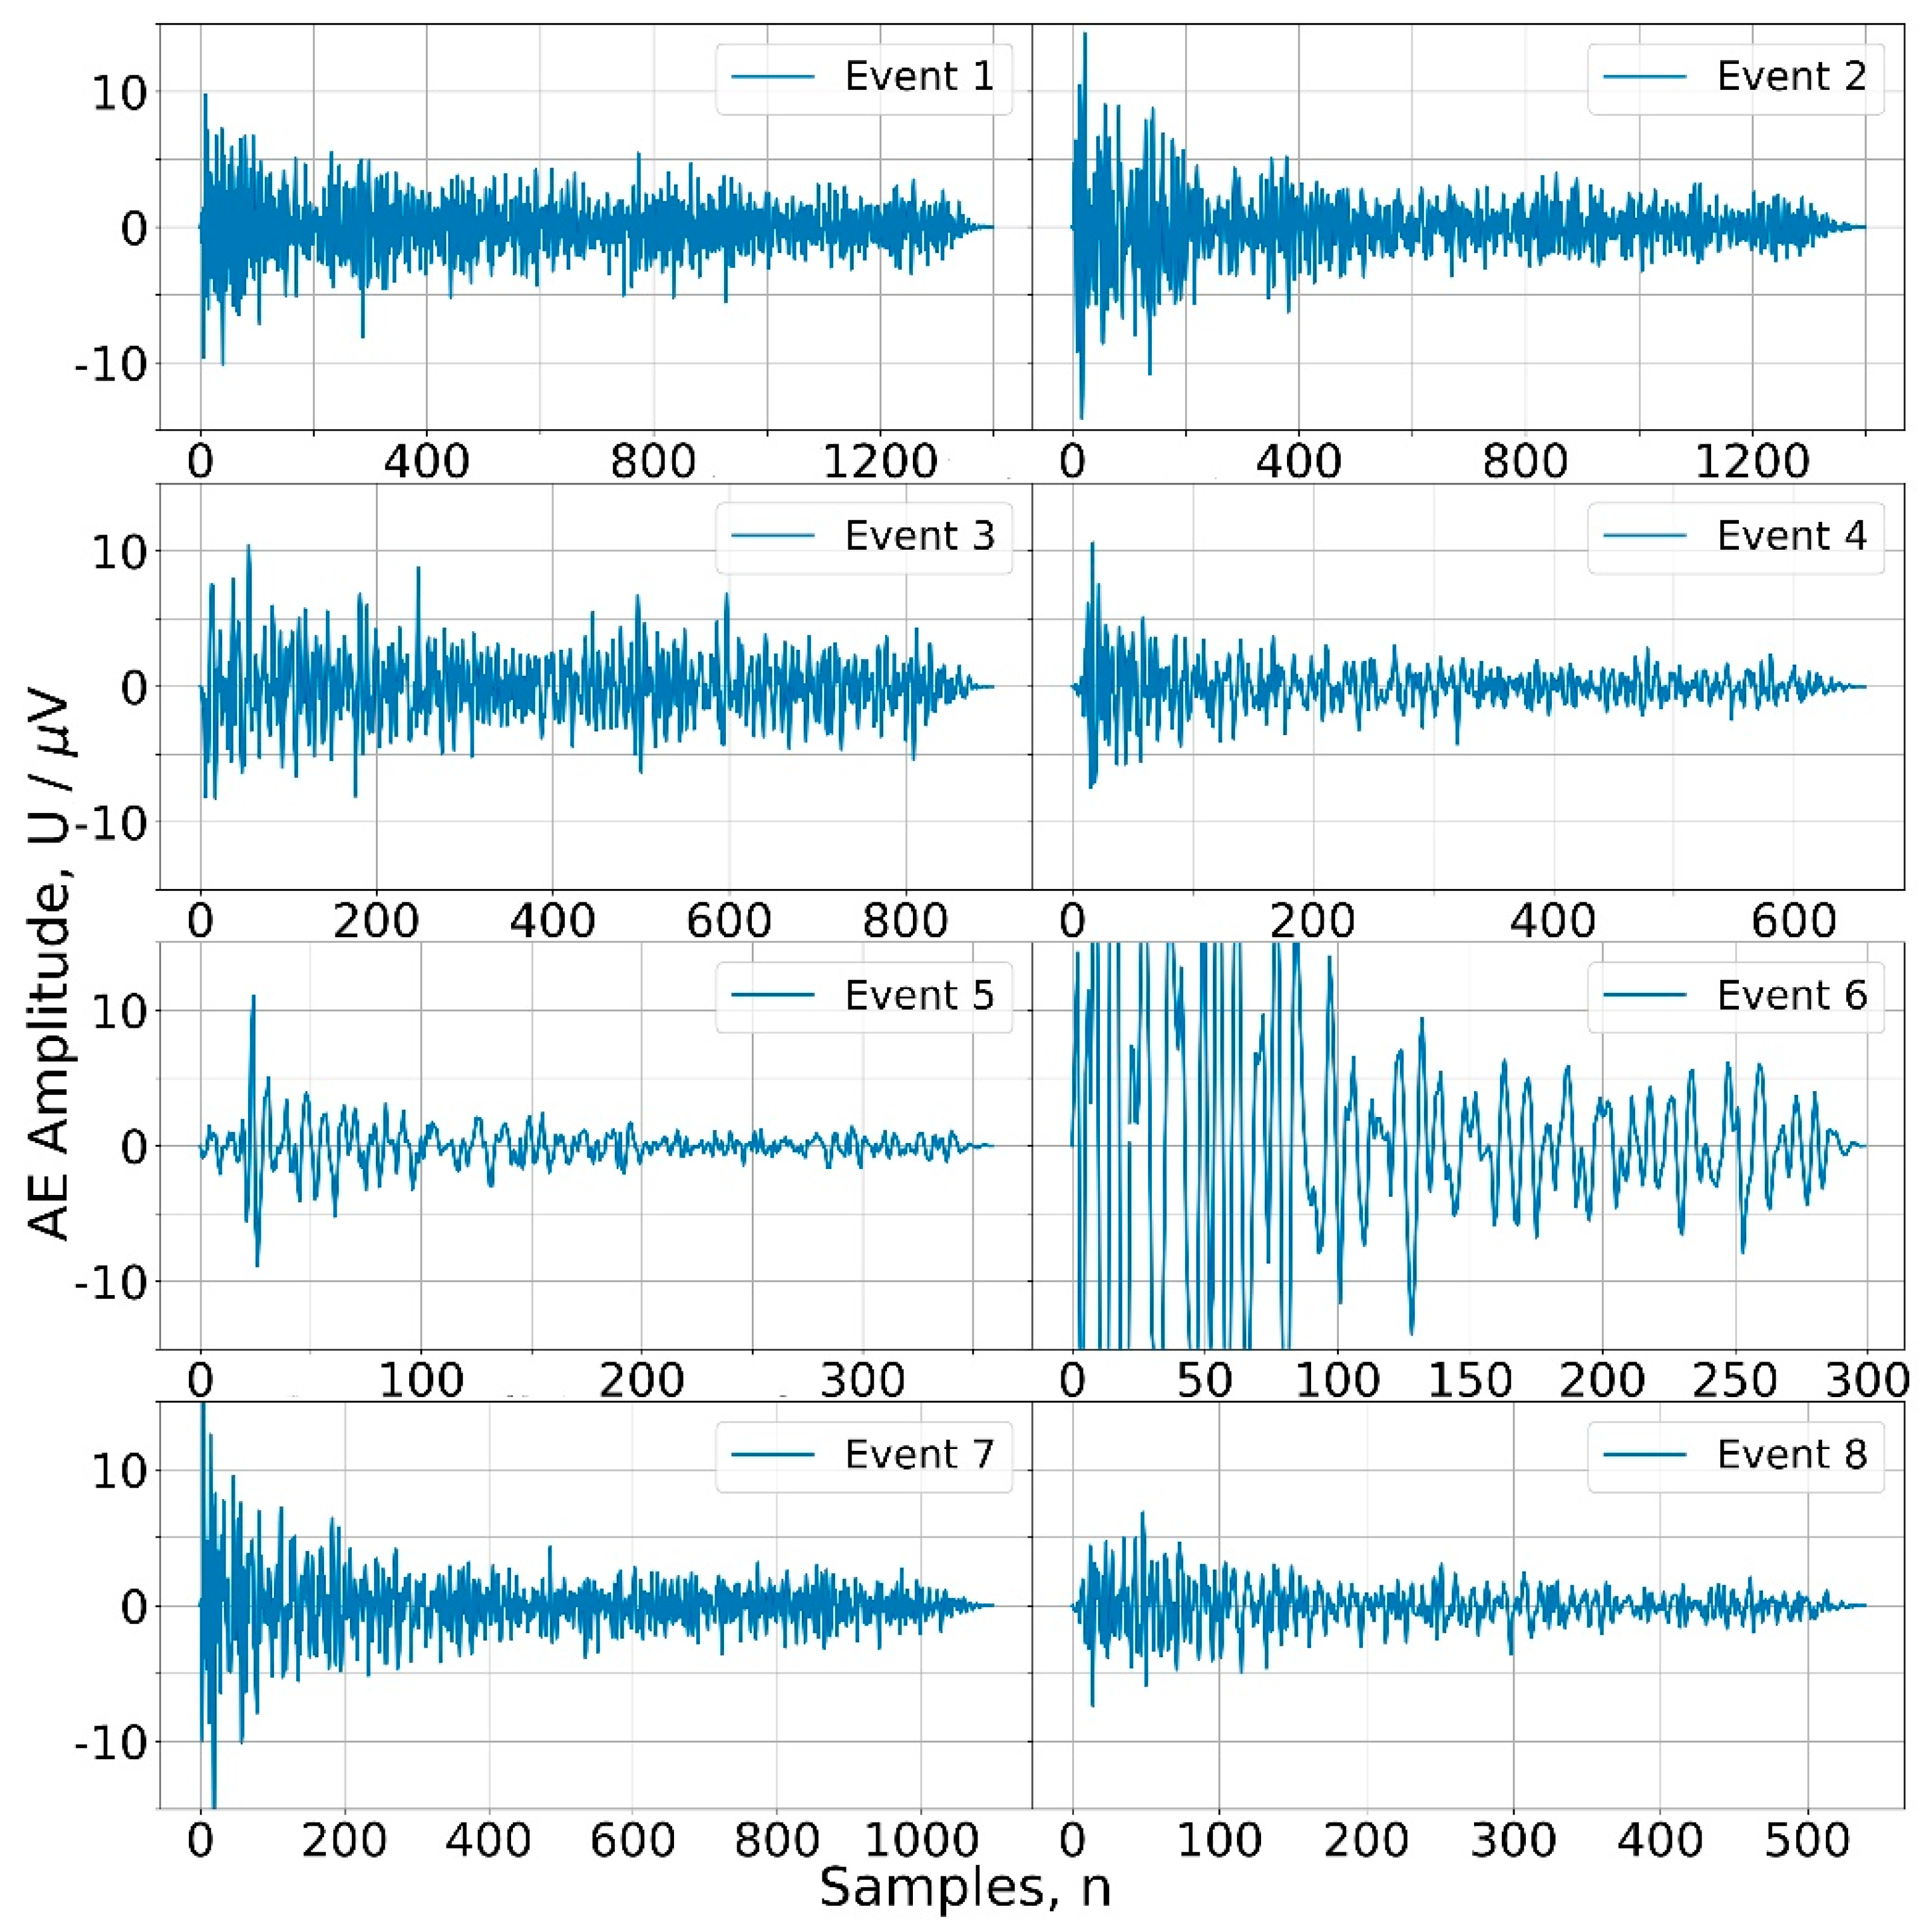
To illustrate the effectiveness of the proposed method in comparison with the conventional amplitude threshold trigger, we constructed two sets of testing signals: the small set of eight equally spaced AE transients and the large one having one thousand AE pulses buried into background noise with random time intervals between the events. To produce these synthetic datasets, we have arbitrarily chosen typical realisations of AE transient waveforms with significantly different amplitudes and durations, which were acquired by the NF-900S-WB (NF Electronics, Yokohama, Japan) wide-band AE sensor during plastic deformation of α-Fe in tension at the sampling rate 2 Msamples/s and 16 bits resolution, as shown in Figure 2.
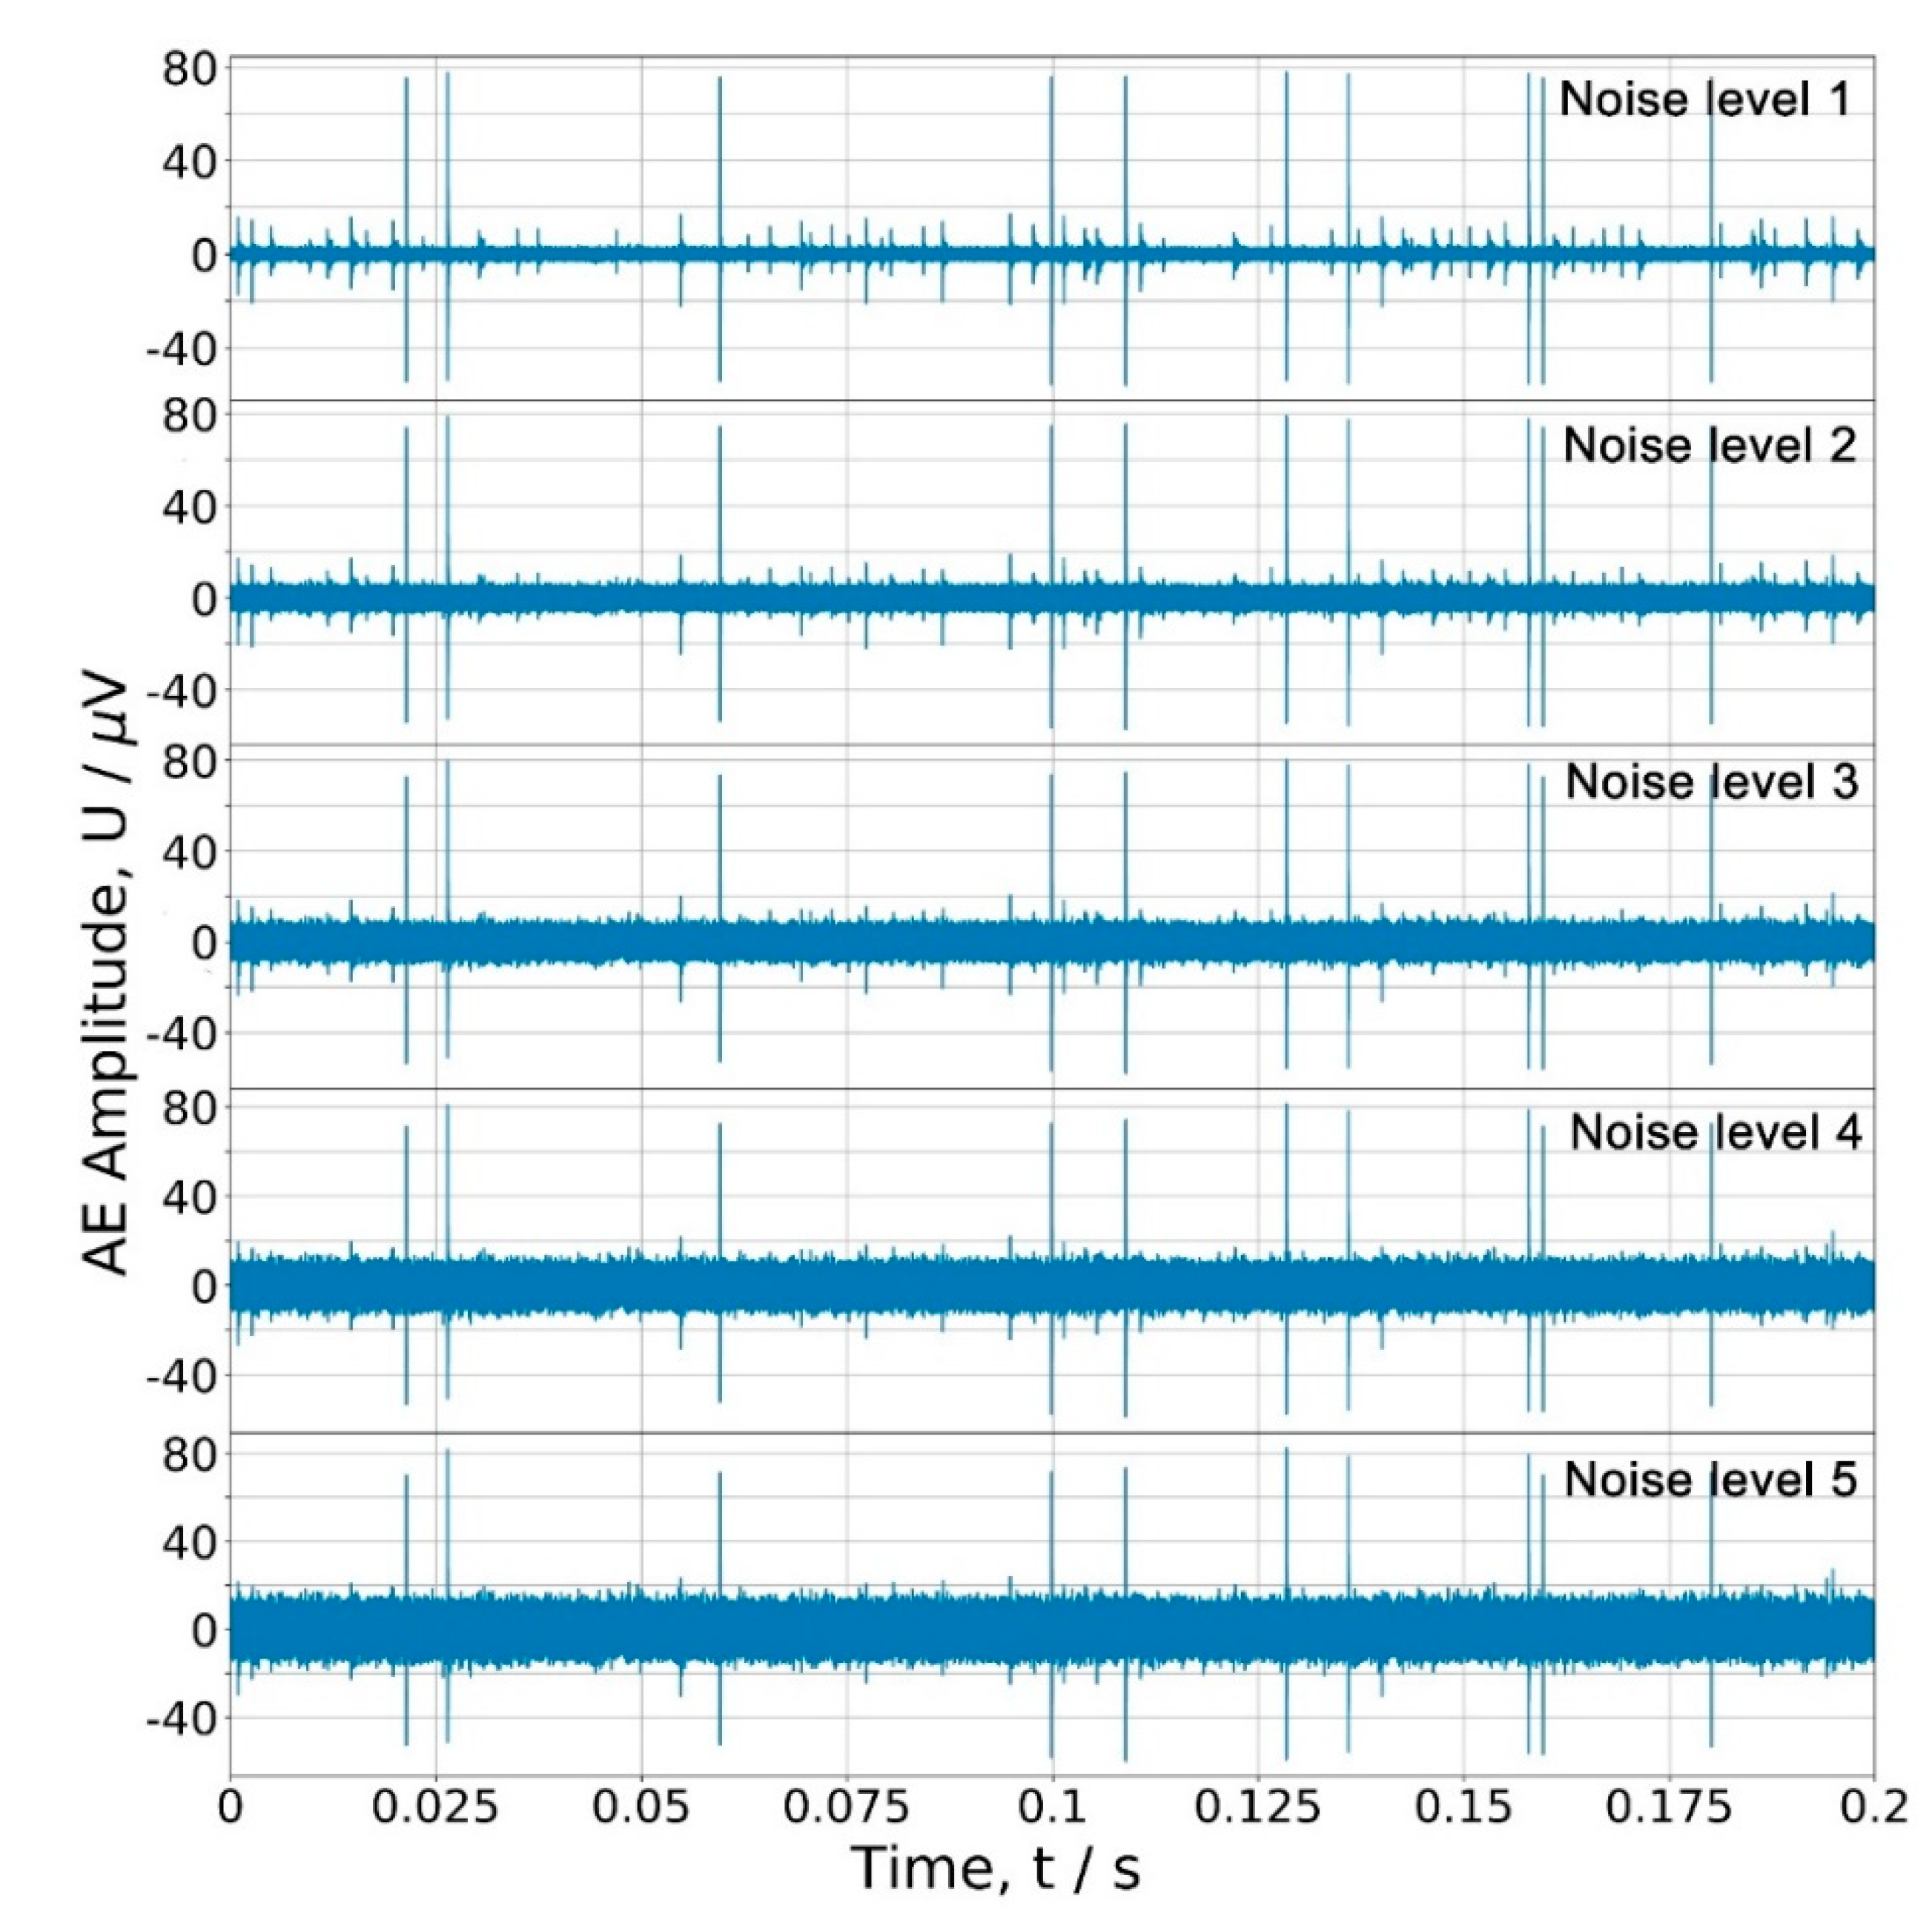
These waveforms were buried into the actual scalable background noise 0.005 s apart from one another, as shown in Figure 3. The noise data represents the actual coloured electronic noise from the pre-amplifier. It was recorded with the same experimental setup, including the sensor connected to the pre-amplifier. SNR values for each of the five chosen noise levels and for each of the eight events are shown in Table 1. For the larger dataset, one thousand waveforms representing a Poisson time series with random independent intervals between each other were embedded into the same noise. Fragments of this dataset with different tested noise levels are shown in Figure 4.
The PSD plugged into Equation (3) was calculated by the Welch periodogram method. Minimum and maximum frequencies in this equation are determined by the frequency band of the sensor used, which is of 0.1–1.0 MHz for the general-purpose AE sensors. Thus, having the sampling frequency of the acquisition system of 2 MHz, the integration is performed from 0.1 to 1 MHz. Values of all parameters used in the φ-signal detector are listed in Table 2. One can notice, for example, that the time shift s is chosen greater than the size of the smoothing window M, as has been discussed above.
Since in the present work, the number of true events is known a priori, the detection completeness is estimated as shown in Table 3 and Table 4. For all methods tested, the parameters were set to provide maximum detection and minimum false alarm probabilities. We should mention here that unlike many phase-picking algorithms, such as that reported in [19] for example, the proposed method has few parameters, all of which are intuitively understandable and not difficult to set (in a way similar to those in the LTA/STA procedure).
Results of application of the conventional fixed amplitude threshold-based algorithm, STA/LTA, FilterPicker [57] and the proposed φ-based algorithm for signal detection in the generated small and large test streams are summarised in Table 3 and Table 4, respectively.
As expected, all methods show excellent reliability in the detection of signals with high SNR >> 0 (noise levels 1 and 2), which is compromised as the SNR is reduced. As expected, both the STA/LTA and FilterPicker algorithms appear more sensitive and flexible than the fixed threshold triggering. One can see that the STA/LTA trigger significantly increases the percentage of successfully detected weak events compared to the classical amplitude threshold method in both streams, while the number of false alarms is kept nearly the same for both methods. Not surprisingly that the φ-algorithm is as efficient as the others, provided the conditions are favourable for signal distinction, i.e., the SNR is reasonably high. However, the φ-triggering substantially outperforms all other techniques at low SNR where the threshold method has completely failed to detect any weak signals at the noise levels 4 and 5 (), c.f. Table 3 and Figure 5 and Figure 6.
Figure 5 exemplifies the results of signal detection by the φ-algorithm applied to the small dataset with the lowest SNR corresponding to the largest noise level 5 in Figure 3. One can notice that the signals 4 and 5 are missing while the others are correctly detected, yet no false alarms are triggered. Thus, the detection reliability of the φ-triggering method is enhanced compared to other tested methods: the rate of correctly identified events is remarkably higher while the rate of false alarms is consistently smaller than that for other signal detectors at any SNR, including the lowest one as illustrated in the bar chart in Figure 6 comparing the correct detection rates for all tested methods.
4. Discussion
Although the φ-algorithm is quite transparent, it is obvious that due to the complexity of mathematical operations involving fast Fourier transform, logarithmic operations and integration procedures, the proposed method is computationally demanding and is much less efficient than the others used for benchmarking. We should note that the FilterPicker algorithm is very computationally effective, whereas the proposed φ-method is far from being optimised and there are a number of directions for future work in its end-to-end optimisation. However, the problem is becoming less and less acute due to the rapidly increasing power of computing facilities and development of hardware-based digital signal processing (DSP) units, which provide outstanding performance and low power consumption.
As a final note, we should mention that, besides the unavoidable electronic background noise, many practical challenges faced in condition monitoring are associated with mechanical or spurious electrical noise. The proposed method picks all transients, which differ from the stationary background, regardless of their origin. Multiple robust signal categorisation techniques (c.f. [65]) have been proposed to discriminate between the detected sources of different origin. Not only the signal categorisation (applied to a set of pre-detected waveforms) can help to filter out the false picks arising from transient mechanical or electrical noise, but it is also efficient in improving the quality of AE detection by removing some false alarms inherited from phase-picking.
5. Conclusions
The new signal processing technique has been proposed to enhance the detection reliability of low-amplitude transients in noisy acoustic emission time series. Using the logarithmic derivative of the AE power spectral density with respect to time, the mathematical expression for the signal detector termed φ-parameter has been obtained considering the transfer function formalism. The method was compared with the most widespread benchmarking techniques-fixed amplitude threshold and optimised STA/LTA. The greatly enhanced detection reliability of the φ-trigger compared to others has been demonstrated on two AE representing datasets simulating different signal-to-noise ratios of AE waveforms: application of the φ-algorithm renders the much higher rate of correctly identified low-amplitude events while the rate of false alarms is consistently smaller than that for other methods used for comparison at any tested SNR.
Despite a wealth of available advance methods overviewed briefly in the present work, unfortunately, all commercially available AE systems today use the primitive amplitude thresholding technique for signal detection, which is significantly compromised in comparison to many modern detection algorithms, and which strongly limits the capacity of the existing apparatus used in NDT and condition monitoring practice. We do believe that this practice will be changed in favour of higher accuracy and reliability of signal detection for every-day AE practice both in laboratories and in in-field inspections.
Although the proposed algorithm was designed for AE monitoring and, in the present work, probed on an AE time series, the method is nonspecific to the nature of noisy time series and, without limitations, it can be applied widely in a new generation of condition monitoring and diagnostic systems where the sensors with different frequency bands are used and where early and reliable detection of possible damage is of paramount importance.
Author Contributions
Conceptualization and writing, A.V.; methodology, validation, formal analysis, software, E.A.; project administration and discussion the results, D.M. All authors have read and agreed to the published version of the manuscript.
Funding
This research was funded by the Russian Ministry of Higher Education and Science under the State Assignment, grant number 11.5281.2017/8.9.
Conflicts of Interest
The authors declare no conflicts of interest.
References
- Mba, D. Acoustic emissions and monitoring bearing health. Tribol. Trans. 2003, 46, 447–451. [Google Scholar] [CrossRef]
- Jamaludin, N.; Mba, D. Monitoring extremely slow rolling element bearings: Part I. NDT E Int. 2002, 35, 349–358. [Google Scholar] [CrossRef]
- Al-Ghamd, A.M.; Mba, D. A comparative experimental study on the use of acoustic emission and vibration analysis for bearing defect identification and estimation of defect size. Mech. Syst. Signal Proc. 2006, 20, 1537–1571. [Google Scholar] [CrossRef] [Green Version]
- Abbasion, S.; Rafsanjani, A.; Farshidianfar, A.; Irani, N. Rolling element bearings multi-fault classification based on the wavelet denoising and support vector machine. Mech. Syst. Signal Proc. 2007, 21, 2933–2945. [Google Scholar] [CrossRef]
- Igba, J.; Alemzadeh, K.; Durugbo, C.; Eiriksson, E.T. Analysing rms and peak values of vibration signals for condition monitoring of wind turbine gearboxes. Renew. Energy 2016, 91, 90–106. [Google Scholar] [CrossRef] [Green Version]
- Esmaeili, K.; Zuercher, M.; Wang, L.; Harvey, T.J.; Holweger, W. Advanced Signal Processing Techniques for Wind Turbine Gearbox Bearing Failure Detection; British Institute of Non-Destructive Testing: Northampton, UK, 2017. [Google Scholar]
- Antoniadou, I.; Manson, G.; Staszewski, W.J.; Barszcz, T.; Worden, K. A time–frequency analysis approach for condition monitoring of a wind turbine gearbox under varying load conditions. Mech. Syst. Signal Proc. 2015, 64–65, 188–216. [Google Scholar] [CrossRef]
- Scruby, C.B.; Wadley, H.N.G. An assessment of acoustic emission for nuclear pressure vessel monitoring. Prog. Nucl. Energy 1983, 11, 275–297. [Google Scholar] [CrossRef]
- Kwon, J.R.; Lyu, G.J.; Lee, T.H.; Kim, J.Y. Acoustic emission testing of repaired storage tank. Int. J. Press. Vessel. Pip. 2001, 78, 373–378. [Google Scholar] [CrossRef]
- Gholizadeh, S.; Leman, Z.; Baharudin, B.T.H.T. A review of the application of acoustic emission technique in engineering. Struct. Eng. Mech. 2015, 54, 1075–1095. [Google Scholar] [CrossRef]
- Ahn, B.; Kim, J.; Choi, B. Artificial intelligence-based machine learning considering flow and temperature of the pipeline for leak early detection using acoustic emission. Eng. Fract. Mech. 2019, 210, 381–392. [Google Scholar] [CrossRef]
- Carpinteri, A.; Lacidogna, G. Acoustic Emission and Critical Phenomena: From Structural Mechanics to Geophysics; CRC Press: Boca Raton, FL, USA, 2008. [Google Scholar]
- Carpinteri, A.; Lacidogna, G. Earthquakes and acoustic emission. In Balkema—Proceedings and Monographs in Engineering, Water, and Earth Sciences; Taylor & Francis: London, UK; New York, NY, USA, 2007. [Google Scholar]
- Stepanova, L.; Ramazanov, I.; Kanifadin, K. Estimation of time-of-arrival errors of acoustic-emission signals by the threshold method. Russ. J. Nondestruct. Test. 2009, 45, 273–279. [Google Scholar] [CrossRef]
- Chlada, M.; Prevorovsky, Z. Expert ae signal arrival detection. Int. J. Microstruct. Mater. Prop. 2011, 6, 191–205. [Google Scholar] [CrossRef] [Green Version]
- Blahacek, M.; Chlada, M.; Prevorovsky, Z. Acoustic emission source location based on signal features. Adv. Mater. Res. 2006, 13–14, 77–82. [Google Scholar] [CrossRef]
- Barat, P.; Kalyanasundaram, P.; Raj, B. Acoustic-emission source location on a cylindrical surface. NDT E Int. 1993, 26, 295–297. [Google Scholar] [CrossRef]
- Bai, F.; Gagar, D.; Foote, P.; Zhao, Y. Comparison of alternatives to amplitude thresholding for onset detection of acoustic emission signals. Mech. Syst. Signal Process. 2017, 84, 717–730. [Google Scholar] [CrossRef] [Green Version]
- Pomponi, E.; Vinogradov, A.; Danyuk, A. Wavelet based approach to signal activity detection and phase picking: Application to acoustic emission. Signal Process. 2015, 115, 110–119. [Google Scholar] [CrossRef]
- Allen, R.V. Automatic earthquake recognition and timing from single traces. Bull. Seismol. Soc. Am. 1978, 68, 1521–1532. [Google Scholar]
- Baer, M.; Kradolfer, U. An automatic phase picker for local and teleseismic events. Bull. Seismol. Soc. Am. 1987, 77, 1437–1445. [Google Scholar]
- Withers, M.; Aster, R.; Young, C.; Beiriger, J.; Harris, M.; Moore, S.; Trujillo, J. A comparison of select trigger algorithms for automated global seismic phase and event detection. Bull. Seismol. Soc. Am. 1998, 88, 95–106. [Google Scholar]
- Malygin, G.A. Features of slip-band formation during the plastic straining of layered crystals. Phys. Solid State 1999, 41, 224–229. [Google Scholar] [CrossRef]
- Küperkoch, L.; Meier, T.; Diehl, T. Automated event and phase identification. In New Manual of Seismological Observatory Practice 2 (Nmsop-2); Bormann, P., Ed.; Deutsches GeoForschungsZentrum GFZ: Potsdam, Germany, 2012; pp. 1–52. [Google Scholar]
- Allen, R. Automatic phase pickers: Their present use and future prospects. Bull. Seismol. Soc. Am. 1982, 72, S225–S242. [Google Scholar]
- Trnkoczy, A. Understanding and parameter setting of sta/lta trigger algorithm. In New Manual of Seismological Observatory Practice (Nmsop-2); Bormann, P., Ed.; IASPEI, GFZ German Research Centre for Geosciences: Potsdam, Germany, 2012. [Google Scholar]
- Morita, Y.; Hamaguchi, H. Automatic detection of onset time of seismic waves and its confidence interval using the autoregressive model fitting. Zisin J. Seismol. Soc. Jpn. 1984, 37, 281–293. [Google Scholar]
- Murat, M.E.; Rudman, A.J. Automated first arrival picking: A neural network approach1. Geophys. Prospect. 1992, 40, 587–604. [Google Scholar] [CrossRef]
- Der, Z.A.; Shumway, R.H. Phase onset time estimation at regional distances using the cusum algorithm. Phys. Earth Planet. Inter. 1999, 113, 227–246. [Google Scholar] [CrossRef]
- Boschetti, F.; Dentith, M.D.; List, R.D. A fractal-based algorithm for detecting first arrivals on seismic traces. Geophysics 1996, 61, 1095–1102. [Google Scholar] [CrossRef]
- Jiao, L.; Moon, W.M. Detection of seismic refraction signals using a variance fractal dimension technique. Geophysics 2000, 65, 286–292. [Google Scholar] [CrossRef]
- Yung, S.K.; Ikelle, L.T. An example of seismic time picking by third-order bicoherence. Geophysics 1997, 62, 1947–1952. [Google Scholar] [CrossRef] [Green Version]
- Li, F.; Rich, J.; Marfurt, K.J.; Zhou, H. Automatic Event Detection on Noisy Microseismograms; Society of Exploration Geophysicists: Tulsa, OK, USA, 2014; pp. 2363–2367. [Google Scholar]
- Li, X.; Shang, X.; Wang, Z.; Dong, L.; Weng, L. Identifying p-phase arrivals with noise: An improved kurtosis method based on dwt and sta/lta. J. Appl. Geophys. 2016, 133, 50–61. [Google Scholar] [CrossRef]
- Akaike, H. Markovian representation of stochastic processes and its application to the analysis of autoregressive moving average processes. Ann. Inst. Stat. Math. 1974, 26, 363–387. [Google Scholar] [CrossRef]
- Kalkan, E. An automatic p-phase arrival-time picker. Bull. Seismol. Soc. Am. 2016, 106, 971–986. [Google Scholar] [CrossRef]
- Sleeman, R.; van Eck, T. Robust automatic p-phase picking: An on-line implementation in the analysis of broadband seismogram recordings. Phys. Earth Planet. Inter. 1999, 113, 265–275. [Google Scholar] [CrossRef]
- Sedlak, P.; Hirose, Y.; Enoki, M. Acoustic emission localization in thin multi-layer plates using first-arrival determination. Mech. Syst. Signal Proc. 2013, 36, 636–649. [Google Scholar] [CrossRef]
- Sedlak, P.; Hirose, Y.; Khan, S.A.; Enoki, M.; Sikula, J. New automatic localization technique of acoustic emission signals in thin metal plates. Ultrasonics 2009, 49, 254–262. [Google Scholar] [CrossRef] [PubMed]
- Li, X.; Shang, X.; Morales-Esteban, A.; Wang, Z. Identifying p-phase arrival of weak events: The akaike information criterion picking application based on the empirical mode decomposition. Comput. Geosci. 2017, 100, 57–66. [Google Scholar] [CrossRef]
- Shang, X.; Li, X.; Morales-Esteban, A.; Dong, L. Enhancing micro-seismic p-phase arrival picking: Emd-cosine function-based denoising with an application to the aic picker. J. Appl. Geophys. 2018, 150, 325–337. [Google Scholar] [CrossRef]
- Dai, H.; MacBeth, C. The application of back-propagation neural network to automatic picking seismic arrivals from single-component recordings. J. Geophys. Res. Solid Earth 1997, 102, 15105–15113. [Google Scholar] [CrossRef]
- Takano, K.; Zhao, Y. An artificial neural network approach for broadband seismic phase picking. Bull. Seismol. Soc. Am. 1999, 89, 670–680. [Google Scholar]
- Sabbione, J.I.; Velis, D. Automatic first-breaks picking: New strategies and algorithms. Geophysics 2010, 75, V67–V76. [Google Scholar] [CrossRef]
- Jiao, J.P.; He, C.F.; Wu, B.; Fei, R.Y.; Wang, X.Y. Application of wavelet transform on modal acoustic emission source location in thin plates with one sensor. Int. J. Press. Vessel. Pip. 2004, 81, 427–431. [Google Scholar] [CrossRef]
- Serrano, E.P.; Fabio, M.A. Application of the wavelet transform to acoustic emission signals processing. IEEE Trans. Signal Process. 1996, 44, 1270–1275. [Google Scholar] [CrossRef]
- Qi, G. Wavelet-based ae characterization of composite materials. NDT E Int. 2000, 33, 133–144. [Google Scholar] [CrossRef]
- Grosse, C.U.; Finck, F.; Kurz, J.H.; Reinhardt, H.W. Improvements of ae technique using wavelet algorithms, coherence functions and automatic data analysis. Constr. Build. Mater. 2004, 18, 203–213. [Google Scholar] [CrossRef]
- Hamstad, M.; Gallagher, A.O.; Gary, J. A wavelet transform applied to acoustic emission signals: Part 1: Source location. J. Acoust. Emiss. 2002, 20, 62–82. [Google Scholar]
- Ciampa, F.; Meo, M. Acoustic emission source localization and velocity determination of the fundamental mode a0 using wavelet analysis and a newton-based optimization technique. Smart Mater. Struct. 2010, 19, 045027. [Google Scholar] [CrossRef] [Green Version]
- Lympertos, E.M.; Dermatas, E.S. Acoustic emission source location in dispersive media. Signal Process. 2007, 87, 3218–3225. [Google Scholar] [CrossRef]
- Moriya, H.; Niitsuma, H. Precise detection of a p-wave in low s/n signal by using time-frequency representations of a triaxial hodogram. Geophysics 1996, 61, 1453–1466. [Google Scholar] [CrossRef]
- Zhu, K.; Wong, Y.S.; Hong, G.S. Wavelet analysis of sensor signals for tool condition monitoring: A review and some new results. Int. J. Mach. Tools Manuf. 2009, 49, 537–553. [Google Scholar] [CrossRef]
- Spagnolini, U. Adaptive picking of refracted first arrivals1. Geophys. Prospect. 1991, 39, 293–312. [Google Scholar] [CrossRef]
- Van der Baan, M.; Vaezi, Y. Comparison of the sta/lta and power spectral density methods for microseismic event detection. Geophys. J. Int. 2015, 203, 1896–1908. [Google Scholar]
- Sharma, B.K.; Kumar, A.; Murthy, V.M. Evaluation of seismic events detection algorithms. J. Geol. Soc. India 2010, 75, 533–538. [Google Scholar] [CrossRef]
- Lomax, A.; Satriano, C.; Vassallo, M. Automatic picker developments and optimization: Filterpicker-a robust, broadband picker for real-time seismic monitoring and earthquake early warning. Seismol. Res. Lett. 2012, 83, 531–540. [Google Scholar] [CrossRef]
- Kamer, Y. Filterpicker: A Robust, Broadband Phase Detector and Picker. 2019. Available online: https://www.Mathworks.Com/matlabcentral/fileexchange/69211-filterpicker-a-robust-broadband-phase-detector-and-picker (accessed on 5 September 2019).
- Vinogradov, A.; Ueno, H. Method of Signal Detection. Patent of Japan JP4754651, 2009. [Google Scholar]
- Agletdinov, E.; Pomponi, E.; Merson, D.; Vinogradov, A. A novel bayesian approach to acoustic emission data analysis. Ultrasonics 2016, 72, 89–94. [Google Scholar] [CrossRef] [PubMed]
- Wadley, H.N.G.; Mehrabian, R. Acoustic emission for materials processing: A review. Mater. Sci. Eng. 1984, 65, 245–263. [Google Scholar] [CrossRef]
- Ono, K. Current understanding of mechanisms of acoustic emission. J. Strain Anal. Eng. Des. 2005, 40, 1–15. [Google Scholar] [CrossRef]
- Eitzen, D.G.; Wadley, H.N.G. Acoustic-emission—Establishing the fundamentals. J. Res. Natl. Bur. Stand. 1984, 89, 75–100. [Google Scholar] [CrossRef]
- Kay, S.M. Fundamentals of Statistical Signal Processing. Vol. II, Detection Theory; PTR Prentice Hall: Englewood Cliffs, NJ, USA, 1998; p. xiv. 560p. [Google Scholar]
- Pomponi, E.; Vinogradov, A. A real-time approach to acoustic emission clustering. Mech. Syst. Signal Proc. 2013, 40, 791–804. [Google Scholar] [CrossRef]
Figure 1.
(a) A typical fragment of the AE signal. (b) The corresponding φ-parameter before smoothing and normalisation procedure. (c) The corresponding φ-parameter after smoothing and normalisation procedure.
Figure 1.
(a) A typical fragment of the AE signal. (b) The corresponding φ-parameter before smoothing and normalisation procedure. (c) The corresponding φ-parameter after smoothing and normalisation procedure.

Figure 2.
Typical acoustic emission waveforms with different amplitudes and durations, which were randomly chosen from continuously recorded data acquired at 2 Msamples/s rate.
Figure 2.
Typical acoustic emission waveforms with different amplitudes and durations, which were randomly chosen from continuously recorded data acquired at 2 Msamples/s rate.

Figure 3.
The synthetic dataset containing eight real AE signals shown in Figure 2 and embedded into real scalable background noise with different levels labelled by numbers from 1 to 5. The dashed vertical lines indicate the positions of the signals.
Figure 3.
The synthetic dataset containing eight real AE signals shown in Figure 2 and embedded into real scalable background noise with different levels labelled by numbers from 1 to 5. The dashed vertical lines indicate the positions of the signals.

Figure 4.
The fragment of the synthetic dataset containing totally 1000 AE signals embedded into background noise with different levels labelled by numbers from 1 to 5.
Figure 4.
The fragment of the synthetic dataset containing totally 1000 AE signals embedded into background noise with different levels labelled by numbers from 1 to 5.

Figure 5.
Example showing the results of signal detection by the φ-algorithm applied to the dataset with the largest noise level (5 in Figure 3). One can notice that the signals 4 and 5 are missing while the others are correctly detected, yet no false alarms are triggered.
Figure 5.
Example showing the results of signal detection by the φ-algorithm applied to the dataset with the largest noise level (5 in Figure 3). One can notice that the signals 4 and 5 are missing while the others are correctly detected, yet no false alarms are triggered.

Figure 6.
Bar chart showing the percentage of successful event detection performed by four different methods applied to the AE Poisson time series containing 1000 transient signals buried in the noise with different levels.
Figure 6.
Bar chart showing the percentage of successful event detection performed by four different methods applied to the AE Poisson time series containing 1000 transient signals buried in the noise with different levels.


Table 1.
Signal-to-noise ratio for different signals from Figure 3 (dB).
Table 1.
Signal-to-noise ratio for different signals from Figure 3 (dB).
| Noise Level | Number of Event | |||||||
|---|---|---|---|---|---|---|---|---|
| 1 | 2 | 3 | 4 | 5 | 6 | 7 | 8 | |
| 1 | 6.0 | 7.2 | 7.8 | 4.2 | 3.7 | 21.5 | 6.8 | 4.3 |
| 2 | 0 | 1.2 | 1.8 | −1.9 | −2.3 | 15.5 | 0.8 | −1.7 |
| 3 | −3.5 | −2.3 | −1.7 | −5.4 | −5.9 | 12.0 | −2.7 | −5.2 |
| 4 | −6.5 | −4.8 | −4.2 | −7.9 | −8.4 | 9.5 | −5.2 | −7.7 |
| 5 | −8.0 | −6.7 | −6.2 | −9.8 | −10.3 | 7.5 | −7.2 | −9.7 |
Table 2.
Parameters of the φ-algorithm adopted for signal detection.
| Parameter | Noise Level | ||||
|---|---|---|---|---|---|
| 1 | 2 | 3 | 4 | 5 | |
| Detection threshold, h | 1.5 × 10⁻⁸ | 6 × 10⁻⁸ | 9 × 10⁻⁹ | 1 × 10⁻⁹ | 1 × 10⁻⁹ |
| Smoothing window, M/samples | 3 | 5 | 10 | 10 | 10 |
| Time shift, s/samples | 10 | 20 | 50 | 50 | 50 |
Table 3.
Parameters of the φ-algorithm adopted for signal detection.
| Noise Level | Amplitude Threshold | STA/LTA | φ-Algorithm | FilterPicker |
|---|---|---|---|---|
| True Alarms (Out of 8)/False Alarms. | ||||
| 1 | 8/0 | 8/0 | 8/0 | 8/0 |
| 2 | 7/0 | 8/0 | 8/0 | 8/1 |
| 3 | 5/0 | 8/1 | 8/0 | 8/3 |
| 4 | 1/0 | 5/1 | 8/0 | 5/1 |
| 5 | 1/0 | 3/2 | 6/0 | 2/1 |
Table 4.
Comparison of the effectiveness of three detection algorithms on the long stream from Figure 5 (1000 events).
Table 4.
Comparison of the effectiveness of three detection algorithms on the long stream from Figure 5 (1000 events).
| Noise Level | Amplitude Threshold | STA/LTA | φ-Algorithm | FilterPicker |
|---|---|---|---|---|
| True Alarms/False Alarms | ||||
| 1 | 1000/3 | 986/19 | 1000/0 | 988/11 |
| 2 | 926/55 | 975/51 | 977/19 | 925/72 |
| 3 | 570/49 | 888/48 | 919/51 | 832/256 |
| 4 | 314/54 | 674/53 | 780/35 | 542/67 |
| 5 | 186/37 | 431/59 | 630/38 | 309/36 |
© 2019 by the authors. Licensee MDPI, Basel, Switzerland. This article is an open access article distributed under the terms and conditions of the Creative Commons Attribution (CC BY) license (http://creativecommons.org/licenses/by/4.0/).
Share and Cite
MDPI and ACS Style
Agletdinov, E.; Merson, D.; Vinogradov, A. A New Method of Low Amplitude Signal Detection and Its Application in Acoustic Emission. Appl. Sci. 2020, 10, 73. https://doi.org/10.3390/app10010073
AMA Style
Agletdinov E, Merson D, Vinogradov A. A New Method of Low Amplitude Signal Detection and Its Application in Acoustic Emission. Applied Sciences. 2020; 10(1):73. https://doi.org/10.3390/app10010073
Chicago/Turabian StyleAgletdinov, Einar, Dmitry Merson, and Alexei Vinogradov. 2020. "A New Method of Low Amplitude Signal Detection and Its Application in Acoustic Emission" Applied Sciences 10, no. 1: 73. https://doi.org/10.3390/app10010073
Note that from the first issue of 2016, this journal uses article numbers instead of page numbers. See further details here.