Properties Analysis and Preparation of Biochar–Graphene Composites Under a One-Step Dip Coating Method in Water Treatment

1
College of Materials Science and Engineering, Northeast Forestry University, Harbin 150040, China
2
Key Laboratory of Bio-based Materials Science and Technology, Ministry of Education, Northeast Forestry University, Harbin 150040, China
*
Author to whom correspondence should be addressed.
Appl. Sci. 2020, 10(11), 3689; https://doi.org/10.3390/app10113689
Submission received: 22 April 2020
/
Revised: 18 May 2020
/
Accepted: 22 May 2020
/
Published: 26 May 2020
(This article belongs to the Special Issue Recent Advances in Water Analysis and Wastewater Treatment)
Abstract
:In order to improve the adsorption efficiency of biochar in water treatment, biochar–graphene (BG) composites were prepared by the one-step dip coating method and applied to remove phthalates from water. Firstly, the materials and equipment needed for the experiment are introduced. The steps of preparing graphene oxide (GO) by the improved Hummers method and BG composites by one-step dip coating are discussed. Then, the morphology characterization, adsorption performance measurement, and isothermal model of BG composites are introduced. Finally, the structure characterization, adsorption kinetics, and adsorption isotherms of BG composites are analyzed. The results show that the properties of biochar could be changed by one-step dip coating, and the biochar could form composites with graphene. Compared with biochar, biochar–graphene composites have greater surface area and porosity. When the pyrolysis temperature was 600 °C, the specific surface area of biochar was 8.4 m2g−1, and the specific surface area of the biochar–graphene composite was 221.3 m2g−1. When the temperature was 300 °C, the specific surface area of biochar was 11.01 m2g−1, and the specific surface area of biochar–graphene composite was 251.82 m2g−1. The formation of graphene on the surface of biochar can increase the stability of the composite and acts as a very high potential active site. The porous structure and surface properties of biochar–graphene composites regulate the adsorption rate of pollutant molecules, thereby improving the adsorption performance. When the adsorption equilibrium was reached, the adsorption effect of phthalate esters on the biochar/graphene composite at the pyrolysis temperature of 600 °C was the best, and the adsorption capacity of Dimethyl phthalate (DMP)was 35.2 mg/g, that of Diethyl phthalate (DEP) was 26.4 mg/g, and that of Dibutyl phthalate (DBP) was 25.1 mg/g. The adsorption effect of DMP was the best. The results of the isotherm study indicate that the adsorption of phthalates by BG composites has great potential, which provides a good theoretical basis for the application of BG composites in environmental protection in China.
1. Introduction
Since China’s reform and opening up, China’s economy has been developing rapidly, and its industrial structure has been constantly upgraded. With the rapid development, environmental pollution has become more and more serious. Environmental pollution has seriously restricted the sustainable development of China’s economy and society. Water pollution is becoming more and more serious, so it is urgent to control water pollution [1,2,3].
Water pollution refers to the fact that the intervention of certain substances in water exceeds the self-purification capacity of water, resulting in the change of physical and chemical properties and biological properties of water and the destruction of the original ecosystem of water [4,5,6,7]. The problem of water pollution not only reduces the use value of water, but also causes harm to the human body. Moreover, it will destroy the ecological environment and lead to the deterioration of water quality [8]. At present, the common water pollution treatment methods are divided into physical methods and chemical methods. Common physical methods include coagulation and flocculation, adsorption, and ultrasonic methods, while chemical methods often include chemical precipitation, solvent extraction, and separation, as well as active sludge dyeing and oxidation methods [9]. Among them, the adsorption method is widely used in water pollution treatment because of its advantages of simple operation, economic efficiency, reusability of adsorbents, and no secondary pollution. The commonly used adsorbents are activated carbon, alumina, and molecular sieves, but the high price of adsorbents limits their application in real life. Therefore, it is an urgent problem to develop a cheap and efficient adsorbent. Carbon-based materials have been widely used in various fields due to their good mechanical, chemical, physical, and thermal properties, and are of great significance to improving people’s quality of life [10]. Carbon-based materials refer to carbon-rich nanostructures such as biochar, carbon nanotubes, graphene, Graphene oxide (GO), fullerene, carbon nano fiber (CNF), and carbon nanofibers [11]. Among them, biochar is a carbon-rich solid obtained from the pyrolysis of biochar at high temperature in the atmosphere of limited oxygen or no oxygen. It has the characteristics of abundant and cheap raw materials, high porosity, large specific surface area, and wide sources, and has great development potential in the removal of water pollutants. Although biochar has many advantages, it produces by-products in the pyrolysis process, resulting in the reduction of specific surface area and functional groups of biochar, which further weakens the adsorption capacity of biochar to substances. Therefore, the performance of biochar needs to be improved by means of doping and modification [12].
To sum up, in order to improve the adsorption capacity of biochar, the biochar–graphene composite is prepared by one-step dip coating. In this research, a scanning electron microscope, X-ray photoelectron, spectrum analyzer, surface area meter, and other characterization equipment and techniques are used to analyze and characterize the morphology and element composition of biochar–graphene composites. Finally, the adsorption kinetics and adsorption isotherm results are analyzed. This research aims to provide a good idea for the application of BG composites in the field of environmental protection.
2. Methods
2.1. Experimental Materials and Equipment
The main reagents used in this experiment are shown in Table 1.
The main experimental instruments used in this research were: water bath (model: S312-40; manufacturer: Shanghai Shensheng Technology Co., LTD.; Shanghai, China); centrifuge (model: H-1850; manufacturer: Dongwang Instrument Co., LTD.; Changsha, China); ultrasonic instrument (model: SCIENTZ-IID; manufacturer: Ningbo Xinzhi Biotechnology Co., LTD.; Ningbo, China); pH meter (model: STARTER 3C; manufacturer: Ohaus (Shanghai) Co., LTD.; Shanghai, China); water bath constant temperature oscillator (model: SHY-2A; manufacturer: Changzhou Putian Instrument Manufacturing Co., LTD.; Changzhou, China); ultrasonic cleaning instrument (model: SB252-12D; manufacturer: Ningbo Xinzhi Biotechnology Co., LTD.; Ningbo, China); magnetic agitator (model: S312-40; manufacturer: Shanghai Shensheng Technology Co., LTD.; Shanghai, China); electronic balance (model: CAV214C; manufacturer: Ohaus (Shanghai) Co., LTD.; Shanghai, China); electric blast dryer (model: DHG-9023A; manufacturer: Shanghai precision experimental equipment co., LTD.; Shanghai, China); water bath constant temperature oscillator (model: SHY-2A; manufacturer: Changzhou Putian Instrument Manufacturing Co., LTD.; Changzhou, China); tubular electric furnace (model: SK-G06123K; manufacturer: Tianjin Zhonghuan Experimental Electric Furnace Co., LTD.; Tianjin, China); transmission electron microscope (model: JEM-1230; Tianjin Zhonghuan Experimental Electric Furnace Co., LTD.; Tianjin, China); Infrared Spectrum (model: Spectrum One; manufacturer: PerkinElmer; Waltham, Massachusetts, USA); X-ray diffractometer (model: D/max-2500; manufacturer: Rigaku; Tokyo, Japan); specific surface and aperture distribution analyzer (model: Autosorb-1; manufacturer: Quantachrome Instruments; Florida, USA); UV spectrophotometer (model: UV-2350; manufacturer: Shimadzu; Shimadu, Japan).
2.2. Synthesis of the GO
In this research, the improved Hummer method was used to prepare GO [13,14,15,16]. The preparation process was as follows: First, 40 mL of concentrated sulfuric acid was cooled at 0 °C, and then 8.50 g of K2S2O8 was added to fully stir and dissolve it. Then, 8.50 g p pentoxide powder was added under full stirring and dissolution. Then, 200 g of graphite powder was added to the mixed solution for water bath heating reaction at 80 °C for 4 h. After the reaction, deionized water was used for cooling, and 12 h after the reaction, deionized water was used for washing to neutral. After vacuum drying at 60 °C, the product was graphite oxide, and the pre-oxidation stage was completed. During the oxidation stage, a mixture of pre-oxidized powder (10 g), potassium permanganate (40 g), and sodium nitrate (5 g) was added to 98% concentrated sulfuric acid (230 mL). The reaction condition was 35 °C for 2 h. The resulting product was cleaned and oscillated at 90 °C for 1 h. The deionized water was added. Then, it was oscillated for 2 h at room temperature and cleaned with 10% HCl to neutral. Ultrasonic cleaning was then carried out for 2 h at 50 °C to yield a yellowish GO dispersion. The technical roadmap of the preparation process is shown in Figure 1.
2.3. Preparation of BG Composites Based on One-Step Dip Coating Method
The biochar obtained in this research was mainly from wood. Two kinds of biochar and BG composites were prepared by wood bio pyrolysis at different temperatures.
2.3.1. Preparation of Biochar
The specific preparation method was as follows: Firstly, the obtained wood chips were washed with water, dried overnight in a 105 °C oven, and then air-dried for 2 days. The raw biochar was then ground through a high-speed rotary machine to obtain the powdered biochar, which could pass through a 100 mm mesh screen. Then, 100 mm biochar powder was placed in a ceramic pot after being sieved and covered tightly. Pyrolysis was conducted in a tube furnace, and the pyrolysis conditions were set at 300 °C and 600 °C, respectively. Pyrolysis was carried out for 2 h under oxygen restriction conditions to avoid calcination of biochar in the presence of oxygen. During the pyrolysis process, the heating rate was controlled at 5 °C/min for slow pyrolysis to produce more solid residues (biochar). Biochar samples were washed with deionized water for 24 h under magnetic agitation to remove the water-soluble inorganic materials. It was washed repeatedly until the pH was neutral, and dried in the drying box. Finally, biochar was obtained through a filter of 0.22 μm. To control the size of biochar, the charred solids were passed through a 500mm sieve, and the resulting product was a biochar sample. The products obtained at different temperatures were labeled as B300 and B600, respectively, with the subscripts for each indicating different combustion temperatures.
2.3.2. Preparation of BG Composites
In this research, BG composites were prepared by one-step dip coating. First, 20 g biochar was immersed in 200 mL (0.1% by mass) of the GO nanometer suspension prepared in this research and stirred for 1 hour. The initial mass loss during biochar treatment with GO suspension was less than 1% due to the fact that biochar tends to adhere to the wall during the agitation process. The mixture was then dried in an oven at 80 °C for 3 h. The pre-treated biochar was pyrolyzed in a muffle furnace at 300 °C and 600 °C to produce BG composites. The sample was then washed (four times) with deionized water to remove the water-soluble inorganic material. The resulting products were labeled as BG300 and BG600, respectively. Similarly, the subscripts for each indicate different combustion temperatures.
2.4. Characterization of Biochar and BG Composites
In this research, the morphology characteristics of biochar and BG composites were characterized by means of scanning electron microscopy (SEM), transmission electron microscopy (TEM), and X-ray photoelectron spectroscopy (XPS). During the morphology characterization, the samples of biochar and biochar-graphene composite materials needed to be dried for the SEM test, and then the powder samples were fixed on the sample stage with conductive adhesive. After 30 s of gold spraying, the internal morphology and element composition of the samples were observed by transmission electron microscopy and XPS for analysis. XPS enabled quantitative and qualitative analysis of the elements indicated by biochar and BG composites. Test results were processed by XPSPEAK4.1 analysis software (Manufacturer: UK Kratos Company; Manchester, England) [17,18,19,20].
In this research, specific surface area (SA)/pore size was compared, and a specific surface area/pore size analyzer was used to determine the specific surface area and pore size distribution of biochar and biochar-graphene composites. The samples were degassed at 100 °C before the nitrogen isothermal adsorption-desorption test [21,22].
Positron annihilation works by using spin antiparallel p-Ps in which the electrons annihilate in the form of 2γ. It lasts a very short time in vacuum, about 125 ps. The positive and negative electrons in the spin-parallel o-Ps annihilate in the form of 3γ, and their vacuum existence time is 1000 times longer than that of p-Ps, which is about 142 ns. However, in all condensed matter, the annihilation life of o-Ps has been found to be shorter than its intrinsic life in vacuum because in many materials, when o-s interacts with molecules or atoms, the positrons pick up a spin-antiparallel electron from the surrounding medium and annihilate with it in the form of 2γ; this process is called "pick up annihilation". This process is the conversion of o-Ps to p-Ps annihilation, reducing the annihilation lifetime to a few nanometers.
2.5. Adsorption Kinetics and Isothermal Model
The adsorption dynamic isotherms of phthalates (PAEs) were obtained by batch equilibrium experiments. The determination process was as follows: Dimethyl phthalate (DMP), diethyl phthalate (DEP), and dibutyl phthalate (DBP) were dissolved in methanol as a reserve solution and then diluted to a solution containing 0.02 mol NaCl (maintaining a constant ion concentration) and 200 mg/L NaN3 (pH = 7.0 ± 1). The percentage by volume of methanol had to be kept below the volume ratio of 0.10% to minimize the role of the cosolvent. For DMP and DEP, adsorption experiments were performed in an 8 mL glass bottle with a Teflon-lined screw cap. Adsorption kinetics was studied with the initial concentration of DMP and DEP at 10 mg/L. The adsorption kinetics of DBP was studied at an initial concentration of 4 mg/L. The solid/water ratio was 5 mg at 300 °C and 3 mg at 600 °C. Residual concentrations in a series of independent samples were measured from start to 72 h. The isotherm experiments are carried out with different solid/water ratios. For DMP and DEP, 5 mg and 3 mg biochar and 8 mL solution were added to each vial, respectively. For DBP, 5 mg and 3 mg of biochar were added to the 15ml vial and place in the dark. At room temperature (25 ± 1 °C), it was shaken by a rotating shaker (rotating at 120 RPM/min) according to the balance time. During this period, all phthalates (DMP, DEP, DBP) were stable, and no significant degradation was observed. All vials were centrifuged at 2500 r/min for 10 min, and then the concentrations of DMP, DEP, and DBP of each supernatant were determined by HPLC.
In order to provide a more in-depth and reliable basis for the study of adsorption mechanism, the adsorption equilibrium isotherm was studied in detail. The temperature in the adsorption process was mainly affected by two aspects. The first was that as the temperature increased, the viscosity of the solution decreased, and the diffusion rate of the adsorbent membrane and the internal pores of the adsorbent particles increased. The second was that changing the temperature changed the adsorption balance of a specific adsorbent [23,24,25]. Therefore, in order to study the isothermal adsorption characteristics of BG composites, two typical isothermal adsorption models were used to fit the isothermal adsorption data. Each experiment was repeated three times, and then the average was taken to plot a curve.
The Langmuir isothermal model assumes that the adsorption process is adsorption in the gas-solid monolayer, and the expression is as follows:
where is the equilibrium concentration of phthalates; denotes the maximum adsorption capacity of the adsorbent on phthalate; is the adsorption capacity of unit mass dry adsorbent to phthalate ester at adsorption equilibrium; and represents the Langmuir constant related to the affinity of the adsorption site [26].
The Freundlich isothermal model is a simulation of the adsorption process occurring in heterogeneous layers without considering adsorption saturation, and the expression is as follows:
where is the Freundlich constant related to adsorption capacity, and N represents the constant related to the strength of adsorption capacity; when n < 1, this indicates that adsorption is very difficult; when 1 < N <2, it indicates that adsorption is relatively difficult; when 2 < N < 10, it indicates that the adsorption strength is high and the adsorption is easy [27].
3. Results
3.1. Structural Characterization of Biochar and BG Composites
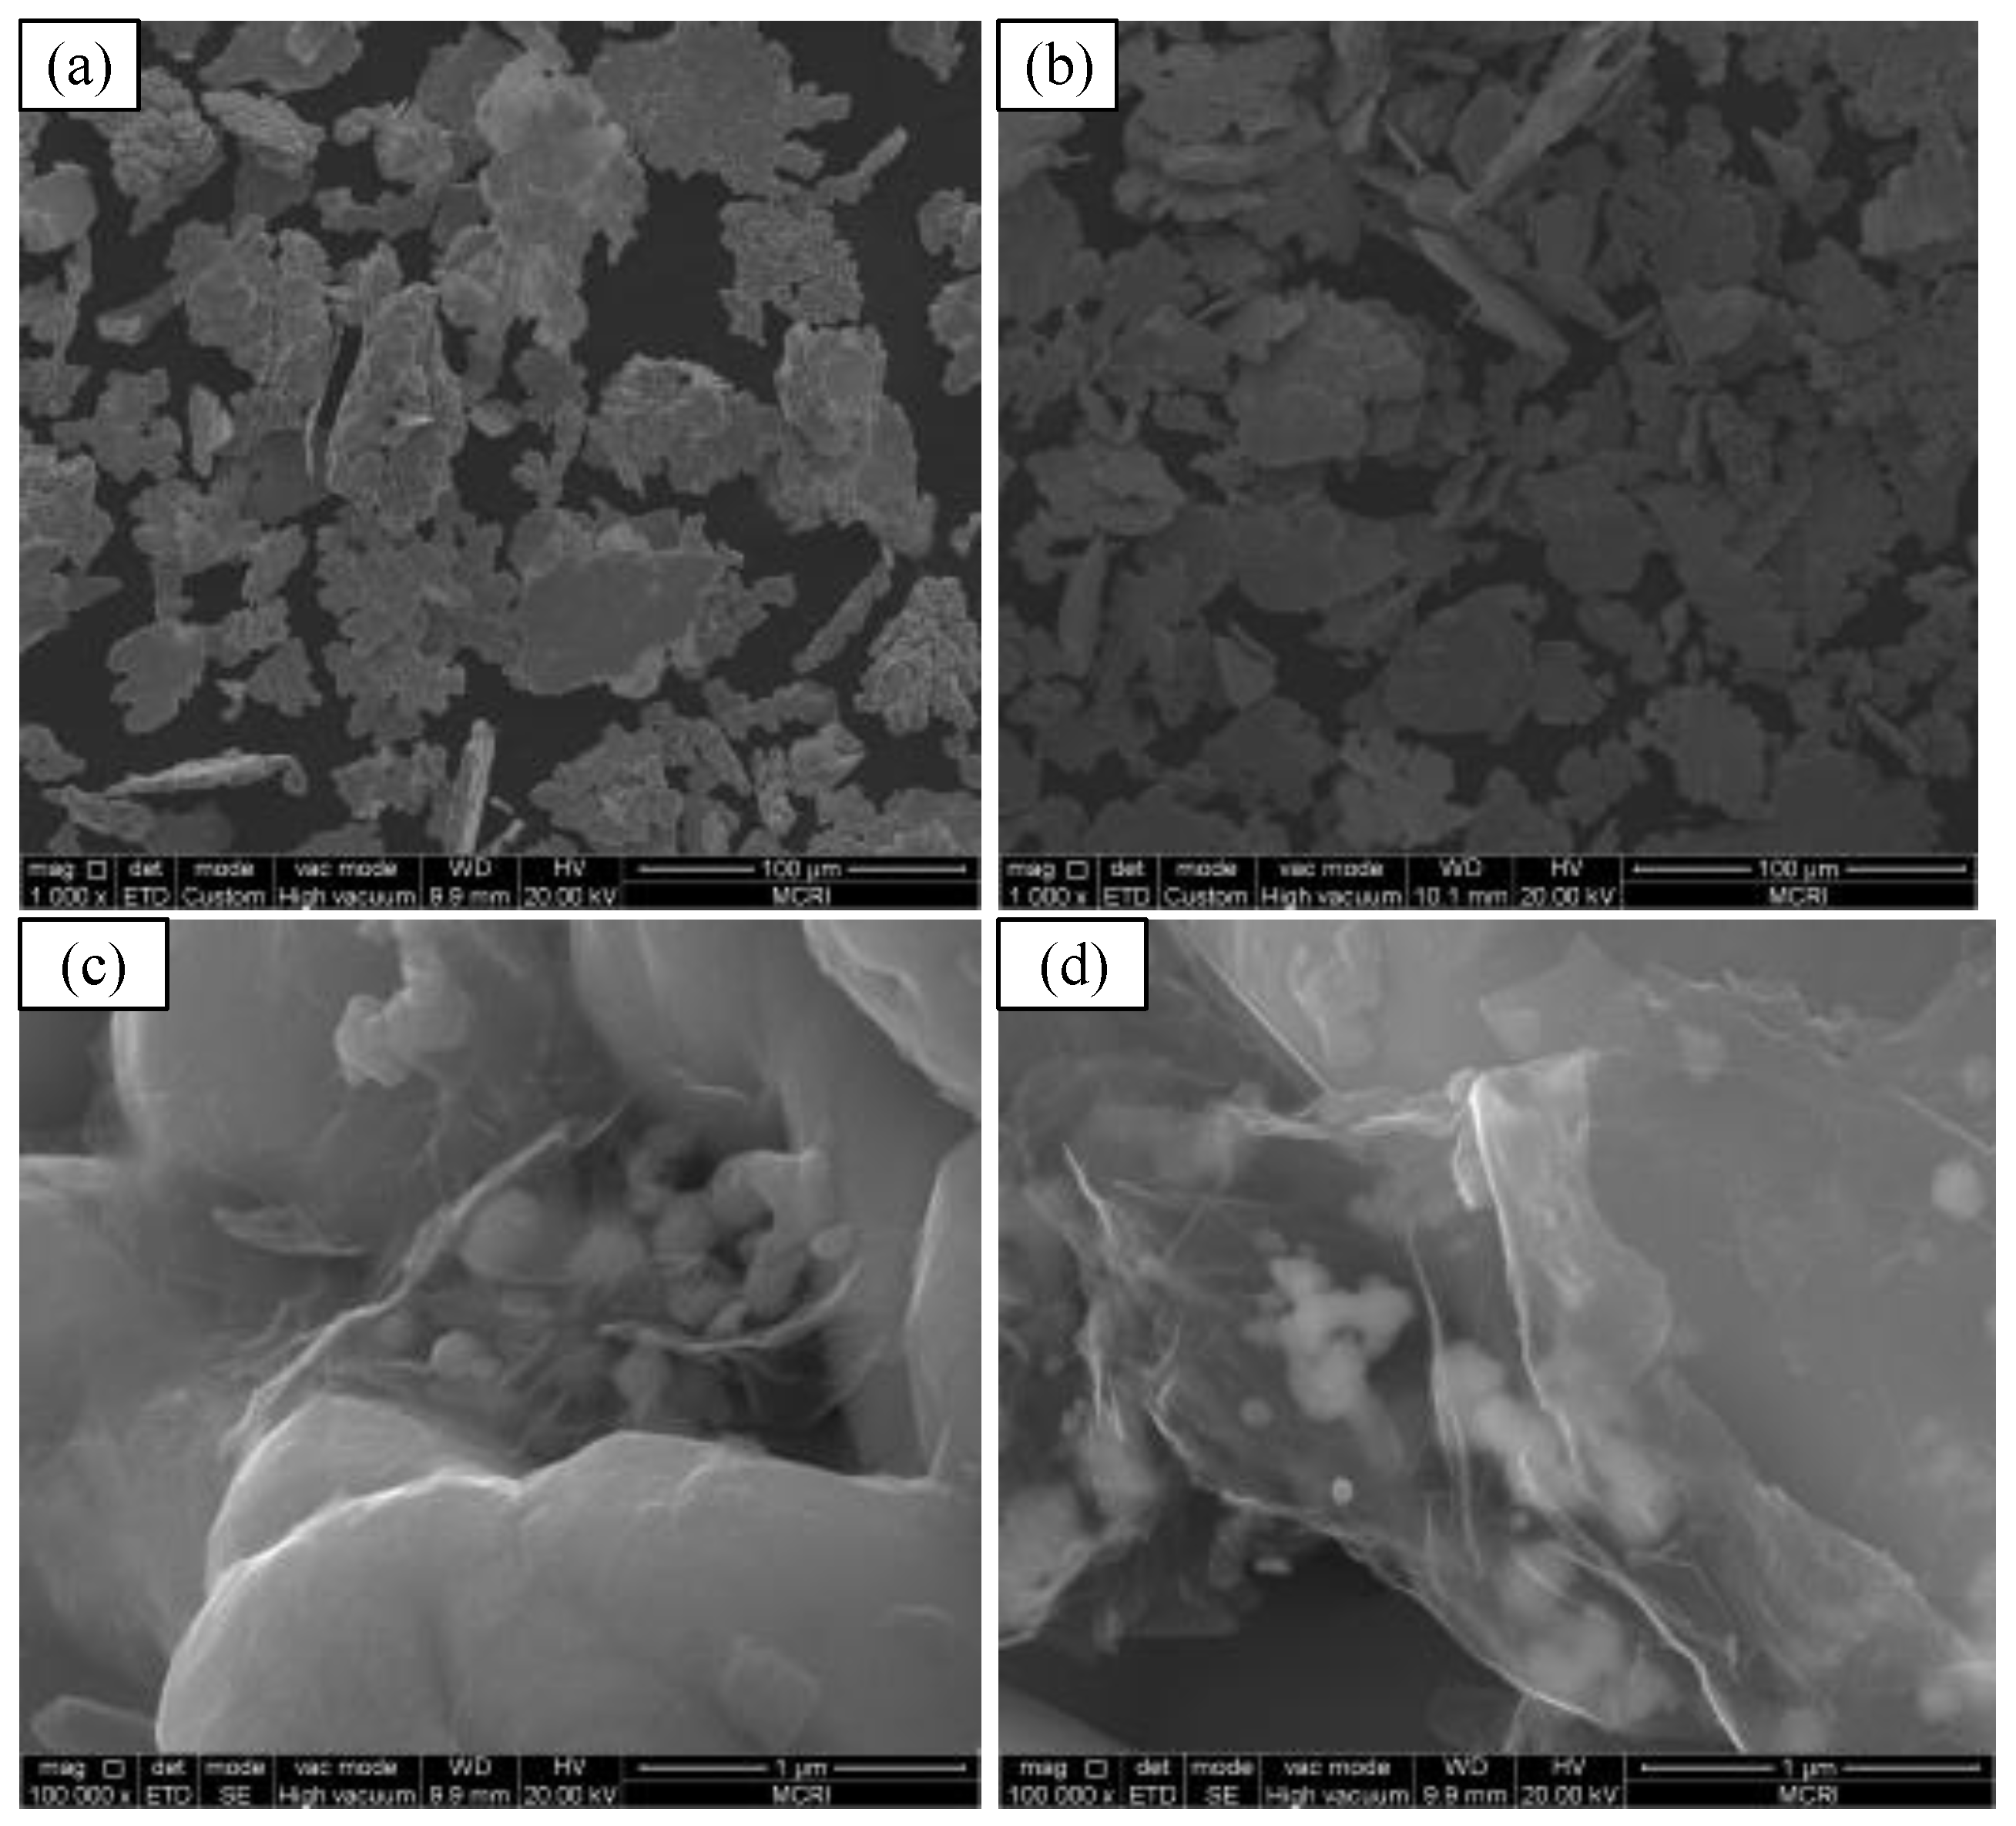
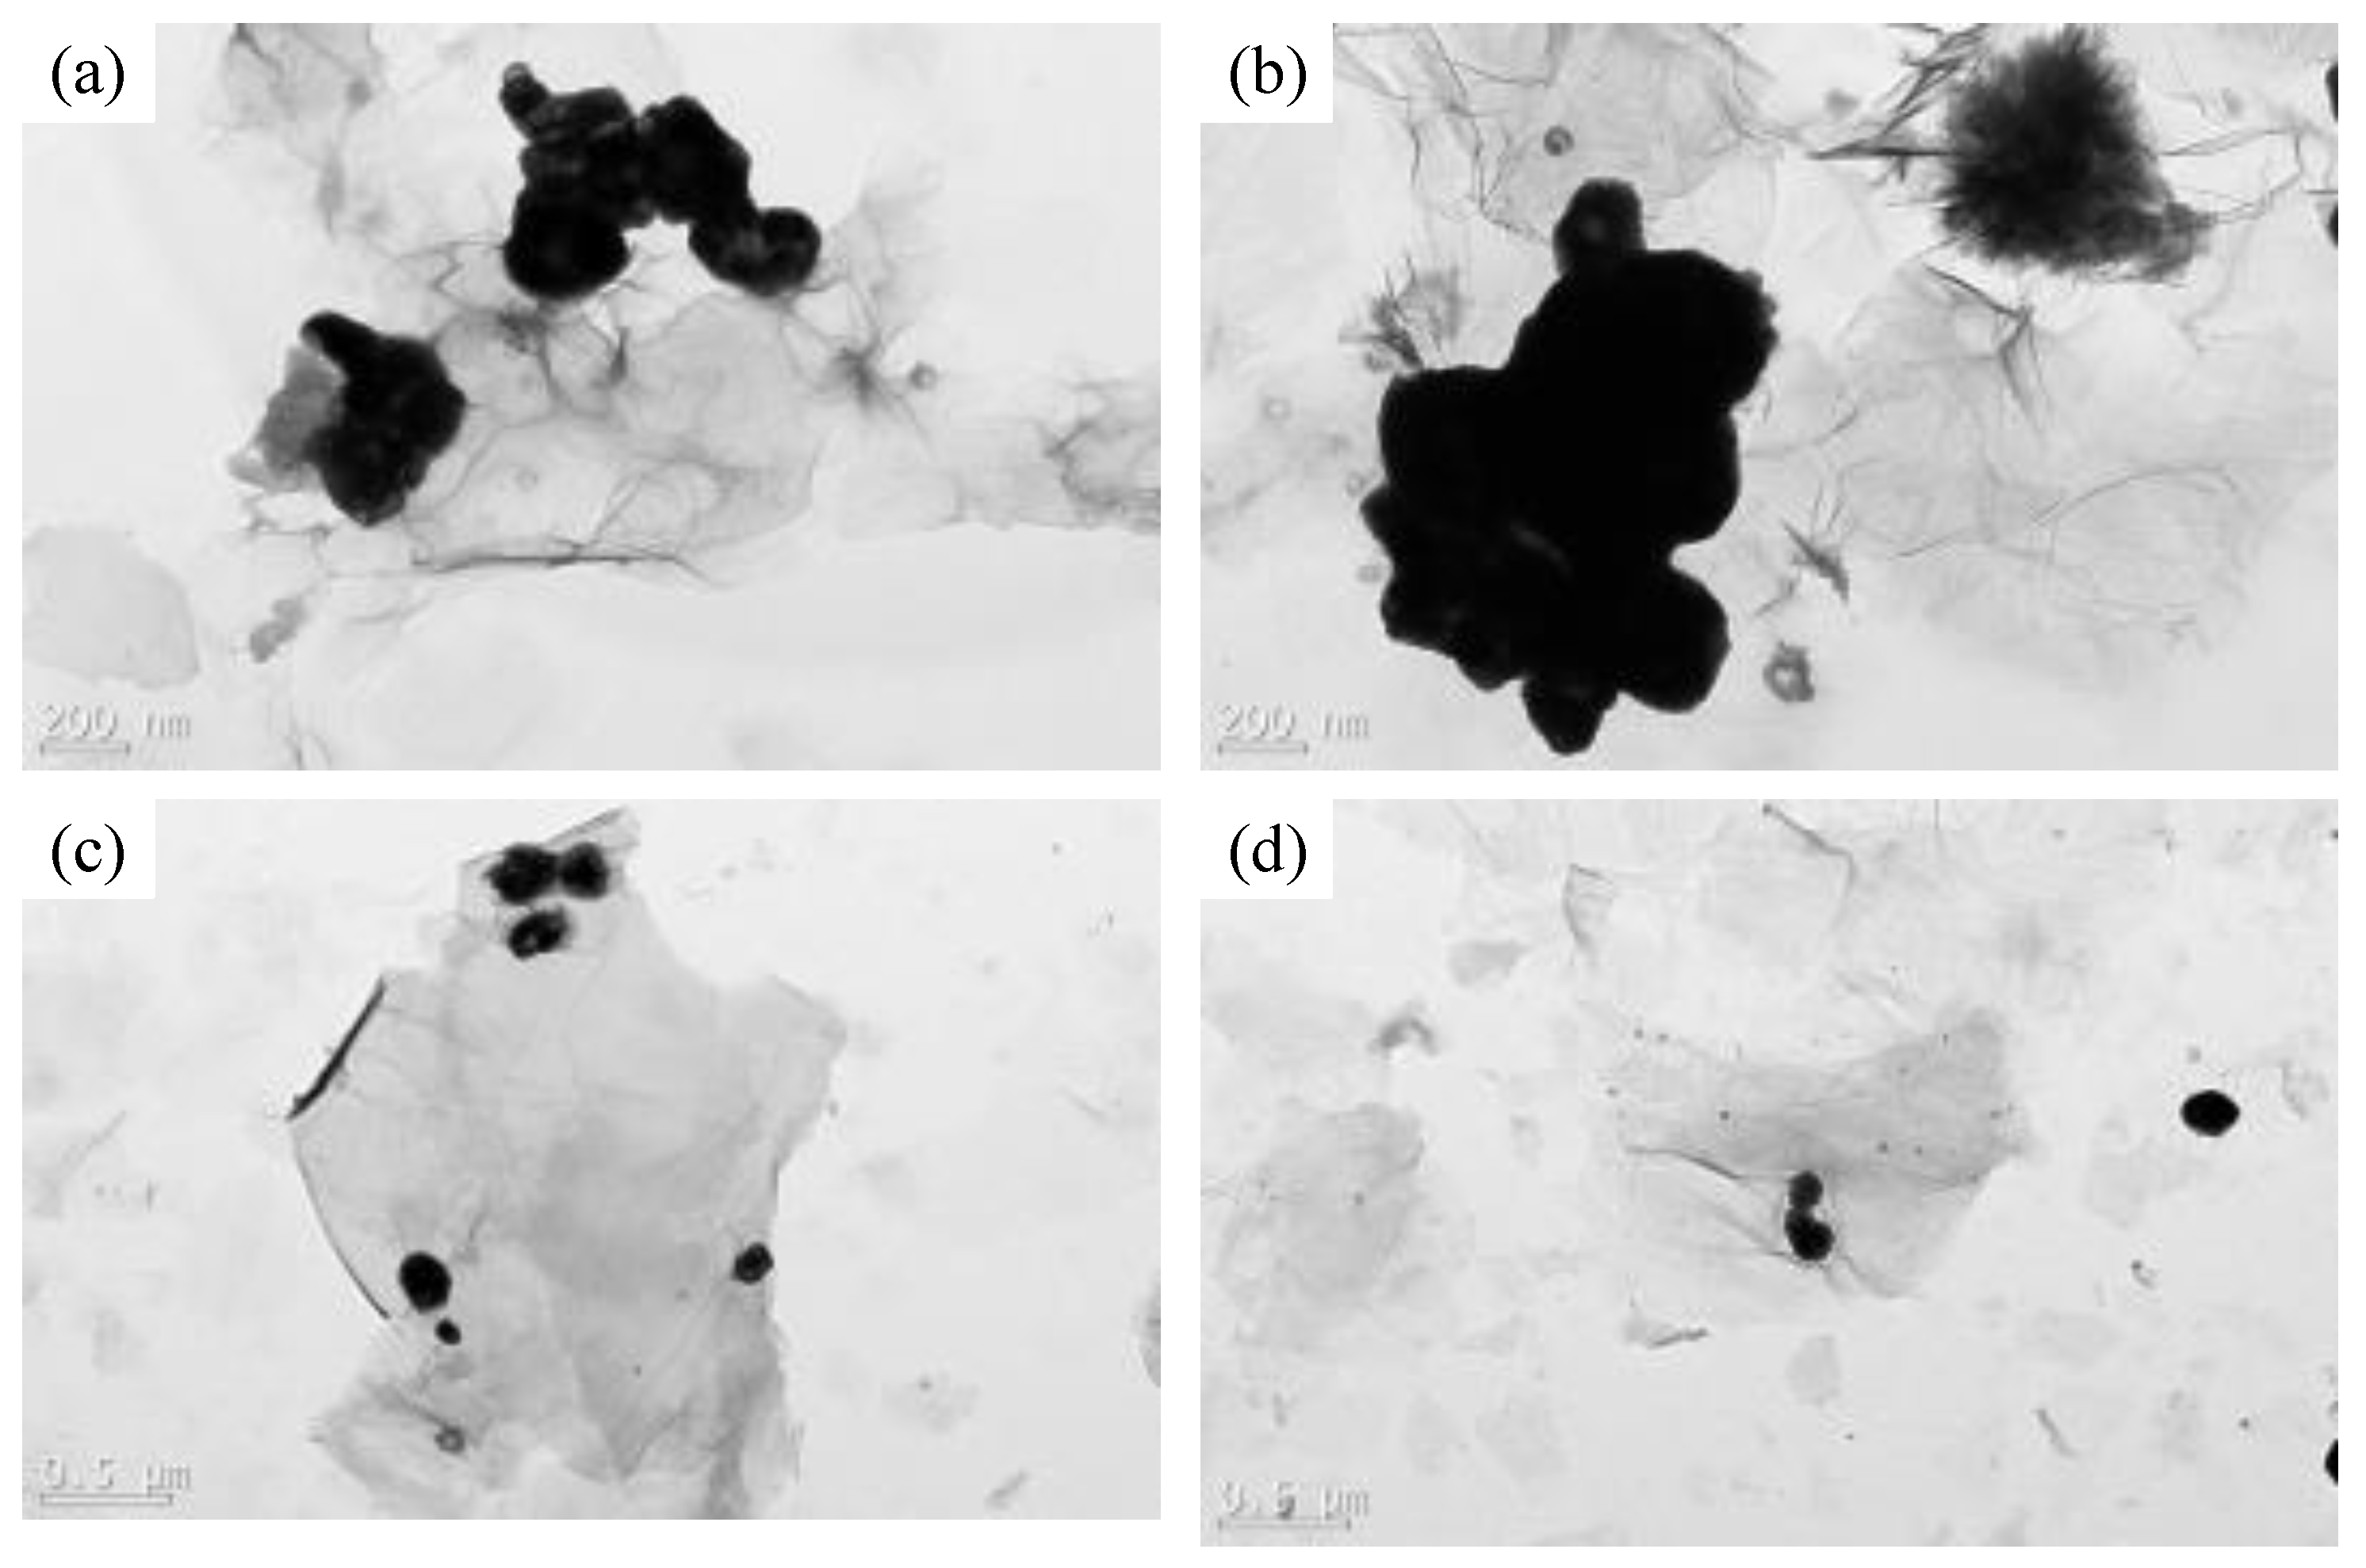
Figure 2 shows SEM images of biochar and BG composites at 300 °C and 600 °C. Figure 3 shows TEM images of biochar and BG composites at 300 °C and 600 °C. It was found from the SEM photos of biochar that biochar usually exhibited rough and porous properties at 300 °C, while the SEM photos of biochar with pores clearly show the attached graphene layer on the surface of biochar with pores. SEM and TEM results show that the slow pyrolysis could completely fuse graphene with biochar without changing the original morphology of graphene. TEM images show that graphene was transparent and slightly concentrated in biochar at either 300 °C or 600 °C. At a temperature of 300 °C, the base surface of graphene was not completely ordered, while a temperature greater than 600 °C destroyed the residual O2 group, resulting in a large number of defects. In addition, the folds of graphene were relaxed and evenly distributed, peeling randomly on the surface of biochar.
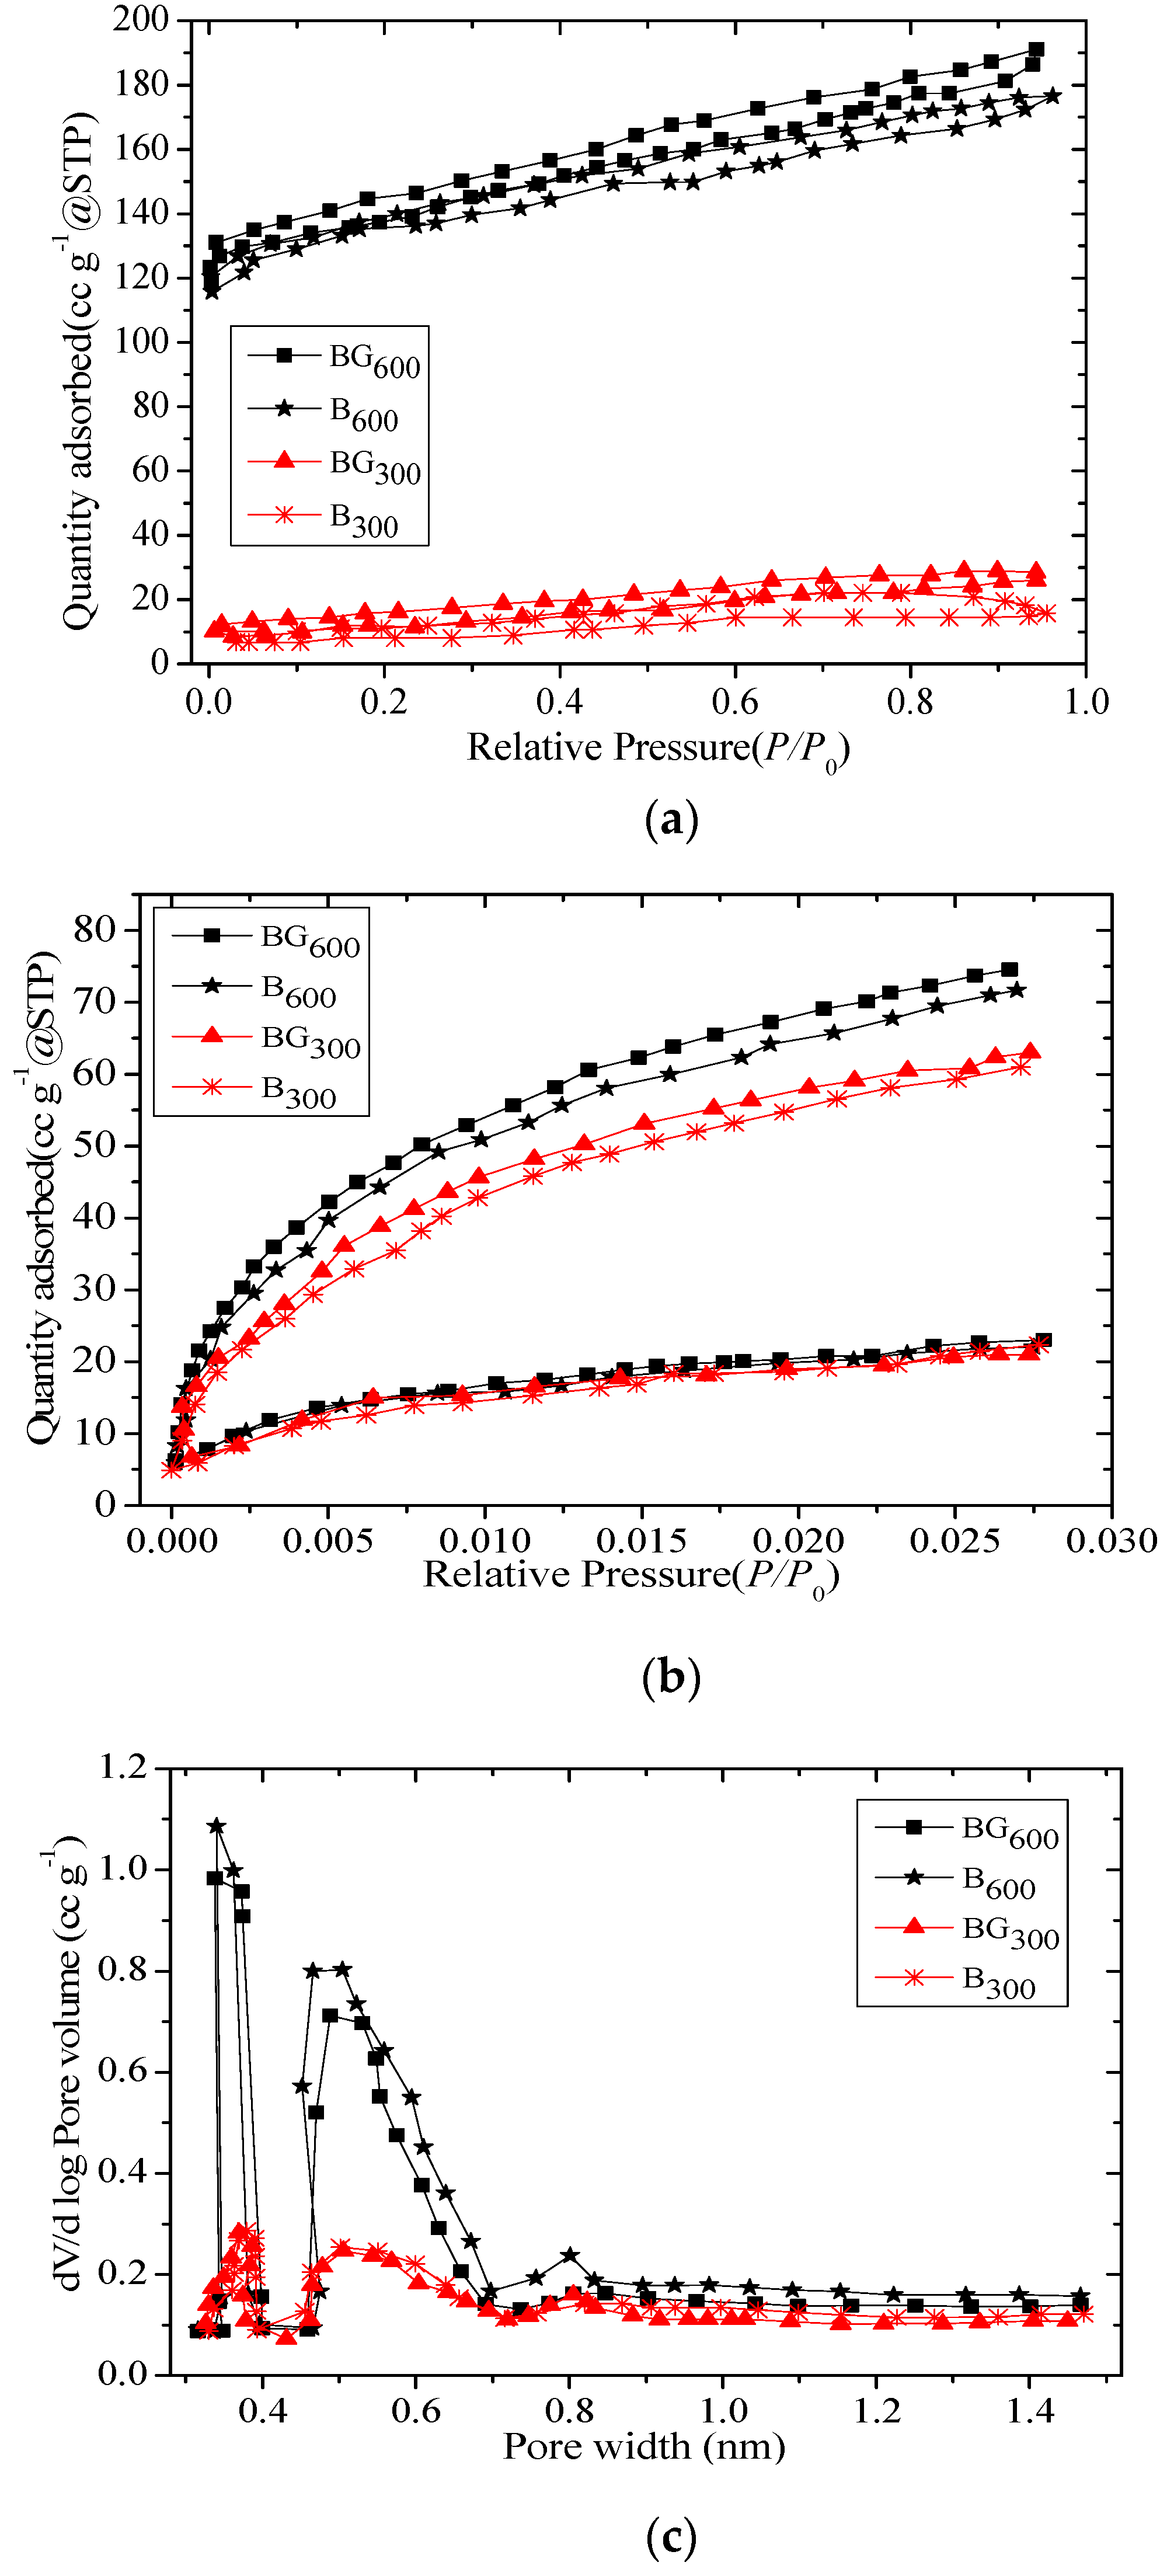
Figure 4 shows the isothermal adsorption-desorption curves and pore size distribution curves of biochar and BG composites based on N2 and CO2. Table 2 shows the specific surface area and pore volume based on XPS results. Figure 4a shows that N2-SA of biochar increased with the increase of pyrolysis temperature (according to XPS results, B300(8.4 m2g−1) < B600(221.3 m2g−1)). Adding graphene could increase the specific surface area of biochar (according to XPS results, BG300 (11.01 m2g−1) < BG600(251.82 m2g−1)). The reason is that the presence of graphene and graphite regions provided some potential adsorption sites for the incorporation of biochar-graphene composites, which also indicated that the aromatization of biochar increased with the increase of porosity [28,29]. As shown in Figure 4b, the CO2-SA of biochar also increased from 117.70 m2g−1 to 367.71 m2g−1 at 300 °C. Similarly, BG composites increased from 121.94 m2g−1 to 455.98 m2g−1, which indicated that micropores already existed in B300 and BG300 biochar, and the affinity with graphite was higher in CO2-SA than in N2-SA. With the increase of pyrolysis temperature, the pore size of BG600 increased significantly, indicating that there were more micropores in BG600 than in B600. The difference between CO2-SA and N2-SA further indicated that the structure of biochar and biochar-graphene composites did not change at the pyrolysis temperature of 300 °C, while the structure of biochar-graphene composites at 600 °C had a nanopore structure, which gradually condensed into smaller aromatic units.
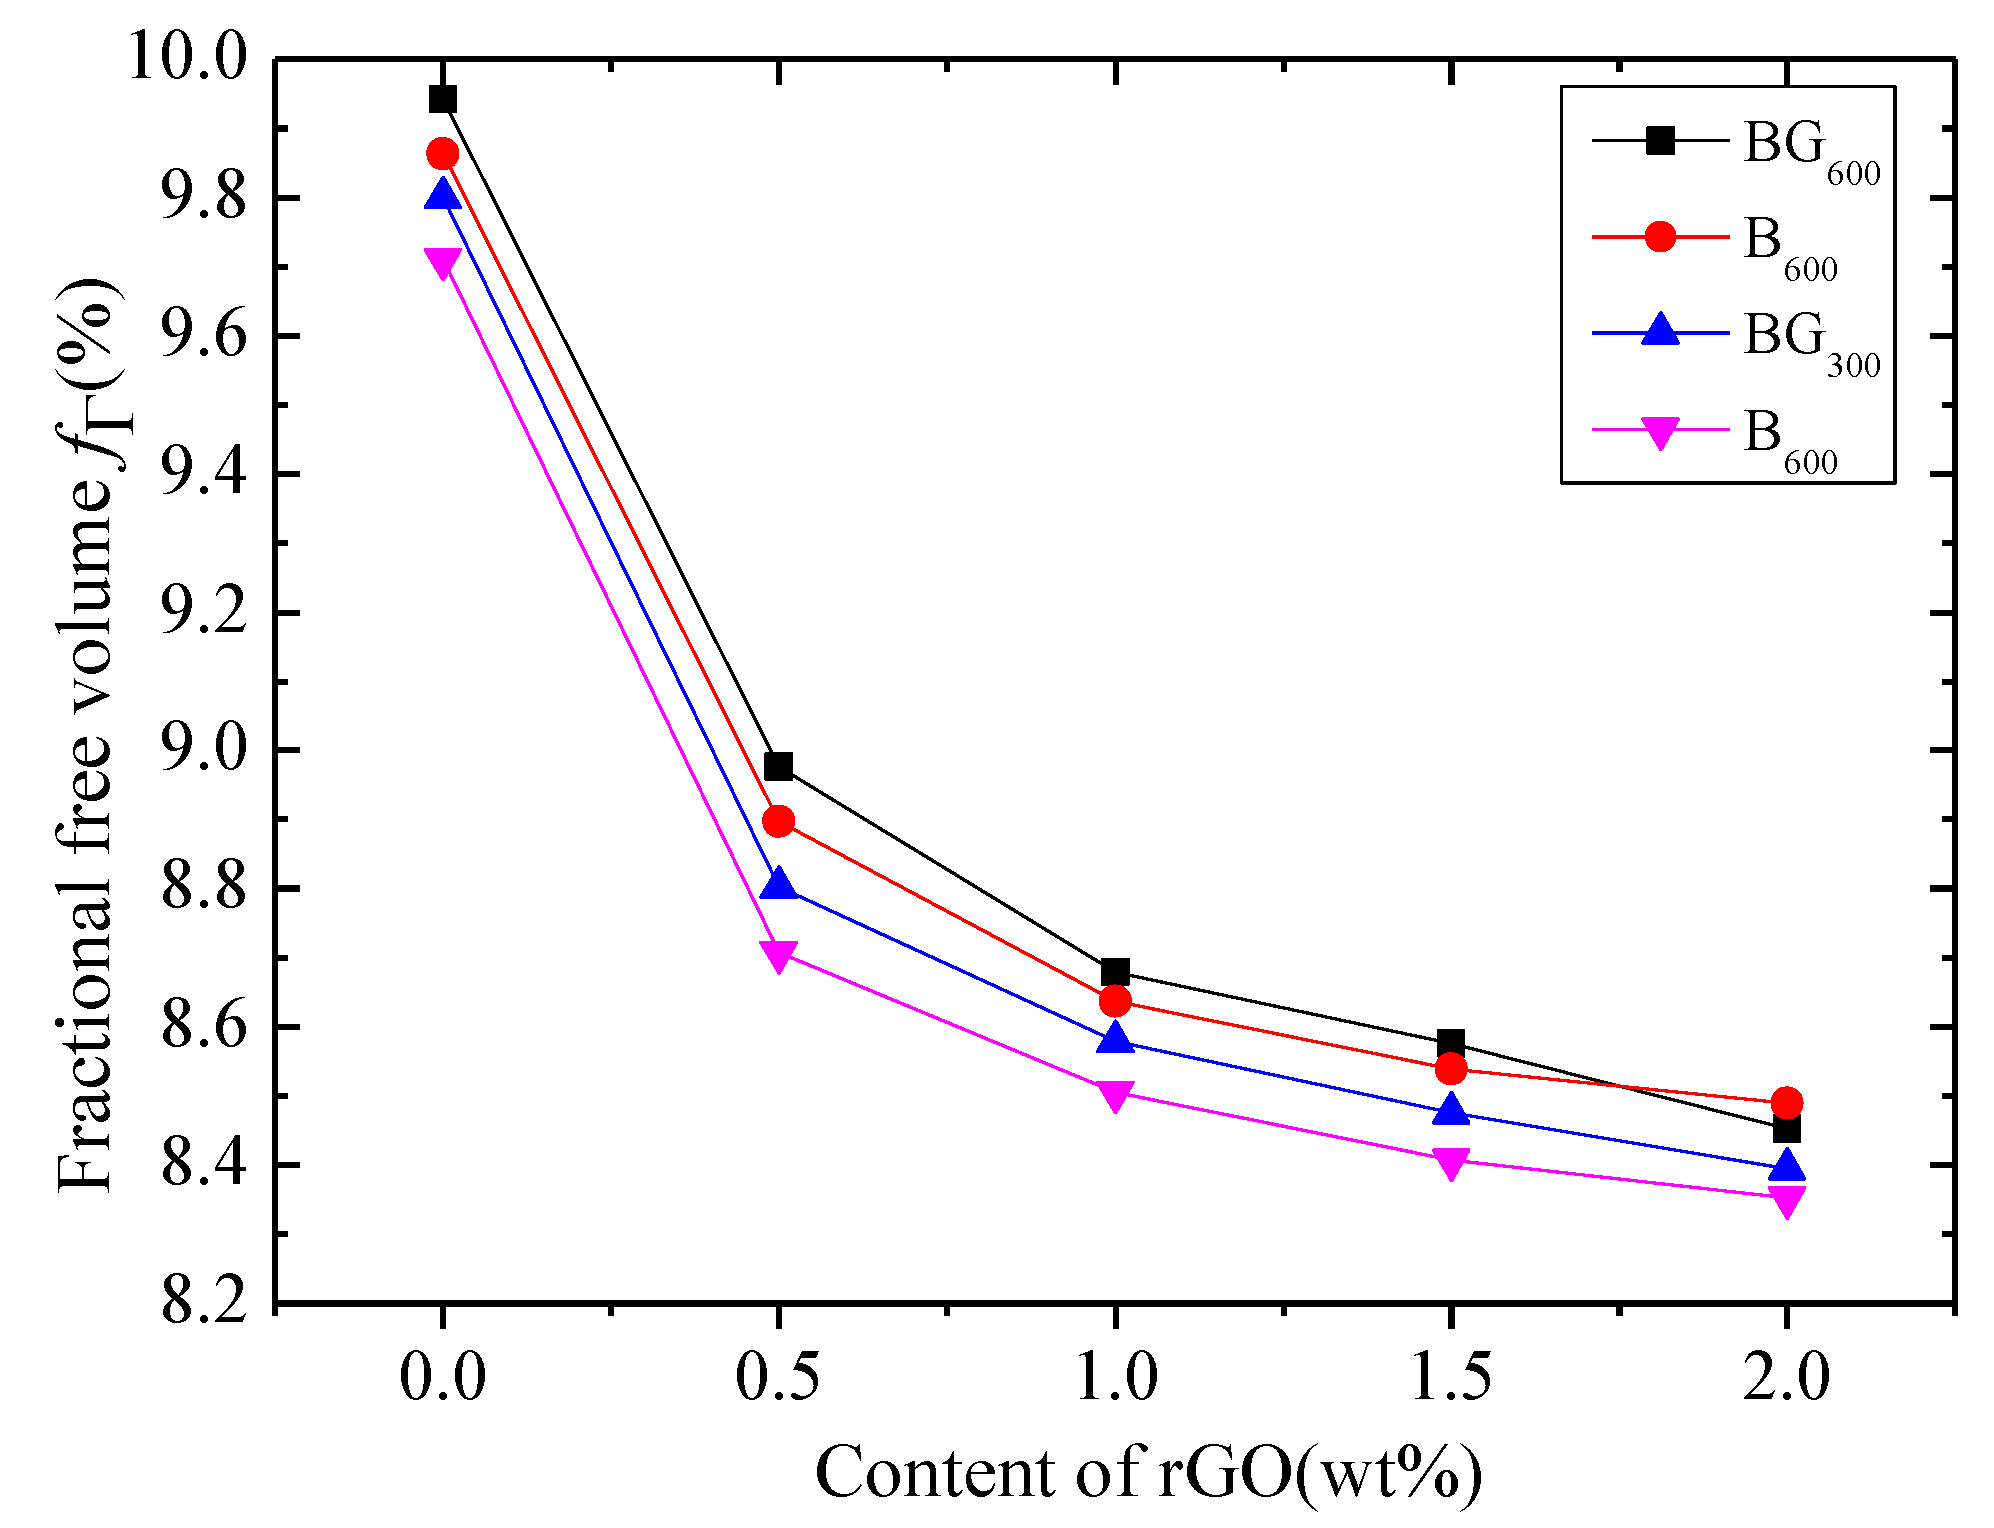
As shown in Figure 5, the relative free volume fraction decreased with the increase of graphene concentration, and N2-SA of biochar at different temperatures increased with the increase of pyrolysis temperature (according to positron annihilation results: B300 < B600). The addition of graphene could increase the specific surface area of biochar (according to positron annihilation results: BG300 < BG600). The reason is that the relative free volume fraction decreased with the increase of graphene concentration, which means that the overall effect of graphene limited the mobility of biochar molecular chains. The accumulation density of biochar molecules increased, which increased the surface area of graphene composites. Therefore, the positron annihilation result was consistent with the XPS result.
3.2. Adsorption Kinetics of Biochar and BG Composites
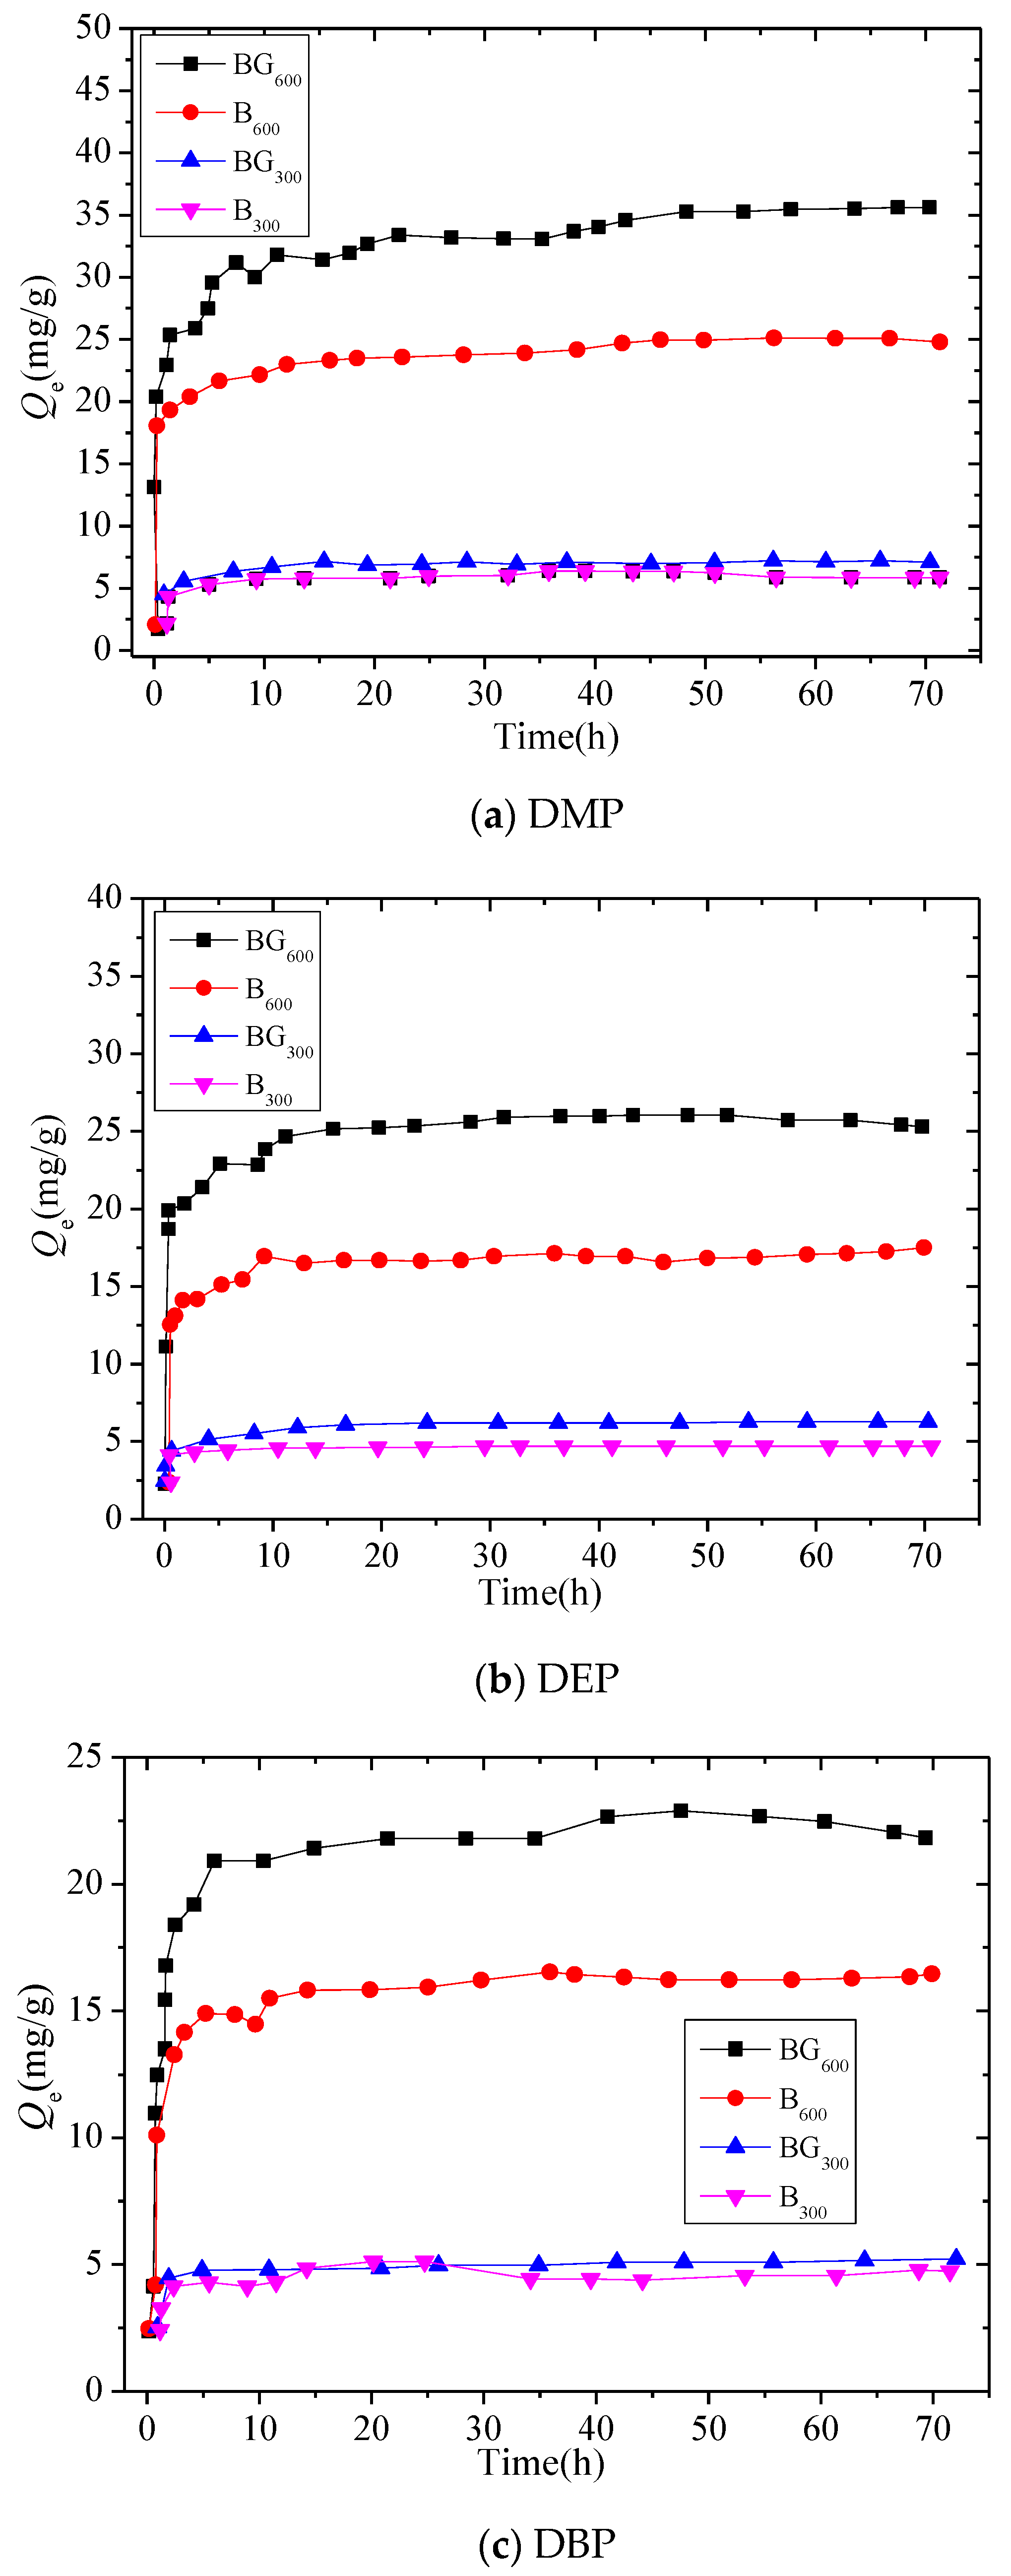
The adsorption kinetics of phthalates on biochar and BG composites were studied by pseudo-primary and pseudo-secondary kinetic models. Figure 6 shows the adsorption kinetics curves of phthalates on biochar and BG composites. Table 3 shows the kinetic parameters of adsorption of biochar and biochar-graphene composites on dimethyl phthalate (DMP), diethyl phthalate (DEP), and dibutyl phthalate (DBP). As concluded from Figure 5 and Table 3, for both biochar materials and biochar-graphene composites, the adsorption rate of biochar increased rapidly within the first 24 h and reached the adsorption equilibrium within about 48 h. The correlation coefficient (radj2) of the pseudo-secondary model was higher than that of the pseudo-primary model, which indicated that the pseudo-secondary model had higher adsorption capacity. The adsorption rate of biochar increased rapidly in the first 24 h and reached adsorption equilibrium in about 48 h. When the temperature dropped from 600 °C to 300 °C, the adsorption rate of biochar decreased accordingly. This result suggests that the porosity and structural differences of biochar may lead to diffusion interaction time, which delays the adsorption of the initial PAEs. Similarly, in biochar-graphene composites, a trend of decreasing adsorption rate with temperature appeared, indicating that graphene provided additional diffusion for initial PAEs adsorption. These results show that under the combined action of temperature and graphene, the higher the mobility of PAE molecules, the faster they would approach the surface of biochar in a shorter time and have a higher initial adsorption rate. Therefore, for the adsorption effect, B300 < BG300 < B600 < BG600. When the adsorption equilibrium was reached, the adsorption effect of BG600 was the best, especially the adsorption amount of DMP, which was 35.2 mg/g; the adsorption rates of DEP and DBP were 26.4 mg/g and 25.1 mg/g, respectively.
3.3. Adsorption Isotherms of PAEs on BG Composites
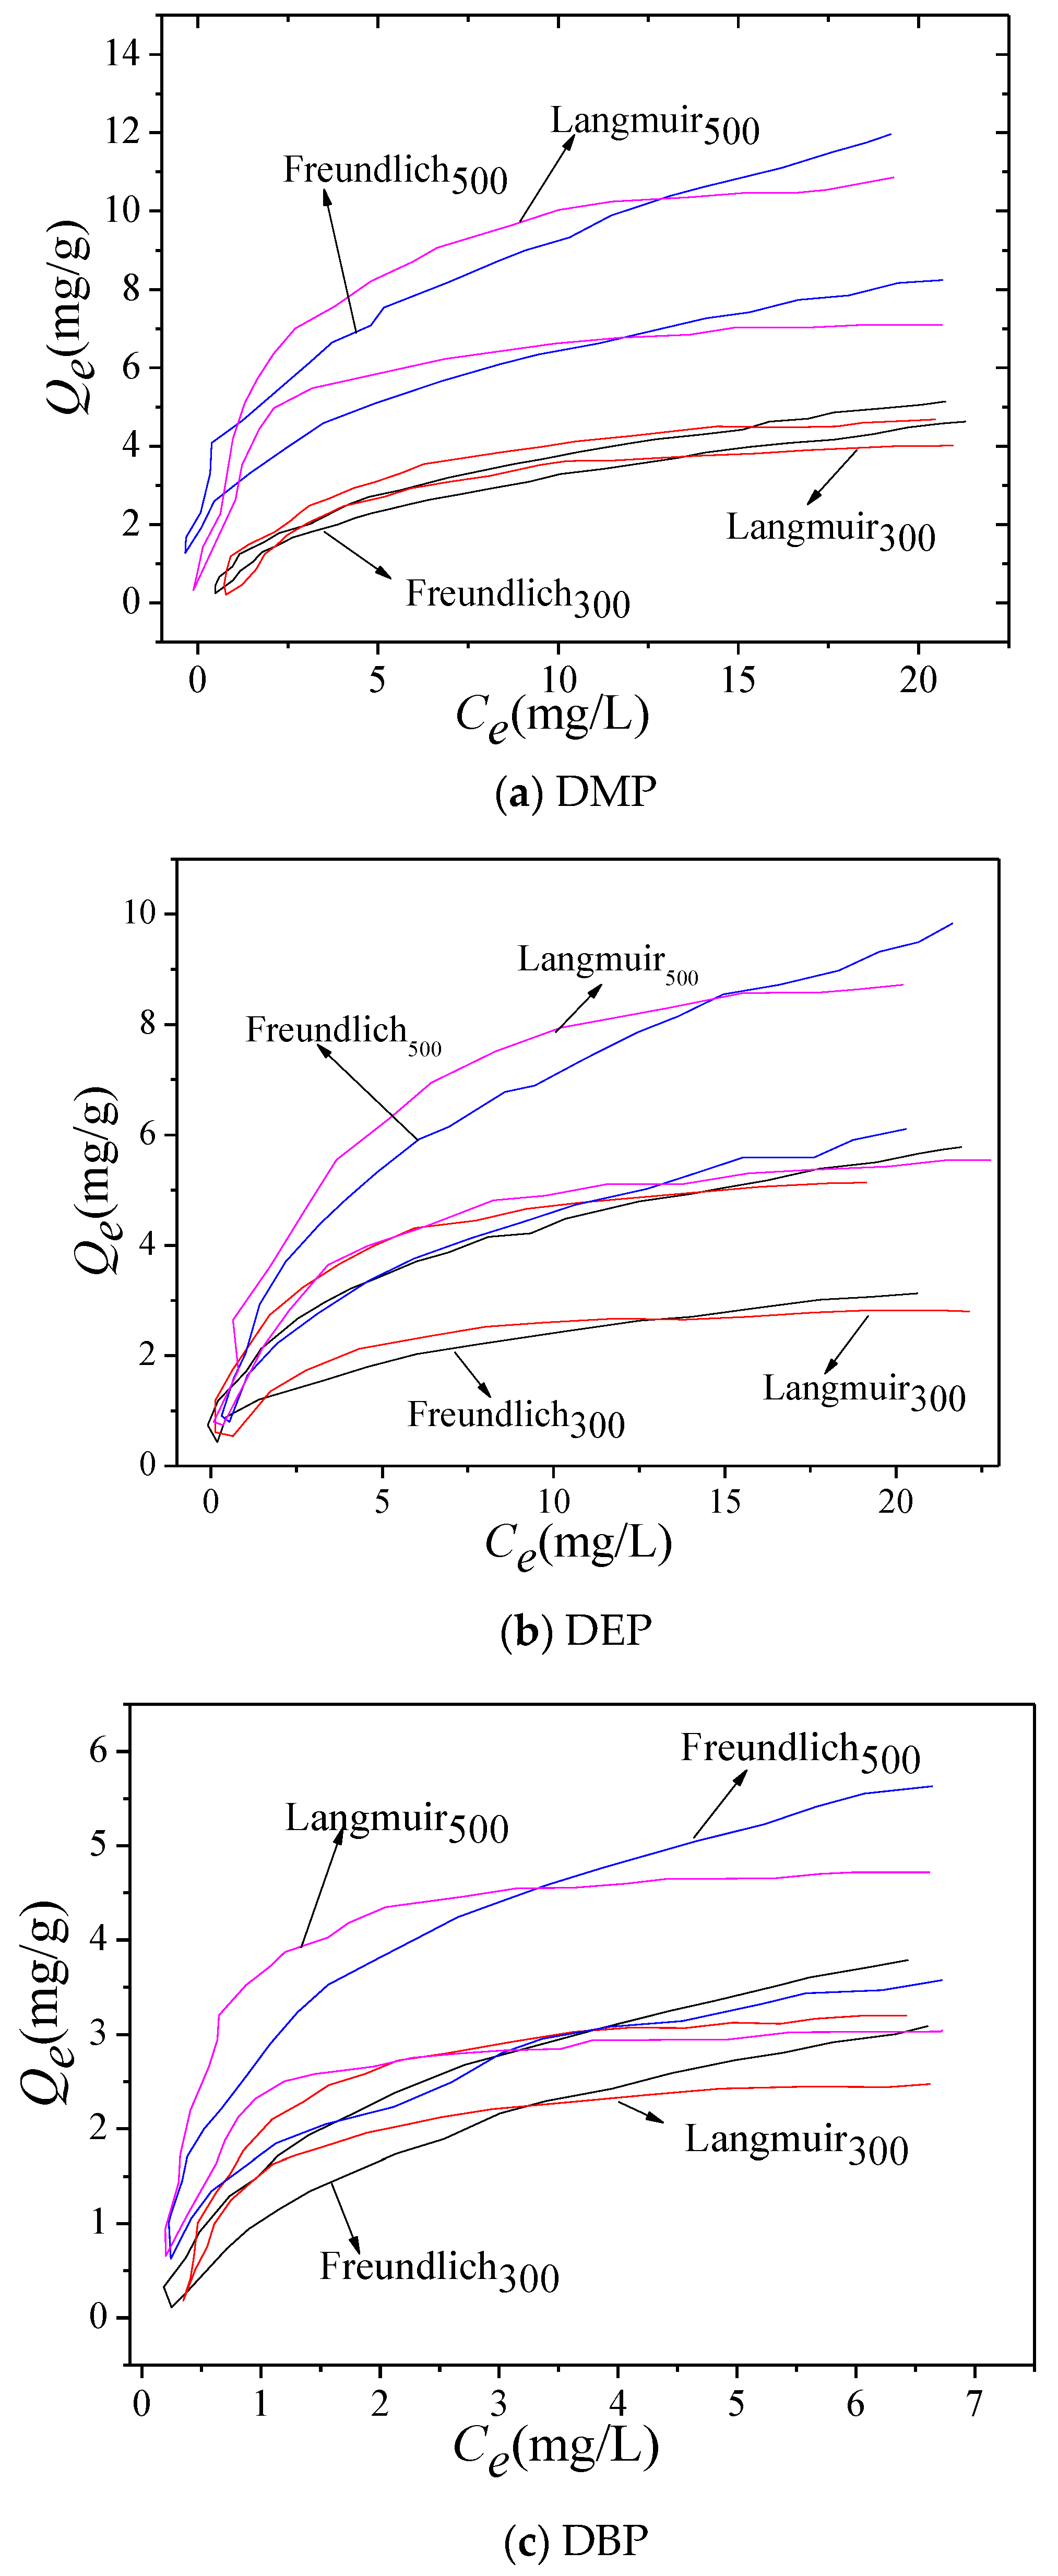
Figure 7 shows the isothermal adsorption curves of biochar-graphene composite materials including DMP, DEP, and DBP fitted by the Freundlich model and Langmuir model, respectively. The adsorption capacity of BG composites pyrolyzed at 300 °C was less than that of BG composites pyrolyzed at 600 °C. The reason for this phenomenon was the change of specific surface area of biochar. The larger the specific surface area, the stronger the adsorption property of the composite material. The adsorption capacity of biochar-graphene composites to PAEs was absolutely higher than that of biochar at this temperature, indicating that graphene can be used as a potential site to improve adsorption. The isotherms adsorbed by PAEs were characterized by different Kp values, while the N values adsorbed by a single PAE were not significantly different from each other. Therefore, the Freundlich N value presented a highly nonlinear trend, and the Kr increased accordingly. The N value of the Freundlich model indicated that the surface of the BG composite was non-uniform, and the higher N value indicated the homogeneous surface with narrow adsorption site distribution.
In this study, the adsorption properties of biocarbon-graphene composites were discussed and compared with the commonly used adsorbents, which mainly include activated carbon, chitosan, biological adsorbent, clay mineral material, modified corn cob, polymer resin, and other materials. All these adsorbents have abundant pore structure and surface groups to adsorb PAEs. Wang used Wutong to prepare activated carbon. After phosphoric acid modification, the porosity of activated carbon increased, the pore diameter decreased, the specific surface area increased, and the adsorption effect was better than before modification. The specific surface area of biochar prepared by the modified method was 15.9 m2g−1, which was 15 times larger than that of the biochar-graphene composite prepared in this study. In addition, the study revealed that the pH value would affect the adsorption of adsorbent on PAEs. After the study of the adsorption effects under different pH values, it was found that the optimal adsorption effect was obtained when the pH value was 13, and the surface of the modified activated carbon was positively charged, increasing the electrostatic adsorption effect with PAEs [30]. Moazzen et al. prepared biochar with peanut shell by the oxygen-controlled heating carbonization method. At three preparation temperatures, biochar showed different element contents. The adsorption of the two PAEs conformed to the Freundlich equation as the degree of aromatics increased with the increase of temperature. In this study, the pseudo-two-stage model of adsorption dynamic composite dynamics of biochar-graphite composites were prepared at two different temperatures [31]. Abdul et al. successfully prepared a flake biochar nanographene complex, which showed a good adsorption effect on the three PAEs. The main mechanism of adsorption on the three PAEs was different. DMP, with a relatively small molecular mass, was directly absorbed by the complex through pore diffusion. The main mechanism of DEP adsorption was π-π interaction, while DBP was adsorbed by hydrophobic interaction between molecules [32]. The biochar-graphene composite prepared in this study shows the best adsorption effect on DMP in the adsorption process of three PAEs, followed by DEP and finally DBP. As for the cost problem, the biochar-graphene composite material obtained by preparing Graphene oxide (GO) and reducing it was used. Therefore, compared with Abdul’s direct use of graphene composite material, the cost was much less. Therefore, it has certain guiding significance for the promotion of practical application.
4. Conclusions
In order to improve the adsorption effect of biochar in water treatment, BG composites are prepared by one-step dip coating. The morphology and element composition of BG composites are characterized and analyzed by SEM, TEM, XPS, and positron annihilation. The one-step dip coating method can change the surface characteristics of biochar, enable graphene to successfully adhere to the surface of biochar, form biochar-graphene composite material, and effectively improve the specific surface area and porosity of biochar. According to the results of the study, the biochar-graphene composite pyrolysis at 600 °C has the largest surface area of 251.82 m2g−1. According to the analysis of dynamic adsorption, the biochar-graphene composite pyrolysis at 600 °C can reach the adsorption balance within 48 h, with the best adsorption effect on DMP. The adsorption balance stage is up to 35.2 mg/g. The results of adsorption kinetics show that the porous structure and surface properties of BG composites regulate the adsorption rate of pollutant molecules, thus improving the adsorption performance. The results of isotherm showed that BG composites show great potential in the adsorption of phthalates.
Although BG composites with high adsorption properties were successfully prepared in this study, there are still some limitations in this study. In this research, the adsorption mechanism of biochar-graphene composites is preliminarily explored and speculated, and it is hoped that further studies can be carried out on this research.
Author Contributions
Conceptualization, D.L.; methodology, H.G.; investigation, W.W.; data curation, Z.Y.; writing—original draft preparation, Z.Y.; writing—review and editing, D.L. All authors have read and agreed to the published version of the manuscript.
Funding
This work was supported by the Fundamental Research Funds for the Central Universities (2572018BB05), and the Natural Science Foundation of Heilongjiang Province (YQ2019C004).
Acknowledgments
The authors acknowledged the help from the Northeast Forestry University.
Conflicts of Interest
The authors declare no conflict of interest.
References
- Abdul, G.; Zhu, X.; Chen, B. Structural characteristics of biochar-graphene nanosheet composites and their adsorption performance for phthalic acid esters. Chem. Eng. J. 2017, 319, 9–20. [Google Scholar] [CrossRef]
- Huang, Q.; Song, S.; Chen, Z.; Hu, B.W.; Chen, J.R.; Wang, X.K. Biochar-based materials and their applications in removal of organic contaminants from wastewater: State-of-the-art review. Biochar 2019, 1, 45–73. [Google Scholar] [CrossRef] [Green Version]
- Nupearachchi, C.N.; Mahatantila, K.; Vithanage, M. Application of graphene for decontamination of water; Implications for sorptive removal. Groundw. Sustain. Dev. 2017, 5, 206–215. [Google Scholar] [CrossRef]
- Zhang, C.M.; Fu, X.L.; Zhang, X.X.; Li, J.Z. The Effects of Metal Complexes of Nano-Graphene Oxide to Thermal Decomposition of FOX-7. Nanomaterials 2020, 10, 144. [Google Scholar] [CrossRef] [PubMed] [Green Version]
- Wang, J.Q.; Zhang, P.; Liang, B.; Liu, Y.X.; Xu, T.; Wang, L.F.; Cao, B.; Pan, K. Graphene oxide as an effective barrier on a porous nanofibrous membrane for water treatment. ACS Appl. Mater. Interfaces 2016, 8, 6211–6218. [Google Scholar] [CrossRef] [PubMed]
- Xu, Z.W.; Wu, T.F.; Shi, J.; Teng, K.Y.; Wang, W.; Ma, M.J.; Li, J.; Qian, X.M.; Li, C.Y.; Fan, J.T. Photocatalytic antifouling PVDF ultrafiltration membranes based on synergy of graphene oxide and TiO2 for water treatment. J. Membr. Sci. 2016, 520, 281–293. [Google Scholar] [CrossRef]
- Wang, H.; Mi, X.; Li, Y.; Zhan, S. 3D graphene-based macrostructures for water treatment. Adv. Mater. 2020, 32, 1806843. [Google Scholar] [CrossRef]
- Zhao, H.; Chen, S.; Quan, X.; Hu, Y.; Zhao, H. Integration of microfiltration and visible-light-driven photocatalysis on g-C3N4 nanosheet/reduced graphene oxide membrane for enhanced water treatment. Appl. Catal. B 2016, 194, 134–140. [Google Scholar] [CrossRef]
- Wei, Y.; Zhang, Y.; Gao, X.; Ma, Z.; Wang, X.; Gao, C. Multilayered graphene oxide membranes for water treatment: A review. Carbon 2018, 139, 964–981. [Google Scholar] [CrossRef]
- Karkooti, A.; Yazdi, A.Z.; Chen, P.; McGregor, M.; Nazemifard, N.; Sadrzadeh, M. Development of advanced nanocomposite membranes using graphene nanoribbons and nanosheets for water treatment. J. Membr. Sci. 2018, 560, 97–107. [Google Scholar] [CrossRef]
- Ye, S.; Liu, Y.; Feng, J. Low-density, mechanical compressible, water-induced self-recoverable graphene aerogels for water treatment. ACS Appl. Mater. Interfaces 2017, 9, 22456–22464. [Google Scholar] [CrossRef] [PubMed]
- Mukherjee, M.; Ghorai, U.K.; Samanta, M.; Santra, A.; Das, G.; Chattopadhyay, K.K. Graphene wrapped Copper Phthalocyanine nanotube: Enhanced photocatalytic activity for industrial waste water treatment. Appl. Surf. Sci. 2017, 418, 156–162. [Google Scholar] [CrossRef]
- Bai, T.; Lv, L.; Du, W.; Fang, W.P.; Wang, Y.S. Improving the Tribological and Anticorrosion Performance of Waterborne Polyurethane Coating by the Synergistic Effect between Modified Graphene Oxide and Polytetrafluoroethylene. Nanomaterials 2020, 10, 137. [Google Scholar] [CrossRef] [PubMed] [Green Version]
- Kusiak-Nejman, E.; Morawski, A.W. TiO2/graphene-based nanocomposites for water treatment: A brief overview of charge carrier transfer, antimicrobial and photocatalytic performance. Appl. Catal. B 2019, 253, 179–186. [Google Scholar] [CrossRef]
- Zhang, Q.; Chen, S.; Fan, X.X.; Zhang, H.G.; Quan, X. A multifunctional graphene-based nanofiltration membrane under photo-assistance for enhanced water treatment based on layer-by-layer sieving. Appl. Catal. B 2018, 224, 204–213. [Google Scholar] [CrossRef]
- Meng, L.; Hu, Q.; Shi, C.; Huang, C. Roles of Graphene Additives in Optimizing the Microstructure and Properties of Ni–Cr–Graphene Coatings. Coatings 2020, 10, 104. [Google Scholar] [CrossRef] [Green Version]
- Arshad, A.; Iqbal, J.; Siddiq, M.; Ali, M.U.; Shabbir, H.; Nazeer, B.; Saleem, M.S. Solar light triggered catalytic performance of graphene-CuO nanocomposite for waste water treatment. Ceram. Int. 2017, 43, 10654–10660. [Google Scholar] [CrossRef]
- Huang, Y.; Ruan, G.H.; Ruan, Y.J.; Zhang, W.J.; Li, X.X.; Du, F.Y.; Hu, C.J.; Li, J.P. Hyper crosslinked porous polymers hybridized with graphene oxide for water treatment: Dye adsorption and degradation. RSC Adv. 2018, 8, 13417–13422. [Google Scholar] [CrossRef] [Green Version]
- Thakur, A.K.; Singh, S.P.; Kleinberg, M.N.; Gupta, A.; Aenusch, C.J. Laser-Induced Graphene–PVA Composites as Robust Electrically Conductive Water Treatment Membranes. ACS Appl. Mater. Interfaces 2019, 11, 10914–10921. [Google Scholar] [CrossRef]
- Li, Y.; Zhang, R.; Tian, X.; Yang, C.; Zhou, Z. Facile synthesis of Fe3O4 nanoparticles decorated on 3D graphene aerogels as broad-spectrum sorbents for water treatment. Appl. Surf. Sci. 2016, 369, 11–18. [Google Scholar] [CrossRef]
- Abd-Elhamid, A.I.; Aly, H.F.; Soliman, H.A.M.; Shanshory, A.A.E.I. Graphene oxide: Follow the oxidation mechanism and its application in water treatment. J. Mol. Liq. 2018, 265, 226–237. [Google Scholar] [CrossRef]
- Huang, L.; Lin, H. Engineering sub-nanometer channels in two-dimensional materials for membrane gas separation. Membranes 2018, 8, 100. [Google Scholar] [CrossRef] [Green Version]
- Li, X.; Sun, J.; Che, Y.; Lv, F.; Liu, F. Antibacterial properties of chitosan chloride-graphene oxide composites modified quartz sand filter media in water treatment. Int. J. Biol. Macromol. 2019, 121, 760–773. [Google Scholar] [CrossRef] [PubMed]
- Zhu, C.; Liu, G.; Han, K.; Ye, H.; Wei, S.; Zhou, Y. One-step facile synthesis of graphene oxide/TiO2 composite as efficient photocatalytic membrane for water treatment: Crossflow filtration operation and membrane fouling analysis. Chem. Eng. Process. Process Intensif. 2017, 120, 20–26. [Google Scholar] [CrossRef]
- Nakagawa, K.; Araya, S.; Kunimatsu, M.; Yoshioka, T.; Shintani, T.; Kamio, E. Matsuyama. Fabrication of Stacked Graphene Oxide Nanosheet Membranes Using Triethanolamine as a Crosslinker and Mild Reducing Agent for Water Treatment. Membranes 2018, 8, 130. [Google Scholar] [CrossRef] [Green Version]
- Liu, G.; Han, K.; Zhou, Y.; Ye, H.Q.; Zhang, X.; Hu, J.B.; Li, X.J. Facile synthesis of highly dispersed Ag doped graphene oxide/titanate nanotubes as a visible light photocatalytic membrane for water treatment. ACS Sustain. Chem. Eng. 2018, 6, 6256–6263. [Google Scholar] [CrossRef]
- Arshadi Rastabi, S.; Sarraf Mamoory, R.; Blomquist, N.; Phadatare, M.; Olin, H. Synthesis of a NiMoO4/3D-rgo Nanocomposite via Starch Medium Precipitation Method for Supercapacitor Performance. Batteries 2020, 6, 5. [Google Scholar] [CrossRef] [Green Version]
- Lee, B.; Suh, D.W.; Hong, S.P.; Yoon, J. A surface-modified EDTA-reduced graphene oxide membrane for nanofiltration and anti-biofouling prepared by plasma post-treatment. Environ. Sci. 2019, 6, 2292–2298. [Google Scholar] [CrossRef]
- Shakeri, A.; Salehi, H.; Nakhjiri, M.T.; Shakeri, E.; Khankeshipour, N.; Ghorbani, F. Carboxymethylcellulose-quaternary graphene oxide nanocomposite polymer hydrogel as a biodegradable draw agent for osmotic water treatment process. Cellulose 2019, 26, 1841–1853. [Google Scholar] [CrossRef]
- Wang, Z. Efficient adsorption of dibutyl phthalate from a-queous solution by activated carbon developed from phoenix leaves. Int. J. Environ. Sci. Technol. 2015, 12, 1923–1932. [Google Scholar] [CrossRef] [Green Version]
- Moazzen, M.; Khaneghah, A.M.; Sharialifar, N.; Ahmadloo, M.; ES, I.; Baghani, N.A.; Yousefinejsd, S.; Alimohammadi, M.; Azari, A.; Dobaradaran, S.; et al. Multi-walled carbon nanotubes modified with iron oxide and silver nanoparticles (MWCNT-Fe3O4/Ag) as a novel adsorbent for determining PAEs in carbonaled soft drinks using magnetic SPE-GC/MS method. Arab. J. Chem. 2019, 12, 476488. [Google Scholar] [CrossRef]
- Chen, M.; Gong, D.F. 9 Discrimination of breast tumors in ultrasonic images using an ensemble classifier based on TensorFlow framework with feature selection. J. Invest. Med. 2019, 67 (Suppl. 1), A3. [Google Scholar]
Figure 1.
Technical roadmap for the preparation of graphene oxide (GO) dispersion.
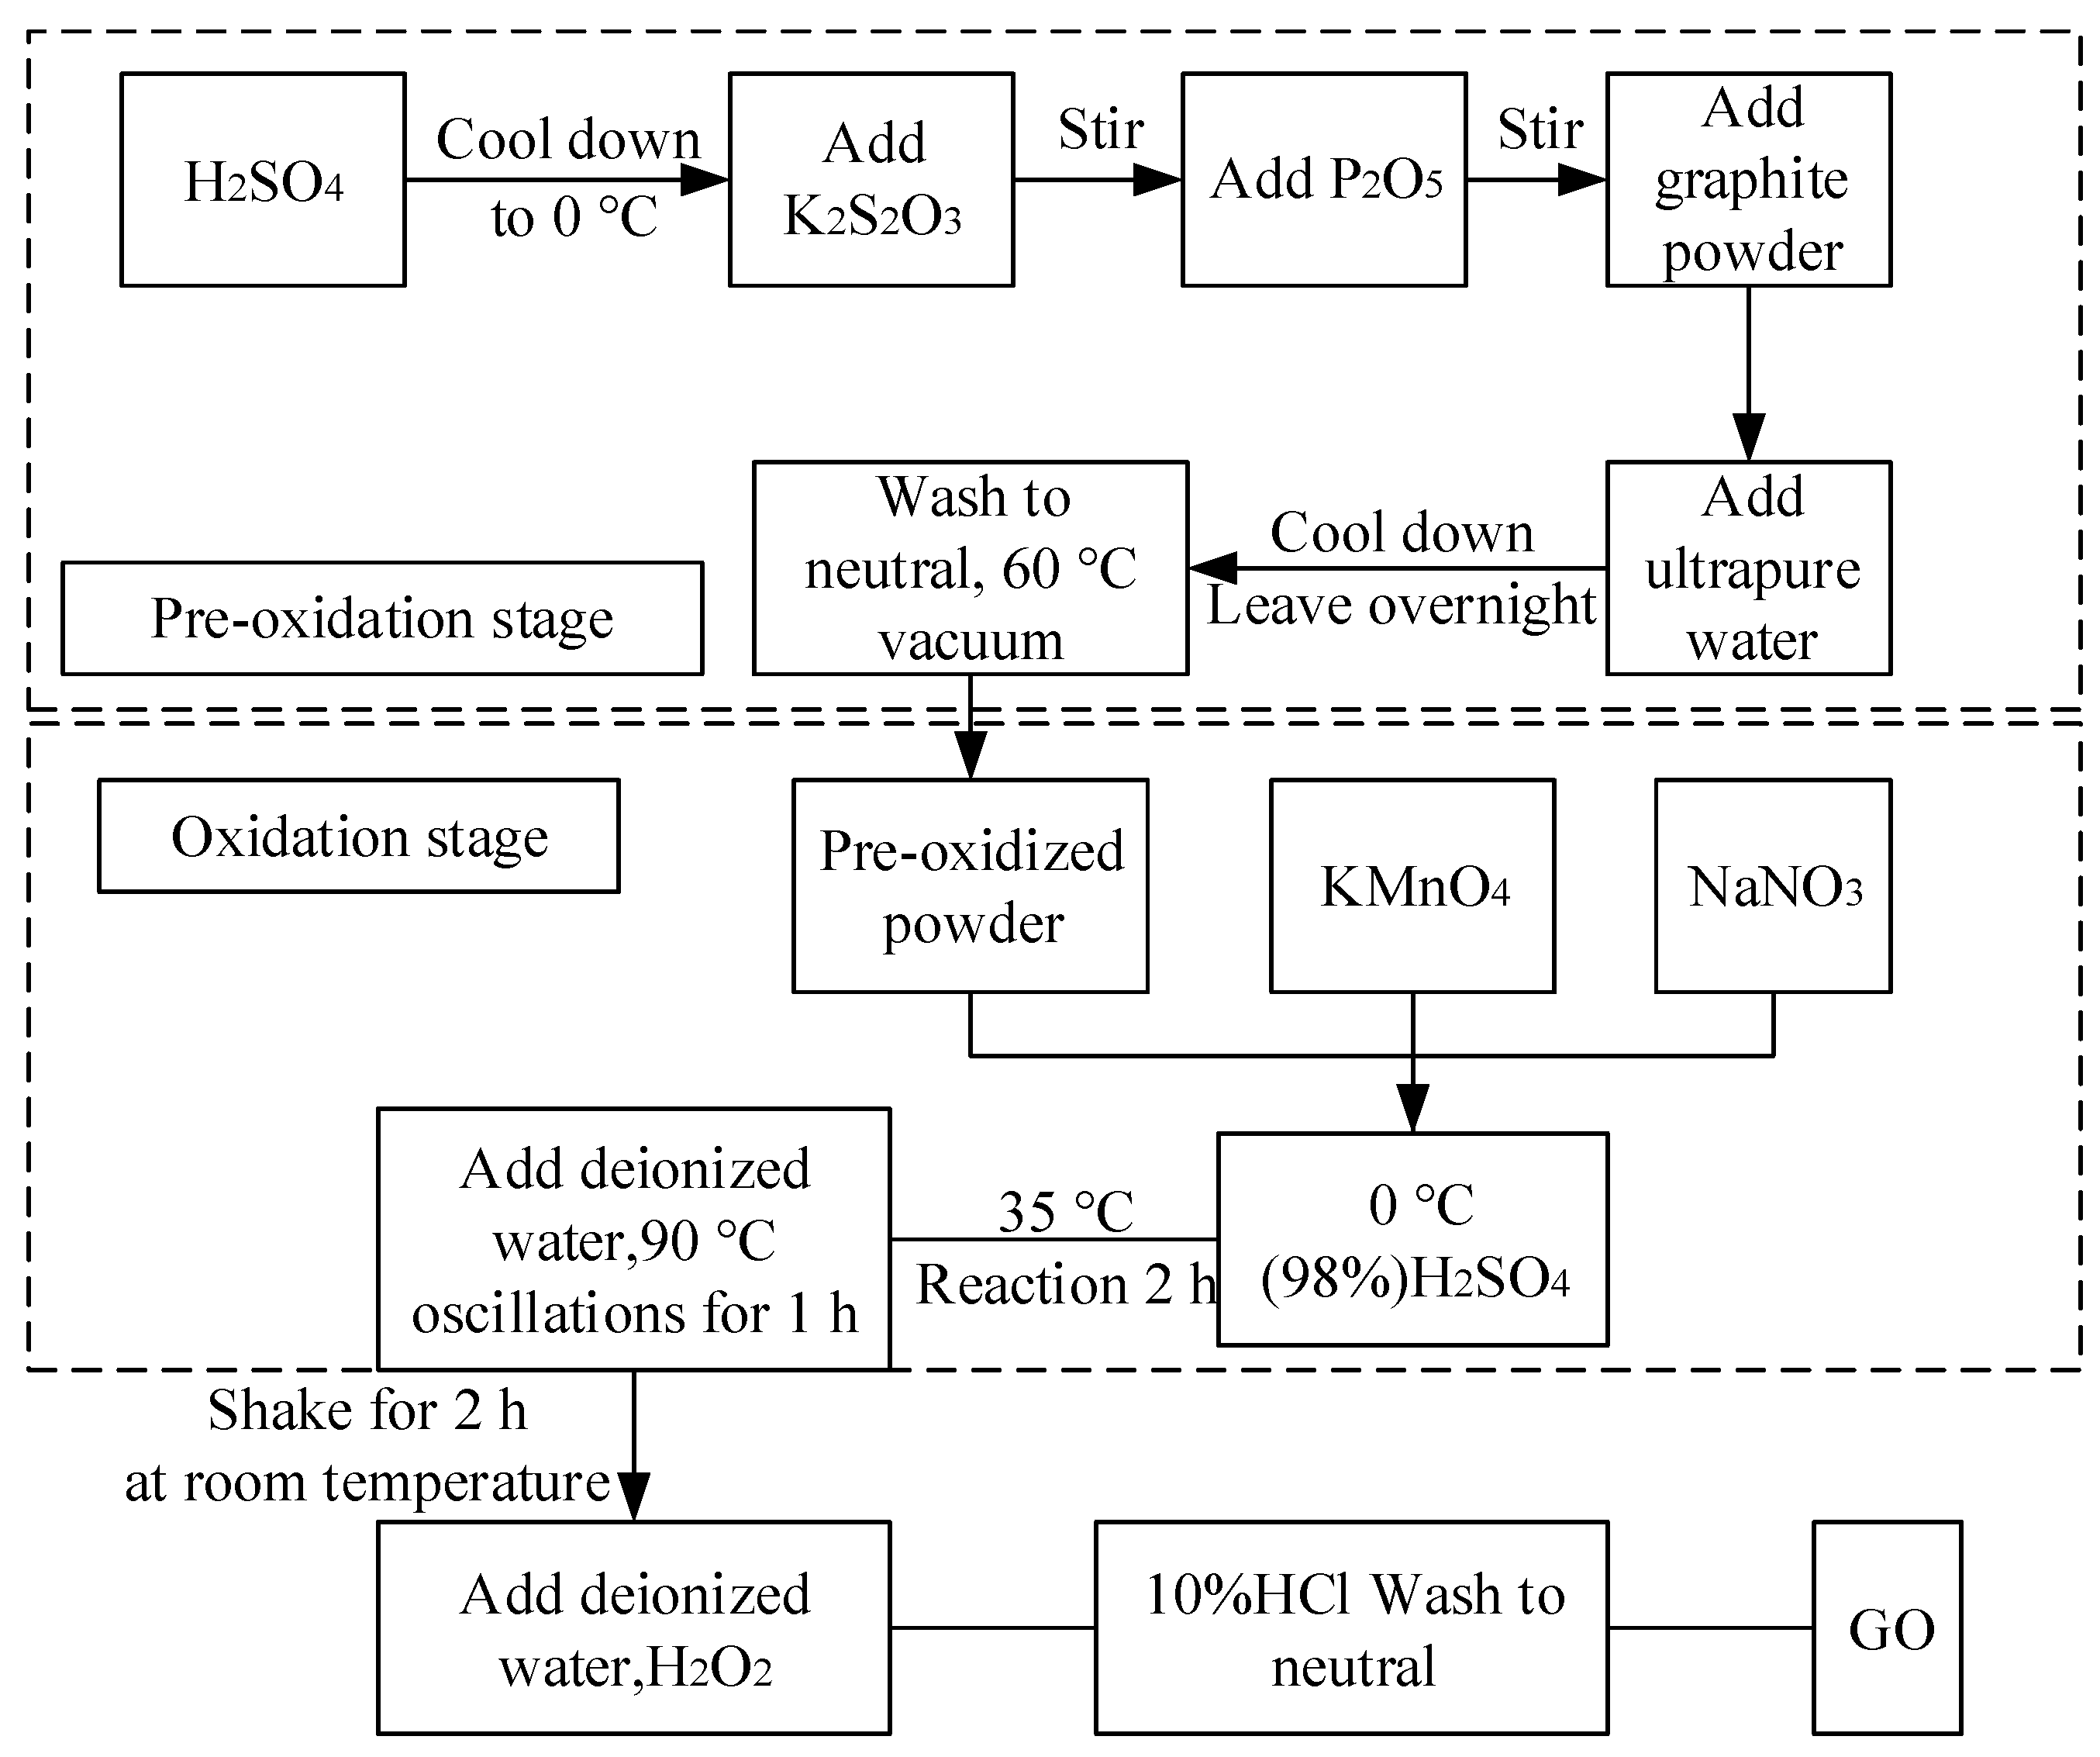
Figure 2.
SEM images of biochar and biochar-graphene (BG) composites at 300 °C and 600 °C. (a) B300; (b) B600; (c) BG300; (d) BG600.
Figure 2.
SEM images of biochar and biochar-graphene (BG) composites at 300 °C and 600 °C. (a) B300; (b) B600; (c) BG300; (d) BG600.

Figure 3.
TEM images of biochar and BG composites at 300 °C and 600 °C (a) B300; (b) B600; (c) BG300; (d) BG600.
Figure 3.
TEM images of biochar and BG composites at 300 °C and 600 °C (a) B300; (b) B600; (c) BG300; (d) BG600.

Figure 4.
The adsorption-desorption curves and pore size distribution curves of biochar and BG composites based on N2 and CO2. (a) N2; (b) CO2; (c) Pole distribution curve.
Figure 4.
The adsorption-desorption curves and pore size distribution curves of biochar and BG composites based on N2 and CO2. (a) N2; (b) CO2; (c) Pole distribution curve.

Figure 5.
Positron annihilation spectra of the free volume fraction of graphene.

Figure 6.
Adsorption dynamic curves of biochar and biochar-graphene composites for dimethyl p-phthalate (DMP), diethyl phthalate (DEP), and dibutyl phthalate (DBP); (a) DMP;(b) DEP;(c) DBP; (d) is the absorption rate change of o-benzene by biochar-graphene composites at different temperatures (A–D represent the absorption rate of BG600, B600, BG300, and B300 for DMP; E–F represents the DEP absorption rate of BG600, B600, BG300, and B300. H-K represent the absorption rate of BG600, B600, BG300, and B300 for DBP).

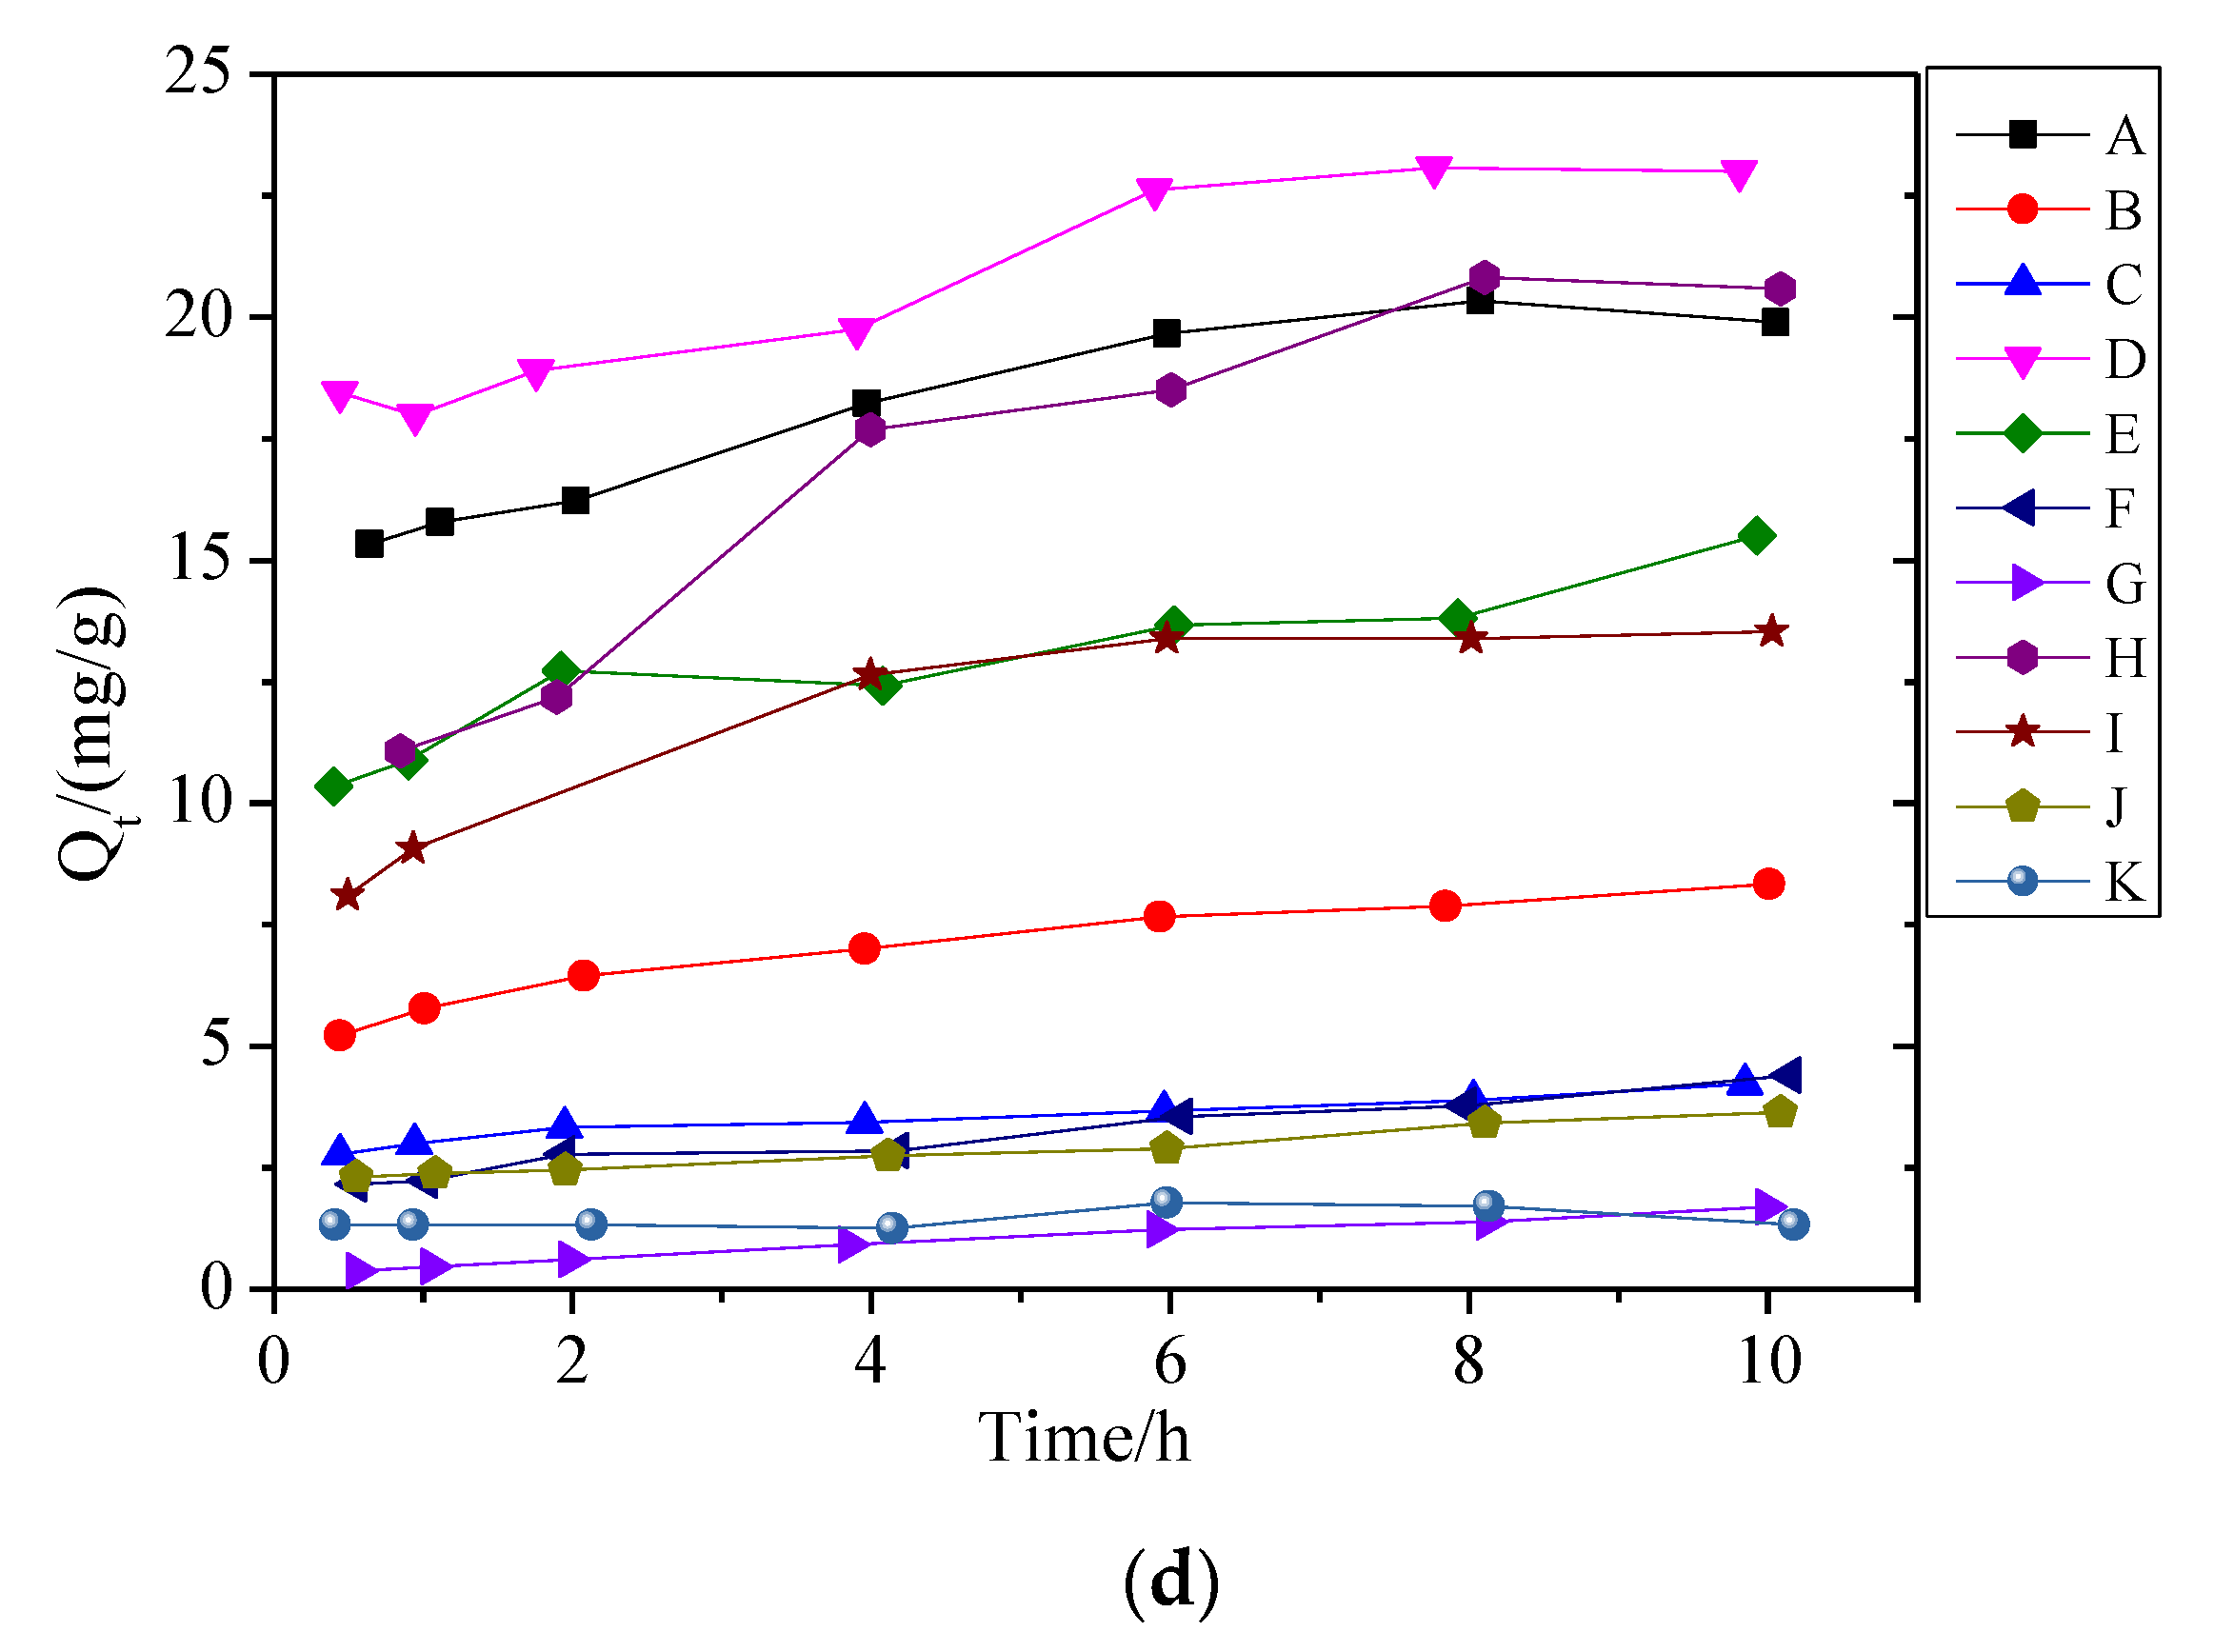
Figure 7.
The adsorption curves of DMP, DEP, and DBP were fitted by Freundlich model and Langmuir model, respectively; (a) DMP;(b) DEP;(c) DBP.
Figure 7.
The adsorption curves of DMP, DEP, and DBP were fitted by Freundlich model and Langmuir model, respectively; (a) DMP;(b) DEP;(c) DBP.

Table 1.
The reagent used in this experiment.
| The Name of the Reagent | Chemical Equation | Purity | Manufacturer |
|---|---|---|---|
| Graphite powder | C | Analytical pure | Qingdao Tianyuan Da Graphite Co. LTD |
| Potassium permanganate | KMnO4 | Analytical pure | Hubei Wanye Pharmaceutical Co. LTD |
| Phosphorus pentoxide | P2O5 | Analytical pure | Shanghai Alighting Biochemical Technology Co. LTD |
| Potassium dichromate | Cr2K2O7 | Analytical pure | Shanghai Alighting Biochemical Technology Co. LTD |
| Sodium nitrate | NaNO3 | Analytical pure | Hebei Xuxing New Energy Technology Co. LTD |
| Concentrated sulfuric acid | H2SO4 | Guaranteed reagent | Zhengzhou Longda Chemical Co. LTD |
| Hydrogen peroxide | H2O2 | Analytical pure | Sino Pharma Chemical Reagent Co. LTD |
| Potassium persulfate | K2S2O8 | Analytical pure | Jinan Zhendong Chemical Co. LTD |
| Sodium chloride | NaCl | Analytical pure | Zhengzhou Chunqiu Chemical Co. LTD |
| Nitric acid | HNO3 | Guaranteed reagent | Sino Pharma Chemical Reagent Co. LTD |
| Sodium hydroxide | NaOH | Analytical pure | Nanjing Chemical Reagent Co. LTD |
| Concentrated hydrochloric acid | HCl | Guaranteed reagent | Sino Pharma Chemical Reagent Co. LTD |
| Diphenyl carbonyl dihydrazine | C13H14N4O | Analytical pure | Nanjing Chemical Reagent Co. LTD |
| Acetone | CH3COCH3 | Guaranteed reagent | Sino Pharma Chemical Reagent Co. LTD |
| Dimethyl phthalate | C10H10O4 | Analytical pure | Shanghai Alighting Biochemical Technology Co., LTD |
| Diethyl phthalate | C12H14O4 | Analytical pure | Shanghai Alighting Biochemical Technology Co., LTD |
| Dibutyl phthalate | C16H22O4 | Analytical pure | Shanghai Alighting Biochemical Technology Co., LTD |
Table 2.
Specific surface area and pore volume based on XPS results.
| Names of Samples | BET-N2 * | BET-CO2 * | SA (N2-CO2) | ||
|---|---|---|---|---|---|
| SA/(m2g−1) | PV(m2g−1) | SA(m2g−1) | PV(m2g−1) | ||
| B300 | 8.40 | 0.014 | 117.70 | 0.055 | 109 |
| BG300 | 11.01 | 0.023 | 121.94 | 0.057 | 110 |
| B600 | 221.3 | 0.037 | 367.71 | 0.183 | 165 |
| BG600 | 251.82 | 0.044 | 455.98 | 0.182 | 139 |
Note: SA stands for specific surface area; PV represents the pore volume; BET stands for specific surface area test, which is the combination of the first capital of names of three scientists. * indicates that the BET method is used to measure the surface area and pore volume.
Table 3.
Kinetic parameters of adsorption of DMP, DEP, and DBP by biochar and BG composites.
| Phthalate | Names of Samples | Pseudo First Order Dynamic Model | Pseudo Second Order Dynamic Model | Internal Diffusion Model | ||||||
|---|---|---|---|---|---|---|---|---|---|---|
| Qe/(mg/g) | k1(h−1) | radj2 | Qe/(mg/g) | k1(h−1) | radj2 | Qe/(mg/g) | k1(h−1) | radj2 | ||
| DMP | B300 | 3.88 | 1.92 | 0.843 | 4.05 | 0.783 | 0.939 | 2.81 | 0.123 | 0.934 |
| BG300 | 4.09 | 1.65 | 0.794 | 4.26 | 0.542 | 0.901 | 2.81 | 0.126 | 0.976 | |
| B600 | 20.15 | 1.71 | 0.821 | 20.09 | 0.127 | 0.948 | 14.76 | 0.607 | 0.876 | |
| BG600 | 28.12 | 1.28 | 0.805 | 19.32 | 0.063 | 0.927 | 19.35 | 1.09 | 0.854 | |
| DEP | B300 | 2.46 | 3.49 | 0.943 | 2.37 | 3.376 | 0.982 | 2.19 | 1.036 | 0.813 |
| BG300 | 3.51 | 1.08 | 0.836 | 3.26 | 0.447 | 0.945 | 2.27 | 0.145 | 0.901 | |
| B600 | 13.93 | 2.01 | 0.851 | 15.11 | 0.225 | 0.943 | 11.16 | 0.446 | 0.919 | |
| BG600 | 21.74 | 2.21 | 0.787 | 21.87 | 0.142 | 0.899 | 16.89 | 0.571 | 0.883 | |
| DBP | B300 | 2.41 | 2.32 | 0.837 | 2.69 | 1.38 | 0.917 | 2.07 | 0.049 | 0.712 |
| BG300 | 3.02 | 2.04 | 0.865 | 3.07 | 1.06 | 0.962 | 2.31 | 0.105 | 0.917 | |
| B600 | 14.27 | 1.91 | 0.901 | 13.65 | 0.142 | 0.916 | 10.08 | 0.467 | 0.645 | |
| BG600 | 19.85 | 0.52 | 0.876 | 20.04 | 0.051 | 0.963 | 10.67 | 1.21 | 0.876 | |
© 2020 by the authors. Licensee MDPI, Basel, Switzerland. This article is an open access article distributed under the terms and conditions of the Creative Commons Attribution (CC BY) license (http://creativecommons.org/licenses/by/4.0/).
Share and Cite
MDPI and ACS Style
Yu, Z.; Wang, W.; Gao, H.; Liang, D. Properties Analysis and Preparation of Biochar–Graphene Composites Under a One-Step Dip Coating Method in Water Treatment. Appl. Sci. 2020, 10, 3689. https://doi.org/10.3390/app10113689
AMA Style
Yu Z, Wang W, Gao H, Liang D. Properties Analysis and Preparation of Biochar–Graphene Composites Under a One-Step Dip Coating Method in Water Treatment. Applied Sciences. 2020; 10(11):3689. https://doi.org/10.3390/app10113689
Chicago/Turabian StyleYu, Ze, Wenxuan Wang, He Gao, and Daxin Liang. 2020. "Properties Analysis and Preparation of Biochar–Graphene Composites Under a One-Step Dip Coating Method in Water Treatment" Applied Sciences 10, no. 11: 3689. https://doi.org/10.3390/app10113689
Note that from the first issue of 2016, this journal uses article numbers instead of page numbers. See further details here.