Article

Numerical Analysis of Bicycle Helmet under Blunt Behavior

by
David Sepulveda-Lopez
1,
Jacobo Antona-Makoshi
2,
Ignacio Rubio
1 and
Marcos Rodríguez-Millán
1,*
1
Department of Mechanical Engineering, University Carlos III of Madrid, Avda. de la Universidad 30, Leganés, 28911 Madrid, Spain
2
Japan Automobile Research Institute, 2530 Karima, Tsukuba, Ibaraki 305-0822, Japan
*
Author to whom correspondence should be addressed.
Appl. Sci. 2020, 10(11), 3692; https://doi.org/10.3390/app10113692
Submission received: 28 April 2020 / Revised: 17 May 2020 / Accepted: 19 May 2020 / Published: 26 May 2020
(This article belongs to the Special Issue Armour and Protection Systems)

Abstract

:
This study evaluates various safety aspects of standardized impacts that cyclists may suffer while wearing a bicycle helmet, by combining a partially validated finite element model of the cranio-cervical region and a newly developed commercial bicycle helmet model. Under EN 1078 standardized impact conditions, the results of simulated impact tests show that the helmet can absorb 40% to 50% of the total impact energy at impact velocities above 4 m/s. Further, based on a relationship between the head injury criterion and the risk of injury from field data, the results of the simulations suggest that minor injuries may occur at impact velocities of 10 km/h, serious injuries at 15 km/h, and severe injuries at 20 km/h. Fatal injuries will likely occur at impact velocities of 30 km/h and higher.

1. Introduction

The burden of cyclist fatalities is of global scale. Only in 2016, over 2000 cyclists died in the EU [1], 840 in the US [2], and more than 2500 in India [3]. Hospital data recorded in the European Union show that the most common cycling injuries are related to the head (25% of injuries), upper extremities, and lower extremities [1]. Head-related injuries were found to be important on all major forms of transportation.
Helmets are the safety equipment most frequently worn by cyclists. Helmet use is experiencing a growth [4] due to new legislative regulations [5] and an increased awareness on their effectiveness. Olivier et al. [6] performed a meta-analysis suggesting that helmet use is linked to a reduction in head, serious head, and fatal head injuries. Macpherson et al. [5] found that helmet legislation leads to a decrease in head injuries while increasing helmet use, as do other studies, which suggest a positive effect of the helmet linked to a reduction in head injuries [7,8]. Nevertheless, the use of bicycle helmets fluctuates depending on countries and regions, and it was statistically found that use is frequently less than 50% worldwide [9,10].
There are research studies that disagree with the protective capacity of helmets and link their use to injuries, such as the research carried out by Elvik [11], which suggests an increased risk of neck injury. These contradictory results may lead to an opposition of the general population toward mandatory helmet regulation. For instance, Swami et al. [12] showed that 57.1% of children in India violated traffic rules by not wearing a helmet, while even countries with extensive and long-standing mandatory helmet laws have the same issue, as shown by Schramm et al. [13] in Queensland where 12% of cyclists involved in police-reported crashes did not wear helmets.
Bicycle helmets comply with standards as an assurance of their protection capabilities. Different standards are used in each country; nevertheless, all are closely related, certifying that the helmet stays attached to the head during impacts with various head forms, ensuring that helmets can adapt to all head dimensions. Minimum requirements on eye vision are imposed, preventing its obstruction. Material conditionings are made to replicate the effect of weather conditions and helmet storage on material properties. Additionally, they have similar impact testing methods, differing on the maximum g acceleration that the head can sustain, shown in Table 1.
Impact velocity imposes the minimum kinetic energy that must absorbed by the helmet to remain below the acceleration threshold. An analysis of this relationship is presented in Equations (1) and (2), assuming that head forms and helmet weight are the same for all tests.
Ec   ( J ) = 1 2   M ( kg ) v 2 ( m s ) 2
Eag ( J ( m s 2 ) kg ) = Ec ( J ) g t ( m s 2 )   M ( kg )
where: Ec is the kinetic energy (J); M is the sum of helmet mass and head form (kg); v is the initial velocity during impact (m/s); Eag is the energy absorbed per g acceleration and common weight (J/(kgm/s2)); gt is the maximum g acceleration of each standard (m/s2).
The minimum energy absorbed on each standard, for the same head form and helmet weight, based on Equation (2), is shown in Table 2.
Table 2 suggests that all standards are comparable in terms of energy per maximum g acceleration. For flat anvils, the most thorough standards are the American and Chinese; in contrast, Europe has the most thorough standard for curbstone anvils. All standards remain within an 8.5% difference on the energy absorbed per maximum g acceleration. Thus, we can conclude that, despite different testing methods, all standards share a common grade of safety. In addition, the Department of Transport of London claims that there is limited evidence to suggest that some standards are safer than others [14].
The standard assessed in this research is the EN 1078 [15], which, among others, considers the capacity of absorbing energy, the construction and shape of the helmet, and the properties of the retention system. The EN 1078 [15] tests helmet energy absorbing capacities with curbstone and flat anvils at 4.57 and 5.42 m/s, respectively. To assure compliance, the helmeted head must have an acceleration lower than 250 g in both anvil tests.
Most studies on helmets are experimental, although numerical research has taken place [16,17,18,19,20,21,22]. Previous numerical models include flat and curbstone anvils, some under standardized conditions. The main conclusions of these studies are drawn from accelerations and stresses on the head. Some of these methods include the Peak Linear Acceleration [23,24], Head Impact Power (HIP) criterion [25], Gadd Severity index [26,27], Generalized Acceleration Model for Brain Injury Threshold (GAMBIT) Criterion [28], Head Injury Criterion (HIC) Criterion [29], and Rotational Injury Criterion (RIC) criterion [30]. To perform innovative research, this paper introduces its approach to the numerical method in Section 2 with the development and validation of the model against experimental impacts. In Section 3, multiple head injury criteria and head injury modes are assessed including the energy absorbed by the helmet, and a parametric study is carried out for the development of an injury risk curve. Finally, the discussion and conclusions are presented in Section 4 and Section 5, respectively.

2. Materials and Methods

2.1. Introduction to the Development of Numerical Model

This research presents an innovative approach using a partially validated Finite Element Analysis (FEA) head to measure head injuries and head injury criteria such as the HIC15 and the skull fracture probability. The FEA head has been partially validated [31] and has detailed modelling of all the organs, ensuring that the gathered data are representative of real impacts.
This paper introduces the analysis of a newly developed bicycle helmet whose surfaces and solids have been acquired with a 3D positioning method and later digitalized in Catia. The helmet includes an Expanded Polystyrene foam (EPS), padding, rear and chin straps, shell, and a helmet design that is available on the market. Helmet meshing is developed in Hypermesh. To increase the accuracy of the results, hexahedral and quadrilateral elements are used. Finally, the helmet and FEA head are imported to Ls-Dyna to perform numerical simulations.

2.1.1. Helmet Model

A bicycle helmet, compliant with the European standards, has been considered. The size of the helmet fits the partially validated FEA head. Catia (student version V5-6R2017) is used to convert the data obtained from a 3D positioning method into a CAD design.
The mesh, shown in Figure 1, is developed with Hypermesh (Desktop 13.0). Quadrilateral elements are used for the retention system and shell, while hexahedral elements are used for the curbstone anvil, flat anvil, EPS foam, and padding. The number of elements and element type of each component are shown in Figure 1.
The material models implemented are based on the properties described by the manufacturer, previous studies, and properties measured in the helmet such as EPS foam density, shown in Table 3.
The components restrained to each other in the helmet are modelled with the following contact types: Contact_tied_shell_edge_to_surface_offset, contact_tied_shell_edge_to_surface, and contact_tied_surface_to_surface. The unconstrained parts have been modelled with contact_automatic_surface_to_surface, setting a dynamic and static friction coefficient of 0.2.

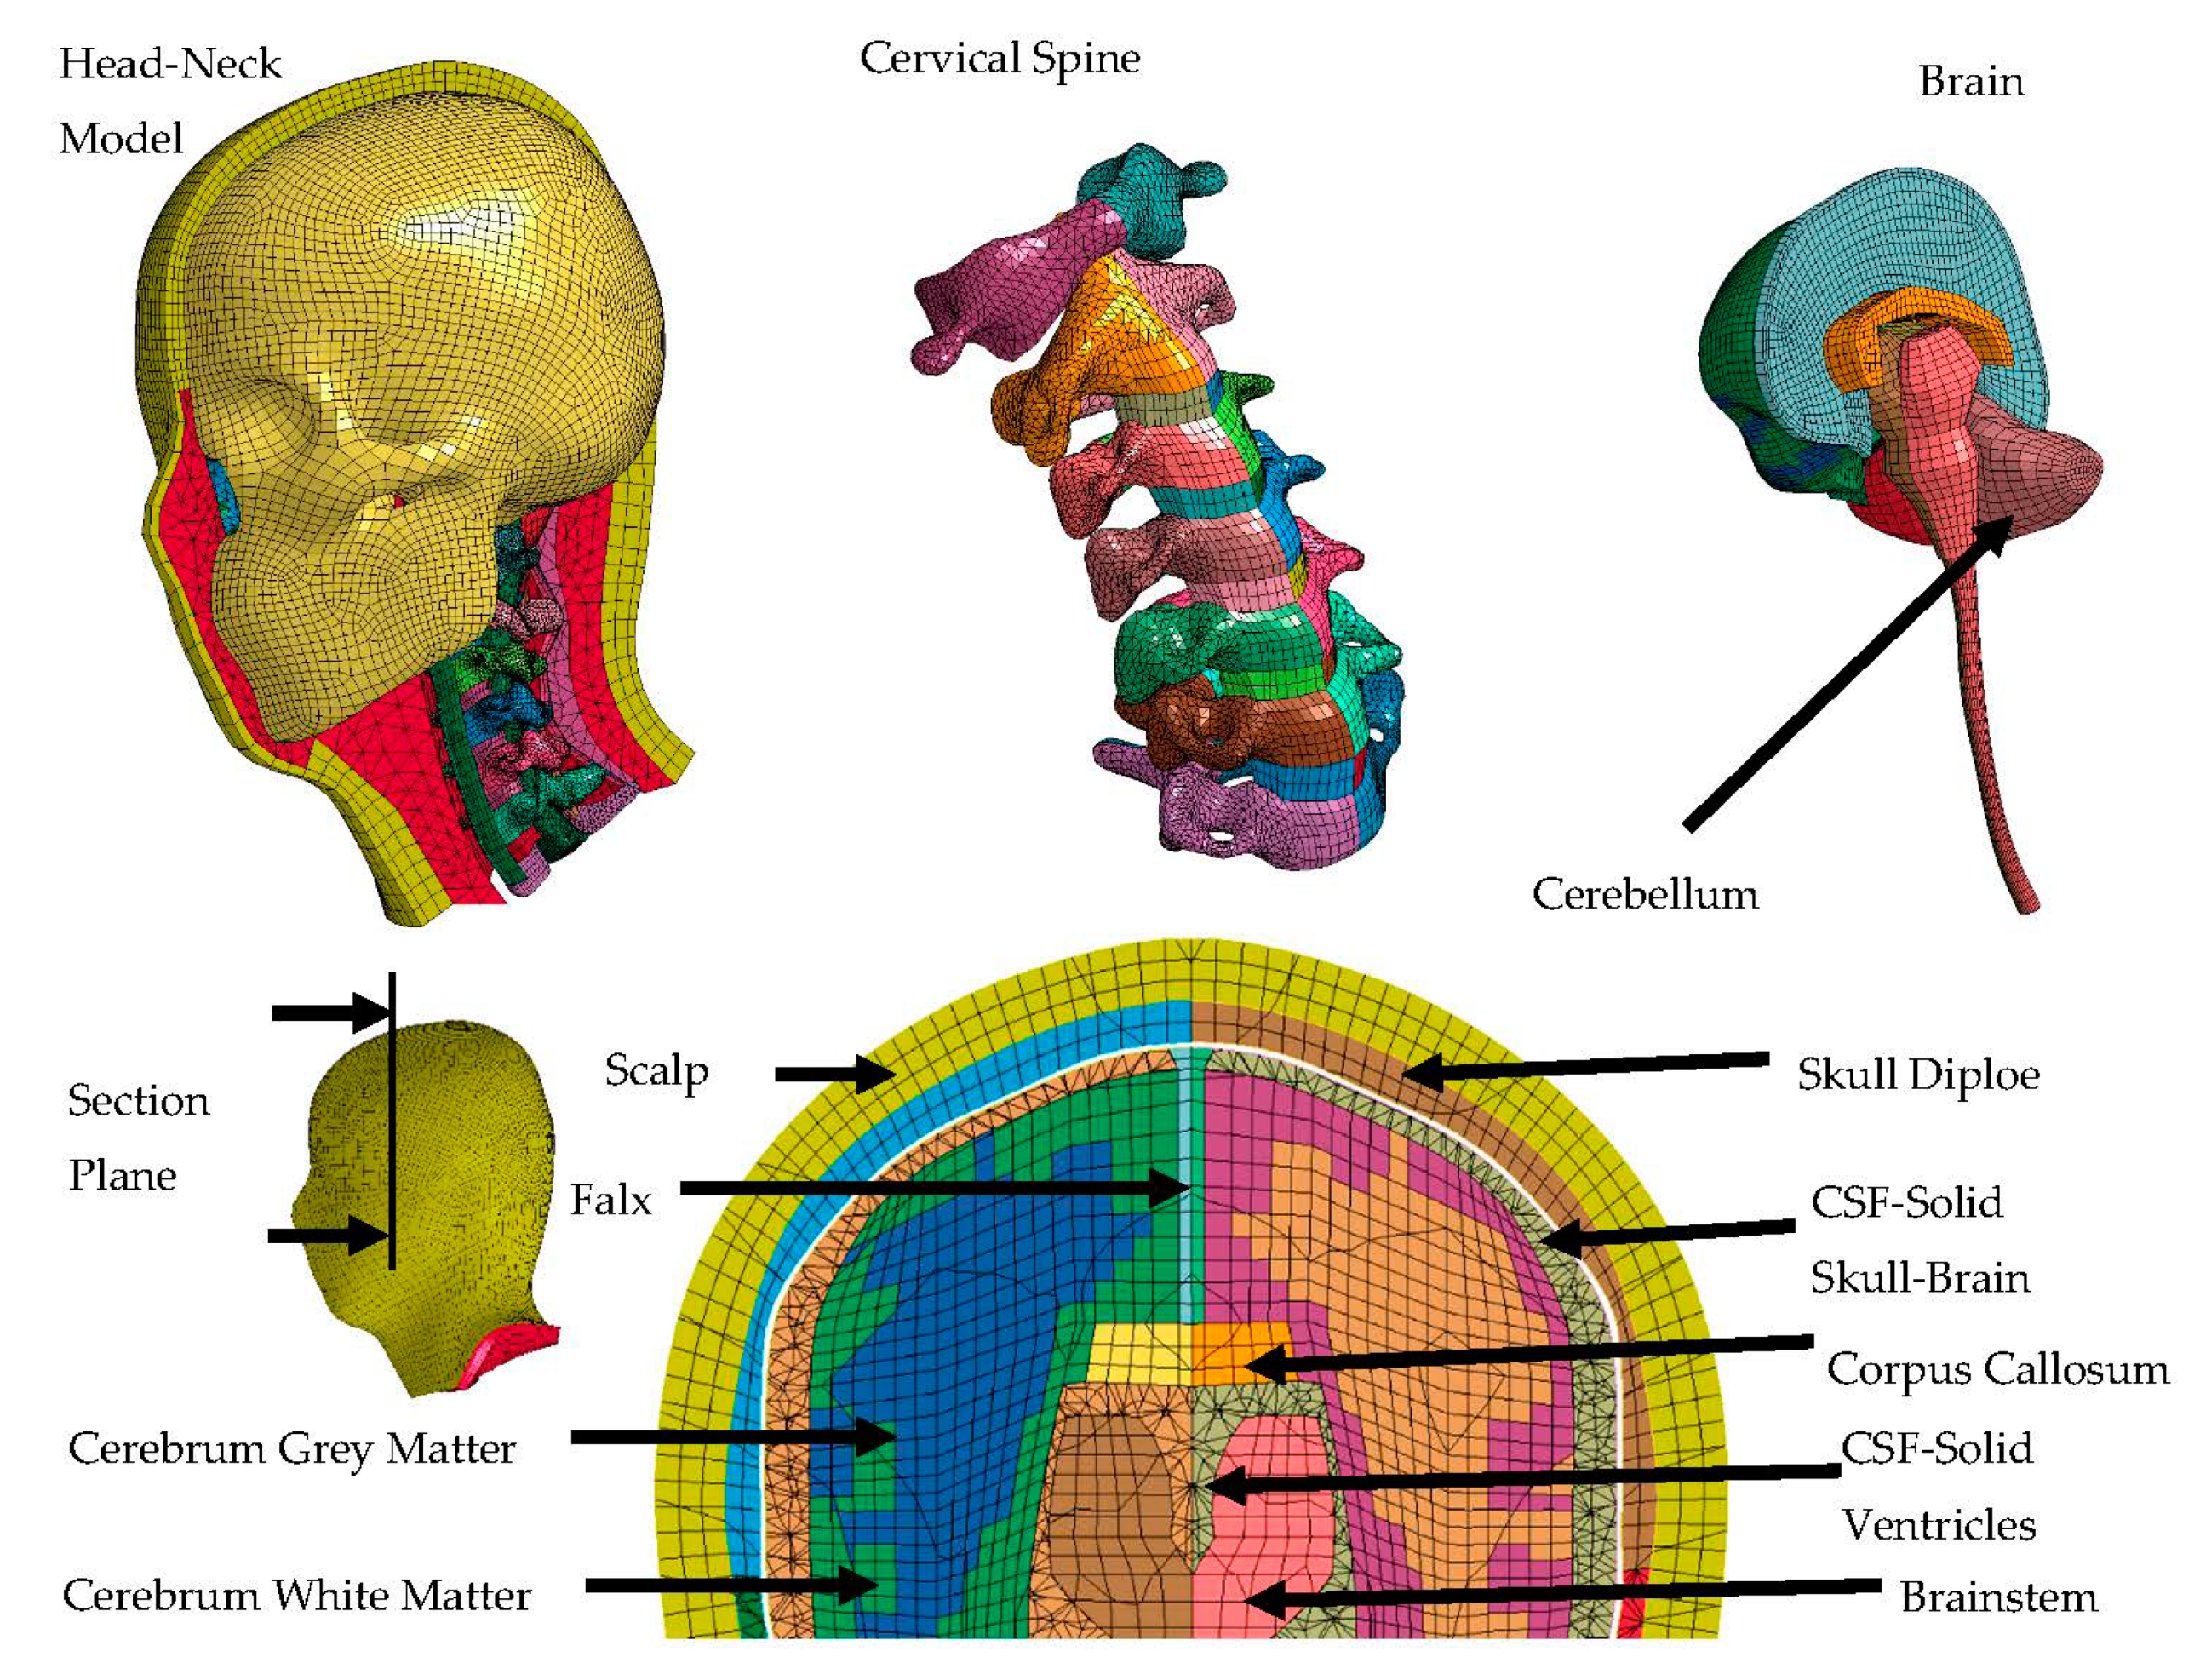
2.1.2. Human Head Model

The numerical head, shown in Figure 2, is based upon computed tomography (CT) and magnetic resonance imaging (MRI). It has 291,948 solid elements, 53,609 shells, and it has been partially validated [31] by the Japan Automobile Research institute and Chalmers University of Technology.
The motion of the brain has been validated with post-mortem human subjects’ (PMHSs) experimental data where the motion of radio opaque markers in brain tissue was recorded with high-speed X-ray on head impacts [34,35] with frontal, coronal, and occipital impact tests. The cranio-cervical motion has been validated in the sagittal plane of the FE model with data obtained from frontal deceleration sled tests [36].
The head model considers the skin, neck, cerebrum (discerning grey and white matter), cerebellum, brainstem, cervical spine, scalp, falx, skull diploe, cerebrospinal fluid, corpus callosum, and skull, as shown in Figure 2. The head model, elaborated in the doctoral thesis of Dr. Antona-Makoshi [31], consists mainly of hexahedral, tetrahedral, and quadrilateral elements.
Head material properties are shown in Table 4. The most relevant head constraints are contacts among vertebrae, modeled with contact_automatic_single_surface, contacts between the neck and vertebrae, modeled with contact_automatic_surface_to_surface, and contacts between the dura and inner skull, modeled with contact_automatic_surface_to_surface_tiebreak. The full model description is shown in the doctoral thesis of Dr. Antona-Makoshi [31].

2.1.3. Boundary Conditions

Ls-Dyna (LS-PrePost(R) V4.3.5) is implemented for the numerical simulation. To keep the anvils in a fixed position, the lower nodes of the anvils have all translational and rotational degrees-of-freedom constrained. Gravity is included, acting in the negative X direction, shown in Figure 3. The head’s initial velocity is 5.42 m/s for the flat anvil and 4.57 m/s for the curbstone, specified by the EN 1078 standard. Contact conditions between anvils, helmet, and head use the contact_automatic_surface_to_surface command with a dynamic and static friction coefficient of 0.2. The setup for impact testing in Ls-Dyna can be observed in Figure 3.

2.2. Head Acceleration Response Validation in Standardized Impacts

To validate the setup, a comparison between the results obtained and previous experimental research is made. The flat anvil EN 1078 is the most tested case in previous studies. Thus, it is used for validation purposes, taking into consideration the maximum head acceleration, impact duration, and loading and unloading curves.

2.3. Injury Predictors

Multiple biomechanical metrics can be found in the literature. Thus, the ones tested include those most commonly used in the research and industry fields, as well as those that consider diverse input variables in their formulation so that multiple injury probability predictors are assessed, including: The Peak Linear Acceleration (based on the maximum linear acceleration), Gadd Severity Index (based on the Wayne State University Cerebral Concussion tolerance Curve), GAMBIT criterion (based on the maximum linear and angular accelerations), Head Injury Criterion (based on the linear acceleration at different time instants), the energy absorbed by the helmet, and a parametric study for the development of an injury risk curve.

2.3.1. Peak Linear Acceleration (PLA)

Based on Peak Linear Acceleration criteria, there is a 50% and 75% probability of concussion if the acceleration is larger than 65.1 g and 88.5 g, respectively [23,24].

2.3.2. Gadd Severity Index (GSI)

The Gadd Severity Index is based on the Wayne State University Cerebral Concussion Tolerance Curve (WSTC). This curve has the acceleration and time on the ordinate and abscissa axis, respectively, where values found over the curve cause permanent brain injury [27,29]. Converting the WSTC into a logarithmic scale creates a linear function with a −2.5 slope. Gadd proposed the Severity Index Criteria, shown in Equation (3), where values over 1000 produce serious internal head injury [26,27].
GSI = 0 t a ( t ) 2.5 dt
where: a is the linear acceleration (g); t is the duration of the impact (s).

2.3.3. Generalized Acceleration Model for Brain Injury Threshold (GAMBIT)

The Generalized Acceleration Model for Brain Injury Threshold takes into account the effect of the translational and rotational accelerations in the same criterion [28,43], as shown in Equation (4).
GAMBIT = [ ( a m a x a c r ) 2 + ( α m a x α c r ) 2 ] 1 2
where: amax is the maximum linear acceleration (g); acr = 350 (g) [43]; αmax is the maximum angular acceleration (rad/s2); αcr = 12,000 (rad/s2) [43].
Based upon the GAMBIT criterion, a relationship with the probability of injury was found [43], as shown in Equation (5).
p ( AIS 2 ) = 1 1 + e 6.777 17.26 G A M B I T
where: GAMBIT is the value found with Equation (4) for each impact.

2.3.4. Head Injury Criterion (HIC15)

The head injury criterion is among the most widely used criteria to assess head injuries. For instance, it is used in the safety regulations code in the American motor vehicle regulations, and is defined in Equation (6) [29]:
HIC = { ( t 2 t 1 ) [ 1 t 2 t 1 t 1 t 2 a ( t ) dt ] 2.5 } max
where: t2 is the time at the end of the impact period (s); t1 is the time at the start of the impact period (s); a is the acceleration (g).
The “Forensic Injury Biomechanics” paper by Hayes et al. [44] shows an injury probability percentage for every HIC value, explained in Figure 4.

2.3.5. Energy Absorbed by the Helmet during Impact

To measure the effectiveness of helmets during impacts, simulations are made at different impact velocities with the EN 1078 flat anvil test. The percentage of impact energy absorbed respectively by the helmet and head are assessed.

2.3.6. Parametric Study for the Development of an Injury Risk Curve

To assess the effect of velocity on head injuries, multiple simulations are made at different impact velocities with the EN 1078 flat anvil test, yielding different HIC15 values. Based on these results, a correlation between the impact velocity and HIC values is found. Furthermore, Hayes et al. [44] shows the probability of different injury modes based on HIC values, explained in Figure 4.
Thus, knowing the probability of injury based on the HIC value. [44] and the relationship between impact velocity and HIC value, the relationship between the impact velocity and probability of injury can be derived.

3. Results

3.1. Head Acceleration Response Validation in Standardized Impacts Results

3.1.1. EN 1078 Flat Anvil Validation

The resultant accelerations on the center of gravity of the head in the flat anvil case are shown in Figure 5, compared to previous experimental results for the same test.
As shown in Figure 5, the effective impact starts at 1 ms and finishes at 12 ms. The maximum head acceleration is 150.61 g. The loading and unloading curves show similar patterns. The average value of maximum head acceleration in previous studies is 158.6 g, which is a 5.3% difference compared to this research. This difference might be due to different approaches in the numerical simulations, mainly in the helmet model and FEA head. The average impact duration of previous research is 10.15 ms, which shows an 8.4% difference with the results of this research. The graphical sequence of the EN 1078 flat anvil test is shown in Figure 6.
The graphical sequence of the flat anvil impact on Figure 6 shows that, initially, the helmeted head is not in contact with the anvil. At 2.5 ms, the helmet padding has completely deformed and the helmet (comprising shell and EPS foam) has started to deform until the maximum value is reached at 5.9 ms (9.7 ms for the curbstone case shown in Figure 7); afterward, the head acquires velocity in the opposite direction.

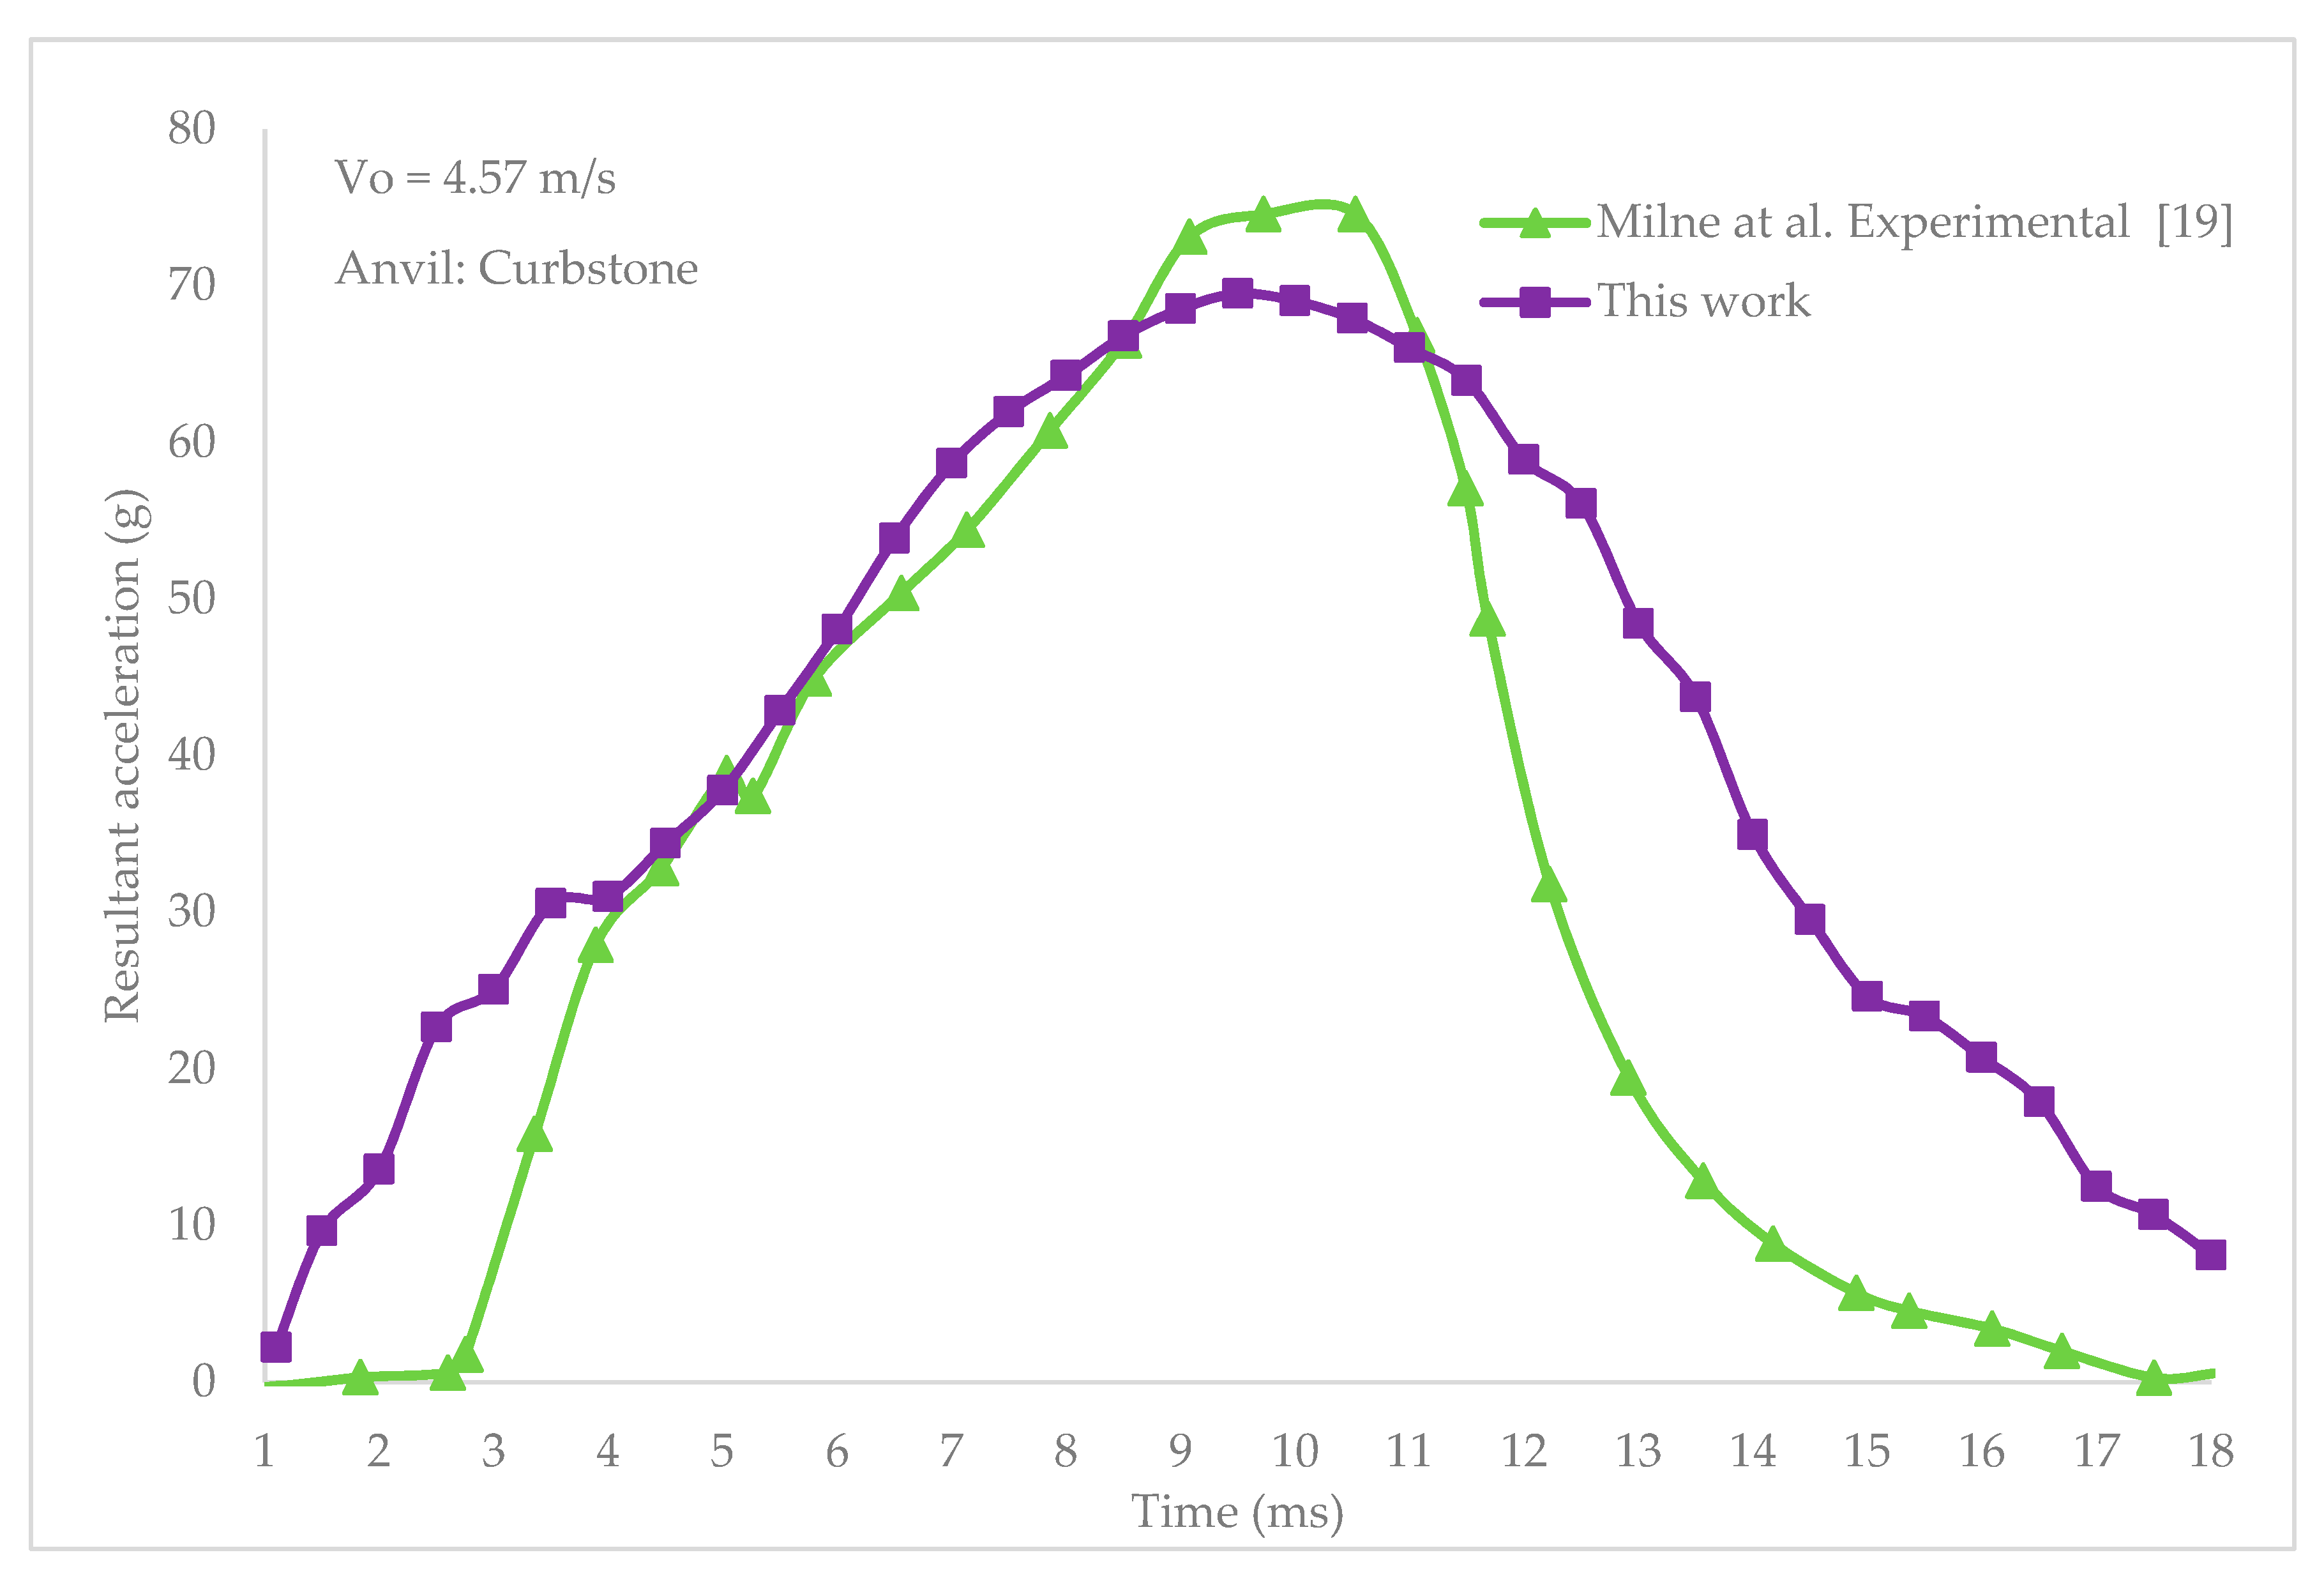
3.1.2. EN 1078 Curbstone Anvil Validation

The resultant accelerations on the center of gravity of the head in the curbstone anvil test are shown in Figure 8, compared to previous experimental results for the same test.
The effective impact starts at 1 ms and finishes at 18 ms with a maximum acceleration of 69.8 g. The loading and unloading curves show similar patterns with a more pronounced slope in previous research. The maximum head acceleration of the previous study is 74.59 g, which is a 16.5% difference when compared to this research. The impact duration of the previous study is 14.7 ms, which shows a 15.6% difference. The contrast between papers might be due to the helmet model, FEA head, and positioning of the anvil. The graphical sequence of the EN 1078 curbstone anvil test is shown in Figure 7.

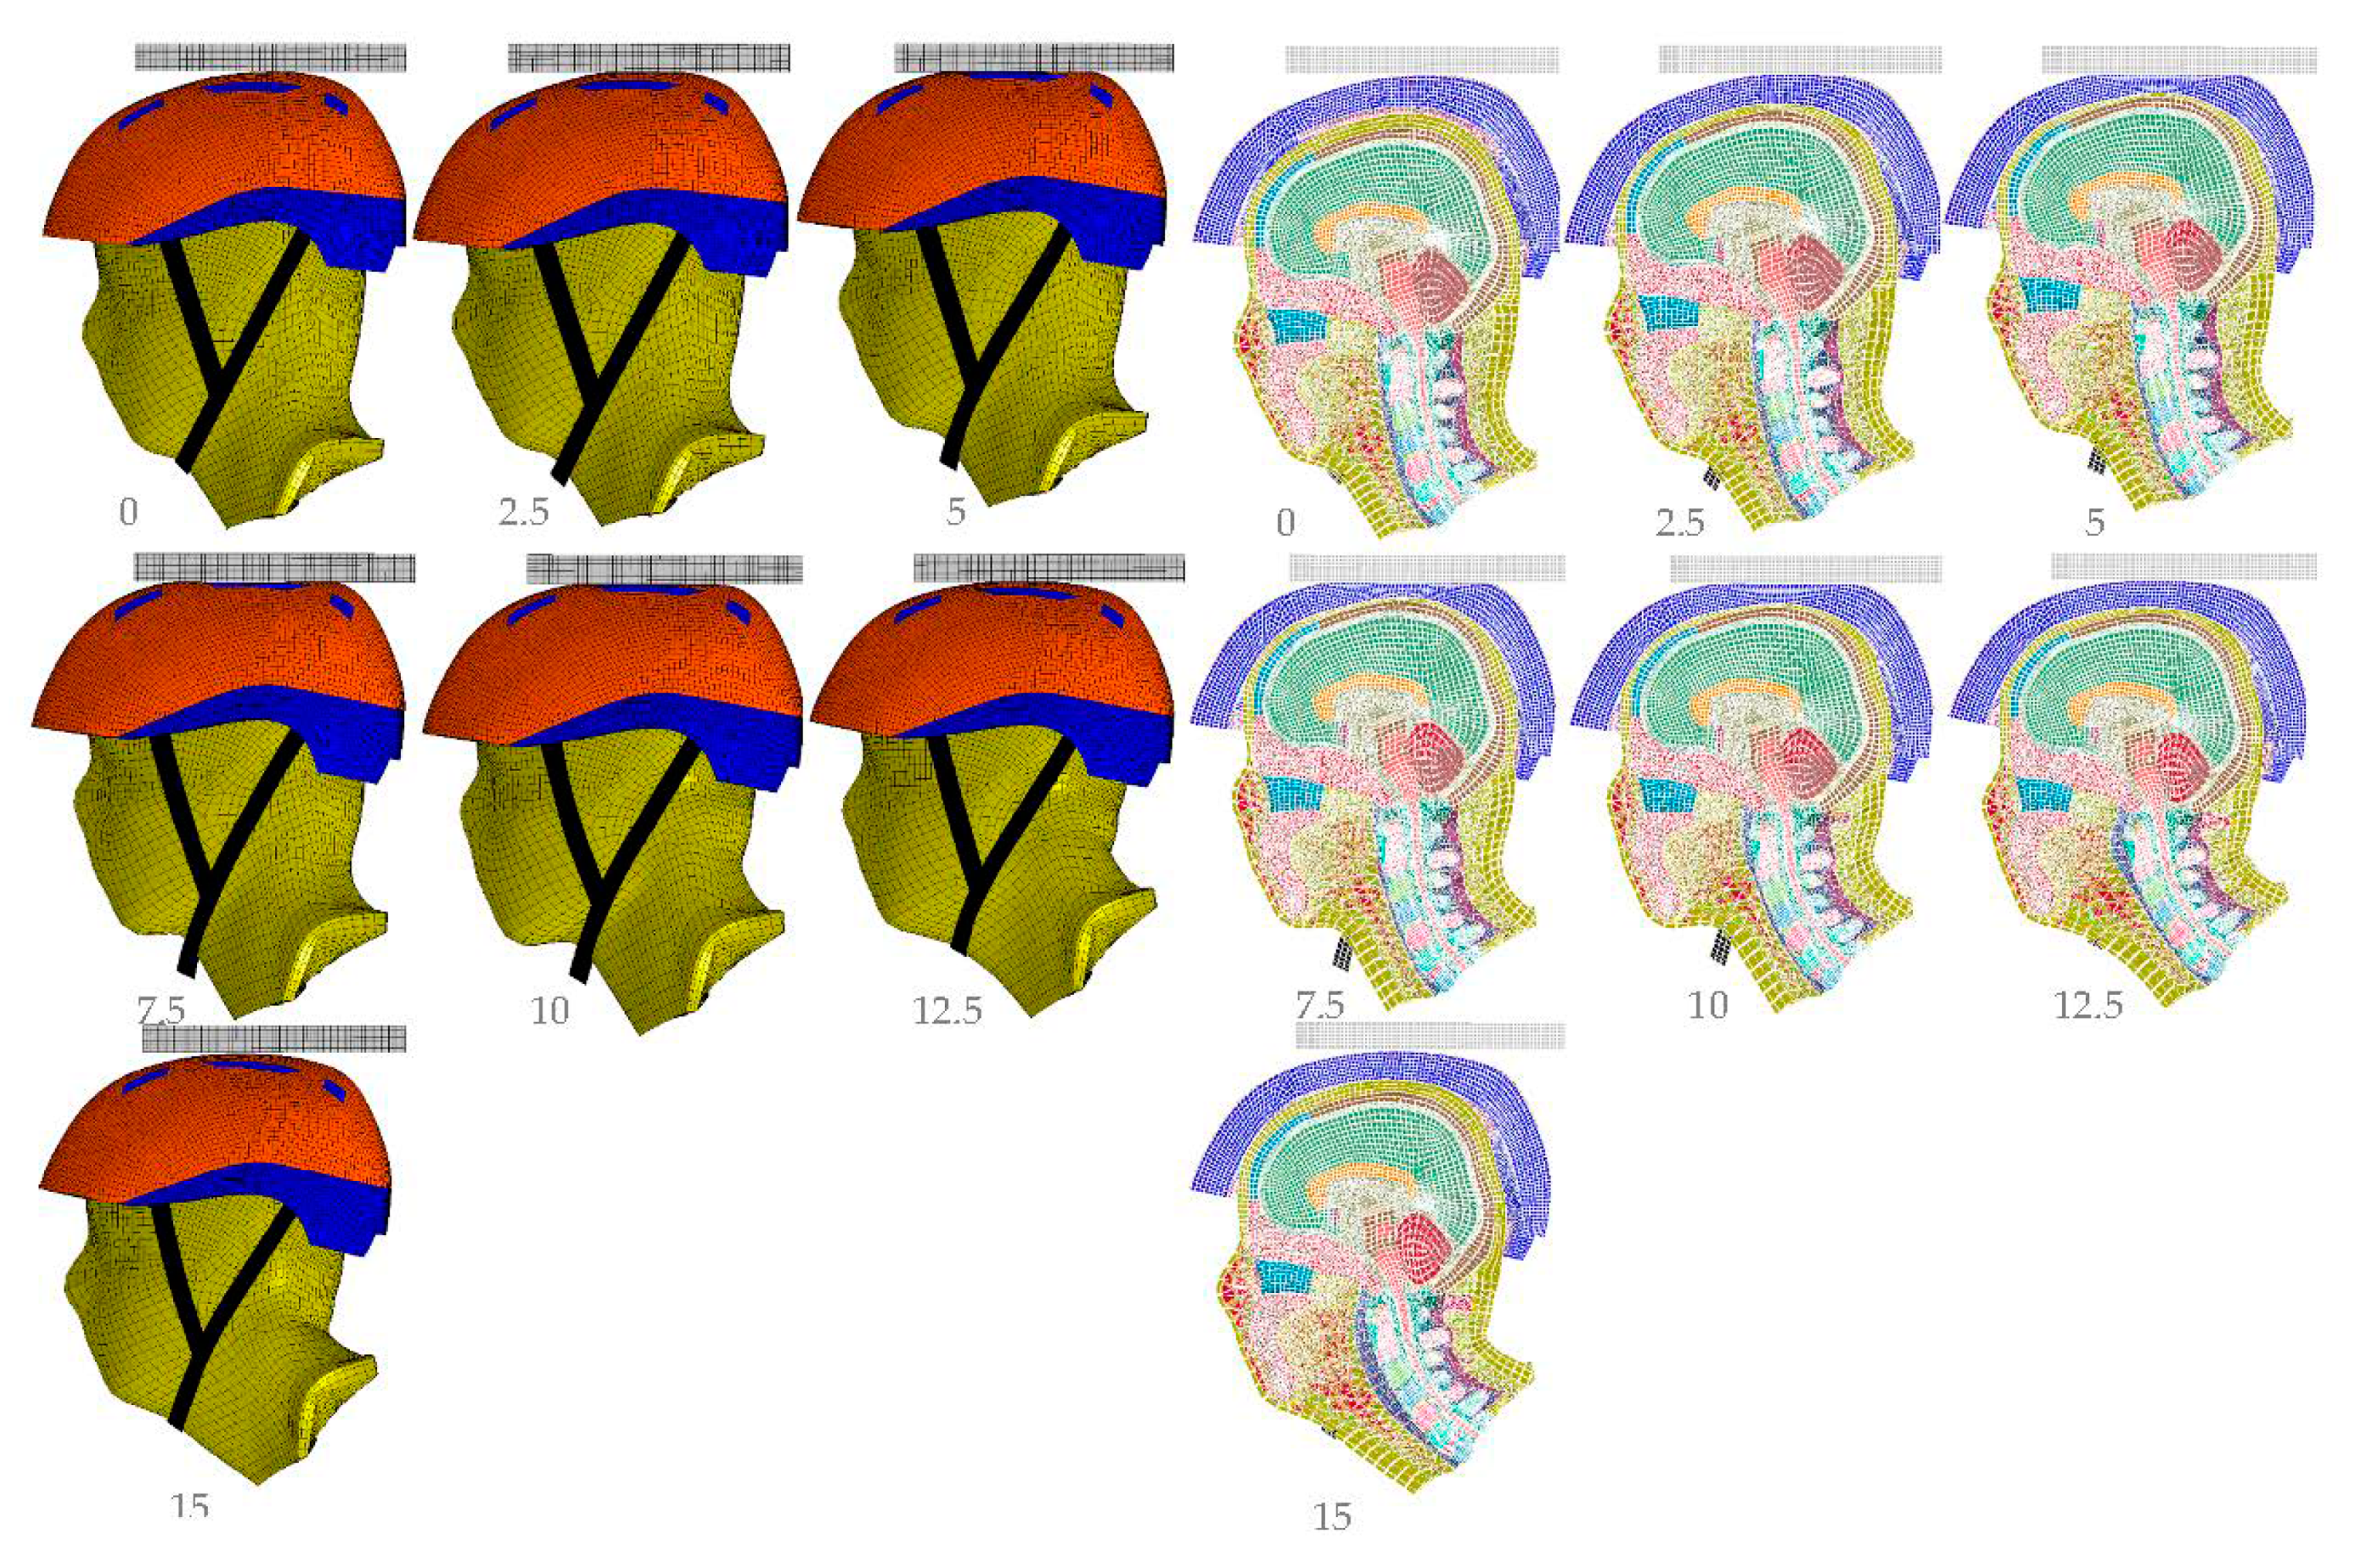
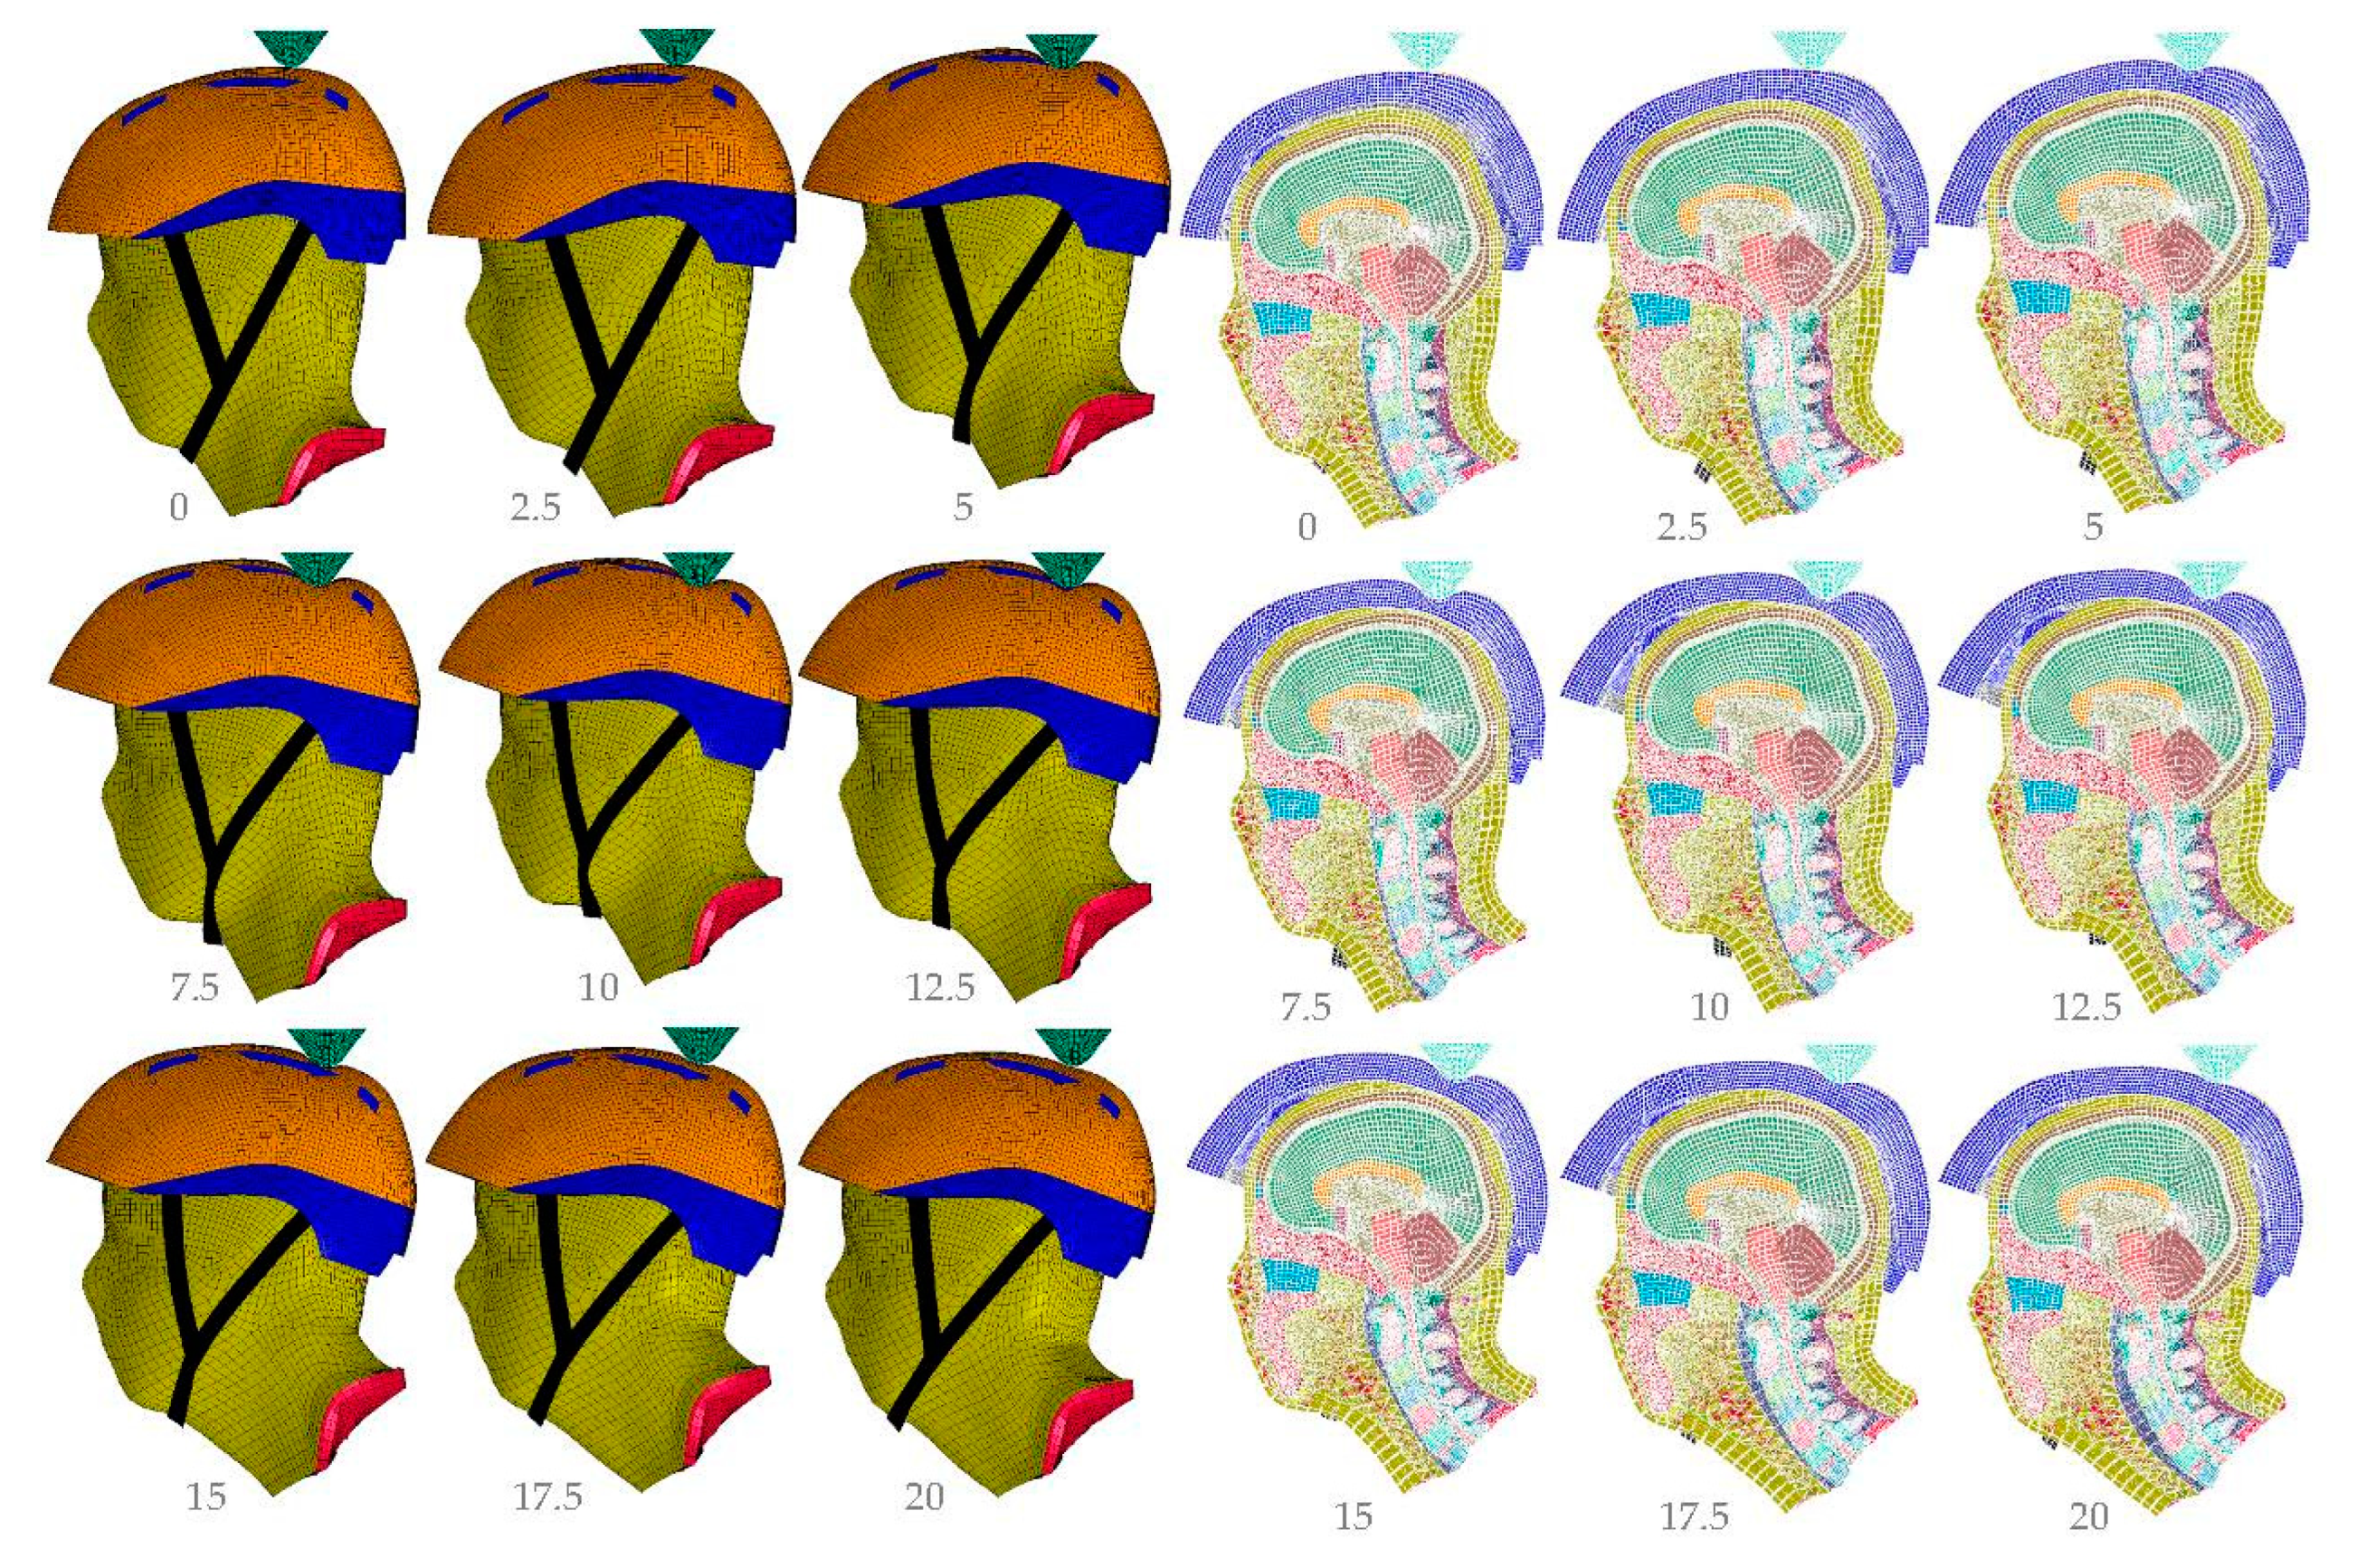
3.1.3. Helmet–Head Numerical Simulation Validation

The results of the flat and curbstone anvil impacts agree with previous experimental studies in terms of loading and unloading curves, maximum head acceleration, and effective impact duration with less than a 16% difference in these parameters, validating the simulations.

3.2. Injury Predictors Results

3.2.1. Peak Linear Acceleration (PLA)

The results obtained for the EN 1078 flat anvil test suggest a 75% of probability of concussion, whereas a 50% of probability of concussion is found on the curbstone anvil.

3.2.2. Gadd Severity Index (GSI)

The results obtained for the EN 1078 flat anvil test suggest a GSI value of 1086.6, indicating that the impact would incur serious internal head injuries. Meanwhile, the curbstone anvil test suggests a GSI value of 259.15, avoiding serious internal head injuries.

3.2.3. Generalized Acceleration Model for Brain Injury Threshold (GAMBIT)

The results obtained for the EN 1078 flat anvil test suggest a GAMBIT value of 0.4525, indicating a 73.75% probability of Abbreviated Injury Scale 2 (AIS2). Meanwhile, the curbstone anvil test suggests a GAMBIT value of 0.2593, indicating a 9.10% probability of AIS2.

3.2.4. Head Injury Criterion (HIC15)

The results obtained for the EN 1078 flat anvil test suggest that there is a 100% probability of minor injury, 88% of moderate injury, 49% of serious injury, 15% probability of severe injury, 2% of critical injury, and 0% of maximum injury.
The results obtained for the EN 1078 curbstone anvil test suggest that there is a 20% probability of minor injury, 7% of moderate injury, 3% of serious injury, and 0% probability of severe, critical, and maximum injury.

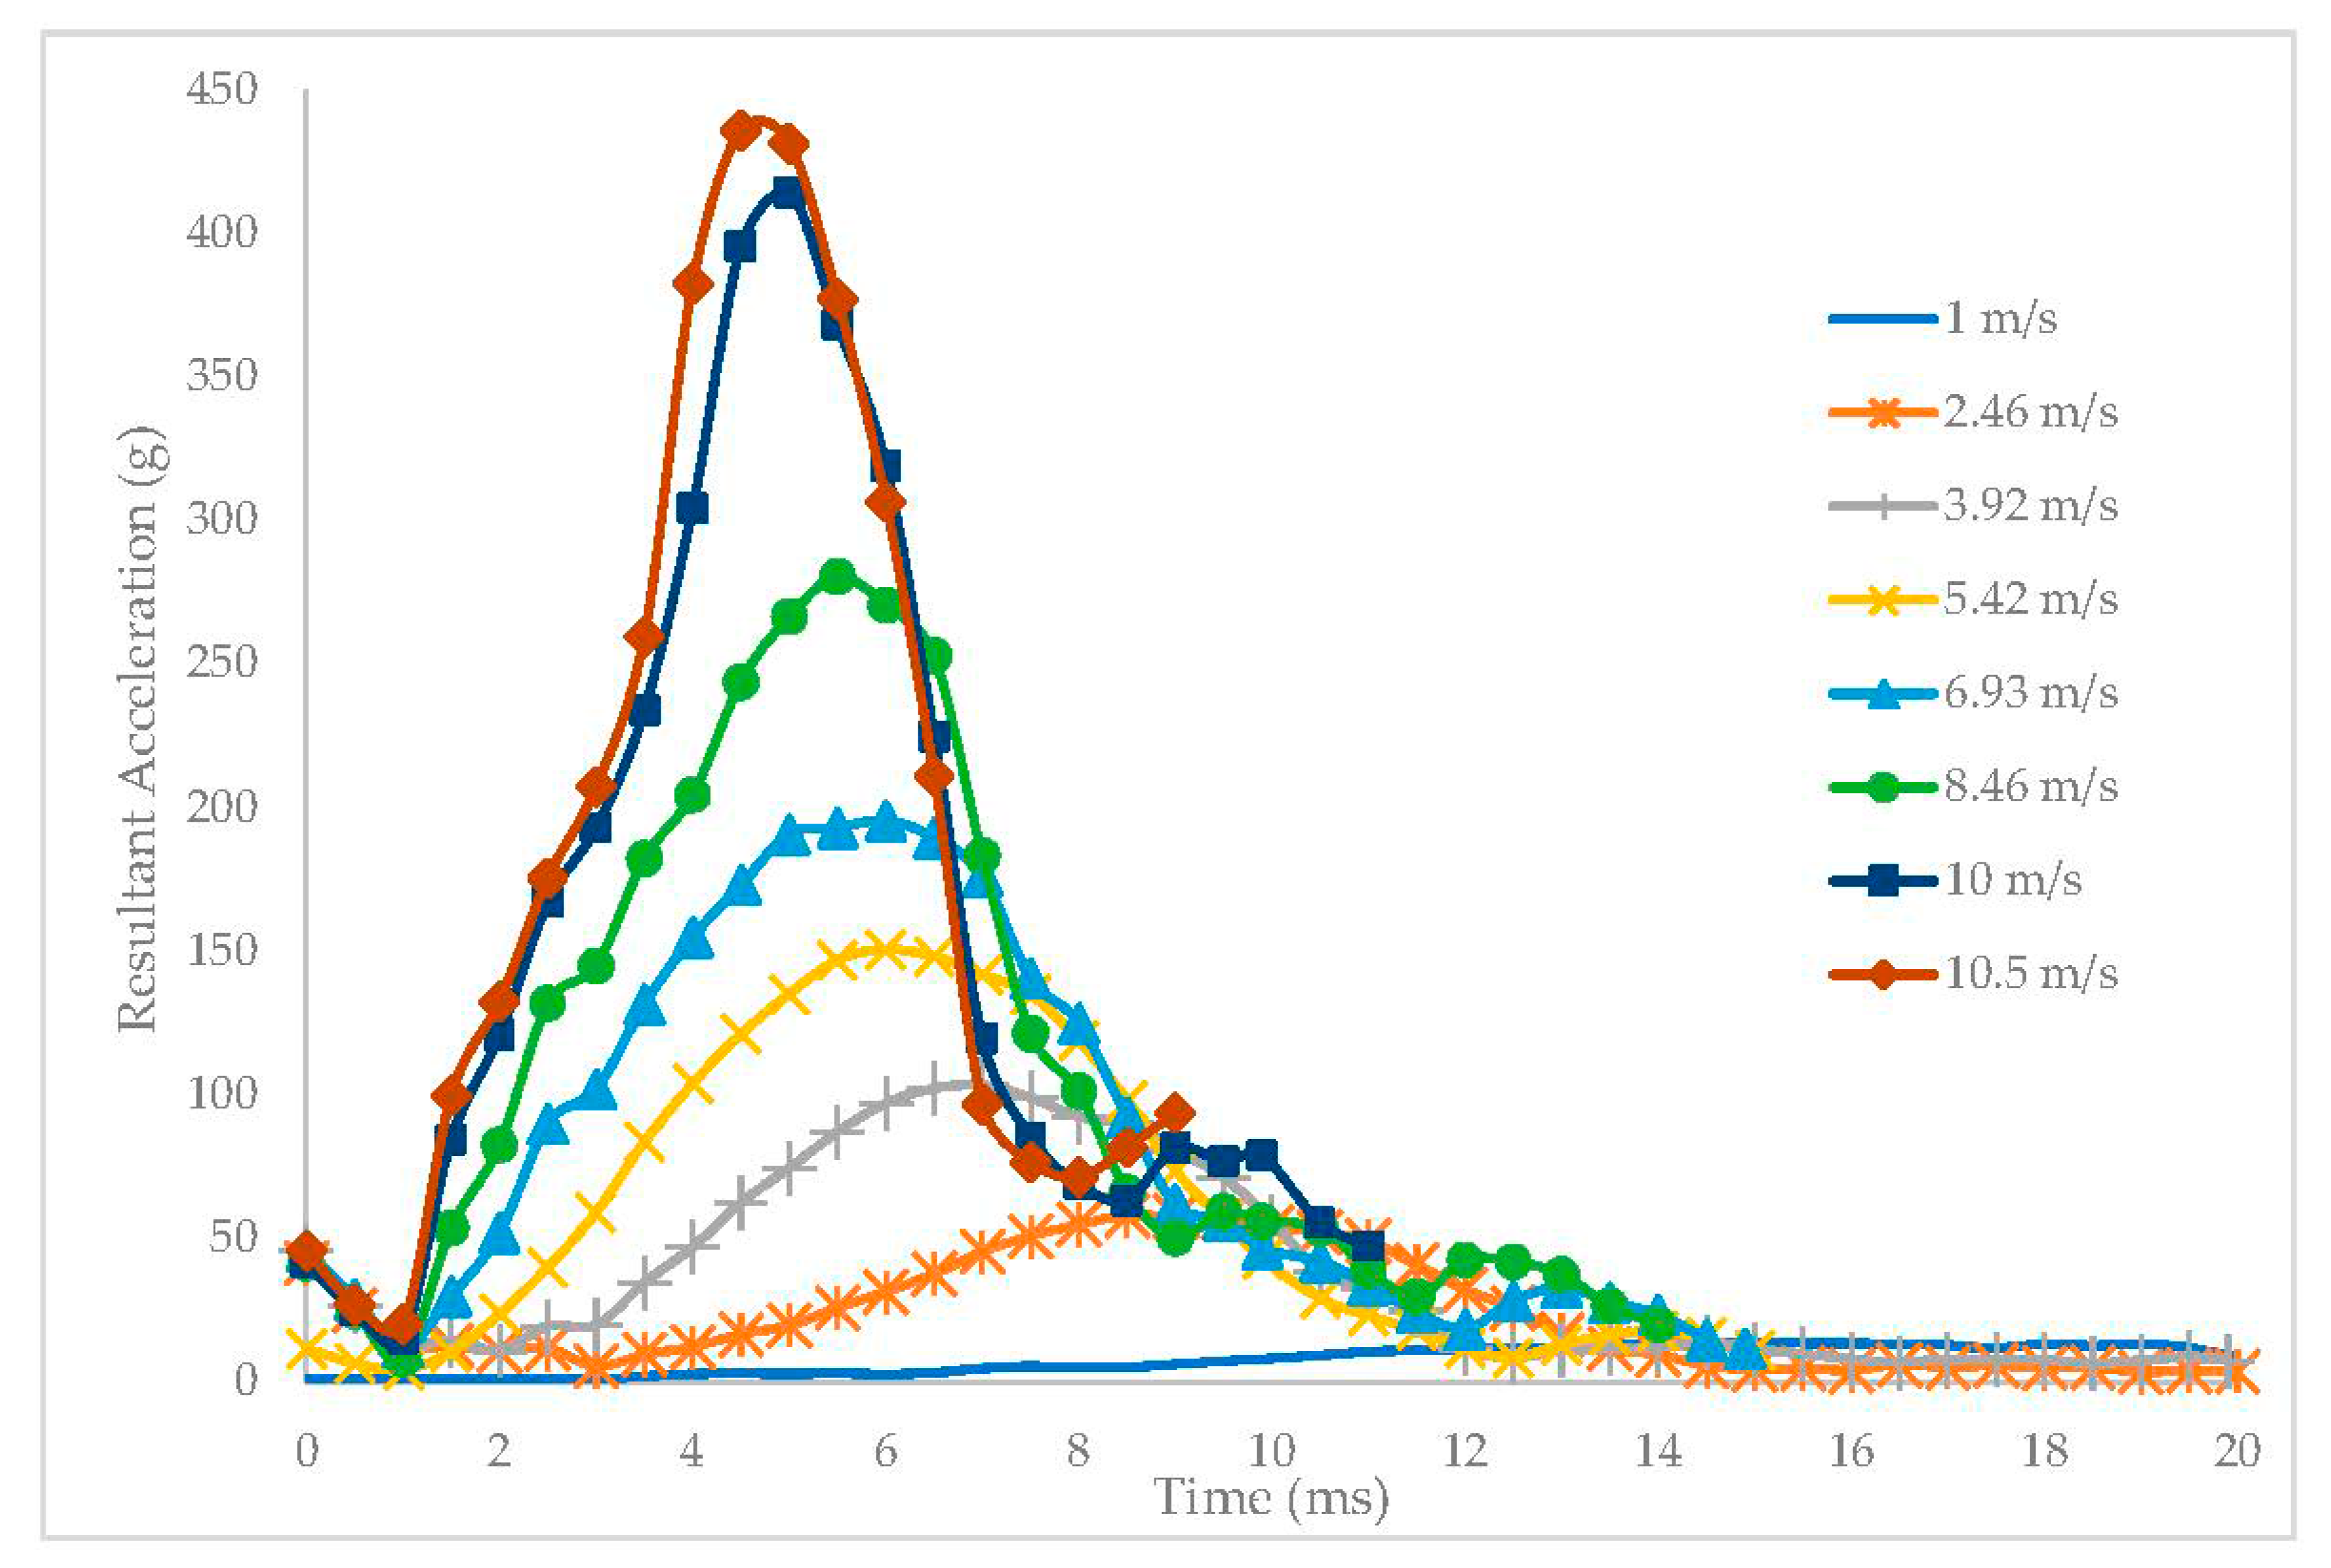
3.3. Influence of Velocity in Cyclist Safety

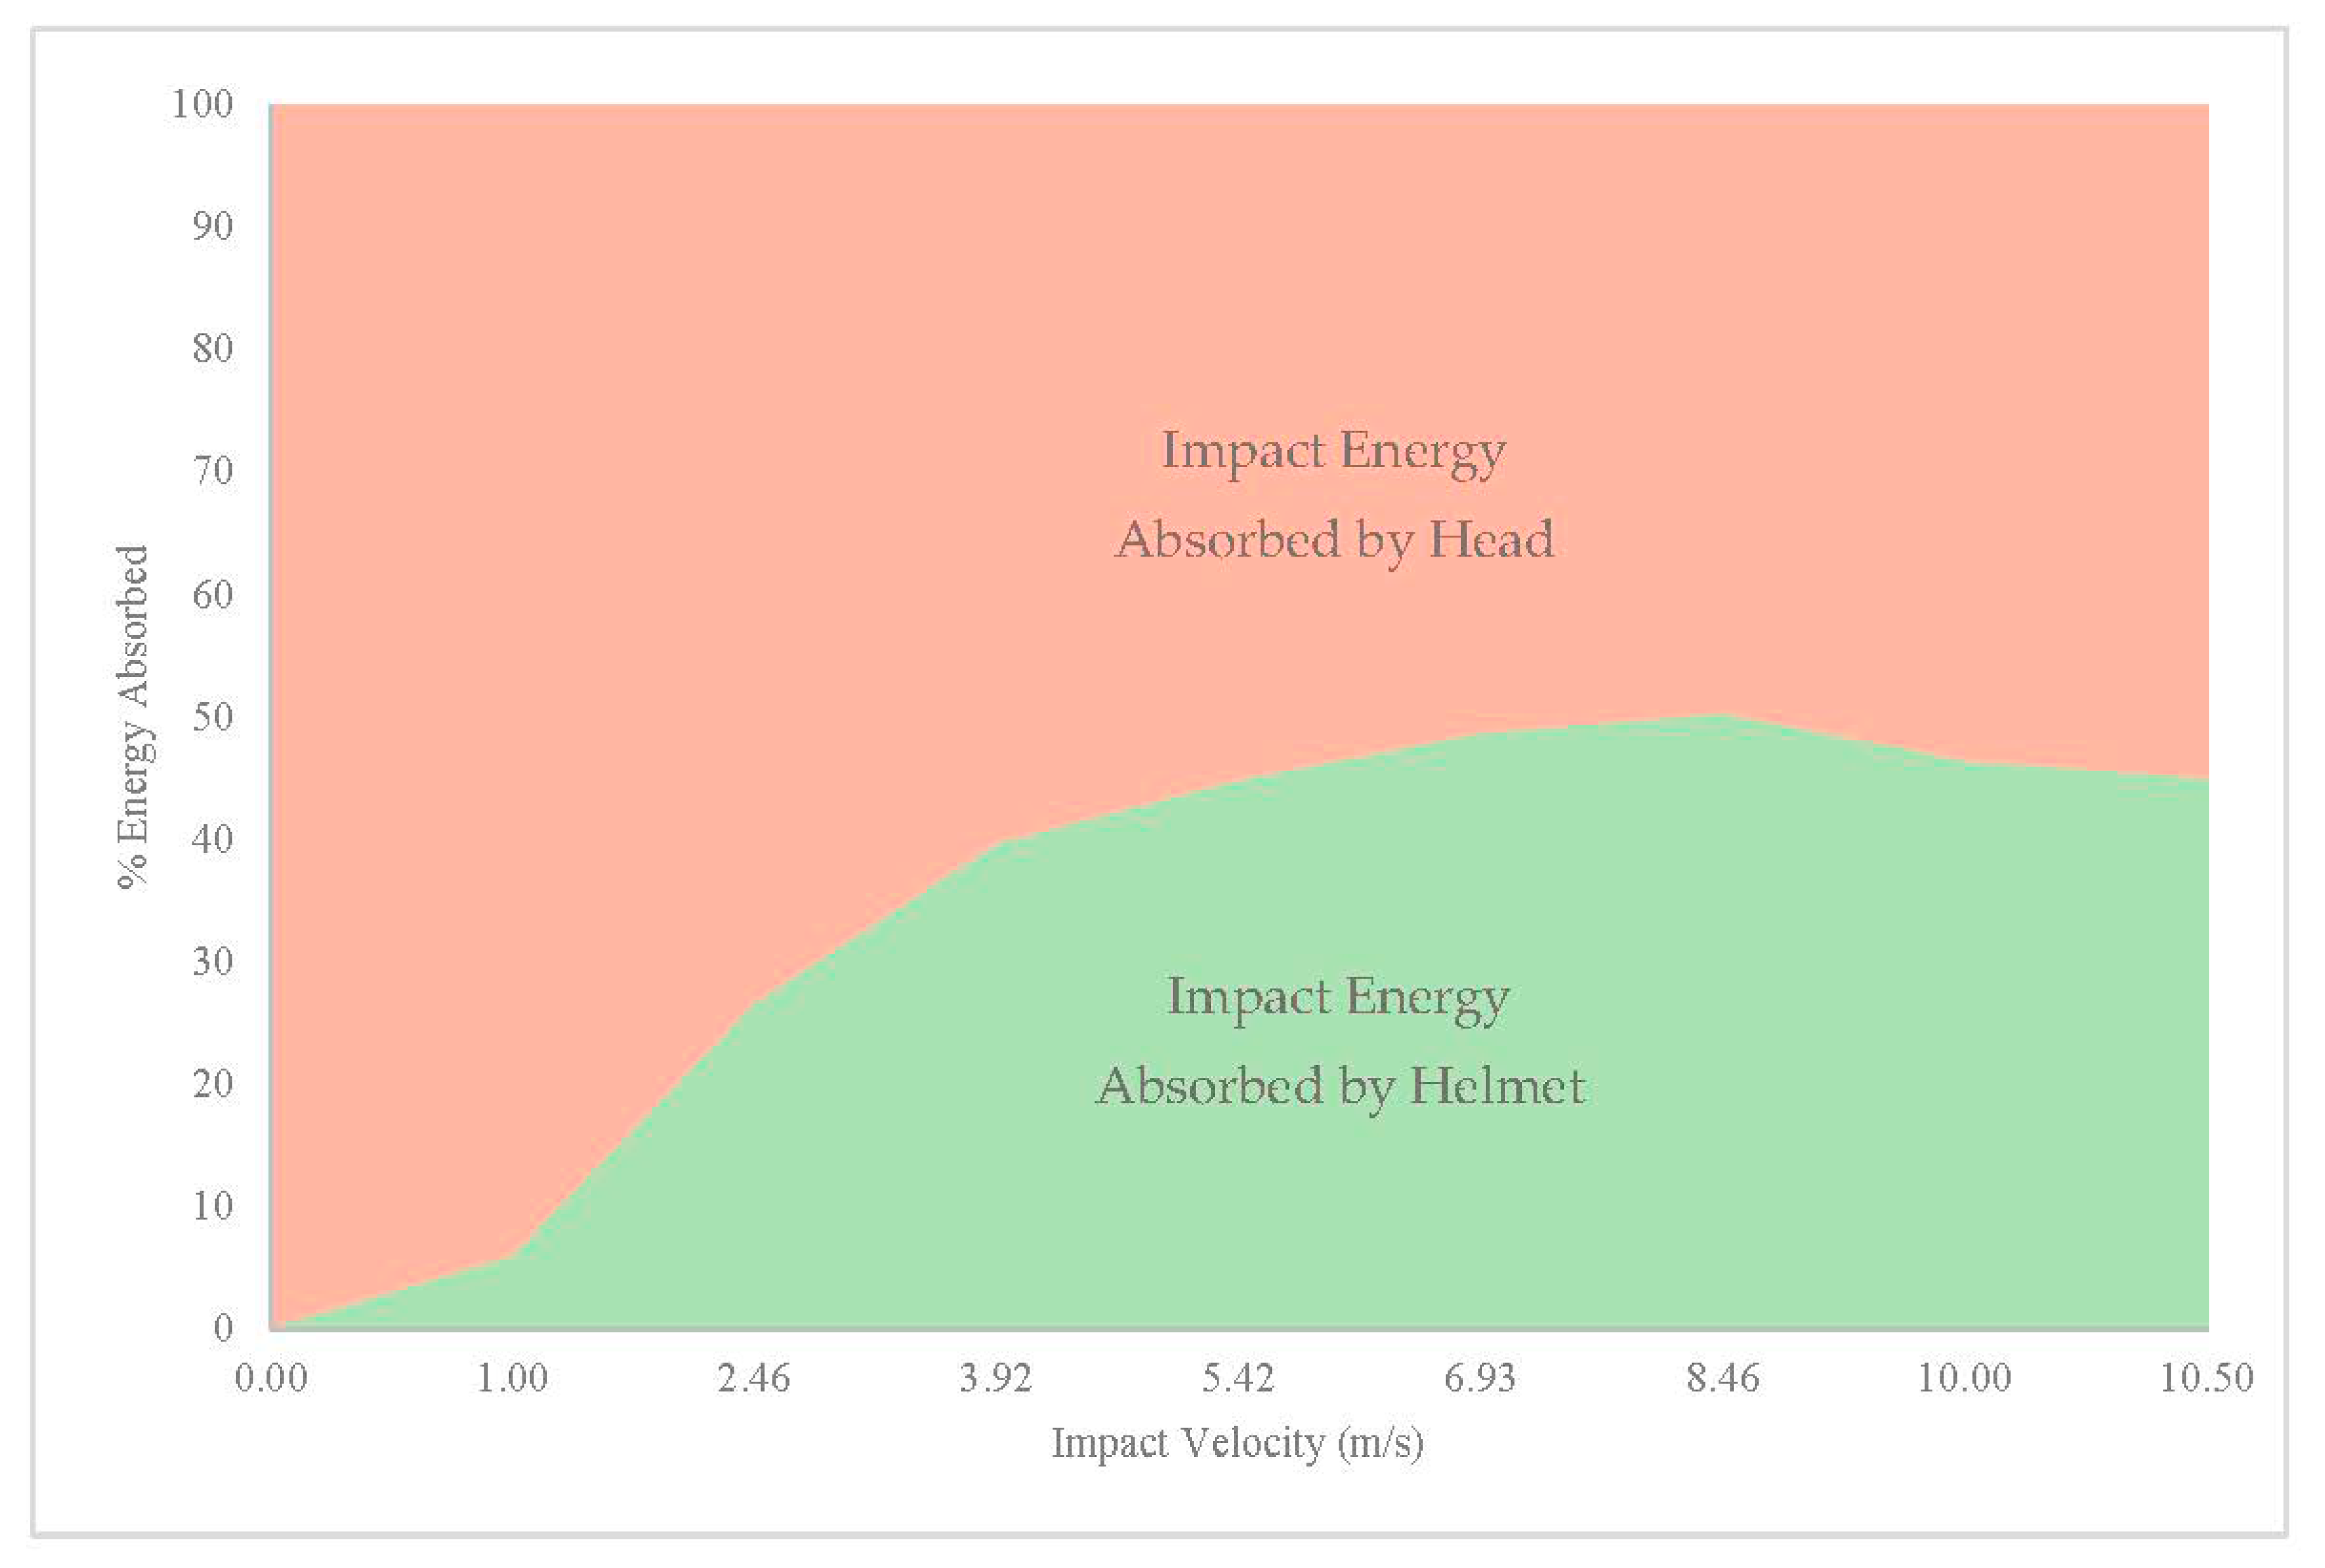
3.3.1. Energy Absorbed by the Helmet during Impacts

The helmet absorbs partial energy that the head otherwise would, reducing the probability of head injuries. To assess the percentage of energy absorbed, and the influence of velocity, the EN 1078 flat anvil test with velocity variation is implemented with eight simulations shown in Figure 9.
Figure 9 shows that with increasing velocity, the helmet tends to absorb a higher percentage of energy, the upmost at 8.46 m/s, absorbing 50.15%. These results suggest that the helmet is a key element of safety during accidents. Furthermore, it shows that even at low impact velocities (less than 10 km/h), the helmet is effective, absorbing up to 30% of the energy. For a standardized 5.42 m/s test, the helmet absorbs 44.7%.

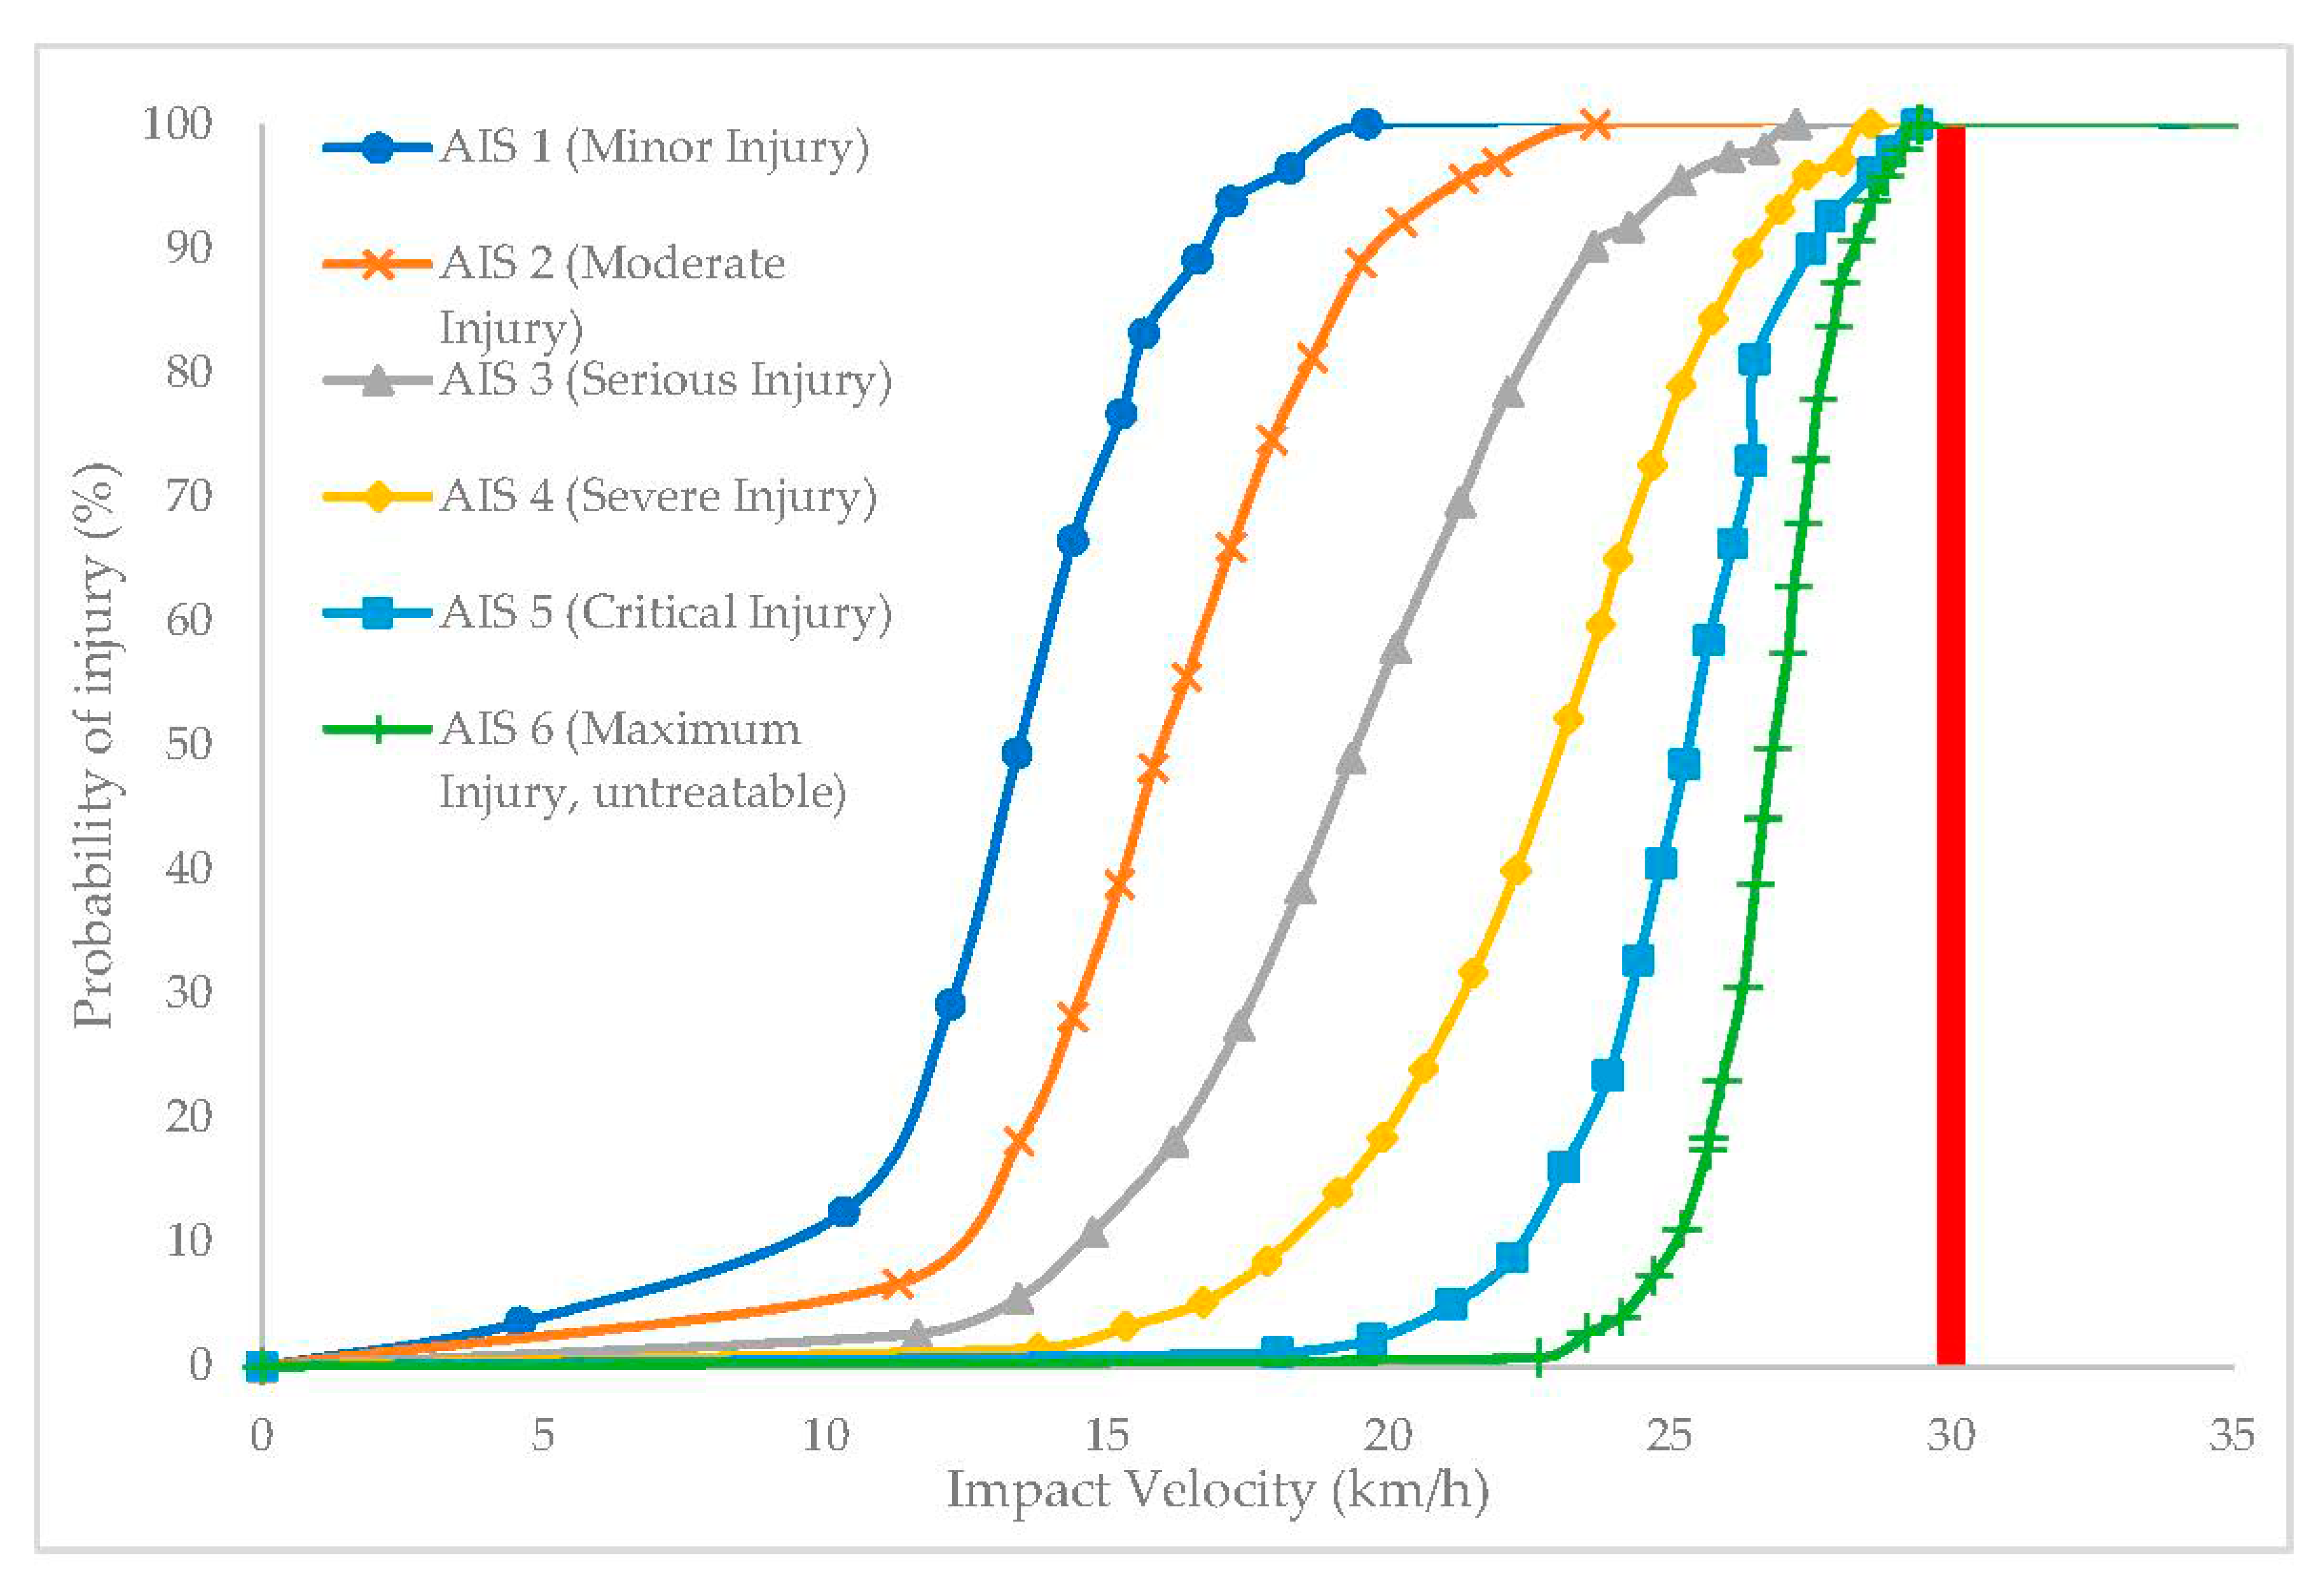
3.3.2. Result of a Parametric Study for the Development of an Injury Risk Curve

Eight numerical simulations are tested under EN 1078 conditions, with perpendicular impacts against a flat anvil at 1, 2.4, 3.92, 5.4, 6.93, 8.46, 10, and 10.5 m/s. The acceleration–time curves are shown in Figure 10.
Results suggest that the larger the impact velocity, the larger the maximum resultant acceleration and the lower the impact duration. Figure 10 results allow the computation of the HIC value at every impact velocity, from which the formula in Equation (7) is derived, fitting the HIC values as a function of velocity.
ln ( y ) = 3.04 ln ( x ) + 1.73 for   1 < x < 10.5
where: y is the HIC value; x is the impact velocity (m/s).
Merging the injury probability based on the HIC value [44] and the HIC value based on the impact velocity (Equation (7)), the curves shown in Figure 11 are derived.
Figure 11 relates head injury modes (Figure 4) to impact velocity for the worst-case-impact scenario while wearing a bicycle helmet. The results obtained suggest that minor and moderate injuries start to occur at 10 km/h and have a high probability of occurrence over 20 km/h. Serious and severe injuries start to occur at 15 km/h and have a high probability of occurrence at 27 km//h. Critical and maximum injuries start to occur at 20 km/h. The critical value for untreatable damage is 29.4 km/h.

4. Discussion

4.1. Effectiveness of Current Standards to Prevent Head Injuries

Standards define a threshold that helmet manufacturers must achieve, ensuring that helmets have to be at least as safe as the standard deems, preventing manufacturers from producing cheap and ineffective helmets. Nevertheless, the results obtained suggest that under standardized impact conditions, there is a high probability of multiple head injury modes occurring even with the helmet meeting the standard thresholds. Thus, it is suggested to measure the safety on standards based on head injury criteria rather than only measuring the maximum head acceleration.
By measuring head injury criteria (e.g., HIC15), a degree of safety could be assigned to each helmet model depending on the value obtained. This would allow a more precise measurement of how effective a helmet is under different impact conditions, analogous to Euro NCAP’s system to measure safety in cars.

4.2. Should a Bicycle Helmet Be Worn?

Disagreement is found on this subject. The results obtained in this research suggest that helmets can absorb up to 50% of all impact energy at high velocities, and 30% at low velocities. Nonetheless, it also suggests that the injury threshold for the worst-case-impact scenario is very low, and at velocities over 20 km/h, the probability of major injuries is noticeable. Despite this low injury threshold, the research suggests that it is safer to have an intermediate impact element between the head and the ground, which partially absorbs (reaching a maximum of 50%) the impact energy.

4.3. Relationship between Impact Velocity and Head Injury Probability

Bicycles have minimum active and passive safety equipment when compared to other means of transport (e.g., cars). The only component that will lower the energy absorbed by the head during an impact is the helmet, leading to lower critical injury velocities. Results for the worst-case standardized impact scenario suggest that minor injuries start to happen at 10 km/h, severe at 15 km/h, and the most critical at 20 km/h. At 29.4 km/h a threshold is reached where all the accidents result in fatalities. Thus, results suggest a strong relationship between different injury probability types and impact velocity.

5. Conclusions

This paper has emphasized on the analysis of head injuries that can happen while wearing a bicycle helmet and the effect that the helmet has in absorbing the impact energy. The research strongly suggests that while wearing a helmet does not avoid head injuries in all scenarios, it clearly has a positive influence in lowering the possible head injuries by absorbing up to 50% of impact energy.
Considering the results obtained in this paper, introducing new regulations should be considered to increase the likelihood of cyclist survival, the most significant being an obligation to wear bicycle helmets, regardless of age groups or road type, as the effectiveness of the helmet has been proven even at low impact velocities. Nevertheless, it has also been proven that for the worst-case-impact scenario, at high velocities, the likelihood of survival is low. Therefore, new regulations that consider the injury probability values based upon impact velocity could be introduced to increase cyclist survival until new research and development in the bicycle helmet field leads to an implementation of safer helmets.

Author Contributions

Conceptualization, D.S.-L. and M.R.-M.; methodology, D.S.-L., M.R.-M. and I.R.; simulations, D.S.-L. and J.A.-M.; investigation, J.A.-M., D.S.-L. and M.R.-M.; writing—review and editing J.A.-M., D.S.-L., I.R. and M.R.-M.; supervision, M.R.-M. and J.A.-M.; funding acquisition, M.R.-M. All authors have read and agreed to the published version of the manuscript.

Funding

This work has been carried out within the framework of the research project DPI2017-88166- of FEDER program financed by the Ministerio de Economía, Industria y Competitividad and the Spanish Ministry of Education, Culture and Sports for the professor’s mobility program José Castillejo’s 2018 grant (CAS18/00292).

Acknowledgments

The authors acknowledge the Ministry of Economy and Competitiveness of Spain and FEDER program under the Project DPI2017-88166-R for the financial support of the work; and Marcos Rodríguez-Millán thanks the Spanish Ministry of Education, Culture and Sports for the professor’s mobility program José Castillejo’s 2018 grant (CAS18/00292).

Conflicts of Interest

The authors declare no conflict of interest.

References

  1. Commision, E. Traffic Safety Basic Facts-Main Figures Cyclists Traffic Safety Basic Facts 2018; European Commission: Brussels, Belgium, 2018. [Google Scholar]
  2. Highway Traffic Safety Administration, N.; Department of Transportation, U. 2016 Data: Bicyclists and Other Cyclists; National Highway Traffic Safety Administration: Washington, DC, USA, 2016.
  3. Foundation, S.L. Road Statistics Involving Bicycle Users in India; Save Life Foundation: New Delhi, India, 2017. [Google Scholar]
  4. Olofsson, E.; Bunketorp, O.; Andersson, A.L. Helmet use and injuries in children’s bicycle crashes in the Gothenburg region. Saf. Sci. 2017, 92, 311–317. [Google Scholar] [CrossRef]
  5. Macpherson, A.; Spinks, A. Cochrane review: Bicycle helmet legislation for the uptake of helmet use and prevention of head injuries. Evid. Based Child Health Cochrane Rev. J. 2008, 3, 16–32. [Google Scholar] [CrossRef]
  6. Olivier, J.; Creighton, P. Bicycle injuries and helmet use: A systematic review and meta-analysis. Int. J. Epidemiol. 2017, 46, 278–292. [Google Scholar] [CrossRef] [PubMed] [Green Version]
  7. Bíl, M.; Dobiáš, M.; Andrášik, R.; Bílová, M.; Hejna, P. Cycling fatalities: When a helmet is useless and when it might save your life. Saf. Sci. 2018, 105, 71–76. [Google Scholar] [CrossRef]
  8. Ohlin, M.; Strandroth, J.; Tingvall, C. The combined effect of vehicle frontal design, speed reduction, autonomous emergency braking and helmet use in reducing real life bicycle injuries. Saf. Sci. 2017, 92, 338–344. [Google Scholar] [CrossRef]
  9. Ramage-Morin, P.L. Health Reports Cycling in Canada; Statistics Canada: Ottawa, ON, Canada, 2017.
  10. Popa, I.; Ferraro, O.E.; Orsi, C.; Morandi, A.; Montomoli, C. Bicycle helmet use patterns in Italy. A description and analysis of survey data from an Italian friends of cycling association. Accid. Anal. Prev. 2017, 108, 268–274. [Google Scholar] [CrossRef]
  11. Elvik, R. Publication bias and time-trend bias in meta-analysis of bicycle helmet efficacy: A re-analysis of Attewell, Glase and McFadden, 2001. Accid. Anal. Prev. 2011, 43, 1245–1251. [Google Scholar] [CrossRef]
  12. Swami, H.M.; Puri, S.; Bhatia, V. Road Safety Awareness and Practices among School Children of Chandigarh. Indian J. Commun. Med. 2006, 31, 199. [Google Scholar]
  13. Schramm, A.; Rakotonirainy, A.; Haworth, N. The role of traffic violations in police-reported bicycle crashes in Queensland. J. Australas. Coll. Road Saf. 2010, 21, 61–67. [Google Scholar]
  14. Towner, E.; Dowswell, T.; Burkes, M.; Dickinson, H.; Towner, J.; Hayes, M. Bicycle Helmets-A Review of Their Effectiveness: A Critical Review of the Literature; Department for Transport: London, UK, 2002.
  15. BSEN 1078. Helmets for Pedal Cyclists and for Users of Skateboards and Roller Skates; BSI: London, UK, 1997. [Google Scholar]
  16. Mills, N.J.; Gilchrist, A. Finite-element analysis of bicycle helmet oblique impacts. Int. J. Impact Eng. 2008, 35, 1087–1101. [Google Scholar] [CrossRef]
  17. Der Perre, V.G. A Transient finite element study reveals the importance of the bycicle helmet material properties on head protection during an impact. In Proceedings of the IRCOBI Conference, York, UK, 9–11 September 2009. [Google Scholar]
  18. Teng, T.L.; Liang, C.L.; Nguyen, V.H. Development and validation of finite element model of helmet impact test. Proc. Inst. Mech. Eng. Part L J. Mater. Des. Appl. 2013, 227, 82–88. [Google Scholar] [CrossRef]
  19. Milne, G.; Deck, C.; Bourdet, N.; Carreira, R.P.; Allinne, Q.; Gallego, A.; Willinger, R. Bicycle helmet modelling and validation under linear and tangential impacts. Int. J. Crashworthiness 2014, 19, 323–333. [Google Scholar] [CrossRef]
  20. Mustafa, H.; Pang, T.Y.; Perret-Ellena, T.; Subic, A. Finite Element Bicycle Helmet Models Development. Procedia Technol. 2015, 20, 91–97. [Google Scholar] [CrossRef] [Green Version]
  21. Fahlstedt, M.; Halldin, P.; Kleiven, S. The protective effect of a helmet in three bicycle accidents—A finite element study. Accid. Anal. Prev. 2016, 91, 135–143. [Google Scholar] [CrossRef] [PubMed]
  22. Sandberg, M.; Tse, K.M.; Tan, L.B.; Lee, H.P. A computational study of the EN 1078 impact test for bicycle helmets using a realistic subject-specific finite element head model. Comput. Methods Biomech. Biomed. Eng. 2018, 21, 684–692. [Google Scholar] [CrossRef] [Green Version]
  23. Peng, Y.; Deck, C.; Yang, J.; Otte, D.; Willinger, R. A Study of Adult Pedestrian Head Impact Conditions and Injury Risks in Passenger Car Collisions Based on Real-World Accident Data. Traffic Inj. Prev. 2013, 14, 639–646. [Google Scholar] [CrossRef]
  24. McIntosh, A.S.; Patton, D.A.; Fréchède, B.; Pierré, P.-A.; Ferry, E.; Barthels, T. The biomechanics of concussion in unhelmeted football players in Australia: A case–control study. BMJ Open 2014, 4, e005078. [Google Scholar] [CrossRef] [Green Version]
  25. Newman, J.; Barr, C.; Beusenberg, M.; Fournier, E.; Shewchenko, N.; Welbourne, E.; Withnall, C. A new biomechanical assessment of mild traumatic brain injury. Part 2: Results and conclusions. IRCOBI (Int. Res. Counc. Biokinetics Impacts) 2000, 2000, 223–233. [Google Scholar]
  26. Gadd, C.W. Criteria for injury potential. In Proceedings of the Impact Acceleration Stress: A Symposium; The National Academies Press: Washington, DC, USA, 1961. [Google Scholar]
  27. Nokes, L.D.M.; Roberts, A.M.; Knight, B.H. Use of the Gadd severity index in forensic medicine: A case study. Forensic Sci. Int. 1995, 76, 85–90. [Google Scholar] [CrossRef]
  28. A Generalized Acceleration Model for Brain Injury Threshold (GAMBIT). Available online: http://www.ircobi.org/wordpress/downloads/irc1986/pdf_files/1986_9.pdf (accessed on 3 April 2020).
  29. Hutchinson, J.; Kaiser, M.J.; Lankarani, H.M. The Head Injury Criterion (HIC) functional. Appl. Math. Comput. 1998, 96, 1–16. [Google Scholar] [CrossRef]
  30. Kimpara, H.; Iwamoto, M. Mild Traumatic Brain Injury Predictors Based on Angular Accelerations During Impacts. Ann. Biomed. Eng. 2012, 40, 114–126. [Google Scholar] [CrossRef] [PubMed]
  31. Antona-Makoshi, J. Traumatic Brain Injuries: Animal Experiments and Numerical Simulations to Support the Development of a Brain Injury Criterion; Chalmers Tekniska Högskola. Division of Vehicle Safety: Gothenburg, Sweden, 2016; ISBN 9789162898489. [Google Scholar]
  32. Van den Bosch, H.L.A. Crash helmet testing and design specifications. Eindh. Tech. Univ. Eindh. 2006. [Google Scholar] [CrossRef]
  33. Brands, D.W.A.; Thunnissen, J.G.M.; Wismans, J.S.H.M. Modelling head injury countermeasures: A 3D helmet model. In Proceedings of the AGARD Conference Proceedings; AGARD: Neuilly sur Seine, France, 1997; pp. 26.1–26.8. [Google Scholar]
  34. Hardy, W.N.; Foster, C.D.; Mason, M.J.; Yang, K.H.; King, A.I.; Tashman, S. Investigation of Head Injury Mechanisms Using Neutral Density Technology and High-Speed Biplanar X-ray; SAE Technical Papers; SAE International: Warrendale, PA, USA, 2001; Volume 45, pp. 337–368. [Google Scholar]
  35. Hardy, W.N.; Mason, M.J.; Foster, C.D.; Shah, C.S.; Kopacz, J.M.; Yang, K.H.; King, A.I.; Bishop, J.; Bey, M.; Anderst, W.; et al. A study of the response of the human cadaver head to impact. Stapp Car Crash J. 2007, 51, 17–80. [Google Scholar]
  36. Snyder, R.G. Occupant Impact Injury Tolerances for Aircraft Crashworthiness Design; SAE Technical Papers; SAE International: Warrendale, PA, USA, 1971. [Google Scholar]
  37. McElhaney, J.H.; Roberts, V.L.; Hilyard, J.F. Handbook of Human Tolerance (1976 edition); Japan Automobile Research Institute: Tsukuba, Japan, 1976. [Google Scholar]
  38. Melvin, J.W.; Yoganandan, N. Biomechanics of Brain Injury: A Historical Perspective; Springer: New York, NY, USA, 2015; ISBN 9781493917327. [Google Scholar]
  39. Jin, X.; Yang, K.H.; King, A.I. Mechanical properties of bovine pia-arachnoid complex in shear. J. Biomech. 2011, 44, 467–474. [Google Scholar] [CrossRef] [PubMed]
  40. Arbogast, K.B.; Margulies, S.S. Material characterization of the brainstem from oscillatory shear tests. J. Biomech. 1998, 31, 801–807. [Google Scholar] [CrossRef]
  41. Brolin, K.; Halldin, P. Development of a Finite Element Model of the Upper Cervical Spine and a Parameter Study of Ligament Characteristics. Spine 2004, 29, 376–385. [Google Scholar] [CrossRef]
  42. Yoganandan, N.; Kumaresan, S.; Pintar, F.A. Geometric and mechanical properties of human cervical spine ligaments. J. Biomech. Eng. 2000, 122, 623–629. [Google Scholar] [CrossRef]
  43. Antona-Makoshi, J.; Davidsson, J.; Ejima, S.; Ono, K.; Brolin, K.; Anata, K. Correlation of Global Head and Brain Tissue Injury Criteria to Experimental Concussion derived from Monkey Head Trauma Experiments. In Proceedings of the IRCOBI 2013 Conference, Gothenburg, Sweden, 11–13 September 2013; Volume IRC-13-55, pp. 509–522. [Google Scholar]
  44. Hayes, W.C.; Erickson, M.S.; Power, E.D. Forensic Injury Biomechanics. Annu. Rev. Biomed. Eng. 2007, 9, 55–86. [Google Scholar] [CrossRef]
Figure 1. Helmet mesh.
Applsci 10 03692 g001
Figure 2. Mesh of partially validated cranio-cervical region.
Applsci 10 03692 g002
Figure 3. EN 1078 standard impact setup for (a) curbstone anvil; (b) flat anvil.
Applsci 10 03692 g003
Figure 4. Severity code, adapted from Hayes et al. [44].
Applsci 10 03692 g004
Figure 5. EN 1078 validation of flat anvil setup compared to previous research.
Applsci 10 03692 g005
Figure 6. EN 1078 flat anvil graphical sequence results (ms).
Applsci 10 03692 g006
Figure 7. EN 1078 curbstone anvil graphical sequence results (ms).
Applsci 10 03692 g007
Figure 8. EN 1078 validation of curbstone anvil setup compared to previous research.
Applsci 10 03692 g008
Figure 9. Energy absorbed by the Head and Helmet.
Applsci 10 03692 g009
Figure 10. Resultant head acceleration based on impact velocity for the EN 1078 flat anvil test.
Applsci 10 03692 g010
Figure 11. Probability of head injury modes based on impact velocity.
Applsci 10 03692 g011
Table 1. Helmet testing thresholds imposed by different testing standards.
EuropeUnited StatesAustralia New ZealandChina
Flat AnvilVelocity: 5.42 m/sVelocity: 6.2 m/sHeight: 1.5 mVelocity: 6.2 m/s
Max acc: 250 gMax acc: 300 gMax acc: 250 gMax acc: 300 g
Curved AnvilVelocity: 4.57 m/sVelocity: 4.8 m/sNotVelocity: 4.8 m/s
Max acc: 250 gMax acc: 300 gTestedMax acc: 300 g
Table 2. Minimum energy absorbed for same head form and helmet weight.
Flat Anvil J/(100 kgm/s2)Curbstone Anvil J/(100 kgm/s2)
Europe5.884.17
America6.403.84
Australia/New Zealand5.88Not Tested
China6.403.84
Table 3. Material properties of helmet.
Material Model in Ls-DynaMaterial PropertiesSource
EPS Foam (86.8 kg/m3)mat_low_density_foam_57ϱ = 86 kg/m3
E = 22.4 MPa
[18,32]
Straps (PET)mat_piece wise_linear_plasticit y_24ϱ = 1400 kg/m3
ʋ = 0.44
E = 1000 MPa
[18,32]
Shell (Fiberglass & Polyester Resin)mat_piecewise_linear_plasticity_24ϱ = 2080 kg/m3
ʋ = 0.325
E = 8.54 GPa
[32,33]
Anvil (Steel)mat_rigid_20ϱ = 7800 kg/m3
ʋ = 0.3
E = 200 GPa
[19]
Padding (PU Foam) mat_low_density_foam_57ϱ = 32 kg/m3
E = 0.47 MPa
[18,32]
Table 4. Material properties of partially validated cranio-cervical region.
Material ModelMaterial PropertiesSource
Scalp & Neck FleshFu Chang FoamStress–Strain curves at 3 Strain ratesHuman cadaver Scalp in Compression, McElhaney [37]
Skull TablesPiece-Wise Linear PlasticityE = 6.48 GPaHuman Skull Tables in Shear, McElhaney [37]
Skull DiploeIsotropic Elastic PlasticE = 40 MPaMcElhaney [37]
Dura MaterElasticE = 40 MPaHuman Dura in Tension Melvin [38]
Pia MaterElasticE = 12.5 MPaBovine Pia-Arachnoid in Shear [39]
Cerebrospinal Fluid (CSF)Elastic FluidK = 2.1 GPa
υ = 0.4999
McElhaney [37]
BrainBrain Linear ViscoelasticG0 = 1.6 kPa
G1 = 0.9 kPa
Porcine Brain Tissue in Shear Arbogast & Margulies [40]
Falx & TentoriumElasticE = 12.5 MPaJin et al. [39]
VertebraeRigid--
Intervertebral Discs & Facet JointsElasticE = 10 MPaBrolin et al. [41]
Neck LigamentsElasticE = 43.8 MPaYoganandan [42]

