Article

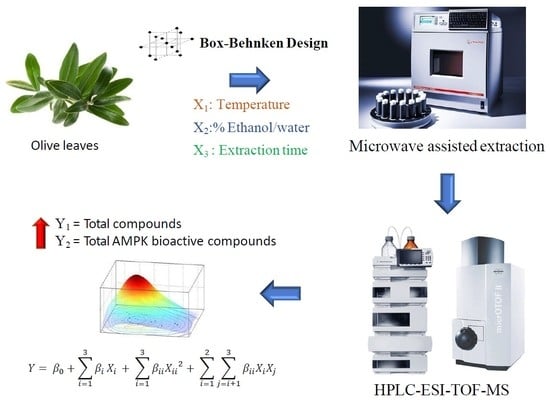
A Box-Behnken Design for Optimal Green Extraction of Compounds from Olive Leaves That Potentially Activate the AMPK Pathway

by
Beatriz Martín-García
1,
Sandra Pimentel-Moral
1,2,
Ana María Gómez-Caravaca
1,
David Arráez-Román
1,2,* and
Antonio Segura-Carretero
1,2
1
Department of Analytical Chemistry, Faculty of Sciences, University of Granada, Avd. Fuentenueva s/n, 18071 Granada, Spain
2
Functional Food Research and Development Center, Health Science Technological Park, Avd. del Conocimiento, Bioregion Building, 18100 Granada, Spain
*
Author to whom correspondence should be addressed.
Appl. Sci. 2020, 10(13), 4620; https://doi.org/10.3390/app10134620
Submission received: 29 May 2020 / Revised: 23 June 2020 / Accepted: 30 June 2020 / Published: 3 July 2020
(This article belongs to the Special Issue Sustainable Technologies for the Revalorization of Agro-Food Residues)

Abstract

:
Olive leaves contain bioactive compounds that have been shown to activate AMP-activated protein kinase (AMPK), which decreases intracellular lipid accumulation. Microwave-assisted extraction (MAE) is a green extraction technique that is frequently used in the recovery of phenolic compounds from plants. Thus, in this study, a Box-Behnken design was used to optimize MAE conditions such as temperature, percentage of ethanol and extraction time to obtain the maximum content of total compounds and compounds that activate AMPK. To this end, all extracts were characterized by High-Performance Liquid Chromatography Coupled to Electrospray Ionization Time-of-Flight Mass Spectrometry (HPLC-ESI-TOF-MS). The optimum conditions to obtain the highest content of total compounds were 123 °C, 100% of ethanol/water (v/v) and 23 min, whereas the optimum conditions for the highest amount of compounds that activate AMPK were 111 °C, 42% of ethanol/water (v/v) and 23 min. Thus, a multi-analysis by desirability was carried out to establish MAE optimal conditions for both responses. The optimum conditions were 111 °C, 100% EtOH and 23 min with a desirability of 0.97, which means that the responses are close to their individual optimal values. As a result, the olive leaf extract obtained at these optimal MAE conditions has great potential to be effective in the treatment of obesity.

Graphical Abstract

1. Introduction

The large amount of phenolic compounds present in olive leaves has attracted the interest of researchers and many studies have reported that olive leaves provide beneficial effects such as antioxidant capacity, antihypertensive, cholesterol lowering, cardioprotective, anti-inflammatory and as a coadjuvant in the treatment of obesity [1,2,3,4,5,6,7].
The extraction process is the main step in the recovery and isolation of bioactive compounds from plant samples [8]. Conventional extraction by maceration has several disadvantages such as low phenolic recovery, longer extraction times, toxic solvents and high energy consumption [9]. Therefore, green extraction techniques such as microwave-assisted extraction (MAE) have been developed to resolve the disadvantages of conventional extraction by reducing the extraction time and solvent consumption. This method is also respectful of the environment and it is economical [10]. Microwaves are electromagnetic fields in the frequency between 0.3 and 300 GHz. Microwaves can penetrate some materials and interact with the polar components to generate heat [11]. Heat improves the diffusivity of phenolic compounds from the matrix to the solvent [12].
Several parameters can affect the extraction efficiency of MAE, including microwave power, extraction time, solvent type and composition, liquid to solid ratio, sample particle size, soaking time, and number of extraction cycles [13]. With regard to the solvent, it is important that it provides high extracting power and strong interplay with the matrix and the bioactive compounds. Thus, ethanol and water are suitable in MAE because they can absorb microwave energy due to their high dielectric constant and dielectric loss, and they are also safe to use in the food industry [14,15]. Other important parameters in MAE are the time of extraction and the temperature. Short extraction times are used in MAE to avoid the degradation of the chemically active structures of phenolic compounds. On the other hand, high temperatures cause a decrease in viscosity and surface tension, which results in better solvent penetration. However, high temperatures can also break down the molecular structure of bioactive compounds, which results in a decrease in the extraction yield [16]. For these reasons, it is important to determine the optimum value of these MAE parameters in order to improve the extraction recovery of bioactive compounds.
Several studies have reported that secoiridoids present in extra virgin oil and olive leaves have the capacity to activate the AMP-activated protein kinase (AMPK) [17,18]. This protein is the major regulator of energy metabolism at both the cell and the whole body level [19,20]. Acute activation of AMPK in adipose tissue suppresses lipolysis, whereas chronic pharmacological stimulation of this enzyme remodels adipocyte metabolism to promote energy dissipation and prevent re-esterification of fatty acids (FAs). These specific tissue effects indicate that this enzyme is suitable in the treatment of obesity and its related metabolic disorders [21]. In addition, it has been reported that olive leaf extract decreases intracellular lipid accumulation through AMPK dependent mechanisms in hypertrophic adipocytes [22]. It has been suggested that this effect is due to the presence of several fractions in olive leaf extract that contain specific compounds belonging to the secoiridoids, phenylethanoids, phenylpropanoids and flavonoids subclasses [22]. High recovery of these bioactive compounds from olive leaves can be achieved by optimizing the extraction conditions. In this study, an experimental Box-Behnken response surface design was used to optimize the MAE parameters of temperature, solvent composition and extraction time to obtain the highest total compounds content and compounds with the capacity to activate AMPK from olive leaves. To this end, the determination of total compounds in MAE olive leaf extracts was carried out by High-Performance Liquid Chromatography Coupled to Electrospray Ionization Time-of-Flight Mass Spectrometry (HPLC-ESI-TOF-MS).

2. Materials and Methods

2.1. Chemicals and Reagents

Ethanol and methanol were purchased from Fisher Scientific (Leicestershire, UK), and water was purified using a Milli-Q system (Millipore, Bedford, MA, USA). For HPLC analysis, LC-MS grade acetronitrile was purchased from Fisher (Fisher Scientific UK, Leicestershire, UK) and ultrapure water was obtained with the Milli-Q system described above. The acetic acid used was purchased from Fluka (Buchs, Switzerland). The standard compounds used for the quantification were hydroxytyrosol, and apigenin, which were purchased from Sigma-Aldrich (Saint Louis, MO, USA), and oleuropein was from Extrasyntheèse (Lyon, France).

2.2. Samples

Olive leaves were purchased from Hojiblanca cultivar grown in Seville (Spain). After collection, the fresh leaves were dried under controlled temperature at 22 °C. These were ground using an ultra-centrifugal mill ZM 200 (Retsch GmbH, Haan, Germany). The resulting powder, with an average particle size of 0.2 mm, was stored to avoid light exposure and kept at room temperature until the extraction.

2.3. Extraction of Phenolic Compounds from Olive Leaves by Microwave-Assisted Extraction (MAE)

MAE extraction was carried out in a microwave extraction reactor (Anton Paar GmbH, Graz, Austria) equipped with two standard magnetrons of 850 W that deliver up to 1500 W microwave power and an autosampler (model MAS 24). Extracts were prepared according to Pimentel-Moral et al. by adding 3 g of dried olive leaf powder into a closed extraction vessel with 30 mL of ethanol/water solvent mixture [23]. The solvent was selected because ethanol is generally recognized as a safe solvent to use in food products [24]. Extraction time, temperature and percentage of ethanol were varied according to the experimental design. After cooling, samples were centrifuged at 13,000 rpm for 15 min at 4 °C in a centrifuge (Sorvall ST 16 R, Thermo Scientific, Leicestershire, UK) and the supernatant was collected and evaporated at 35 °C to dryness in a Savan SC250EXP Speed-Vac (Thermo Scientific, Leicestershire, UK). The extract was stored at −18 °C until further use.

2.4. Characterization of MAE Olive Leaf Extract by High-Performance Liquid Chromatography Coupled to Electrospray Ionization Time-of-Flight Mass Spectrometry (HPLC-ESI-TOF-MS)

According to previous studies, dried olive leaf extracts obtained by MAE were reconstituted in the proportion of 1/4 m/v (0.25 mg/mL) of MeOH/H2O (50/50) and the extracts were filtered prior to analysis with single-use syringe filters (0.20 µm pore size) and then injected into the HPLC system [25,26].
Analyses of the phenolic compounds of olive leaves were carried out following the previously validated method of Talhaoui et al. [26] using Agilent 1200 Series Rapid Resolution liquid chromatography system (Agilent Technologies, CA, USA), which is comprised of a binary pump, degasser, and auto sampler. Phenolic compounds were separated using a Poroshell 120 EC-C18 (4.6 × 100 mm, 2.7 mm) from Agilent Technologies, at 25 °C and a flow rate of 0.8 mL min−1. The mobile phases were 1% of acetic acid as mobile phase A and acetonitrile as mobile phase B. The conditions of the solvent gradient were as follows: 0 min, 5% B; 4 min, 9% B; 7 min, 12% B; 8 min, 15% B; 9 min, 16% B; 14 min, 20% B; 15 min, 22% B; 18 min, 28% B; 19 min, 30% B; 20 min, 31% B; 21.50 min, 32% B; 23 min, 34% B; 24 min, 35% B; 25.5 min, 40% B; 27 min, 50% B; 30 min, 100% B; 34 min, 100% B; 36 min, 5% B.
In addition, the HPLC system was coupled to a microTOFTM (Bruker Daltonics, Bremen, Germany), an orthogonal-accelerated TOF mass spectrometer, using an electrospray interface (model G1607A from Agilent Technologies, Palo Alto, CA, USA). The effluent from the HPLC column was split using a T-type phase separator before being introduced into the mass spectrometer (split ratio = 1:3). Analysis parameters were arranged using a negative-ion mode with a scan range from m/z 50 to 1000. The optimum values for the ESI−MS parameters were as follows: capillary voltage, +4.0 kV; drying gas temperature, 200 °C; drying gas flow, 9.0 L min−1; and nebulizing gas pressure, 2.0 bar.
The data was processed using the software Data Analysis 4.0 (Bruker Daltonik, Bremen, Germany). The identified compounds were carried out by the generation of the candidate formula with a tolerance of 10 ppm (part per million mass error) using the SmartFormulaTM editor and considering their retention time (RT), mass spectrum and the information available in the literature. The integration of peak areas of compounds were carried out using Bruker Compass Target Analysis 1.2 software for compound screening (Bruker Daltonics, Bremen, Germany). Three standard calibration graphs were prepared for quantification of the compounds in the olive leaves using three standards (hydroxytyrosol, oleuropein and apigenin).

2.5. Response Surface Methodology for Evaluation of MAE Parameters on Concentration of Compounds in Olive Leaves

The evaluation was carried out using a Box-Behnken design with 3 variables. The MAE independent variables were temperature (X1) (50–150 °C), percentage of ethanol/water (X2) (0–100% (v/v)) and extraction time (X3) (5–40 min). A total of 15 experiments with 3 central points were conducted in a randomized order (Table 1). Optimum MAE conditions were estimated considering the maximum responses variables: total compounds and total AMPK bioactive compounds by using Statgraphics Centurion software provided by Statpoint Technologies. The relationship between the independent variables and concentration of compounds was analyzed by a response surface plot, which represents the dependent variable as a function of the two most influential independent variables.

3. Results and Discussion

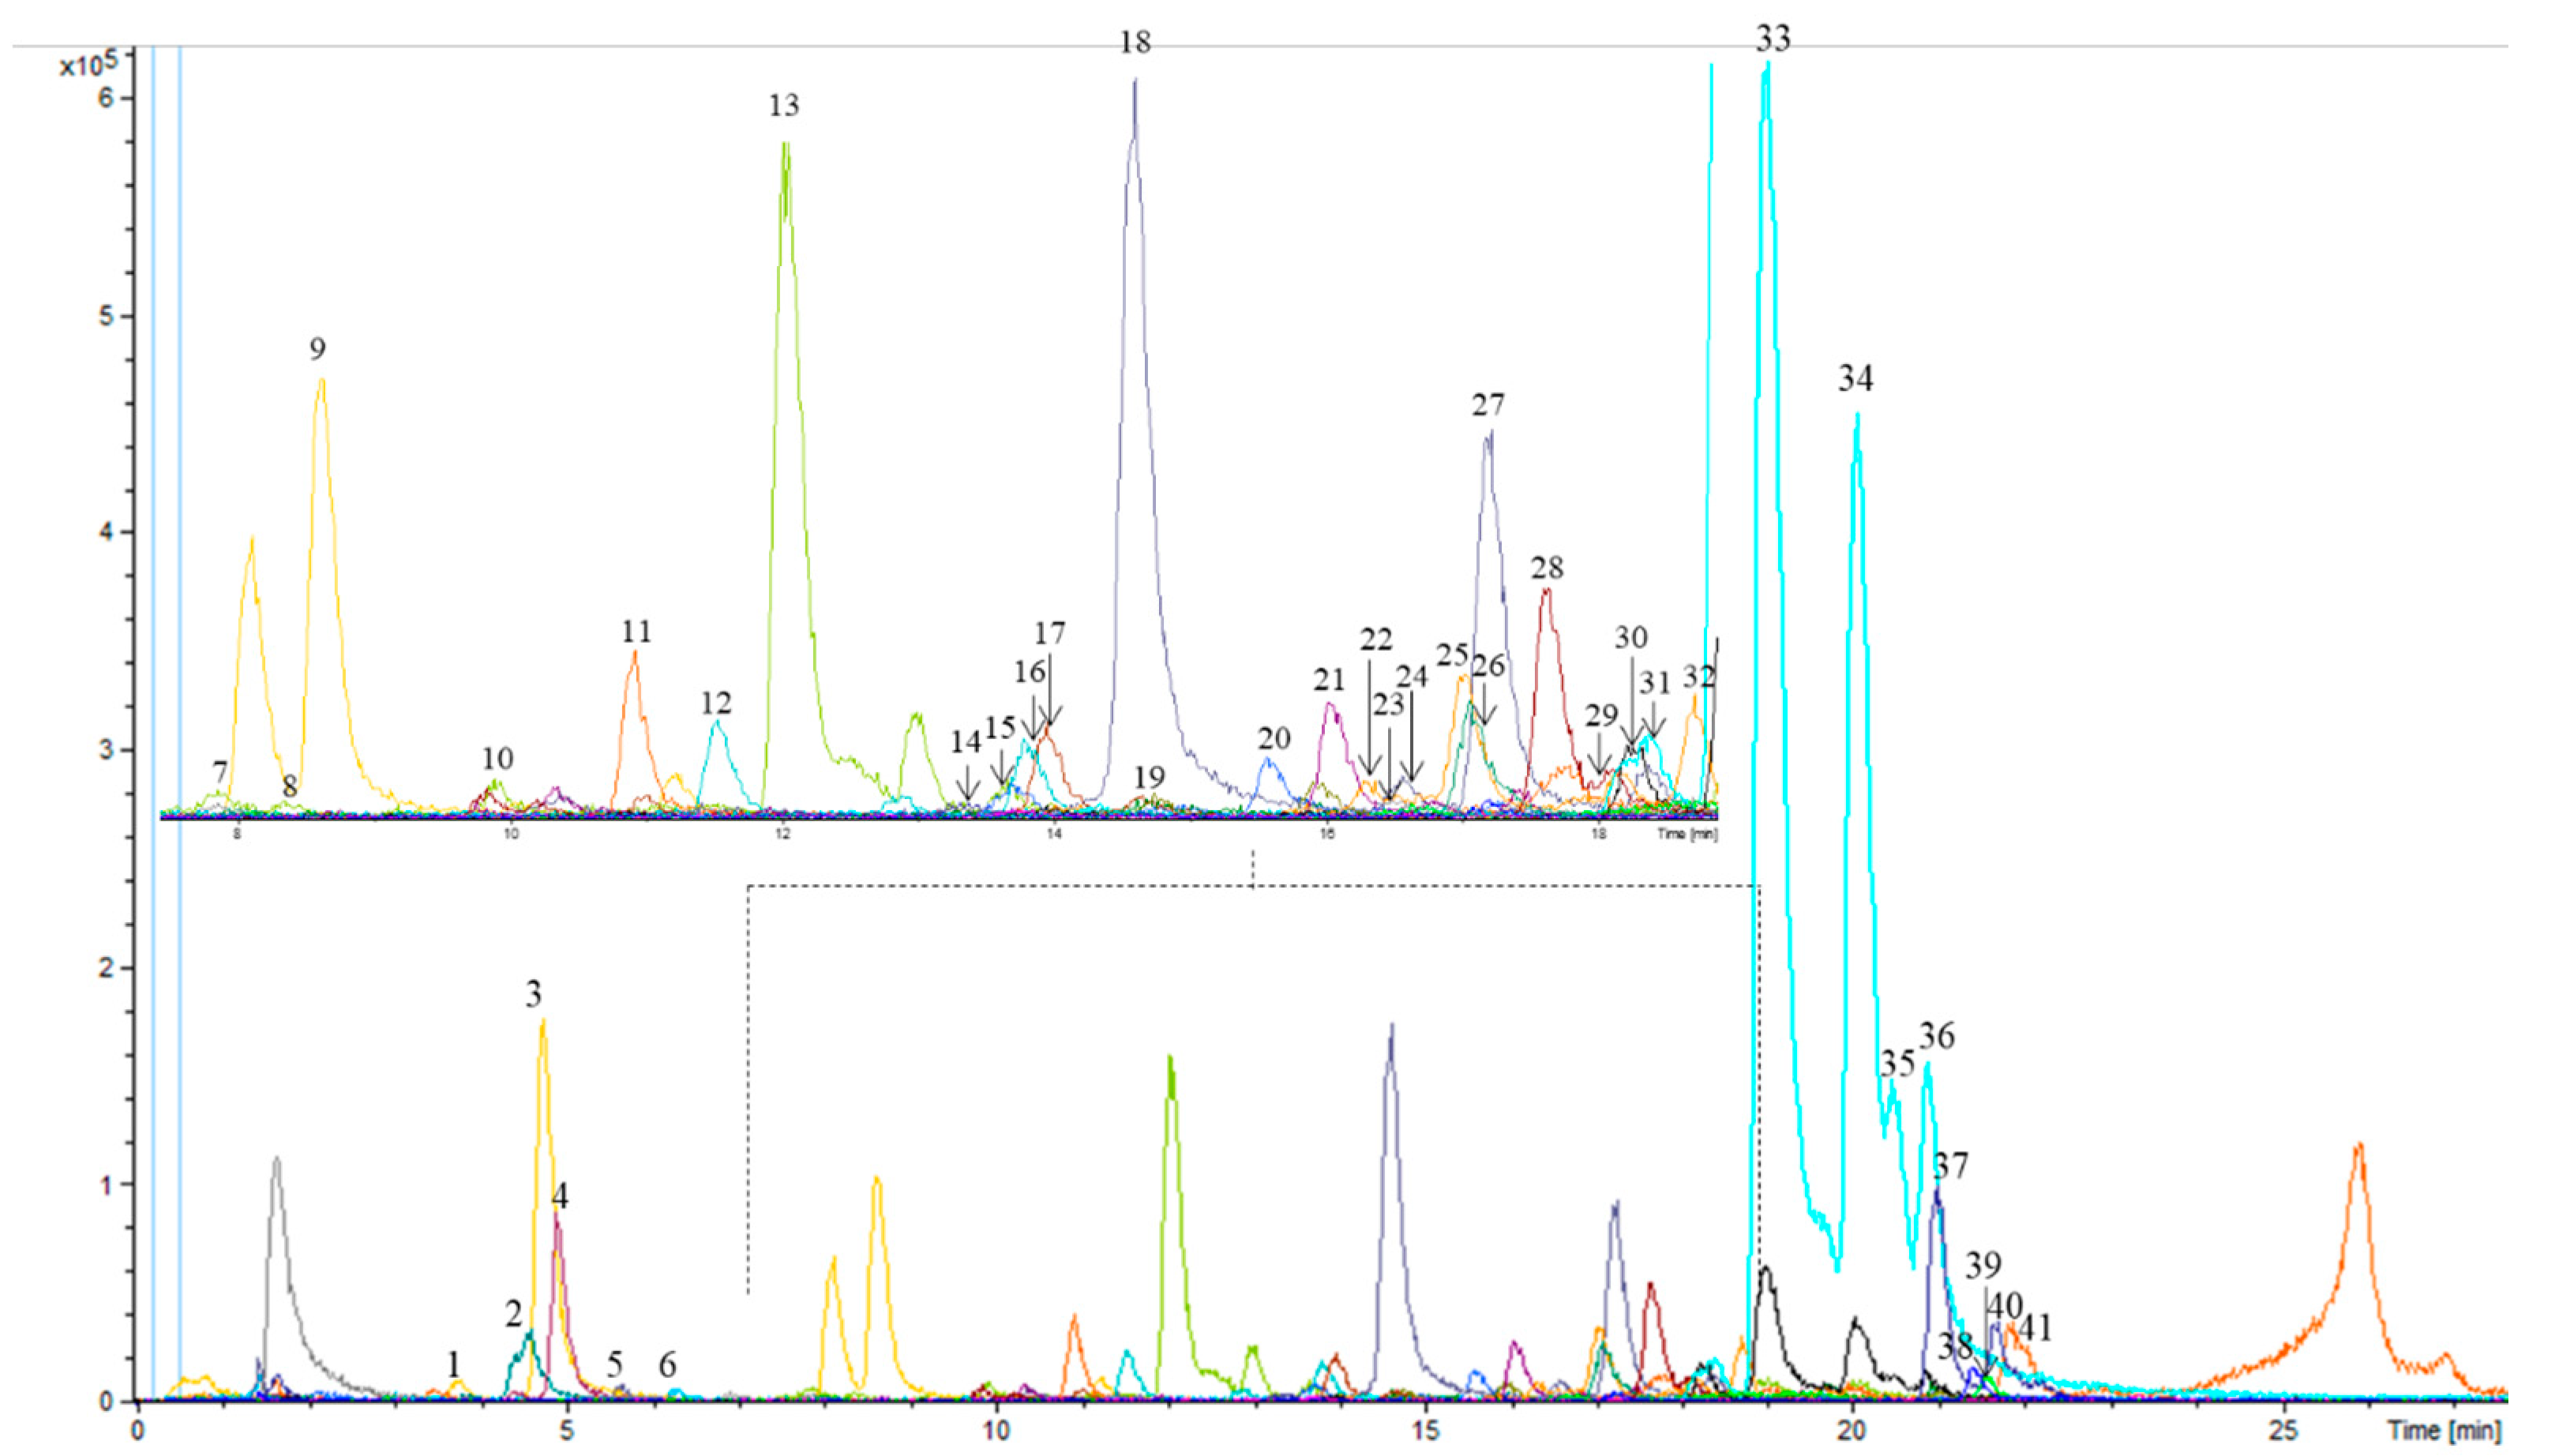
3.1. Determination of Phenolic and Other Compounds in Olive Leaf Samples by HPLC-ESI-TOF-MS

A total of 41 compounds were identified in MAE olive leaf extracts, which were identified by considering their mass spectra as determined via TOF-MS and considering the data reported in the literature [22,26,27,28]. Figure 1 shows the extracted ion chromatogram obtained by HPLC-ESI-TOF-MS for each compound in the olive leaf extract from MAE 4. The parameters that enabled the identification of these phenolic compounds were retention time, experimental and calculated m/z, error, mSigma and the molecular formula (Supplementary Materials, Table S1).
Consequently, individual compounds in olive leaf extracts were quantified by calibration curves of the standards: hydroxytyrosol, oleuropein and apigenin. All calibration curves revealed good linearity among different concentrations, and the determination coefficients were higher than 0.9958 in all cases (Supplementary Materials, Table S2). Quantification of individual compounds were classified by families of simple phenols, secoiridoids, flavonoids, other phenolic compounds and elenolic acids (Supplementary Materials, Table S3).
With regard to the simple phenols and derivatives, a total of three compounds were quantified. According to these results, the extraction of simple phenols improved with the use of water as their maximum content was obtained in MAE 12 and MAE 6 with 0% EtOH. This is due to the polar nature of simple phenols that make them water soluble, and water is more efficient in solvent extraction than ethanol [29]. In addition, the highest content of simple phenols was obtained in the extraction time range of 5–22.5 min and a temperature of 100–150 °C.
With regard to secoiridoids, a total of 18 phenolic compounds were quantified. Of these, oleuropein isomer a was the most abundant, with a high content of 60.00 ± 0.27 mg g−1 d.w. in MAE 4 (150 °C, 100% EtOH and 22.5 min). In addition, MAE 4 conditions resulted in the best total secoiridoids content. Therefore, this result showed that an increase in temperature provides an increase in the concentration of secoiridoids. This can be attributed to the increase in the solubility of oleuropein at high temperatures and 100% of ethanol [30].
A total of 14 of flavonoids were found and the highest content was obtained at 100 °C, 50% EtOH and 22.5 min. The most concentrated flavonoid was luteolin glucoside isomer a (0.16 mg g−1 d.w.–0.55 mg g−1 d.w.). These results suggest that the content of flavonoids increases with the temperature up to 100 °C. Thus, temperatures higher than 100 °C decreased the content of flavonoids because these compounds are thermosensitive, especially flavonoids glycosides. This decrease was attributed to the thermal oxidation of the hydroxyl groups of glycoside [31]. Regarding elenolic acids, four compounds were quantified and 100 °C, 50% EtOH and 22.5 min were the best conditions for maximizing elenolic content. Hence, an increase in the temperature up to 100 °C increases the content of these compounds, whereas an increase in the extraction time from 22.5 min to 40 min decreases elenolic acid content. This can be due to overexposure to microwave radiation, which leads to overheating and results in thermal degradation and oxidation of elenolic compounds [32].
Finally, it is important to note that the lowest total content of compounds was 21.02 ± 0.02 mg g−1 d.w., which was obtained in MAE 9 (50 °C, 50% EtOH and 5 min) and 21.84 ± 0.37 mg g−1 d.w. in MAE 8 (50 °C, 0% EtOH and 22.5 min), whereas the highest total content was 74.24 ± 0.50 mg g−1 d.w. which was obtained in MAE 4 at 150 °C, 100% ethanol and 22.5 min. Therefore, the highest content of total compounds was obtained at the maximum temperature and percentage of ethanol. This is because oleuropein, which is the most abundant secoiridoid in olive leaves, was extracted in the highest quantity at 100% of ethanol. Ethanol has the capacity to absorb the microwave radiation and heats up faster, thus, the increase in temperature improves the solubility of phenolic and elenolic compounds in ethanol and improves matrix penetration due to a decrease in surface tension and solvent viscosity [33]. In addition, the highest content of total compounds was obtained at 22.5 min. However, the total content decreased in extended extraction times of 40 min because overheating the solvent can lead to the degradation of most compounds [34].

3.2. Optimization of MAE Extraction Conditions

3.2.1. Optimization of Extraction Conditions for the Content of Total Compounds

The effect of optimization of temperature, time and % of ethanol amount on the content of the total compounds was analyzed by response surface methodology (RSM). Table 2 shows the results of the ANOVA test of the regression model for the response variable (total compounds). The data revealed that the value of the determination coefficient (R2) was 97.03%. This result explained a considerable part of the variance within the data. The proof of the lack of fit is a function of determining the model. The test is performed by comparing the variability of the residuals in the current model with the variability in the observations under repeated conditions of the factors. Lack of fit for this model has a p-value greater than 0.05 (p = 0.1716). Therefore, the model seems to be adequate for the data observed at the 95.0% confidence level. ANOVA partitions the variability of total compounds into separate pieces for each of the effects. Then it tests the statistical significance of each effect by comparing its average square against an estimate of the experimental error. In this case, temperature (X1) (p = 0.0043), % EtOH (X2) (p = 0.0069), the quadratic effect of the temperature (X11) (p = 0.0082) and quadratic of time (X33) (p = 0.0198) had significant effects on the response variable (p-value less than 0.05, indicating that they were significantly different from zero with a confidence level of 95.0%).
Response surface plots show the effect of two MAE parameters on the total content of compound while keeping the third parameter constant, and these are displayed in Figure 2. Figure 2a shows the positive effect of temperature and percentage ethanol on the total compounds, with the highest content appearing at 100–150 °C and 80–100% EtOH, while Figure 2b shows the maximum value of total compounds at 100–150 °C and 10–30 min. Finally, Figure 2c shows the effect of EtOH with time, with the highest content appearing in the range of 15–30 min and 95–100% EtOH.
The fitted equation of the model for total compounds with the significant MAE parameters of X1 (temperature), X2 (% EtOH), X11 (quadratic of temperature) and X33 (quadratic of time) can be seen below. The fitted equation of the model includes the effect of time (X3) (Equation (1)):
Total compounds = −57.8562 + 1.55431X1 + 0.231443X2 + 1.38944X3 − 0.00630364X11 − 0.0330993X33
Considering the equation to explain the model for total compounds behavior and understanding the influence of each independent variable, an optimization of the conditions to obtain the highest content of total compounds was proposed under the following optimized conditions: 123 °C, 100% EtOH and an extraction time of 23 min to obtain a predictable value of 75.60 mg g−1 d.w. of total compounds.
To verify the suitability of the model for total compounds, the predictable value of total compounds was compared with experimental values obtained at optimal conditions. The theoretical and experimental values were 75.60 mg g−1 d.w. and 86.7 ± 0.4 mg g−1 d.w., respectively. Analysis of the results revealed an acceptable variance (CV = 9.72%) between the theoretical and experimental data, therefore, the model was considered suitable.
Optimal conditions for the MAE of olive leaves have been reported previously in other research. Rafiee et al. [35] reported the highest phenolic content, expressed as mg TAE/g power (dw), in ‘Koroneiki’, ‘Roghani’ and ‘Mission’ cultivar at 50% EtOH and 15 min. This study used a constant composition of different solvents (water, 80% methanol, 50% ethanol and acetone). Japón-Luján et al. [36] found that the optimum conditions of 200 W, 8 min and 80% ethanol obtained the maximum value of oleuropein and flavonoids: 2.32% of oleuropein, verbascoside 631 mg Kg−1 d.w., apigenin-7-glucoside 1076 mg Kg−1 d.w., luteolin-7-glucoside 1016 mg Kg−1 d.w. in olive leaves. The optimum conditions found in these previous studies are different to ours because these studies did not evaluate temperature as the third MAE parameter and nor is it indicated even though it significantly affects phenolic recovery from olive leaves in MAE. At high temperatures, the solvent power increases because of a decrease in viscosity and surface tension, which helps the solvent to solubilize solutes and improves matrix wetting and penetration. In addition, in a closed vessel microwave extraction, the temperature exceeds the boiling point of solvent, leading to improved extraction efficiency [37]. Moreover, the pressure of the system increases the boiling temperature of the solvent [38].
There are few studies that have been carried out on the optimization of three MAE parameters, including the extraction temperature. Taamalli et al. [28] reported the optimal MAE parameters of 80 °C, 80% methanol and 6 min to obtain a yield of 16.70% of fresh leafweight. Alañón et al. [39] optimized the MAE conditions for the highest content of total compounds in olive leaves by using deep eutectic solvents with optimum conditions of 79.98 °C, 15.28 min and 48.63% of water, to obtain 28.52 mg g−1 d.w. of total compounds from olive leaves by HPLC-ESI-TOF-MS. Thus, there is a great difference between these MAE optimum conditions compared to those obtained in the present study. This could be because these previous studies used methanol and water as an extraction solvent. Nevertheless, ethanol has been shown to be a good solvent for phenolic extraction and also it is safe for human consumption [40]. Therefore, this study is the first time that the optimization of these MAE parameters has been carried out using a mixture of ethanol/water as an extraction solvent in order to obtain the maximum total compounds from olive leaves samples by HPLC-ESI-TOF-MS.
Furthermore, the experimental value of the content of total compounds obtained under optimum MAE conditions in this study was 65.9% higher than the value of the sum of individual compounds obtained by Alañón et al. [39] at optimum MAE conditions. Besides, the experimental result of this study was 40.5%, 39.9% and 31.3% higher than that obtained in ‘Sikitita’, ‘Picual’ and ‘Arbequina’ olive leaves, respectively, by ultrasonic assisted extraction (UAE) [26]. Also this was 38.7%, 81.3%, 59.8% and 37.6% higher than the means for all ‘Arbequina’; ‘Arbosana’, ‘Changlot Real’, ‘Picual’, ‘Koroneiki’ and ‘Sikitita’ cultivars, respectively, at four sampling times (June, August, October and December) obtained by UAE [25]. Therefore, a high concentration of compounds in olive leaf extract was obtained by using optimum MAE conditions compared with that obtained in previous studies using MAE and UAE. However, this difference may be due to agronomic variability in the sample such as harvesting season, cultivar, etc. [25].

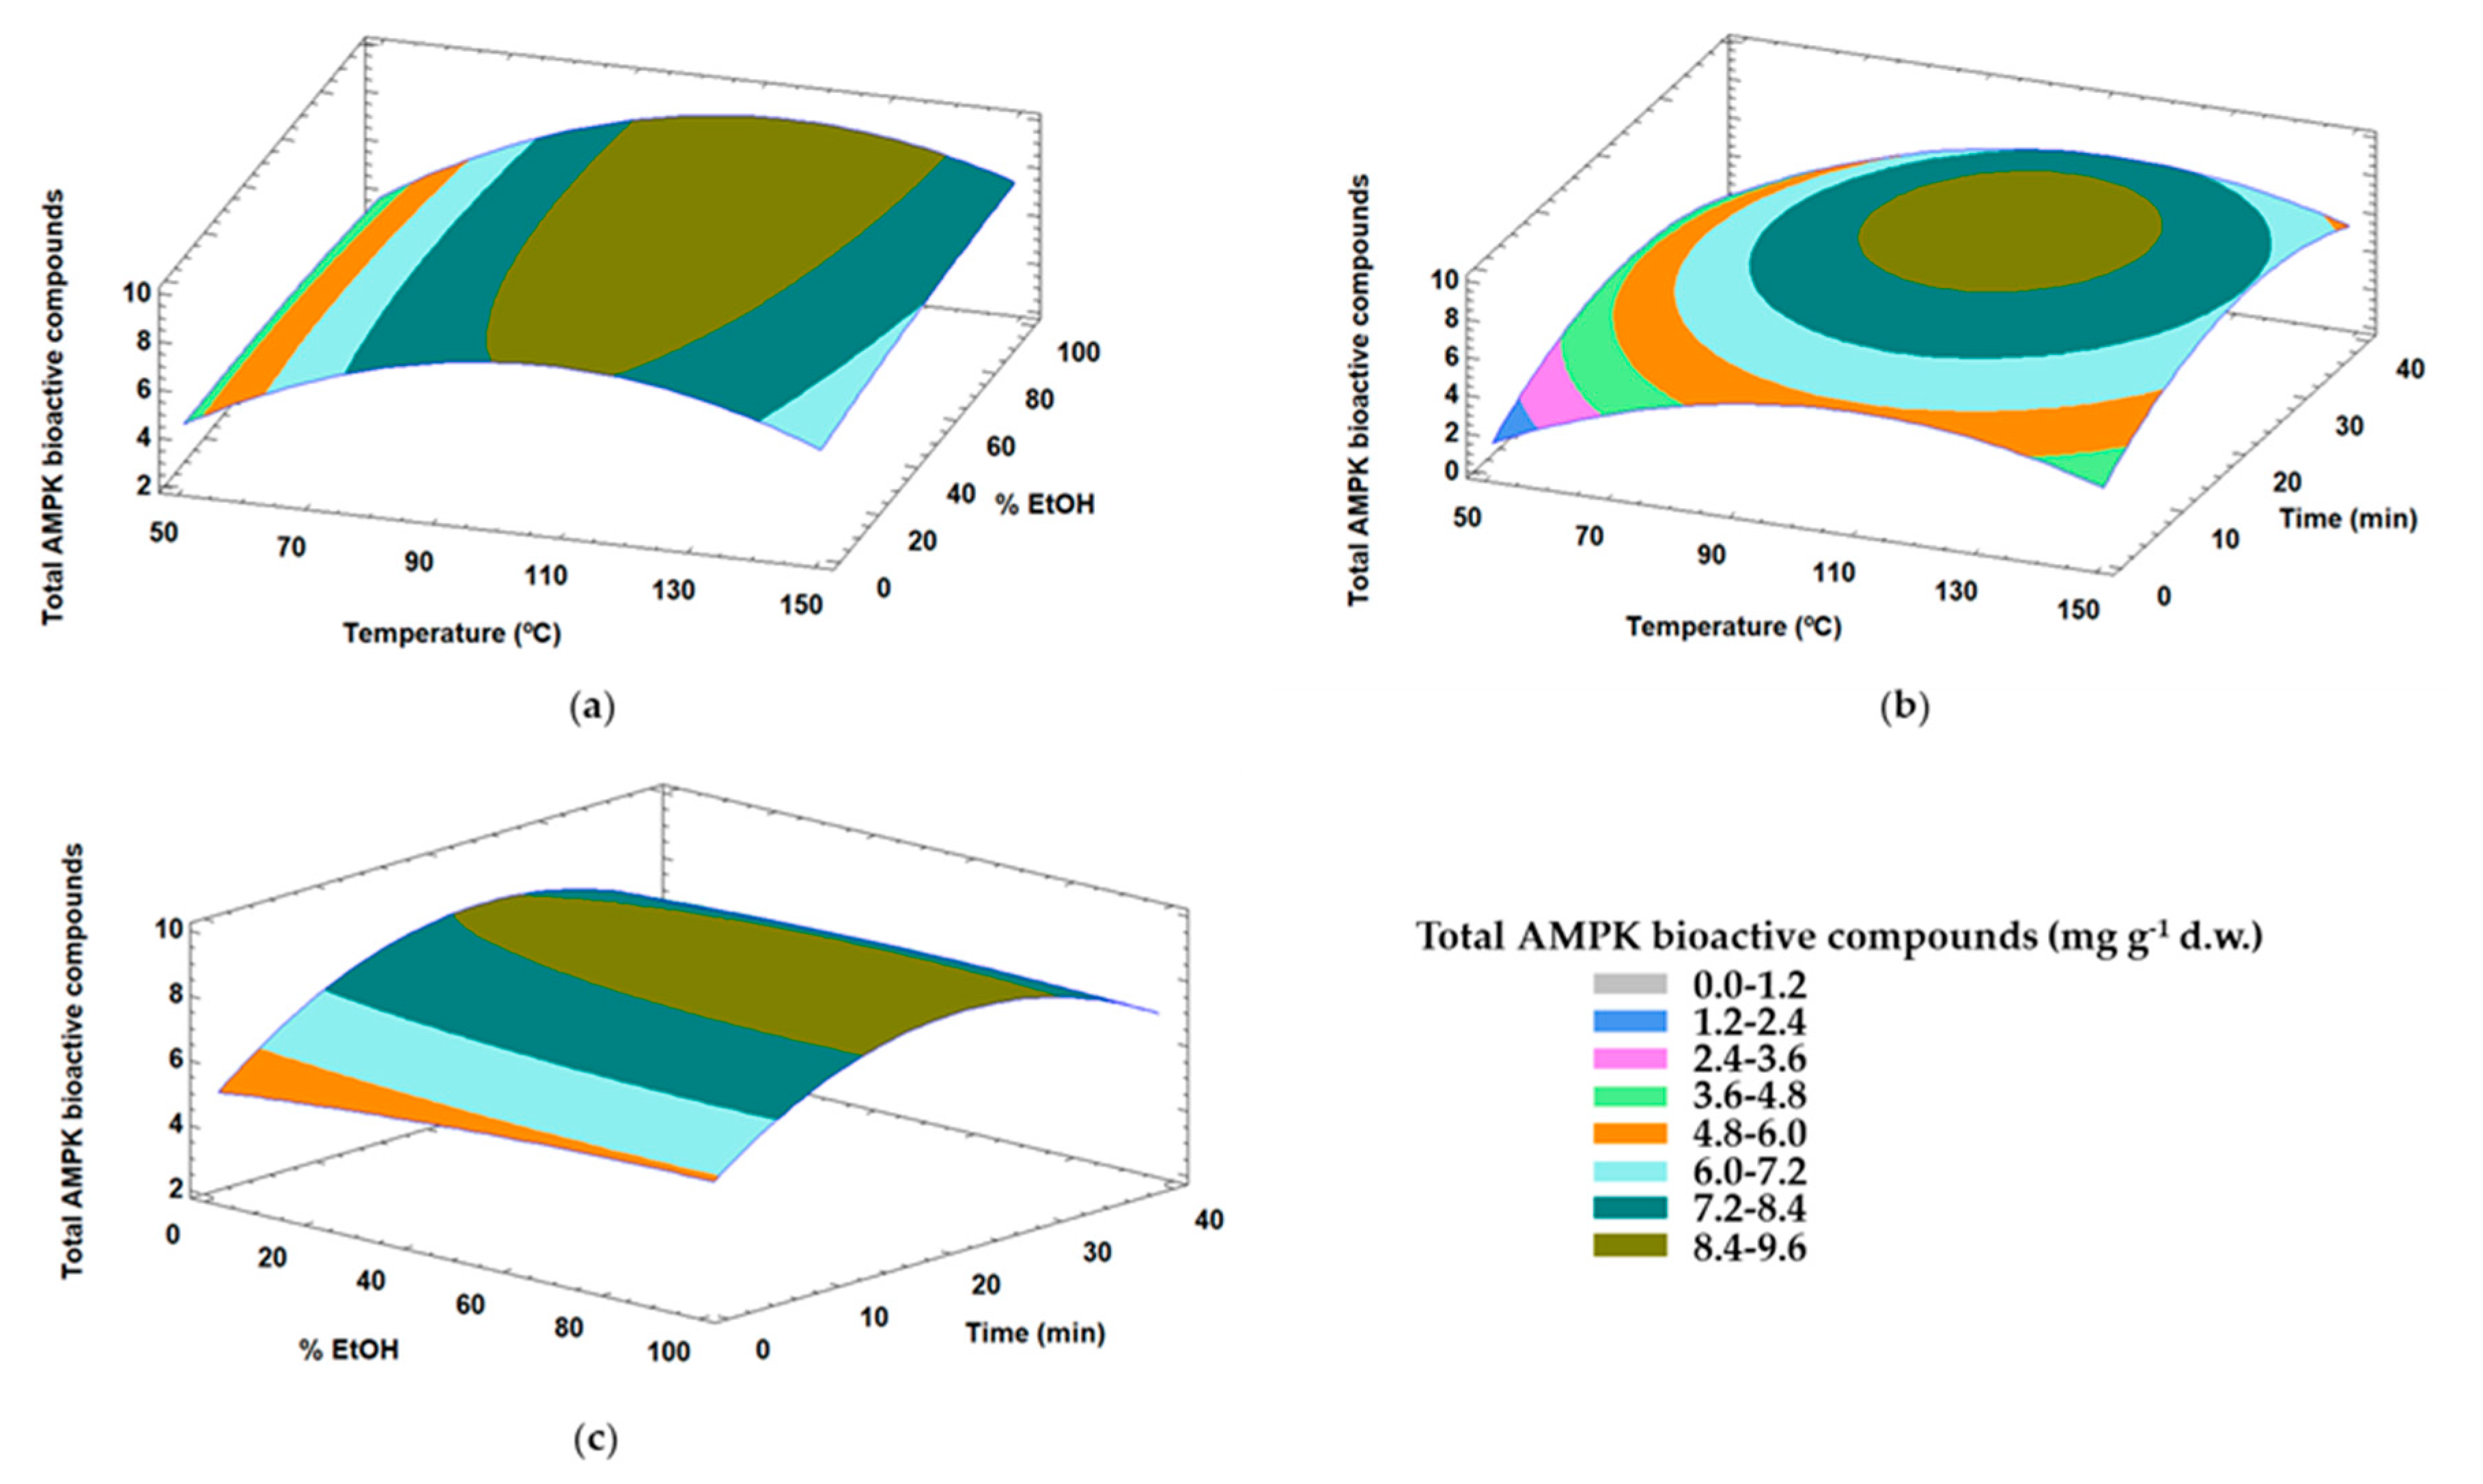
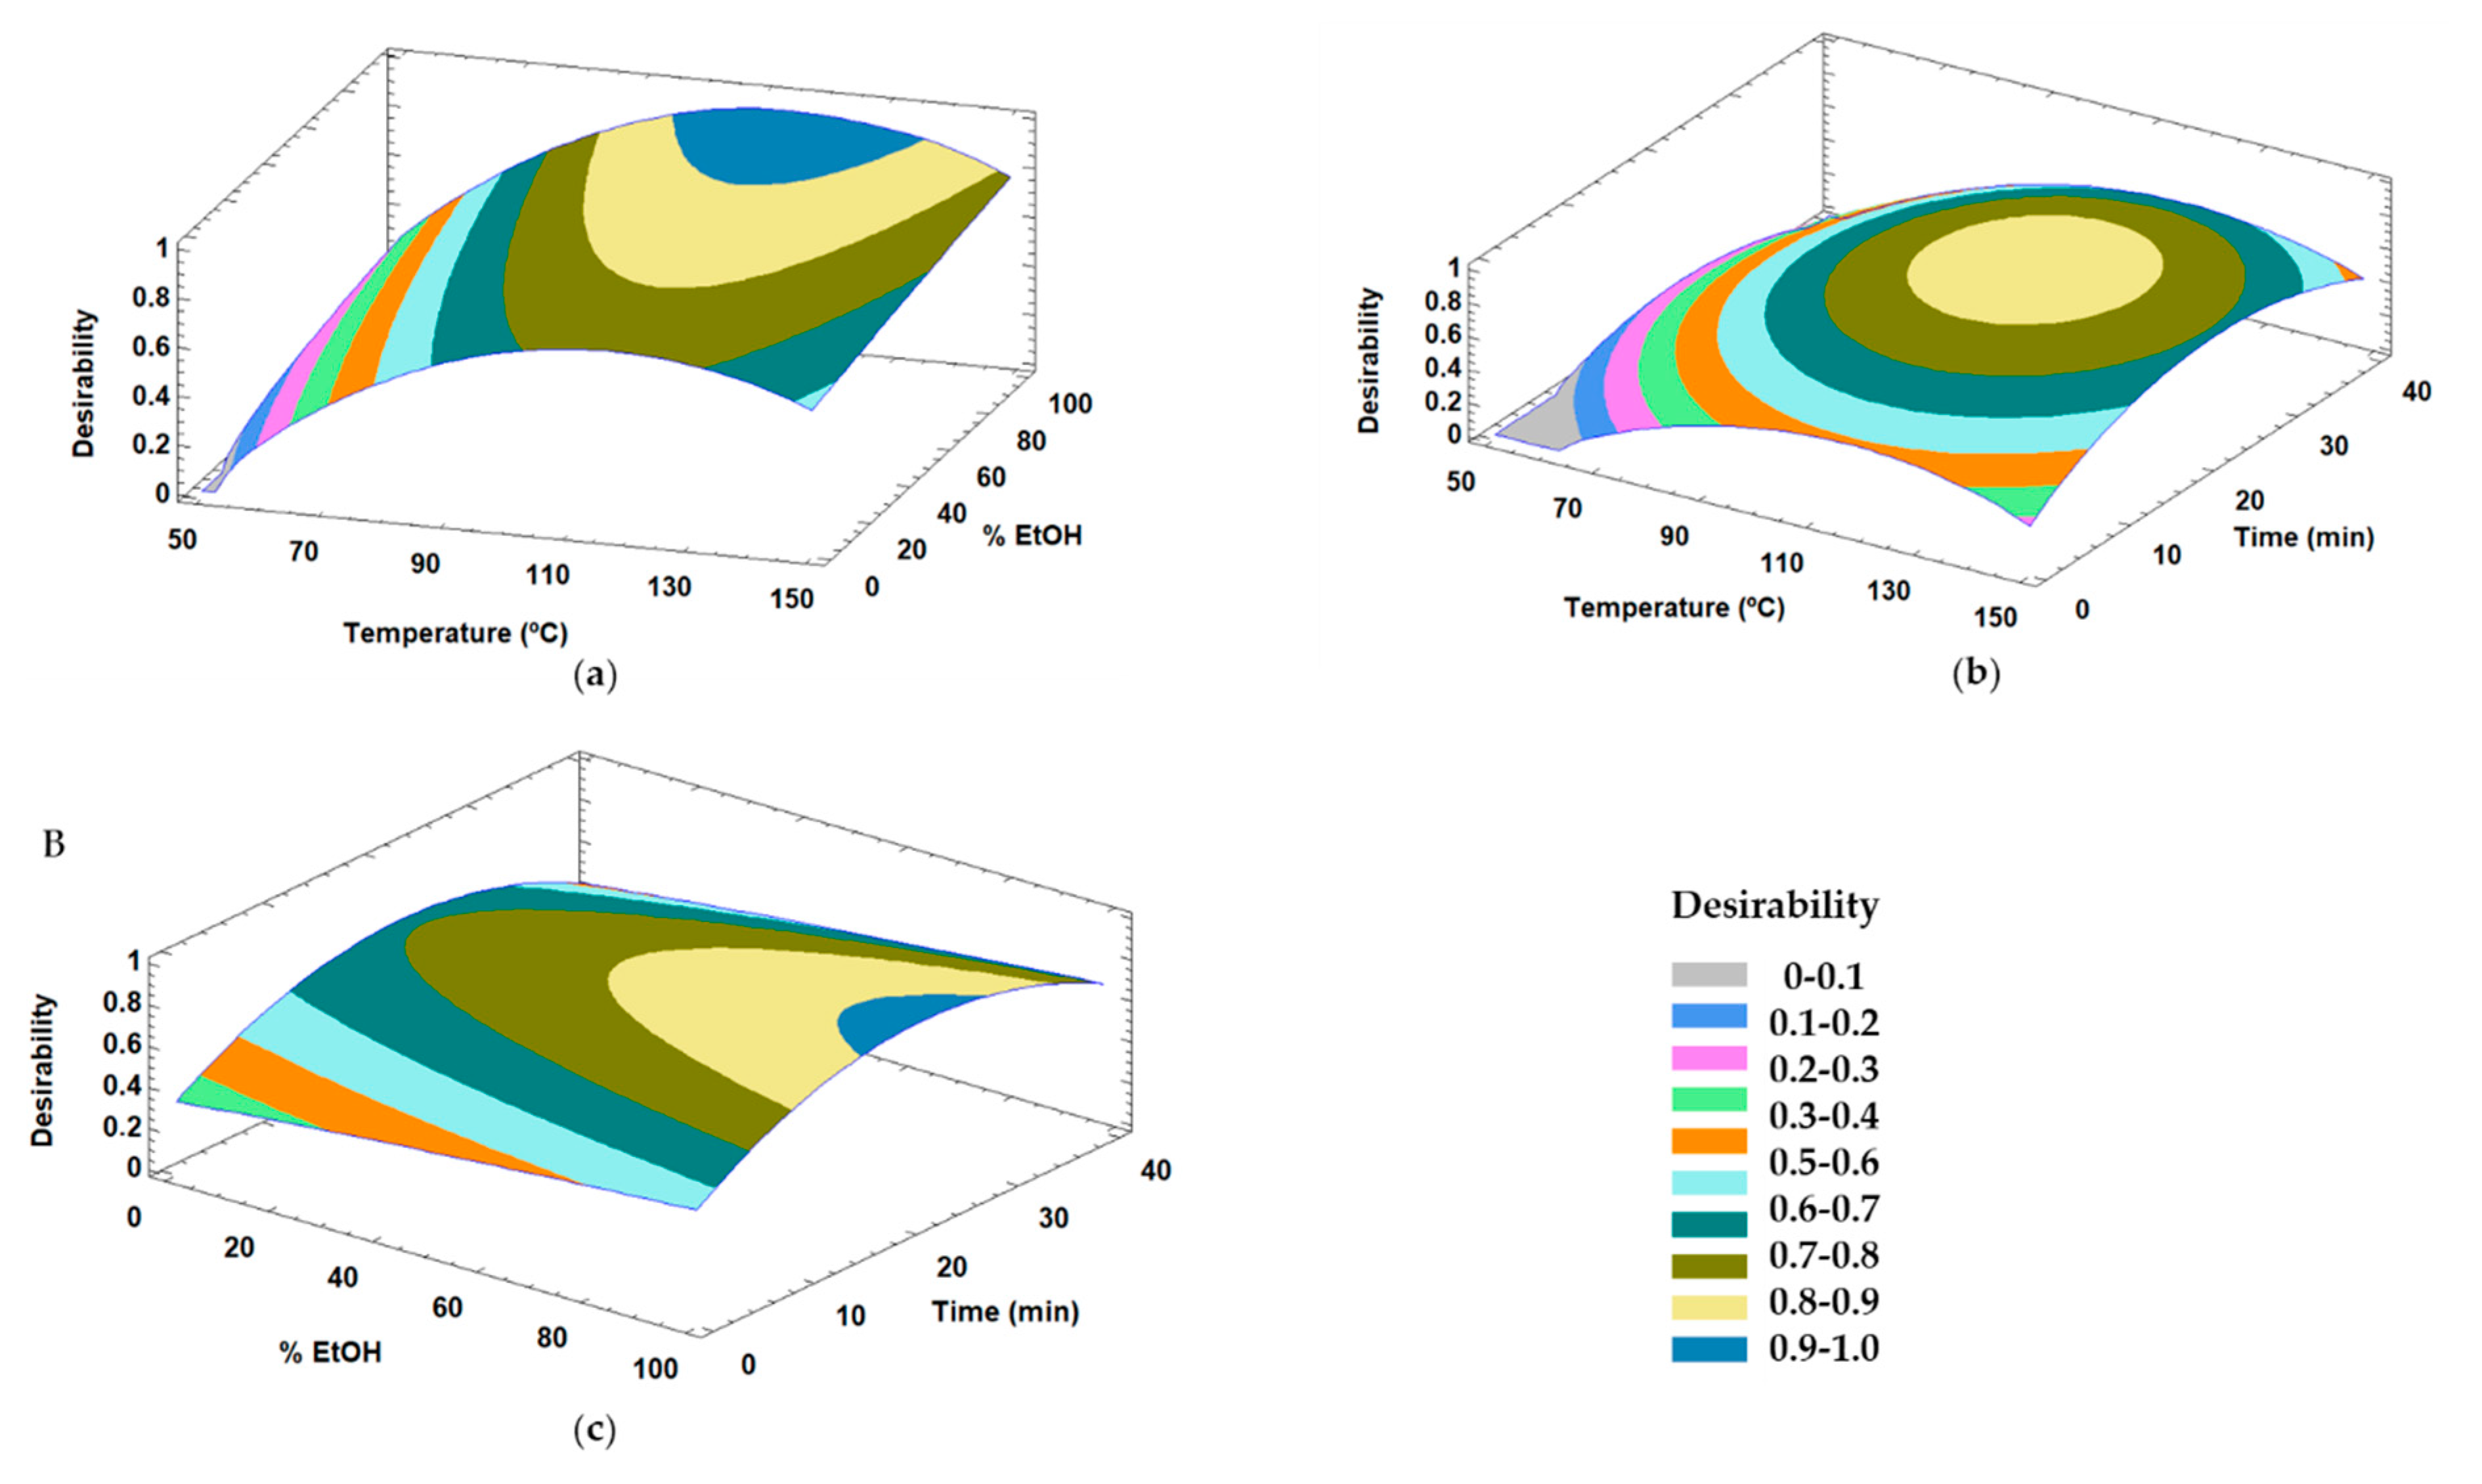
3.2.2. Optimization of Extraction Conditions for the Content of Compounds from Olive Leaves with Capacity to Modulate AMPK

According to Jimenez-Sanchez et al., there are compounds in different fractions of olive leaf extract that decrease intracellular lipid accumulation through AMPK-dependent mechanisms in hypertrophic adipocyte [22].
However, these bioactive compounds were not quantified in that previous study. For that reason, it has been proposed that these compounds extracted by MAE should be quantified in order to establish the best conditions to obtain their highest recovery. Among a total of 41 compounds determined in olive leaf MAE extracts, 18 of them possess the capacity to activate the AMPK pathway (Table 3) [22]. It is important to note that according to Jimenez-Sanchez et al., demethyoleouropein, verbascoside, hydroxyoleouropein, rutin, luteolin rutinoside and luteolin glucoside are the compounds that provide the highest activation of AMPK and these were quantified in the previous study.
Table 1 shows the total content of these 18 compounds obtained in each extraction. Total AMPK bioactive compounds ranged from 2.81 ± 0.05 mg g−1 d.w. in MAE 2 (50 °C, 50% EtOH and 40 min) to 9.39 ± 0.02 mg g−1 d.w. in MAE 14 (100 °C, 50% EtOH and 22.5 min). Therefore, high temperatures, an intermediate percentage of ethanol and extraction time of 22.5 min generated the highest content of total compounds with the capacity to modulate the AMPK activation route. The increasing temperature speeds up the mass transfer of analytes from the sample to the extraction solvent due to the increase in the diffusion speed and solubility, and the decrease in viscosity, surface tension and the strength of the links between compounds and the matrix [41]. Therefore, high temperatures of 100 °C provided an increase in the recovery of total compounds, whereas an extraction time of 40 min resulted in a decrease in the content of these compounds. This could be because prolonging the exposure to the extraction microwave could lead to degradation of the compounds with overheating of the solvent [42].
A Box-Behnken design was used to maximize the content of these compounds with the capacity to activate the AMPK pathway. Table 4 includes the results of the ANOVA test of the regression model for the response variable (total AMPK bioactive compounds). The results indicated that the value of the regression coefficient (R2) was 98.47%. This value justified a considerable part of the variance within data. Lack of fit for this model has a p-value greater than 0.05 (p = 0.3957). Therefore, the model seems to be adequate for the data observed at the 95.0% confidence level. The obtained parameters of ANOVA confirmed that this model provides a suitable approach to the experimental conditions. Temperature (X1) (p = 0.0091), quadratic of temperature (X11) (p = 0.0038) and the quadratic of time (X33) (p = 0.0104) were the significant variables (p ≤ 0.05).
In Figure 3, the surface response plots show the effect of temperature with % EtOH (a), temperature with time (b), and % EtOH with time (c) on total AMPK bioactive compounds. The significant effect of temperature on the content of total AMPK bioactive compounds can be observed, with the maximum value appearing at 90–130 °C, after which this response decreases (Figure 3a). Figure 3b shows that the maximum content of total AMPK bioactive compounds is in the range of 100–130 °C and 20–30 min. Figure 3c shows that the maximum value of this response was obtained in the range of 15–30 min, after which it decreases, whereas the % EtOH did not has a significant effect on this response. This is because high temperatures of 100–130 °C increase the solubility of these compounds so they have a similar solubility in different ethanol compositions, while an extraction time higher than 20–30 min results in a decrease in content. This is probably because these compounds were degraded due to thermal degradation after a prolonged period of microwave radiation [43].
The fitted equation of the model for total AMPK bioactive compounds (Equation (2) includes the significant effects of temperature (X1), quadratic of temperature (X11) and quadratic of time (X33). The model also considers the linear effect of time (X3).
Total AMPK bioactive compounds = −9.84797 + 0.280015X1 + 0.285851X3 − 0.00126127X11 − 0.00617407X33
Considering the equation to explain the model for total AMPK bioactive compounds behavior and understanding the influence of each independent variable, an optimization of conditions to obtain the highest content of these compounds was proposed. A high value for this response variable can be obtained under the following optimized conditions: 111 °C, 42% EtOH and a total extraction time of 23 min to obtain a predicted value of 9.00 mg g−1 d.w. of total AMPK bioactive compounds.
This theoretical optimum was experimentally verified. Analysis of the results revealed an acceptable variance (CV = 3.81%) between the theoretical (9.00 mg g−1 d.w.) and experimental data (9.5 ± 0.1 mg g−1 d.w.). This means that the experimental validation was consistent with the mathematical description of the model, which indicates the suitability of RSM in optimizing the total compounds that have the capacity to activate AMPK from olive leaf extracts by MAE. However, these MAE optimal conditions were different to those for total compounds. For example, ethanol composition was not a significant variable in total AMPK bioactive compounds. Therefore, a simultaneous optimization of MAE conditions by multi-response surface for total compounds and total AMPK bioactive compounds was carried out using Derringer’s desirability function method. Surface response plots are shown in Figure 4 for the effect of temperature with % of EtOH (a), with time (b) and % EtOH with time (c) by desirability. The optimal conditions were 111 °C, 100% EtOH and 23 min to obtain 74.39 mg g−1 d.w. of total compounds and 9.00 mg g−1 d.w. of total AMPK bioactive compounds, respectively. The optimized desirability was 0.97, that is close to 1, which means that the responses are close to their individual optimum values [44]. Therefore, the total content of compounds that possess the capacity to activate AMPK is related to the total compounds. In addition, the optimum 100% EtOH was the same as the optimum obtained for total compounds and this is because the % of ethanol did not have a significant effect in the total AMPK bioactive compounds. Moreover, the temperature of 111 °C was slightly lower than the optimum for total compounds (123 °C), whereas this was the same as the AMPK bioactive compounds. Nevertheless, the optimum content of total compounds predicted at 111 °C was similar to its individual optimum value at 123 °C. In addition, the bioactivity of the extracts is decreased due to the degradation of the compounds at high temperatures [32]. For this reason, establishing an optimum temperature in which the AMPK bioactive compounds content was the maximum was considered. Besides, according to our results, the highest content of compounds with a demonstrated effect on the bioactivity of AMPK was obtained at 111 °C. Therefore, these conditions are suitable for obtaining the maximum content for both responses.

4. Conclusions

In this study, for the first time, we carried out an optimization of the MAE factors of temperature, % EtOH and time for the total compounds (phenolic compounds and elenolic acids) obtained by HPLC-MS. The optimum MAE conditions for the highest recovery of total compounds from olive leaves were 123 °C, 100% EtOH and 23 min. An optimization of MAE conditions was also carried out to obtain the maximum content of compounds from olive leaves that have shown the capacity to activate AMPK, whereby the optimum MAE conditions were 111 °C, 42% ethanol/water (v/v) and extraction time of 23 min. Thus, these optimum conditions for temperature and % EtOH were different compared to those for total compounds. For that reason, a multi-response analysis by desirability was carried out to obtain optimum MAE conditions for both responses. The optimum conditions were 111 °C, 100% EtOH and 23 min to obtain 74.39 mg g−1 d.w. of total compounds and 9.00 mg g−1 d.w. of total AMPK bioactive compounds. Optimum desirability was 0.97, thus, these responses are close to their individual optimum values. Therefore, these optimum MAE conditions can be applied to obtain an olive leaf extract enriched in total compounds and in compounds with the capacity to activate AMPK; thus, this could be used as a treatment in diseases such as obesity.

Supplementary Materials

The following are available online at https://www.mdpi.com/2076-3417/10/13/4620/s1, Table S1: Phenolic and other compounds identified in MAE olive leaf extracts by HPLC-ESI-TOF-MS., Table S2: Calibration curves of standards., Table S3: Compounds quantified in MAE olive leaf extracts by HPLC-ESI-TOF-MS (mg g−1 d.w.).

Author Contributions

Conceptualization, A.M.G.-C., D.A.-R. and A.S.-C.; methodology, B.M.-G. and S.P.-M.; software, B.M.-G. and A.M.G.-C.; validation, D.A.-R. and S.P.-M.; formal analysis, B.M.-G.; investigation, B.M.-G.; data curation, B.M.-G. and S.P.-M.; writing—original draft preparation, B.M.-G.; writing—review and editing, A.M.G.-C., S.P.-M. and D.A.-R.; supervision, A.M.G.-C., D.A.-R. and A.S.-C. All authors have read and agreed to the published version of the manuscript.

Funding

This research was funded by the Spanish Ministry of Economy and Competitiveness (MINECO) (project AGL2015-67995-C3-2), by the Ministry of Science, Innovation and Universities (RTI2018-096724-B-C22), by the Ministry of Economy, Knowledge, Business and University of the Junta de Andalucía (B-AGR-466-UGR18).

Acknowledgments

The author B.M.-G. is grateful to the National Youth Guarantee System for the grant for young research personnel. Also, the authors are grateful to the University of Granada for a “Contrato Puente” postdoctoral contract (S.P.-M.).

Conflicts of Interest

The authors declare no conflict of interest.

References

  1. Benavente-García, O.; Castillo, J.; Lorente, J.; Ortuño, A.; Del Rio, J.A. Antioxidant activity of phenolics extracted from Olea europaea L. leaves. Food Chem. 2000, 68, 457–462. [Google Scholar] [CrossRef]
  2. Kontogianni, V.G.; Gerothanassis, I.P. Phenolic compounds and antioxidant activity of olive leaf extracts. Nat. Prod. Res. 2012, 26, 186–189. [Google Scholar] [CrossRef] [PubMed]
  3. Susalit, E.; Agus, N.; Effendi, I.; Tjandrawinata, R.R.; Nofiarny, D.; Perrinjaquet-moccetti, T.; Verbruggen, M. Olive (Olea europaea) leaf extract effective in patients with stage-1 hypertension: Comparison with Captopril. Phytomedicine 2011, 18, 251–258. [Google Scholar] [CrossRef] [PubMed]
  4. Kontogianni, V.G.; Charisiadis, P.; Margianni, E.; Lamari, F.N.; Gerothanassis, I.P.; Tzakos, A.G. Olive Leaf Extracts Are a Natural Source of Advanced Glycation End Product Inhibitors. J. Med. Food 2013, 16, 817–822. [Google Scholar] [CrossRef] [PubMed] [Green Version]
  5. Omar, S.H. Cardioprotective and neuroprotective roles of oleuropein in olive. Saudi Pharm. J. 2010, 18, 111–121. [Google Scholar] [CrossRef] [PubMed] [Green Version]
  6. Khalatbary, A.R.; Zarrinjoei, G. Anti-Inflammatory effect of oleuropein in experimental rat spinal cord trauma. Iran. Red Crescent Med. J. 2012, 14, 229–234. [Google Scholar]
  7. Shen, Y.; Song, S.J.; Keum, N.; Park, T. Olive leaf extract attenuates obesity in high-fat diet-fed mice by modulating the expression of molecules involved in adipogenesis and thermogenesis. Evid. Based Complement. Altern. Med. 2014, 2014, 971890. [Google Scholar] [CrossRef] [PubMed] [Green Version]
  8. Stalikas, C.D. Extraction, separation, and detection methods for phenolic acids and flavonoids. J. Sep. Sci. 2007, 30, 3268–3295. [Google Scholar] [CrossRef]
  9. Rombaut, N.; Tixier, A.-S.; Bily, A.; Chemat, F. Green extraction processes of natural products as tools for biorefinery. Biofuels Bioprod. Biorefin. 2014, 8, 530–544. [Google Scholar] [CrossRef]
  10. Şahin, S.; Samli, R.; Tan, A.S.B.; Barba, F.J.; Hemat, F.C.; Cravotto, G.; Lorenzo, J.M. Solvent-free microwave-assisted extraction of polyphenols from olive tree leaves: Antioxidant and antimicrobial properties. Molecules 2017, 22, 1056. [Google Scholar]
  11. Chan, C.; Yusoff, R.; Ngoh, G.; Kung, F.W. Microwave-assisted extractions of active ingredients from plants. J. Chromatogr. A 2011, 1218, 6213–6225. [Google Scholar] [CrossRef] [PubMed]
  12. Carciochi, R.A.; D’Alessandro, L.G.; Vauchel, P.; Rodriguez, M.M.; Nolasco, S.M.; Dimitrov, K. Valorization of agrifood by-products by extracting valuable bioactive compounds using green processes. In Ingredients Extraction by Physicochemical Methods in Food; Elsevier: London, UK, 2017; pp. 191–228. ISBN 9780128115213. [Google Scholar]
  13. Li, Y.; Fabiano-tixier, A.S.; Vian, M.A.; Chemat, F. Solvent-free microwave extraction of bioactive compounds provides a tool for green analytical chemistry. Trends Anal. Chem. 2013, 47, 1–11. [Google Scholar] [CrossRef]
  14. Veggi, P.C.; Martinez, J.; Meireles, M.A.A. Fundamentals of Microwave Extraction. In Microwave-Assisted Extraction for Bioactive Compounds: Theory and Practice; Chemat, F., Cravotto, G., Eds.; Springer: New York, NY, USA, 2013; pp. 15–52. [Google Scholar]
  15. De Silvaa, E.O.; Borges, L.L.; da Conceição, E.C.; Bara, M.T.F. Box—Behnken experimental design for extraction of artemisinin from Artemisia annua and validation of the assay method. Rev. Bras. Farmacogn. 2017, 27, 519–524. [Google Scholar] [CrossRef]
  16. Ameer, K.; Shahbaz, H.M.; Kwon, J.-H.H. Green extraction methods for polyphenols from plant matrices and their byproducts: A review. Compr. Rev. Food Sci. Food Saf. 2017, 16, 295–315. [Google Scholar] [CrossRef] [Green Version]
  17. Menendez, J.A.; Joven, J.; Aragonès, G.; Barrajón-catalán, E.; Beltrán-debón, R.; Linares, I.B.; Camps, J.; Corominas-faja, B.; Cufí, S.; Fernández-arroyo, S.; et al. Xenohormetic and anti-aging activity of secoiridoid polyphenols present in extra virgin olive oil. Cell Cycle 2013, 12, 555–578. [Google Scholar] [CrossRef] [Green Version]
  18. Barrajón-Catalán, E.; Herranz-López, M.; Joven, J.; Segura-Carretero, A.; Alonso-Villaverde, C.; Menéndez, J.A.; Micol, V. Molecular promiscuity of plant polyphenols in the management of age-related diseases: Far beyond their antioxidant properties. Adv. Exp. Med. Biol. 2014, 824, 141–159. [Google Scholar]
  19. Fryer, L.G.; Carling, D. AMP-activated protein kinase and the metabolic syndrome. Biochem. Soc. Trans. 2005, 33, 362–366. [Google Scholar] [CrossRef] [Green Version]
  20. Hardie, D.G.; Hawley, S.A.; Scott, J.W. AMP-activated protein kinase—Development of the energy sensor concept. J. Physiol. 2006, 574, 7–15. [Google Scholar] [CrossRef]
  21. Gaidhu, M.P.; Ceddia, R.B. Remodeling glucose and lipid metabolism through AMPK activation: Relevance for treating obesity and Type 2 diabetes. Clin. Lipidol. 2009, 4, 465–477. [Google Scholar] [CrossRef]
  22. Jimenez-Sanchez, C.; Olivares-Vicente, M.; Rodríguez-Pérez, C.; Herranz-López, M.; Lozano-Sanchez, J.; Segura-Carretero, A.; Fernández-Gutiérrez, A.; Encinar, J.A.; Micol, V. AMPK modulatory activity of olive—Tree leaves phenolic compounds: Bioassay-guided isolation on adipocyte model and in silico approach. PLoS ONE 2017, 12, 1–22. [Google Scholar] [CrossRef]
  23. Pimentel-Moral, S.; Borrás-Linares, I.; Lozano-Sánchez, J.; Arráez-Román, D.; Martínez-Férez, A.; Segura-Carretero, A. Microwave-assisted extraction for Hibiscus sabdariffa bioactive compounds. J. Pharm. Biomed. Anal. 2018, 156, 313–322. [Google Scholar] [CrossRef] [PubMed]
  24. Silva, C.; Rodrigues, G.D.M. Pressurized Liquid Extraction of Oil from Soybean Seeds. Can. J. Chem. Eng. 2017, 95, 2383–2389. [Google Scholar]
  25. Talhaoui, N.; Goómez-Caravaca, A.M.; Roldaán, C.; Leoón, L.; la Rosa, R.D.; Fernaóndez-Gutieérrez, A.; Segura-Carretero, A. Chemometric analysis for the evaluation of phenolic patterns in olive leaves from six cultivars at different growth stages. J. Agric. Food Chem. 2015, 63, 1722–1729. [Google Scholar] [CrossRef] [PubMed]
  26. Talhaoui, N.; Gómez-Caravaca, A.M.; León, L.; De, R.; Segura-Carretero, A.; Fernández-Gutiérrez, A. Determination of phenolic compounds of ‘ Sikitita’ olive leaves by HPLC-DAD-TOF-MS. Comparison with its parents ‘Arbequina’ and ‘Picual’ olive leaves. LWT Food Sci. Technol. 2014, 58, 28–34. [Google Scholar] [CrossRef]
  27. Fu, S.; Arráez-Roman, D.; Segura-Carretero, A.; Menéndez, J.A.; Menéndez-Gutiérrez, M.P.; Micol, V.; Fernández-Gutiérrez, A. Qualitative screening of phenolic compounds in olive leaf extracts by hyphenated liquid chromatography and preliminary evaluation of cytotoxic activity against human breast cancer cells. Anal. Bioanal. Chem. 2010, 397, 643–654. [Google Scholar] [CrossRef] [PubMed]
  28. Taamalli, A.; Arráez-Román, D.; Ibañez, E.; Zarrouk, M.; Segura-Carretero, A.; Fernández-Gutiérrez, A. Optimization of microwave-assisted extraction for the characterization of olive leaf phenolic compounds by using HPLC-ESI-TOF-MS/IT-MS2. J. Agric. Food Chem. 2012, 60, 791–798. [Google Scholar] [CrossRef] [PubMed]
  29. Herrero, M.; Temirzoda, T.N.; Segura-Carretero, A.; Quirantes, R.; Plaza, M.; Ibañez, E. New possibilities for the valorization of olive oil by-products. J. Chromatogr. A 2011, 1218, 7511–7520. [Google Scholar] [CrossRef] [Green Version]
  30. Yateem, H.; Afaneh, I.; Al-Rimawi, F. Optimum conditions for oleuropein extraction from olive leaves. Int. J. Appl. Sci. Technol. 2014, 4, 153–157. [Google Scholar]
  31. Alupului, A.; Cãlinescu, I.; Lavric, V. Microwave extraction of active principles from medicinal plants. Univ. Politeh. Din Bucuresti Sci. Bull. 2012, 74, 129–142. [Google Scholar]
  32. Osorio-Tobón, J.F. Recent advances and comparisons of conventional and alternative extraction techniques of phenolic compounds. J. Food Sci. Technol. 2020. [Google Scholar] [CrossRef]
  33. Hemalatha, S.; Mandal, V.; Mohan, Y. Microwave assisted extraction—An innovative and promising extraction tool for medicinal plant research. Pharmacogn. Rev. 2007, 1, 7–18. [Google Scholar]
  34. Khoddami, A.; Wilkes, M.A.; Roberts, T.H. Techniques for analysis of plant phenolic compounds. Molecules 2013, 18, 2328–2375. [Google Scholar] [CrossRef]
  35. Rafiee, Z.; Jafari, S.M.; Alami, M.; Khomeiri, M.; Rafiee, Z.; Jafari, S.M.; Alami, M.; Khomeiri, M. Microwave-assisted extraction of phenolic compounds from olive leaves; a comparison with maceration. J. Anim. Plant Sci. 2011, 21, 738–745. [Google Scholar]
  36. Japón-Luján, R.; Luque-Rodríguez, J.M.; Luque De Castro, M.D. Multivariate optimisation of the microwave-assisted extraction of oleuropein and related biophenols from olive leaves. Anal. Bioanal. Chem. 2006, 385, 753–759. [Google Scholar] [CrossRef]
  37. Chanioti, S.; Liadakis, G.; Tzia, C. Solid liquid extraction. In Food Engineering Handbook: Food Process Engineering (Contemporary Food Engineering); Varzakas, T., Tzia, C., Eds.; CRC Press: Boca Raton, FL, USA, 2014; p. 275. [Google Scholar]
  38. Mustapa, A.N.; Martin, A.; Gallego, J.R.; Mato, R.B.; Cocero, M.J. Microwave-assisted extraction of polyphenols from Clinacanthus nutans Lindau medicinal plant: Energy perspective and kinetics modeling. Chem. Eng. Process. Process Intensif. 2015, 97, 66–74. [Google Scholar] [CrossRef]
  39. Alañón, M.E.; Ivanović, M.; Gómez-Caravaca, A.M.; Arráez-Román, D.; Segura-Carretero, A. Choline chloride derivative-based deep eutectic liquids as novel green alternative solvents for extraction of phenolic compounds from olive leaf. Arab. J. Chem. 2020, 13, 1685–1701. [Google Scholar] [CrossRef]
  40. Do, Q.D.; Angkawijaya, A.E.; Tran-Nguyen, P.L.; Huynh, L.H.; Soetaredjo, F.E.; Ismadji, S.; Ju, Y.H. Effect of extraction solvent on total phenol content, total flavonoid content, and antioxidant activity of Limnophila aromatica. J. Food Drug Anal. 2014, 22, 296–302. [Google Scholar] [CrossRef] [Green Version]
  41. Radojković, M.; Moreira, M.M.; Soares, C.; Fátima Barroso, M.; Cvetanović, A.; Švarc-Gajić, J.; Morais, S.; Delerue-Matos, C. Microwave-assisted extraction of phenolic compounds from Morus nigra leaves: Optimization and characterization of the antioxidant activity and phenolic composition. J. Chem. Technol. Biotechnol. 2018, 93, 1684–1693. [Google Scholar] [CrossRef] [Green Version]
  42. Routray, W.; Orsat, V. Microwave-assisted extraction of flavonoids: A review. Food Bioprocess Technol. 2012, 5, 409–424. [Google Scholar] [CrossRef]
  43. Kim, J.S.; Kang, O.J.; Gweon, O.C. Comparison of phenolic acids and flavonoids in black garlic at different thermal processing steps. J. Funct. Foods 2013, 5, 80–86. [Google Scholar] [CrossRef]
  44. Akçay, H.; Anagün, A.S. Multi response optimization application on a manufacturing factory. Math. Comput. Appl. 2013, 18, 531–538. [Google Scholar] [CrossRef]
Figure 1. Extracted ion chromatogram (EIC) obtained from HPLC-ESI-TOF-MS analysis of olive leaf extract obtained by MAE. Peaks have been numbered according to the elution order.
Applsci 10 04620 g001
Figure 2. Response surface plots showing combined effects of process variables for total compounds: Temperature (°C)–% EtOH (a), temperature (°C)–time (min) (b) and % EtOH–time (min) (c).
Applsci 10 04620 g002
Figure 3. Response surface plots showing combined effects of process variables for total AMPK bioactive compounds: Temperature (°C)–% EtOH (a), temperature (°C)–time (min) (b) and % EtOH–time (min) (c).
Applsci 10 04620 g003
Figure 4. Response surface plots showing combined effects of process variables for desirability in total compounds and total AMPK bioactive compounds: Temperature (°C)–% EtOH (a), Temperature (°C)–time (min) (b) and % EtOH–time (min) (c).
Applsci 10 04620 g004
Table 1. Concentration of total compounds and total AMP-activated protein kinase (AMPK) bioactive compounds in olive leaf extracts from microwave-assisted extraction (MAE) obtained by Box Behnken design.
MAE X1X2X3Total Compounds
(mg g−1 d.w.)
Total AMPK Bioactive Compounds
(mg g−1 d.w.)
15010022.535.72 ± 0.17 b3.70 ± 0.10 b,c
250504021.85 ± 0.16 a2.81 ± 0.05 a
31005022.557.37 ± 0.07 f8.64 ± 0.08 g,h
415010022.574.24 ± 0.50 i7.93 ± 0.21 g
5100100567.18 ± 0.60 h6.99 ± 0.16 f
6150022.551.36 ± 0.37 d6.56 ± 0.21 f
71001004063.55 ± 0.90 g7.05 ± 0.24 f
850022.521.84 ± 0.37 a4.06 ± 0.35 c,d
95050521.02 ± 0.02 a2.87 ± 0.10 a,b
1010004039.19 ± 0.09 c6.97 ± 0.13 f
111005022.558.25 ± 0.37 f9.04 ± 0.53 h
121000535.73 ± 0.07 b6.29 ± 0.06 f
13150504038.81 ± 0.57 c5.25 ± 0.21 e
141005022.562.49 ± 0.45 g9.39 ± 0.02 h
1515050553.47 ± 0.31 e4.80 ± 0.002 d,e
X1: Temperature (°C), X2: % EtOH/H2O (%(v/v)) and X3: Time (min). All results are expressed as mg g−1 of dry matter of olive leaves. Different letters in the same column indicate significant differences (p < 0.05).
Table 2. ANOVA test for the response variable of total compounds.
Total Compounds
SourceSSDFMSF-Valuep-Value
X11723.7411723.74230.050.0043 *
X21071.3211071.32142.980.0069 *
X324.51124.513.270.2122
X11898.991898.99119.980.0082 *
X1220.26120.262.700.2418
X1359.98159.988.010.1055
X2215.05115.052.010.2921
X2312.60112.601.680.3242
X33367.861367.8649.090.0198 *
Lack of fit112.07337.364.990.1716
Pure error14.9927.49
Total (corr.)4280.114
R297.03
Adj R291.69
X1: temperature, X2: % EtOH, X3: Time, SS: Sum of squares, DF: Degree of freedom, MS: Mean square, R2: Quadratic correlation coefficient; Adj R2: Quadratic correlation coefficient adjusted, * Significant (p < 0.05).
Table 3. Compounds identified in olive leaf extracts with the potential to modulate AMPK.
PeakAMPK Bioactive Compounds
9Secologanoside isomer b
10Elenolic acid glucoside isomer c
14Demethyloleuropein
15Hydroxyoleuropein/hydroxyoleuroside isomer a
16Rutin
17Luteolin rutinoside
18luteolin glucoside isomer a
19Verbascoside
22Oleuropein glucoside isomer a
23Diosmetin rhamnoside glucoside (diosmin)
24luteolin glucoside isomer b
35Oleuropein isomer c
36Oleuropein isomer d
37ligstroside
38Luteolin
39Quercetin
40Oleuropein/oleuroside methyl ether
41Resinoside
Table 4. ANOVA test for the response variable of total AMPK bioactive compounds.
Total AMPk Bioactive Compounds
SourceSSDFMSF-Valuep-Value
X115.41115.41108.220.0091 *
X20.4010.402.790.2366
X30.1610.161.110.4033
X1137.2137.2261.320.0038 *
X120.7510.755.250.1490
X130.0710.070.480.5612
X220.2910.292.060.2874
X230.1010.100.700.4922
X3313.50113.5094.820.0104 *
Lack of fit0.7130.241.670.3957
Pure error0.2820.14
Total (corr.)65.4614
R298.47
Adj R295.73
X1: temperature, X2: % EtOH, X3: Time, SS: Sum of squares, DF: Degree of freedom, MS: Mean square, R2: Quadratic correlation coefficient; Adj R2: Quadratic correlation coefficient adjusted, * Significant (p < 0.05).

