Article

H-scan Subtraction Doppler Imaging: A Novel Ultrasound Small Blood Vessel Flow Characterization with Scattering and Reflection Identification

1
University of Chinese Academy of Sciences, Beijing 100049, China
2
Suzhou Institute of Biomedical Engineering and Technology, Chinese Academy of Sciences, Suzhou 215163, China
3
School of Life Science and Technology, University of Electronic Science and Technology of China, Chengdu 610054, China
4
Suzhou Guoke Ultra Medical Technology Co., Ltd., Suzhou 215163, China
*
Author to whom correspondence should be addressed.
Appl. Sci. 2020, 10(21), 7604; https://doi.org/10.3390/app10217604
Submission received: 25 September 2020 / Revised: 17 October 2020 / Accepted: 26 October 2020 / Published: 28 October 2020
(This article belongs to the Section Applied Biosciences and Bioengineering)

Abstract

:

Featured Application

Clinical application of ultrasound power Doppler imaging for small blood vessel flow characterization.

Abstract

Ultrafast compound Doppler imaging (UCDI), which can be used to acquire Doppler information at very high spatial and temporal sampling rates, provides a great improvement to the characterization of the vasculature. The singular value decomposition (SVD) technique takes advantage of the different features of tissue and blood motion in terms of spatiotemporal coherence and strongly outperforms conventional clutter rejection filters in small animals. However, a major challenge of conventional UCDI with SVD clutter filtering for small vessel imaging is that it is not sensitive enough to detect the hemodynamic changes in deep tissue where the majority of the remaining signal is usually noise-saturated. In this study, with the first attempt to apply ultrasonic tissue characterization techniques to UCDI, we propose an H-scan subtraction Doppler imaging method to bypass the limitations associated with the high-order singular value thresholding selection and improve the image quality of fine vessels. The flow phantom experiments with different blood concentrations show that H-Scan is capable of estimating the relative size and spatial distribution of acoustic scattering objects. In the in vivo rabbit brain experiment, the H-Doppler method, together with the global and block-wise local SVD clutter filtering, are proposed to facilitate better power Doppler images with a significant improvement of background noise suppression. These results demonstrate that the contrast-to-noise-ratio (CNR) of the H-scan subtraction Doppler imaging is 15% to 65% higher than that of the conventional UCDI methods. Therefore, this approach can be potentially applied to the clinical applications of the functional ultrasound (fUS) imaging method.

1. Introduction

Ultrafast compound Doppler imaging (UCDI) offers extraordinary capabilities for flow analysis and the quantification of small vessels, which contributes to the diagnosis of various diseases [1,2,3,4]. The principle of UCDI is to replace the traditional B-mode scan sequence by compound plane wave (CPW) imaging to gather backscattered echoes coming from the full Field of View (FOV), which provides a large amount of spatial and temporal samples within a short period of time. The Doppler power or intensity of blood flow signals are extracted by clutter filtering before the blood flow image is displayed for clinical diagnosis. Although promising results of UCDI have been achieved from brains [5], eyes [6,7], kidneys [8,9] and livers [10,11], UCDI remains a significant challenge for the visualization of small vessels with low flow speeds, because the tissue echoes and the blood scatterer echoes tend to share common characteristics. To that end, several clutter filtering techniques have been applied to facilitate the better separation of blood and tissue signals [10,12,13,14]. One of the most recent approaches for clutter filtering is the spatiotemporal singular value decomposition clutter rejection, which was proposed by Demene et al. in 2015 [10]. The singular value decomposition (SVD) takes advantage of the different characteristics of the spatiotemporal coherence between tissue and blood motion and, hence, substantially increases the Doppler sensitivity from fine vessels. Blood flow and tissue signals (and to some extent, noise) can be separated by low-rank matrix projection, such as singular value thresholding (SVT). To achieve better outputs, high-order singular value thresholding based on principles of the Marčenko-Pastur distribution was proposed by Song et al. to suppress high-frequency noise coupled with the blood flow signal [15,16]. Although clutter filtering with both low- and high-order SVTs strongly outperform conventional clutter rejection filters, in practice, it appears to be challenging to differentiate blood flow signals from the noise. This leads to a limitation of these methods that a complicated calibration step is required to determine the high-order cutoff threshold before the measurement or quantification of blood flow imaging, which negatively affects the stability and robustness of these approaches [10,15].
On the other hand, ultrasonic tissue characterization techniques (UTC), which aim to untangle hidden patterns in pulse-echo data to extract additional information regarding the tissue functions and the pathology, have been a research focus for several decades. Several UTC methods have been proposed [17,18]. More recently (2016), KJ Parker et al. proposed the H-scan ultrasound imaging, which enables the recognition of an added dimension, as each region of the echoes are categorized into large layer scatterers, thin layer scatterers and Rayleigh scatterers, as determined by the impedance function present in tissue along the direction of the propagating pulse [19,20]. M. Khariralseed implemented the H-scan technique with the plane wave imaging instrumentation and investigated the impact of spatial angular compounding on H-scan image quality [21]. Their experimental results showed that H-scan US imaging using coherent compounding plane waves (CPW) is a promising method to visualize the relative size and distribution of acoustic scattering sources. The promising results were achieved in monitoring early tumors using H-scan ultrasound imaging, e.g., breast cancer [22,23,24] and thyroid lesions [25].
Based on the classification theory for tissue scattering, this paper attempts to propose an H-scan subtraction Doppler imaging method by combining the H-scan method and UCDI approach to bypass the limitations associated with the existing UCDI approaches and improve the image quality of the fine vessels. First, H-scan is used to distinguish the tissue-scattering characteristics from the FOV. One can code the result using RGB color, which is an additive color model in which red, green and blue light is added together in various ways to reproduce a broad array of colors. Ultrasound signals containing large layer scatterers are input into the R channel, and the Rayleigh scattering signals contributed by blood flow are input into the B channel to obtain the H-scan image of the biological tissue. Second, Doppler blood flow imaging was then performed with the multi-channel signals of the H-scan with the spatiotemporal singular value decomposition clutter filtering. Afterward, the background noise corresponding to the R channel was removed by the B channel Doppler signals to obtain high-quality blood flow imaging results. This method effectively improves the resolution and contrast of Doppler power imaging in small and low-speed flow vessels. To facilitate the presentation, the H-scan subtraction Doppler imaging method is abbreviated as H-Doppler in this paper.
This rest of the paper is organized as follows, the theory of H-Scan ultrasound imaging is first introduced, and then, we exhibit the principle and working sequence of H-Doppler. The results section demonstrates blood flow imaging results in phantom and in vivo experiments with the proposed methods. Finally, the discussion and conclusion sections are given at the end of the paper.

2. Materials and Methods

2.1. Theory of H-Scan Ultrasound Imaging

The backscattered ultrasound signal e ( t ) can be modeled as [26]:
e ( t ) = A { p ( t ) s ( x , y ) * * * R ( x , y , c t 2 ) }
where A is a signal amplitude consistent, c is the speed of ultrasound, p(t) is the propagating ultrasound pulse and s(x,y) is the beam pattern (beam width in the transverse and elevational axes). R ( x , y , c t / 2 ) represents the 3D pattern of acoustic reflectors or spreading objects in the medium. The symbol *** stands for 3D convolution. With an assumption of tiny spatial variants in medium density and compressibility, the function R can be related to the spatial derivative of acoustic impedance Z in the direction z of the ultrasound imaging pulse [26].
R ( z ) ( 1 2 Z ) d Z ( z ) d z
For H-scan US imaging, we considered three types of reflections in the one-dimensional convolution model:
1. Large layer:
Large layer scattering occurs when the scattering object is larger than the wavelength of the transmitted ultrasound signal. With a small step increase in acoustic impedance at position z0, the acoustic impedance of the large layer at z0 is similar to a step function u(z-z0). Since the spatial derivative of a step function is the Dirac delta function δ ( z ) , the spatial derivative of acoustic impedance at z0 can be expressed as:
d Z ( z ) d z = Δ Z δ ( z z 0 )
The reflection coefficient can be rewritten as:
R L ( z ) = Δ Z 2 Z δ ( z z o )
The received signal is then the 1D convolution * of the reflection coefficient at the large interface and the transmitted ultrasound signal p ( t ) :
e L ( t ) = p ( t ) * R L ( z ) = Δ Z 2 Z p ( t t o )
2. Thin layer:
Thin layer scattering corresponds to an acoustic scattering source with a thin interface and higher acoustic impedance, such as an arterial wall. We can approximate the impedance profile as:
Z T ( z ) = Z + Δ Z δ ( z z 0 )
Therefore, the reflection function is:
R T ( z ) = ( Δ Z 2 Z ) δ ( z z 0 )
where δ ( ) is the derivative of the Dirac delta function. The received signal is then the convolution of the transmitted ultrasound signal p ( t ) with the reflection coefficient of the thin layer:
e T ( t ) = p ( t ) * R T = ( Δ Z 2 Z ) p ( t t 0 )
where p′(tt0) is the first derivative with respect to time of p(tt0).
3. Rayleigh scatterers:
Rayleigh scattering takes place when the acoustic scattering source is smaller than the ultrasound wavelength [27]. For small spherical scatterers, the Born approximation gives a leading term for backscattered reflection that has pressure dependence with a frequency-squared weighting [28]. Additionally, the position correlation and multiple reflections can be ignored [26,27]. For Rayleigh scattering (single scatterer or cloud of scatterers), the received signal can be given as [20,27]:
e s ( t ) = p ( t ) * = S c ( Δ Z 2 Z ) p ( t t 0 )
where p″(t) is the second derivative of p(t) to time, obtained from the convolution property of δ ( ) , and where Sc incorporates all geometric factors and constants of proportionality in the Rayleigh backscatter equation [27].
To identify these 3 classes of ultrasound scattering through the relationship with transmitted signals and the derivative in the direction of propagation, a set of functions related to Gaussian-weighted Hermite polynomials was employed in [19]. The Hermite polynomials are defined by:
H n ( t ) = ( 1 ) n e t 2 d n d t n e t 2
Multiplied by the successive differentiation of a Gaussian pulse G ( t ) = e t 2 , the first six orders of Gaussian-weighted Hermite polynomials (GHs) are given in Table 1.
where the energy of GHs is calculated by:
Energy = G 2 H n 2 d t = 1 × 3 × 5 × × | 2 n 1 | × π / 2
GHs have a simple relation with the time derivative:
d d t ( G H n ( t ) ) = G H n + 1 ( t )
According to [19], a typical broadband ultrasound transmitted signal can be approximated as a GH4 function. Assuming that the impulse response of the pulse-echo system is p ( t ) = A 0 G H 4 ( t ) , the received signal of the three types of reflections can be rewritten as:
e L ( t ) = A 0 Δ Z 2 Z G H 4 ( t ) ( t t o )
e T ( t ) = A 0 Δ Z 2 Z G H 5 ( t ) ( t t o )
e S ( t ) = A 0 S c Δ Z 2 Z G H 6 ( t ) ( t t o )
These formulations suggest convolutions of the received signal with scaled versions of each of these GHs would form postprocessed signals of these 3 classes of reflections. To achieve an H-scan image that is conducive to measuring the relative scatterer size, RGB color can be utilized to encode the results. The R and B channels are assigned with two parallel convolution filters outputs (GH4(t) and GH6(t)) to measure the relative strength of the large layer and Raleigh scatterers reflections. In practice, one might utilize more emphasis on the extremes of the spectra for the convolution filtering to lessen the correlation between the overlapping GHs spectra—as an example, GH2(t) and GH8(t) [190, 196]. Moreover, it is possible to consider even more extreme examples, such as replacing GH6(t) with GH9(t) or GH10(t) or higher, but this deviates further from the concept of matching filters and increases the sensitivity to high-frequency noise. Therefore, tradeoffs and compromises must be considered. In this paper, GH2(t) and GH8(t) normalized by E n are employed to capture the low- and high-frequency scattering signals. A more detailed overview of the H-scan for classifications of different ultrasound scatterings based on the Fourier-transform theorems can be found in [20].
For ultrasound imaging, blood can usually be regarded as composed of plasma (91% water) and suspended red blood cells, ignoring the insignificant effects of other components, such as white blood cells and platelets [29]. The reason for that is the backscattering properties of blood is most often regarded as a collection of red blood cells, because they predominate over other cell types [30]. The average diameter of red blood cells is 7.2 μm, and the volume is about 87 ± 9 μm3. Generally, a sphere with a radius of 2.75 μm ( 4 / 3 π × ( 2.75   μ m ) 3 = 87   μ m 3 ) is used as the equivalent model of red blood cells in ultrasonic scattering [29]. Previous studies have proven that the ultrasonic backscatter signals of blood are typical Rayleigh scattering [31]. Therefore, we propose to use the H-scan method to extract the blood flow signal, which can potentially improve the sensitivity of Doppler imaging.

2.2. Principle of H-Doppler Flow Imaging

Figure 1 shows the schematic description of the H-Doppler working sequence.
1. Parallel convolution filter for H-scan
Two parallel convolution filters ( G H 2 ( t ) and G H 8 ( t ) ), normalized by the signal energy E n , are applied to the plane wave Radio Frequency (RF) raw data (7 coherent angles ranging from −11° to 11°) to gauge the relative strength of the received signals. The relative strengths of these filter outputs are color-coded: the large layer scattering (GH2 convolution outputs) and the Rayleigh scattering (GH8 convolution outputs) signals are assigned to the R and B channels, respectively. The original unfiltered compounded data is assigned to the G channel.
2. Compound plane wave beamforming
The compound plane wave (CPW) imaging sequence is then performed for the multi-channel signals of RGB with parallelized beamforming (delay and sum). For each spatial image location, the post-beamformed RF data of each channel is separately achieved by averaging the acquisitions over all coherent plane wave transmissions. Then the signal envelope for each of these compounded convolution outputs is calculated via a Hilbert transformation to produce a stable H-scan image display. Next, the ratio of the G H 2 ( t ) / G H 8 ( t ) and G H 8 ( t ) / G H 2 ( t ) are utilized to separately weight the R and B channels after the normalization of R and B channels data (i.e., range from 0 to 1). Lastly, the envelope of the original unfiltered data is assigned to the G channel to achieve the RGB color-coded H-scan display image. Note that the H-scan image display sequence is not needed for the H-Doppler approach; this is only for process display purposes.
3. Singular value decomposition (SVD) clutter filtering
With a total of 2100 ensembles in the slow time direction, which corresponds to 672 milliseconds ultrafast data acquisition, the typical data for small vessel flow imaging is a 3D matrix, with one dimension in time (Nt) and two dimensions in space (Nx and Nz) [6, 15]. This 3D matrix was then reorganized into a 2D Casorati matrix with dimensions of Nx·Nz by Nt, in which one dimension is time and the other dimension is space (both lateral and axial) [10]. The singular value decomposition (SVD) could be performed for this spatiotemporal 2D Casorati matrix (S) by [10]:
S = U Δ V *
where Δ is the non-square diagonal singular value matrix, U is the singular vector matrix of space and V is the singular vector matrix of time and * stands for the conjugate transpose. Based on the definition of SVD and principal component analysis (PCA), S can be expressed as the sum of a series of weighted, ordered signal components [10]. Each signal component is composed of the ordered singular values λ i , spatial signal components Ui and temporal signal components Vi:
s ( z , x , t ) = i = 1 rank ( S ) λ i U i ( z , x ) V i ( t )
After performing the SVD, tissue signals typically found in high singular values as their high speckle strength and spatiotemporal coherence ensure that a large number of spatial pixels will exhibit the same time profile. In contrast, blood signals should be typically residing in medium-to-low singular values, as they exhibit much lower speckle brightness and spatiotemporal coherence.
4. Low-order singular value thresholding (L-SVT)
To differentiate blood flow signal from tissue signal, a low-rank matrix projection I f (i.e., singular value thresholding, SVT) is designed to be multiplied by the singular value matrix Δ :
S f = U ( Δ I f ) V *
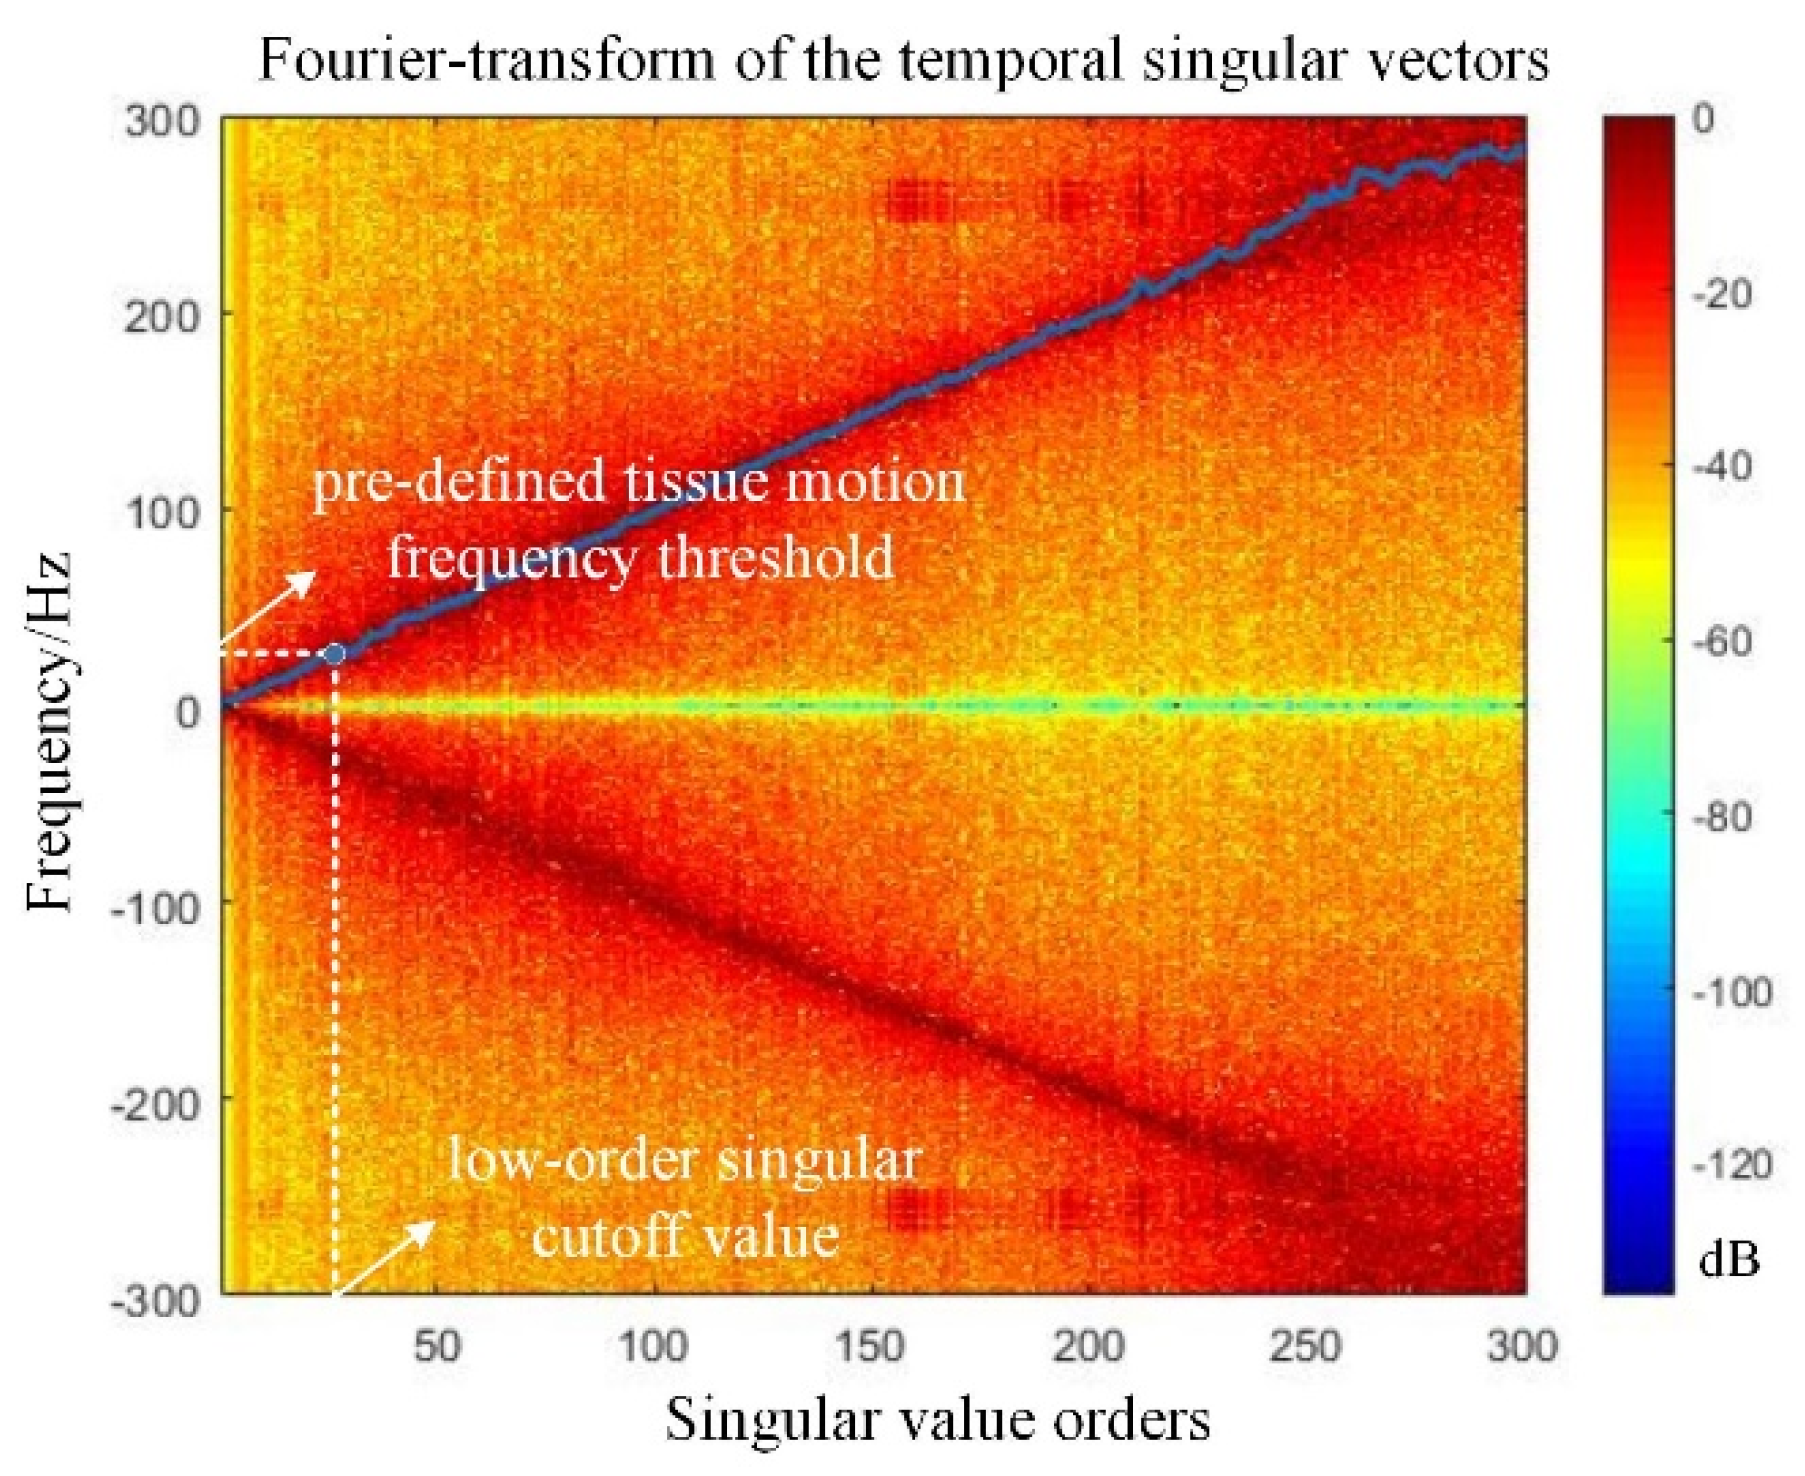
where S f is the filtered dataset. Typically, I f is a diagonal identity matrix with zeros for the first couples of diagonal elements, leading to a truncated singular value matrix corresponding to the removal of tissue motion. To accurately differentiate the blood signal, one needs to determine the L-SVT for I f . According to [9], the predefined tissue motion frequency can be utilized to determine the cutoff value of L-SVT: first, the Fourier-transform of the temporal singular vectors V * is calculated, and the amplitude is averaged to estimate the spectral content of the Region of Interest (ROI). Then, the singular vector Doppler frequency curve is used to search for the threshold beyond which the Doppler frequency exceeds the predefined tissue motion frequency (e.g., 19 Hz), as shown in Figure 2.
5. Background noise subtraction
To remove the high-frequency noise coupled with the blood flow signal, we propose a Doppler subtraction imaging method to suppress the high-frequency noise to avoid the robustness problems caused by the complex high-order threshold selection method [15]. The same SVD clutter filtering (i.e., low-order SVT of 26) is separately applied to all channels of the H-scan. Since there is little blood flow signal assigned in the R channel (mostly large layer scattering), the majority of the remaining signal after SVD clutter filtering should be noise. Since the R and B channel data are derived from ultrasonic backscattered signal within the same ROI at the same time period, we can subtract the noise field (i.e., R channel SVD filtering results) from the power Doppler result (i.e., B channel SVD filtering results) to increase the contrast-to-noise-ratio (CNR) of blood flow Doppler imaging.

2.3. Block-Wise Local SVD Clutter Filtering for H-Doppler

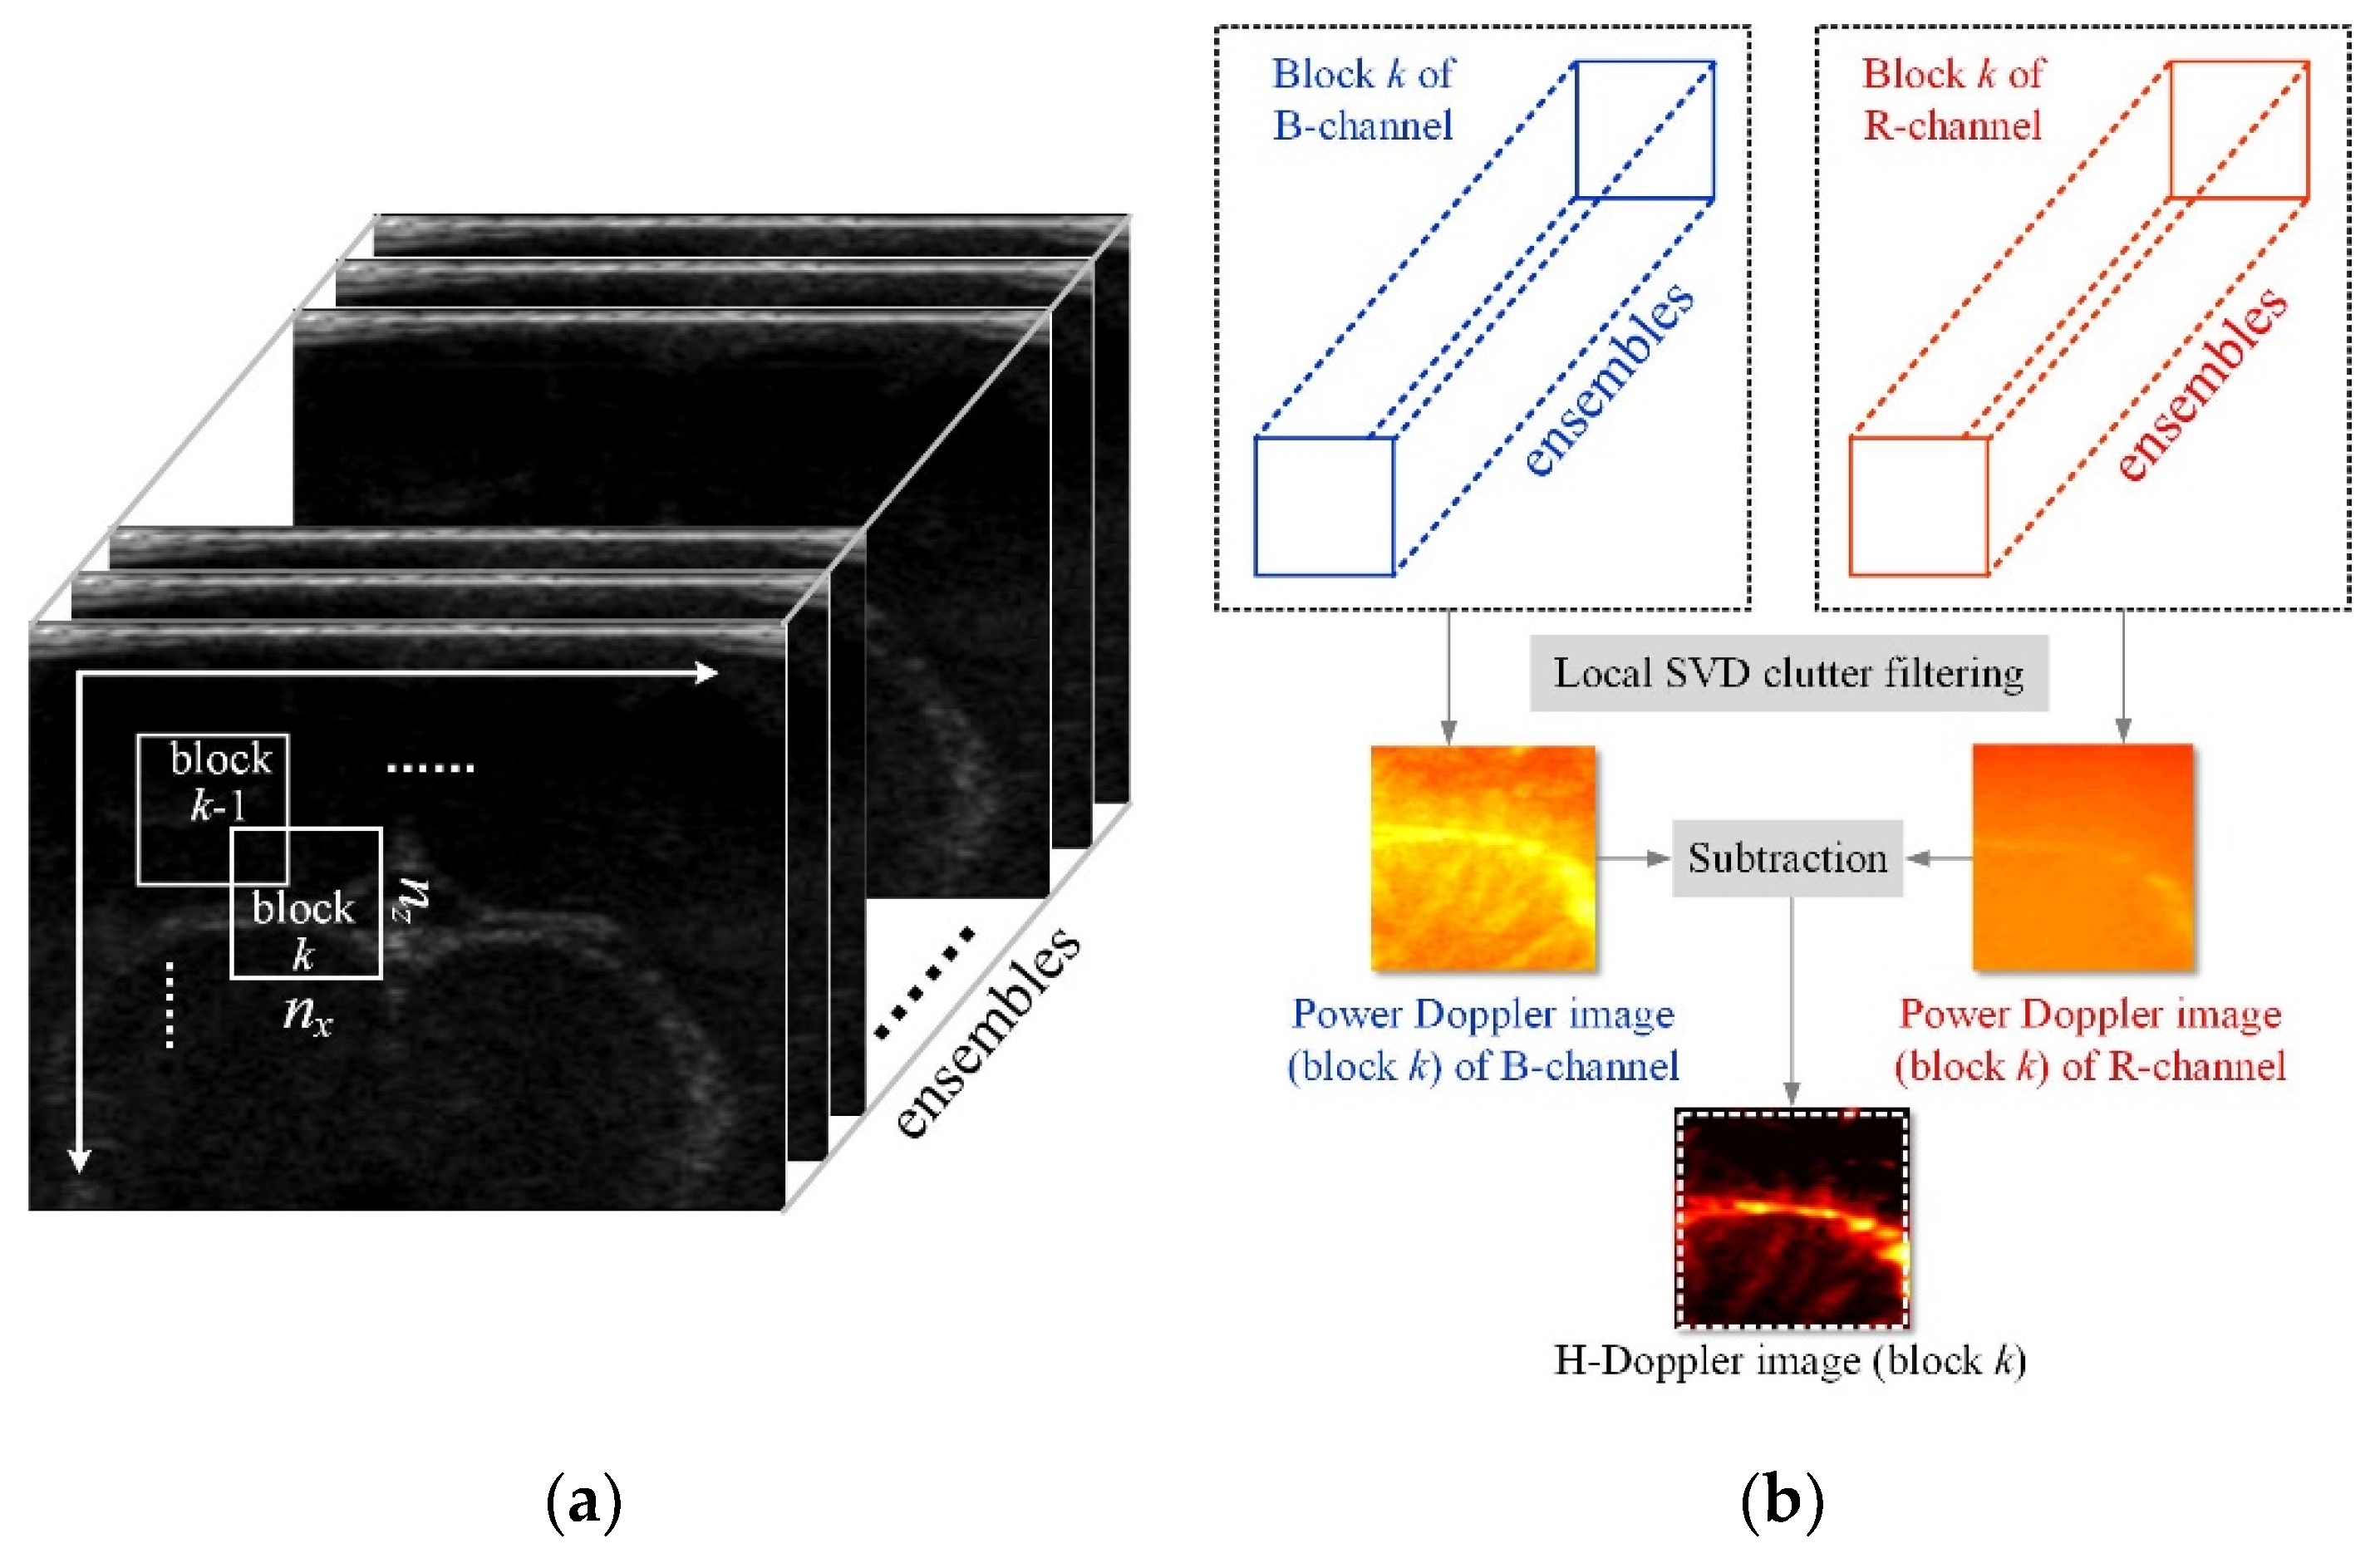
To provide a better image of the blood flow in deep tissue, the block-wise local SVD (BWL-SVD) filtering method was introduced, which can improve the small vessel imaging quality and clutter rejection by decomposing the full dataset into multiple blocks and performing SVD filtering on each block, respectively, as shown in Figure 3a. For the BWL-SVD filtering approach, the size and overlap percentage of the blocks determine the quality of the image. According to Reference [15], the block-wise SVD clutter filtering does not offer benefits until a block size of 50 and provides similar results for block sizes from 80 to 150, until the background ramp-shaped noise and the near field tissue signal become prominent again at a block size of 200. Increasing the overlap percentage can improve the smoothness of the power Doppler image but reduce the computational efficiency. Overall, an 80% overlap was suggested to offer a good tradeoff between the computational cost and the image quality [15]. In this case, a block size of 128 (Height) × 24 (Width) and overlap of 120 (Height) × 20 (Width) are used in our experiment to obtain high-quality power Doppler images.
For H-Doppler flow imaging, the R and B channel data in each block are separately applied with the subtraction operation following local SVD clutter filtering, as shown in Figure 3b. The final blood flow signal S f ( x , z ) for each pixel (x,z) is given by:
S f ( x , z ) = 1 N n = 1 N ( S n f low-cutoff λ )
where S n f is the clutter-filtered signal from block n, N is the total number of overlapped blocks containing the target pixel (x,z) and λ are the remaining singular values corresponding to the blood signal. Notice that same experimental setup is used for both UCDI and the H-Doppler methods in this paper for comparison purposes.

2.4. System Setup

A Vantage 64 LE HF research ultrasound platform (Verasonics Inc., Redmond, WA, USA) equipped with a customized linear array transducer (Vermon Inc., Tours, France, center frequency: 15 MHz, pitch: 0.11 mm, −6 dB bandwidth: 61%) was employed for H-Doppler in this study. To obtain the best performance of tissue scattering classification for H-scan, an arbitrary waveform generator module was adopted in the experiment, as shown in Figure 4a. The ultrasonic transmitted signal is a 15-MHz Gaussian window weighted sinusoidal signal established through the Vantage arbitrary waveform generator toolbox. Figure 4b shows the theoretical waveform of the GH4 kernel and the transmitted waveform received by the hydrophone (NH1000, PA, Dorchester, UK) in our experiments. RF signals were acquired from a coherent plane wave approach compounding with 7 angles ranging from −11° to 11° at a sampling frequency of 60 MHz. The delay between each transmission was set to 160 microseconds. Since the Vantage 64 LE HF system can only receive 64 channels in each transmission, it takes two transmissions to get a full frame. Therefore, the nominal pulse repetition frequency (PRF) was 3.125 kHz. The raw RF data from the 128 elements transducer was beamformed using a delay-and-sum method [32].

2.5. Flow Phantoms Production

Homogeneous tissue-mimicking phantom was constructed with 10% gelatin, 3% agar and 2% different-sized scatterers containing 1% suspended solid polyethylene microspheres (diameter ≈ 180 μm, Beijing Qinye Technology Co., Ltd., Beijing, China) and 1% silica microspheres (diameter ≈ 6 μm, Ultra-Pure Applied Materials Co., Ltd., Chengdu, China). A commercially available vascular graft with a diameter of 3 mm (Venaflo II, Tempe, AZ, USA) was embedded into the homogeneous phantom at a tilt angle of about 10°. In the experiment, different concentrations of bovine anticoagulant blood were injected through a syringe pump (XF-101AD Suzhou Xunfei Scientific Instruments Co., Ltd., Suzhou, China) at a fixed speed of 50 mm/s. The transducer was positioned at the top of the phantom, and the raw RF data were acquired by the Vantage 64 LE HF research ultrasound system. To demonstrate the superiority of the H-scan in blood flow detection, we investigated the mean intensities of the R channel (large layer scattering) and B channel (Rayleigh scattering) at different concentrations after the H-scan display images were obtained.

2.6. Animal Preparation and Statistical Analysis

The in vivo rabbit experiment was performed according to the Suzhou Institute of Biomedical Engineering and Technology (Chinese Academy of Sciences) Institutional Animal Ethics Committee (SibetAEC) protocol (project identification code: 2020-B01). An adult male rabbit (~2 kg) was anesthetized with urethan (1.25 g/kg) via subcutaneous injection. After fixing the head in a stereotaxic apparatus, a 15 mm × 10-mm cranial window was drilled with trepanation to avoid the ultrasound reflection caused by the skull. The dura was kept to prevent inflammation. During the experiment, several drops of saline were applied topically on the cranial window every 5 min to prevent the dura from drying out and decrease discomfort. The probe was held by a mechanical clamp to avoid the influence of hand movement on the results. In each examination, 700 ensembles were collected, which corresponds to 672 milliseconds of ultrafast data acquisition. In addition to a qualitative visual observation of the H-Doppler results, the CNR of the H-Doppler image were measured by:
C N R = S ¯ blood S ¯ background σ noise
where S ¯ blood and S ¯ background are the mean blood signal and background clutter signal in the ROI. σ noise is the standard deviation of the background noise. The ROIs used in the CNR evaluation are demonstrated in Figure 5.

3. Results

3.1. Flow Phantom Study

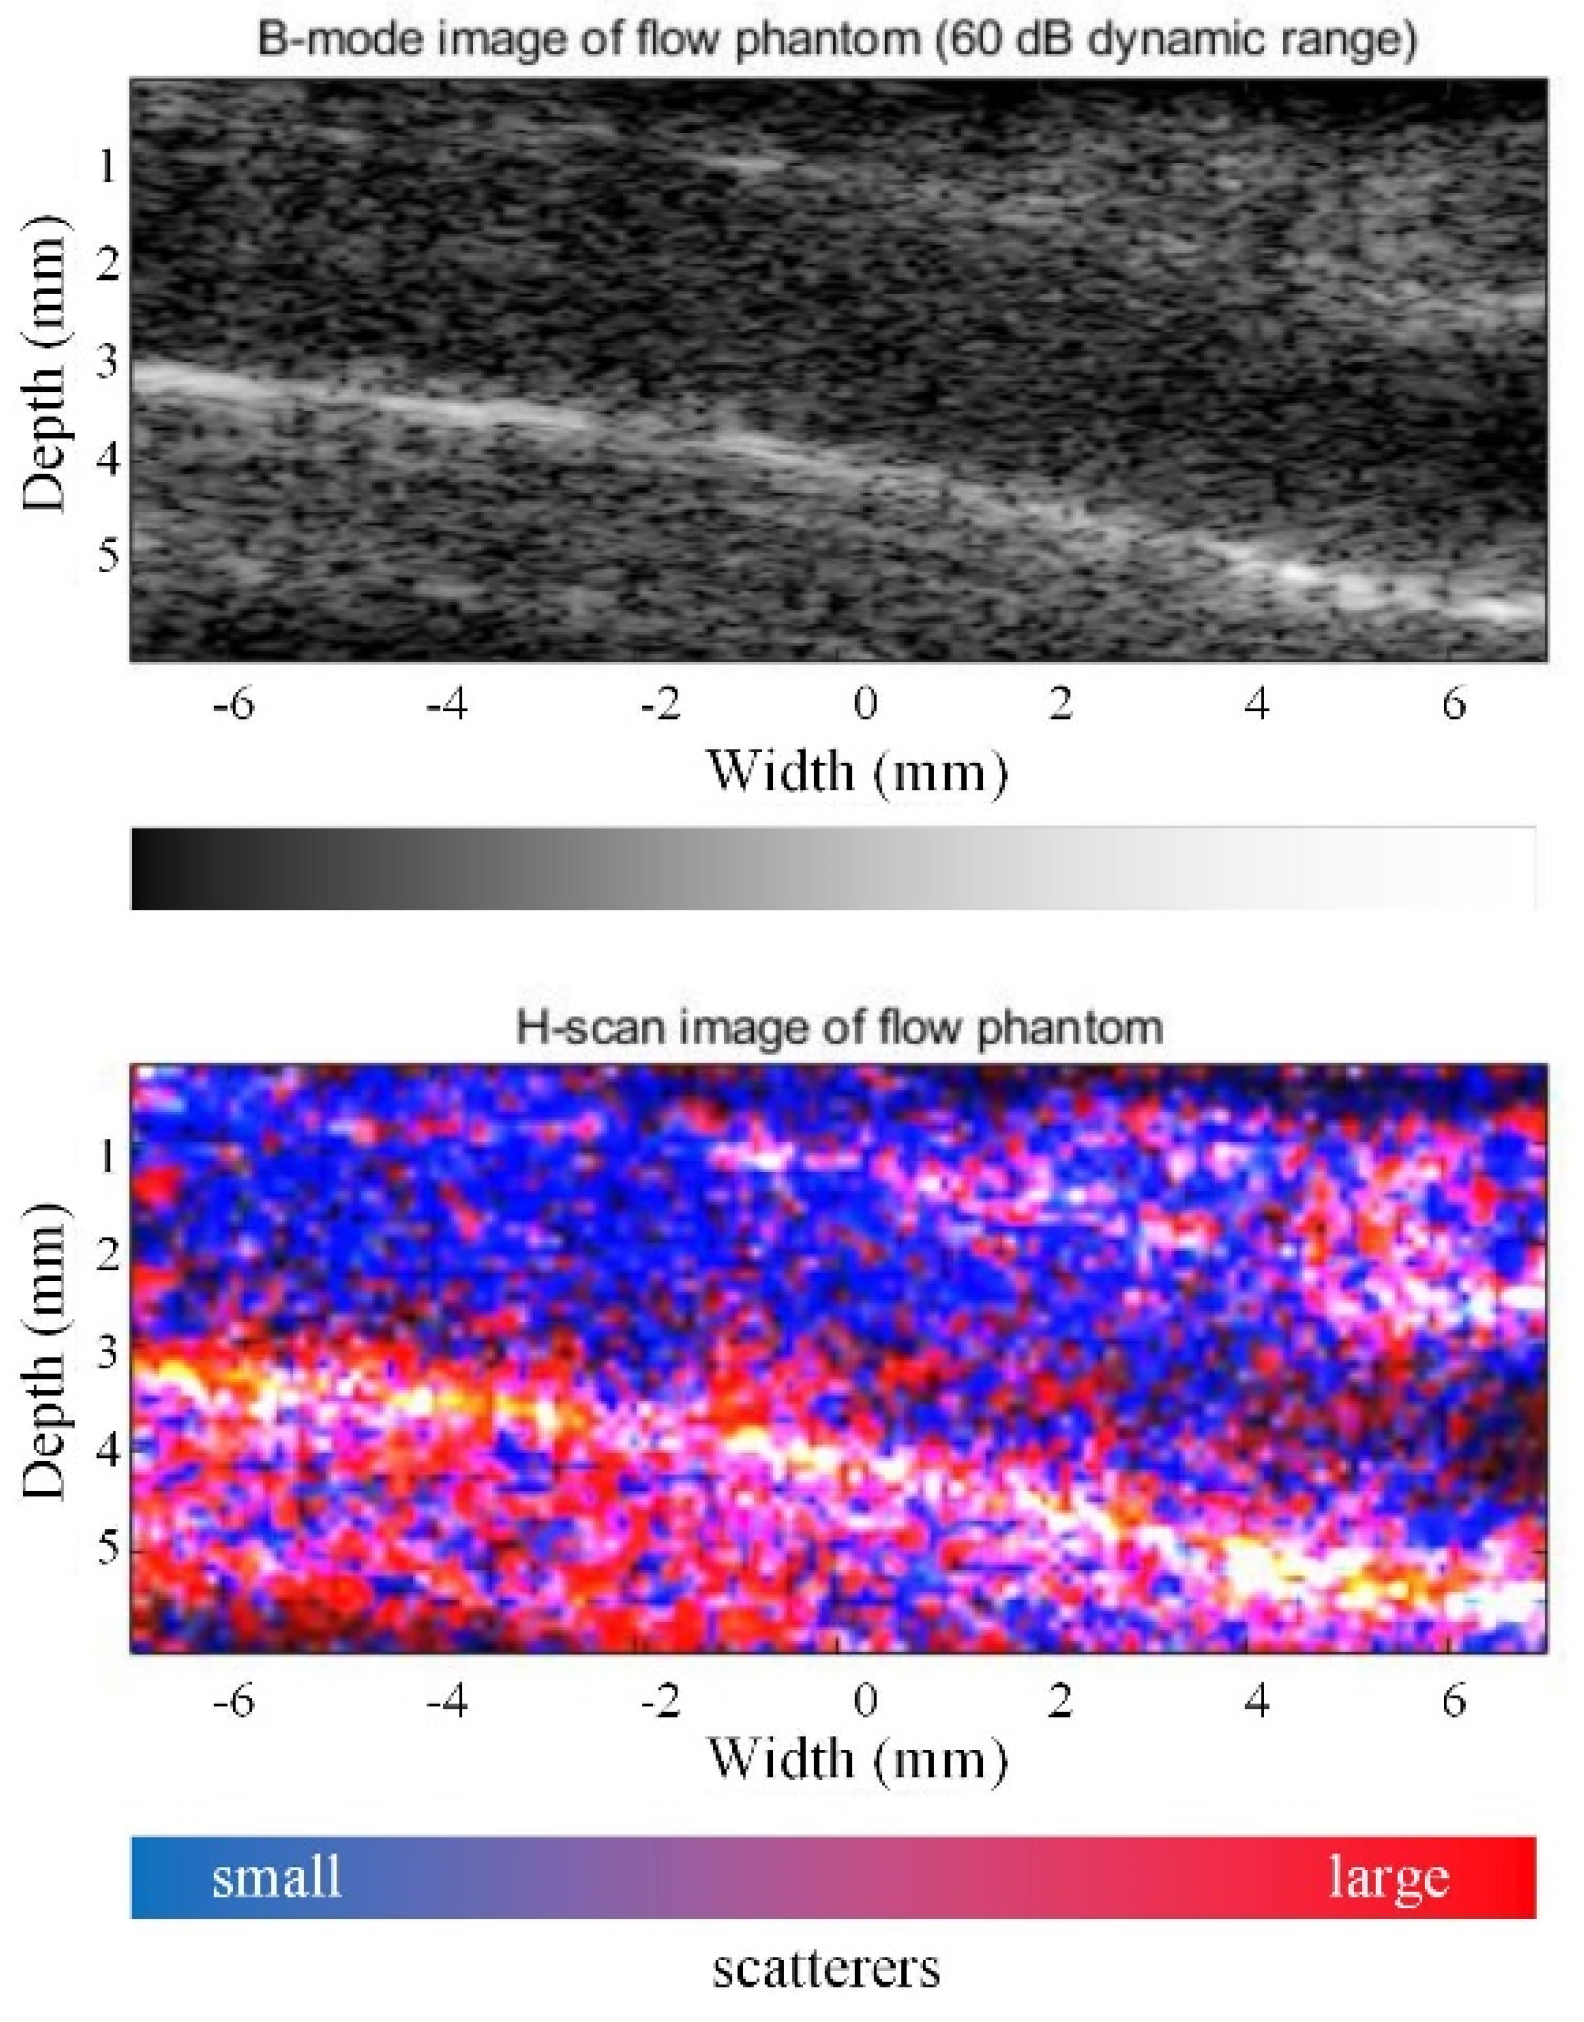
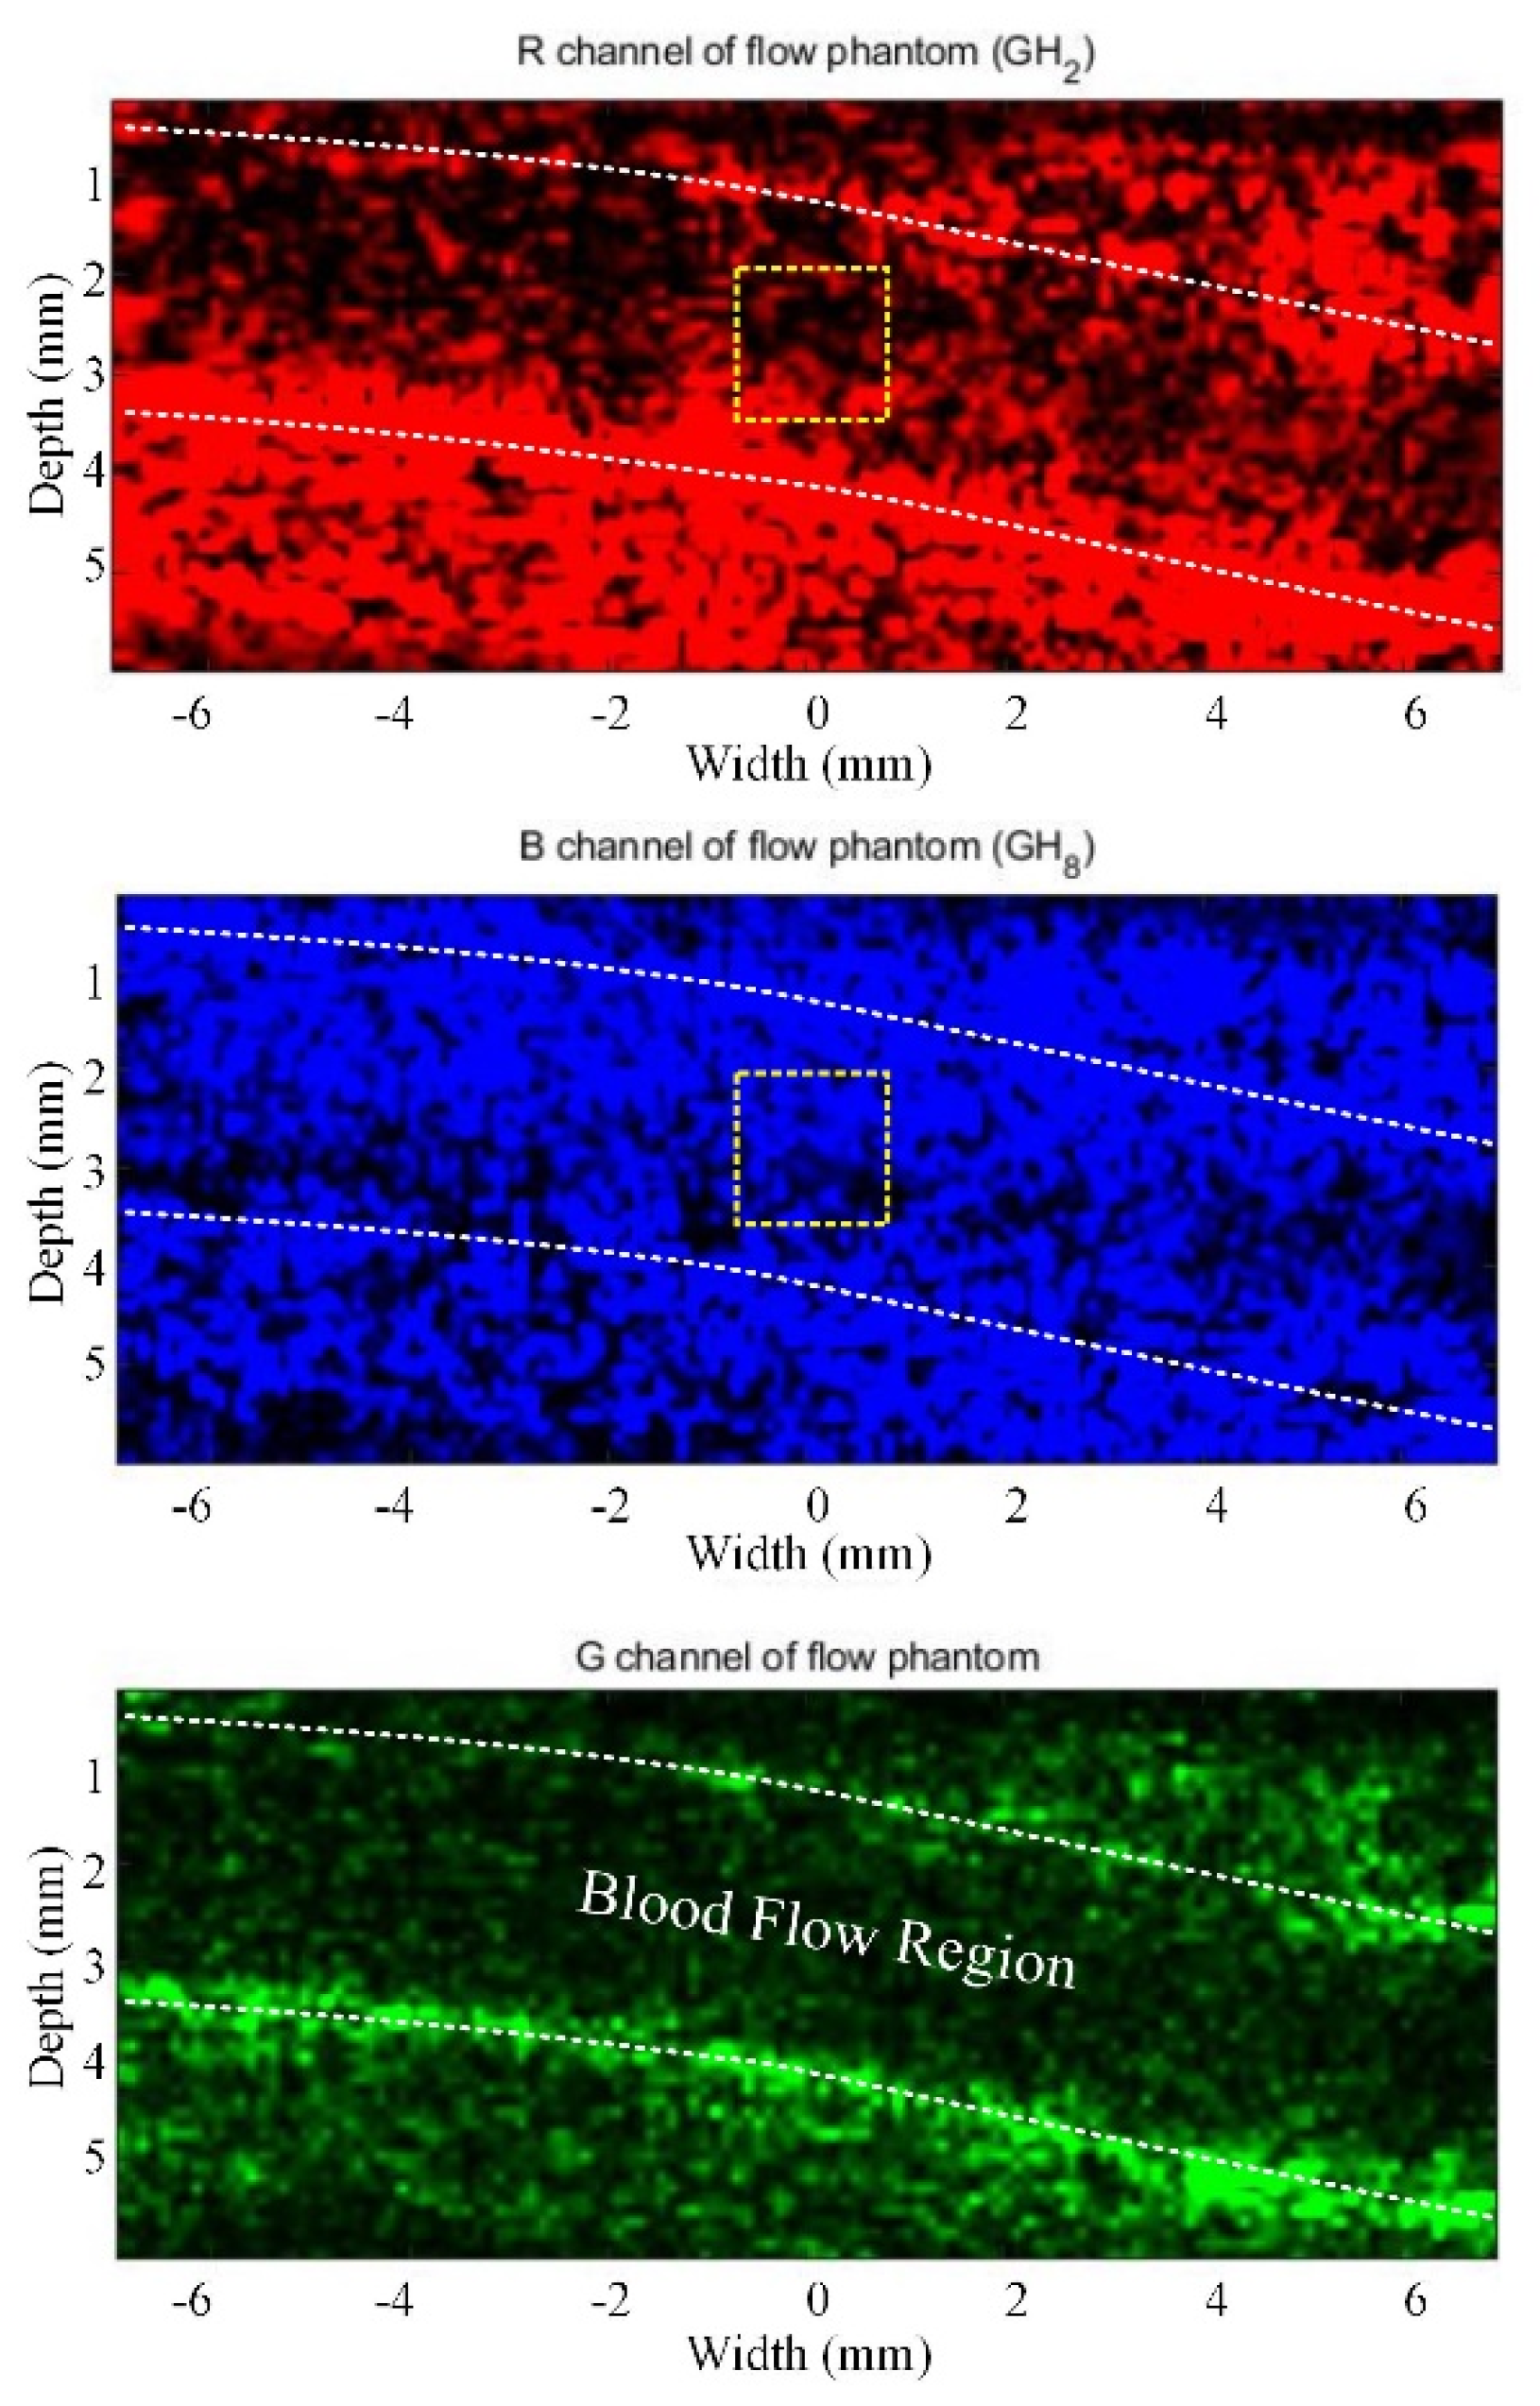
Figure 6 shows the B-mode versus H-scan image of the flow phantom with a blood concentration of 50%. More specifically, Figure 7 shows the imaging results of each RGB channel in the H-scan image. The GH2 convolution outputs in the R channel shows a higher signal strength in the homogeneous phantom, while the signal in the vascular graft is small. The GH8 convolution outputs in the B channel maintain a high signal intensity in all regions. The result of the G channel corresponds to the conventional B-mode image without logarithmic compression. According to the definition of the H-scan, we can roughly assume that blue represents the contribution of relatively small scatterers, while red represents the contribution of relatively large scatterers. To further illustrate that H-scan signals in the vascular graft are mostly contributed by small scatterers, a 1.5-mm × 1.5-mm ROI in the center of the vascular graft (yellow dashed square) was selected to evaluate the changes in the signal strength of R channels and B channels at different concentrations of blood.
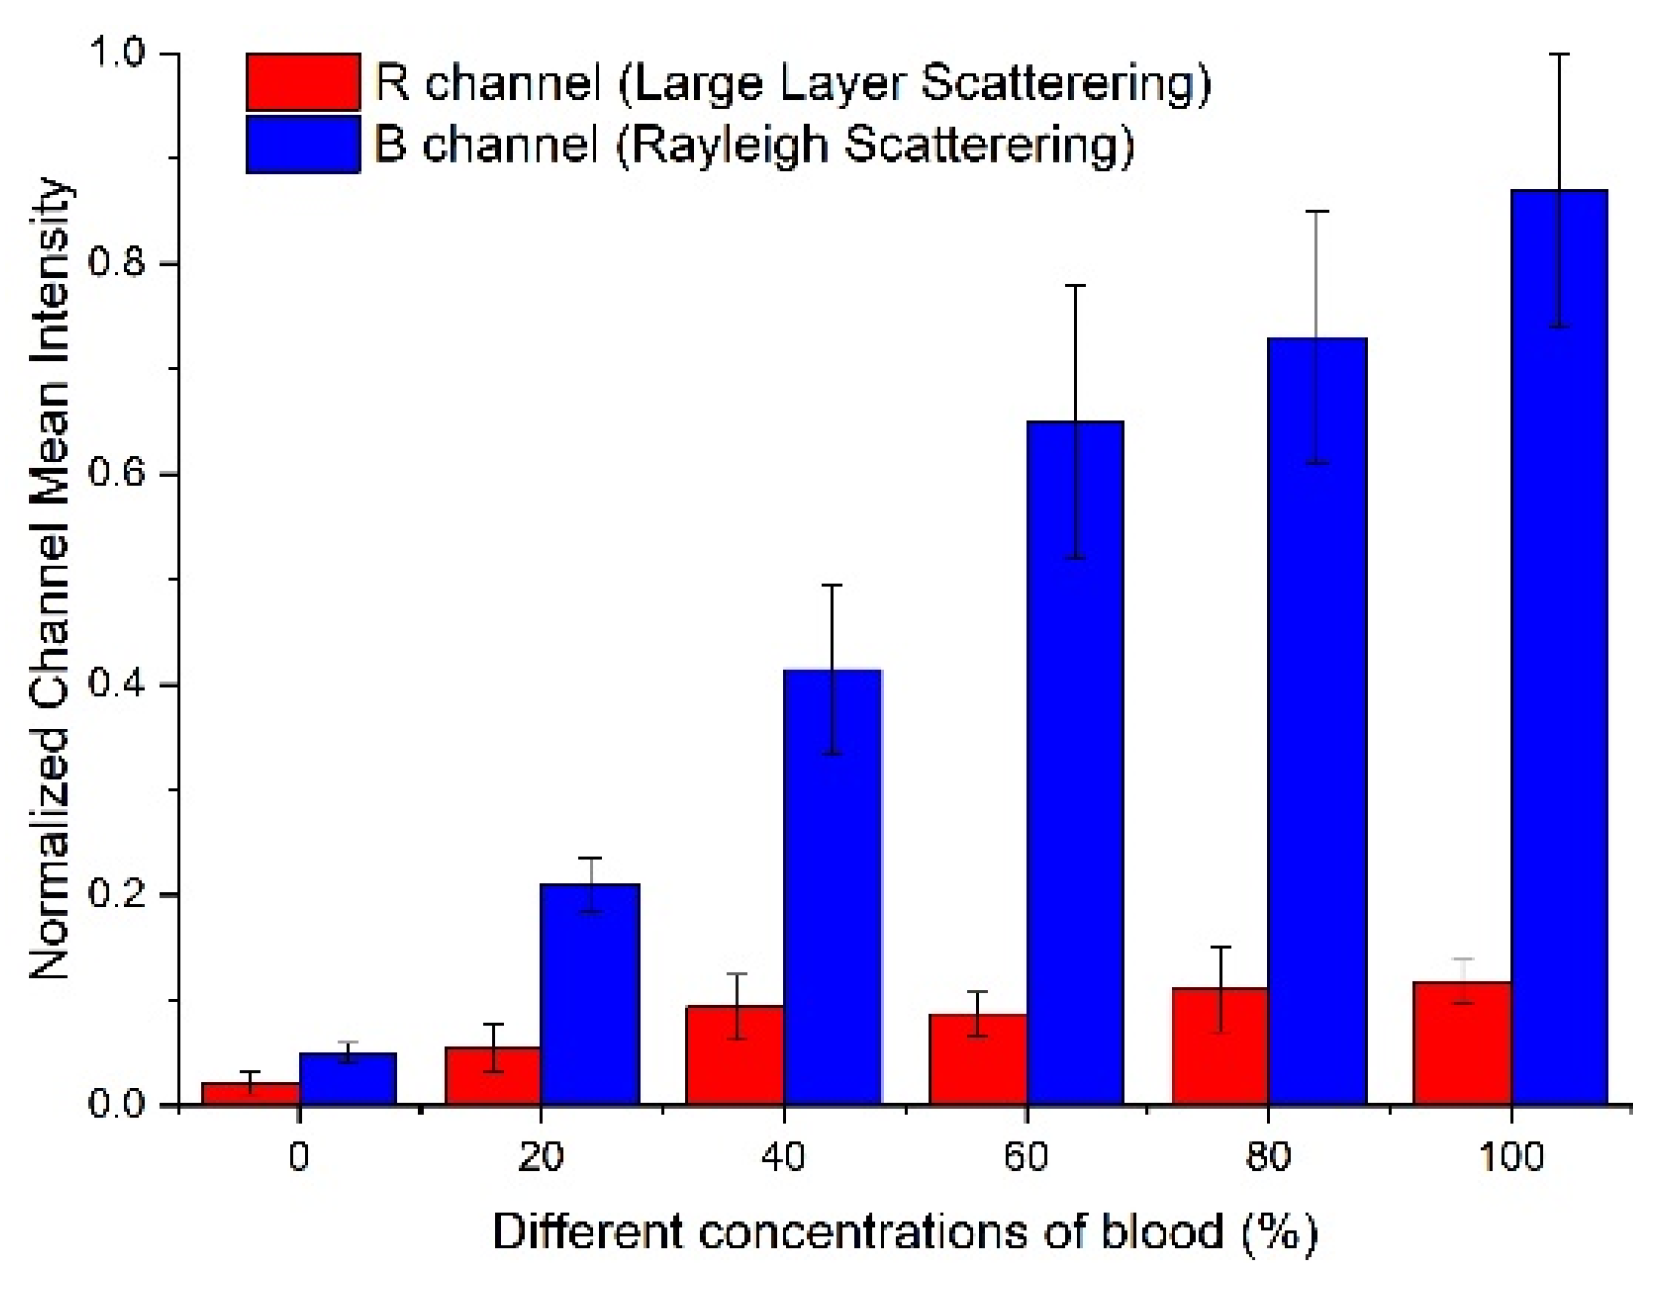
Figure 8 shows the R and B channel mean intensities of the bovine blood solution in ROI with concentrations ranging from 0% to 100%. With a blood concentration of 0 (pure water), small mean intensity values (<0.05) were gauged in both R-channels and B-channels instead of 0, as expected. We believe this is due to the inevitable introduction of air bubbles in the bovine blood solution during the experiment. When the blood concentration increased, one can see that there was no significant increase in the R channel mean intensity, which corresponded to the large layer scattering, whereas the intensity of the B channel increased rapidly, as expected. This suggests that a power Doppler imaging method based on GH2 convolution outputs, which is mainly contributed by the Rayleigh scattering of red blood cells, could potentially improve the sensitivity of blood flow detection.

3.2. Rabbit Brain Imaging

3.2.1. Correlation Analysis and SVD-Filtering Results in RGB Channels

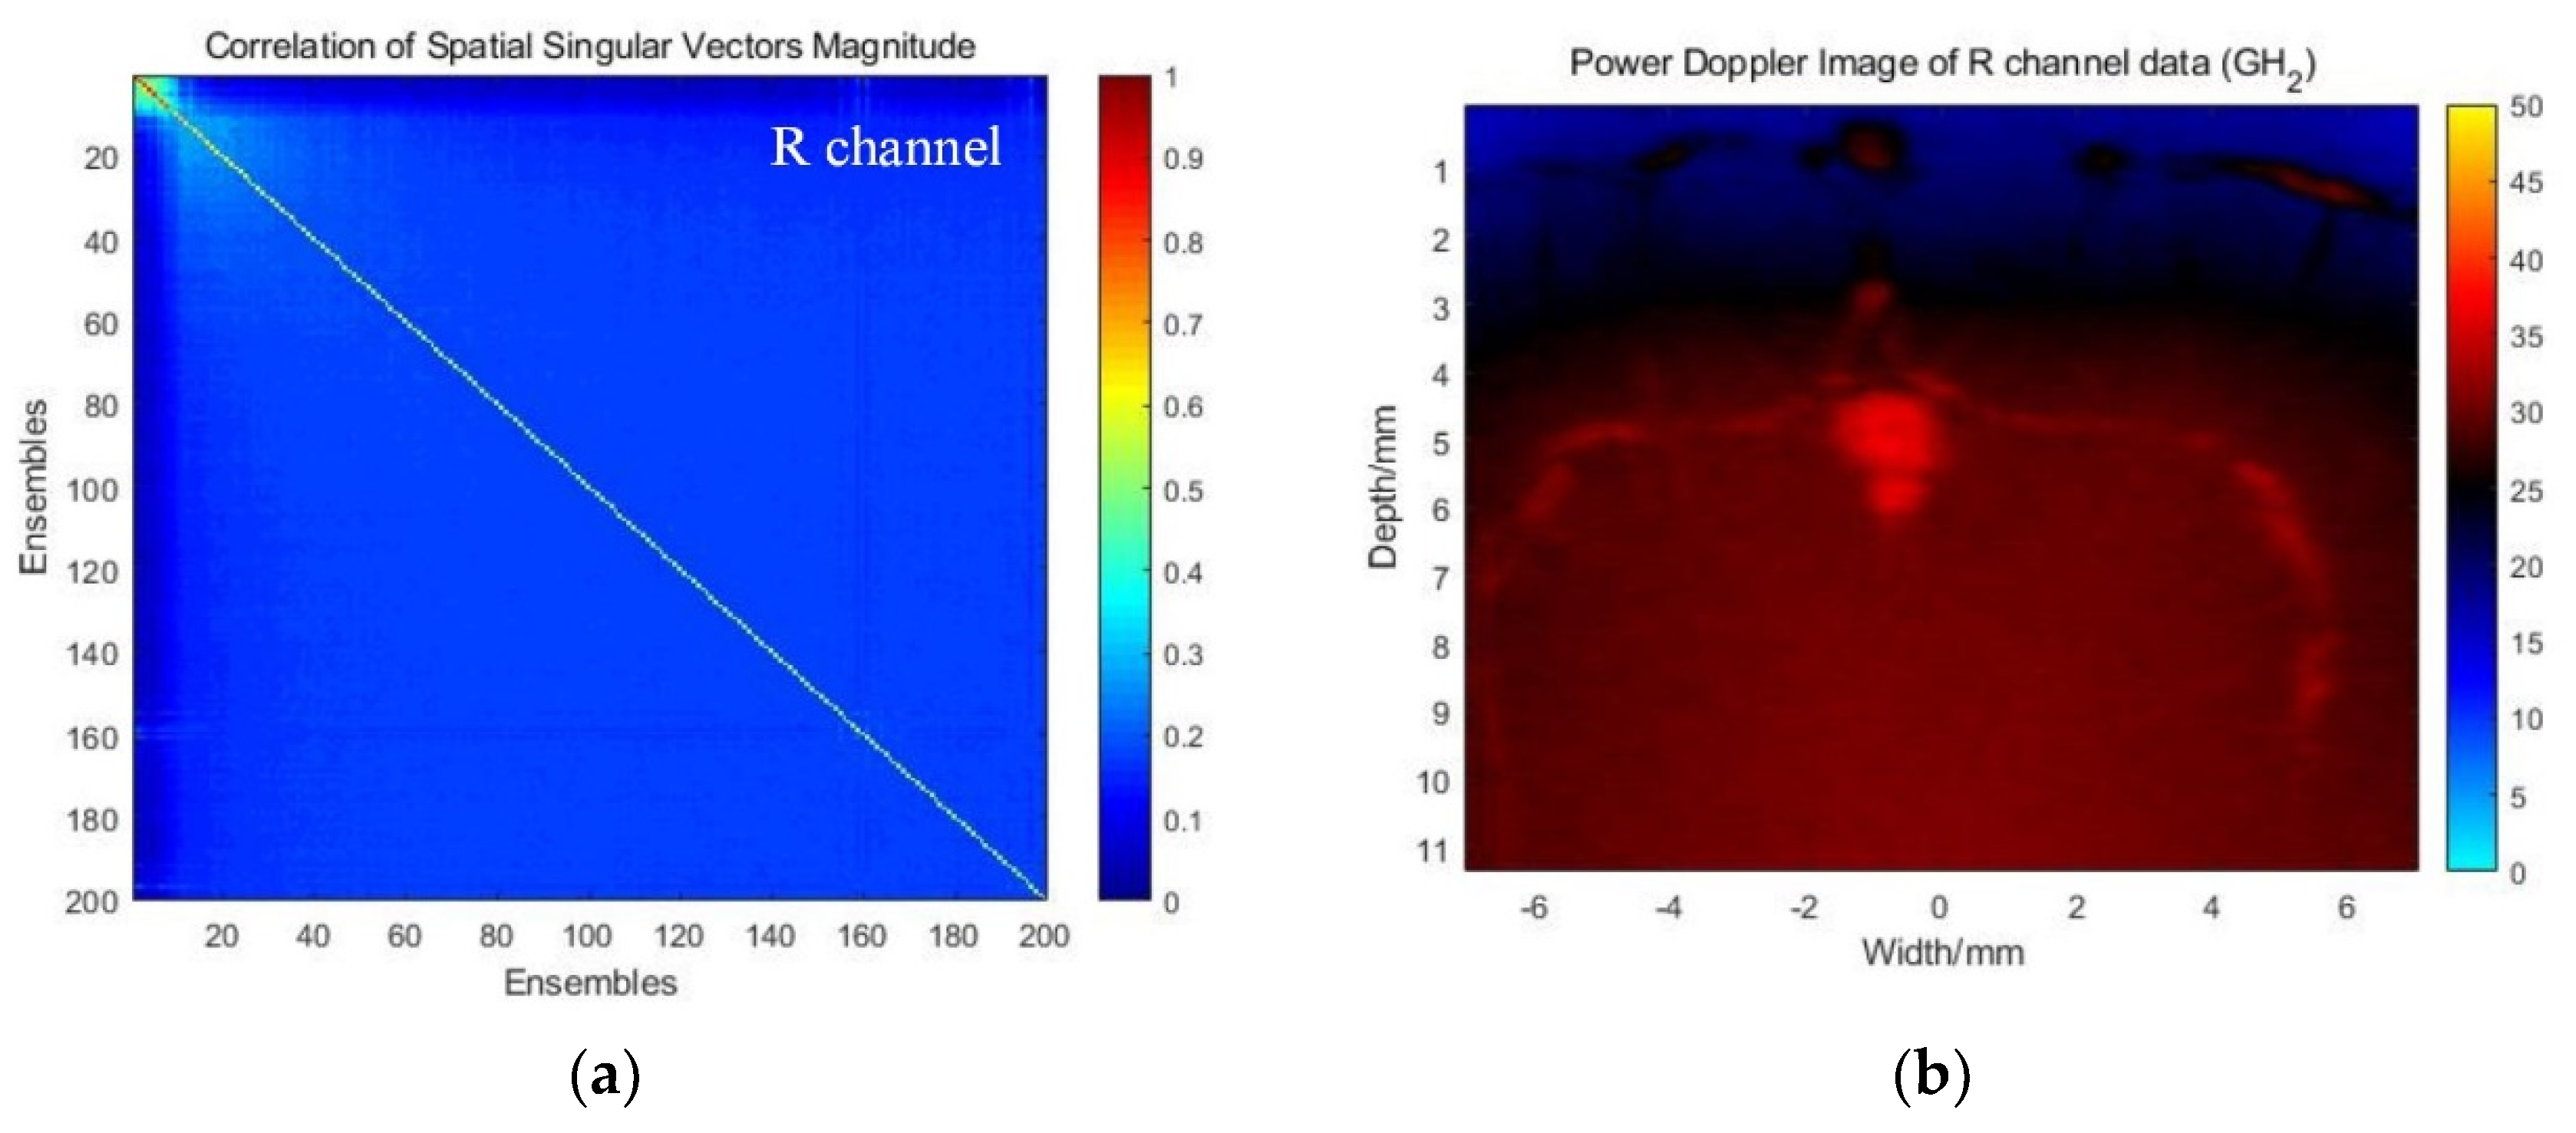
Figure 9a,c,e shows the correlation analysis results of the spatiotemporal characteristics of RGB channels in the rabbit brain experiment. The correlation coefficient of the low-order singular value represents the similarity of the high-intensity tissue signal of the adjacent points, and the correlation coefficient of the high-order singular value represents the similarity of the blood flow signal and the low-intensity noise of the adjacent points. Figure 9b,d,f shows the comparison results of SVD filtering in each RGB channel. All the results were applied with the same low-order singular value cutoff threshold of 22.
As can be seen from Figure 9a, the correlation analysis results of GH2 convolution output only show a high correlation in the lower order, which means that the signals in the R channel are mainly composed of tissue motion and noise. After removing the tissue motion signals by low-order threshold SVD clutter filtering, the majority of the remaining power Doppler results were mainly contributed by noise (Figure 9d). Conversely, one can see that the correlation analysis results for the B channel essentially contain more blood flow signals (Figure 9c). Therefore, the power Doppler results obtained under the same low-order threshold SVD filtering also showed more details of the blood flow (Figure 9f). The result of the G channel can be considered as the result of conventional low-order SVD filtering (Figure 9e).
Due to the attenuation of an ultrasound in biological tissue, the lower half of the power Doppler image is usually noise-saturated, which results in a particularly low CNR. To suppress the influence of noise, a noise subtraction method to obtain the final Doppler image by subtracting the noise signal of GH2 from the blood flow signal of GH8 was proposed (step 5 in Section 2). Since these two signals are obtained with the same ultrasonic sequence, SVD processing, ROI and time period, the noise subtraction process provides a more uniform result of power Doppler imaging. Its superiority to conventional low- and high-order SVD filtering will be demonstrated in Figure 10.

3.2.2. Global SVD Clutter Filtering for H-Doppler

Figure 10a shows the experimental rabbit with the craniotomy and the location of the probe. Figure 10b shows the B-mode image of the FOV with seven angles of CPW. Figure 10c,d demonstrates the comparison results between the conventional UCDI method with low- and high-order SVTs and the global H-Doppler method on the same set of in vivo rabbit brain data. According to the principles of the Marčenko-Pastur distribution, the turning point where the frequency curve hits the noise threshold was used as the pre-cutoff of the high-order SVT [16]. In this study, a cutoff value of 232, which achieved the best visualization of the detailed vasculature, was set as the high-order SVT for the conventional UCDI approach. As one can see, the image quality is improved with reduced noise by applying both low- and high-order SVTs. For H-Doppler, after low-order SVT (cutoff value is 22, the same as Figure 9), the tissue signal can be mostly removed. Next, the ratio of the mean power value of the R channel and B channel is computed and used to weigh the power Doppler result in the B channel. Lastly, noise subtraction calculations are performed.
From the results, one can see that the global H-Doppler method can significantly enhance the contrast of the image at the cost of the loss of small blood vessel signals in deep tissue and retain more blood flow information in the superficial areas of the image. Note that the power value given by global H-Doppler would be reduced to a smaller range (0–44 dB) due to the subtraction operation, but the color range of H-Doppler was intentionally set to 0–50 dB for comparison purposes. To quantify the image quality, the green dashed region was selected as the noise area to calculate σ noise , and the white dashed and yellow dashed regions containing fine blood vessels were selected as the blood vessel areas to calculate S ¯ blood , respectively. The CNR of the global low- and high-order SVT filtering method was 15.5 dB (white) and 10.1 dB (yellow), and the CNR of the global H-Doppler method was upgraded to 19.6 dB (white) and 16.7 dB (yellow). These results indicate that the global H-Doppler method is superior to the traditional method in improving the image contrast, but the global noise subtraction processing inevitably results in the loss of small blood flow signals in deep tissue. To solve this problem, the block-wise local SVD (BWL-SVD) filtering method is introduced into H-Doppler by dividing the global plane wave data into overlapped local spatial segments [15].

3.2.3. Block-Wise Local SVD Filtering for H-Doppler

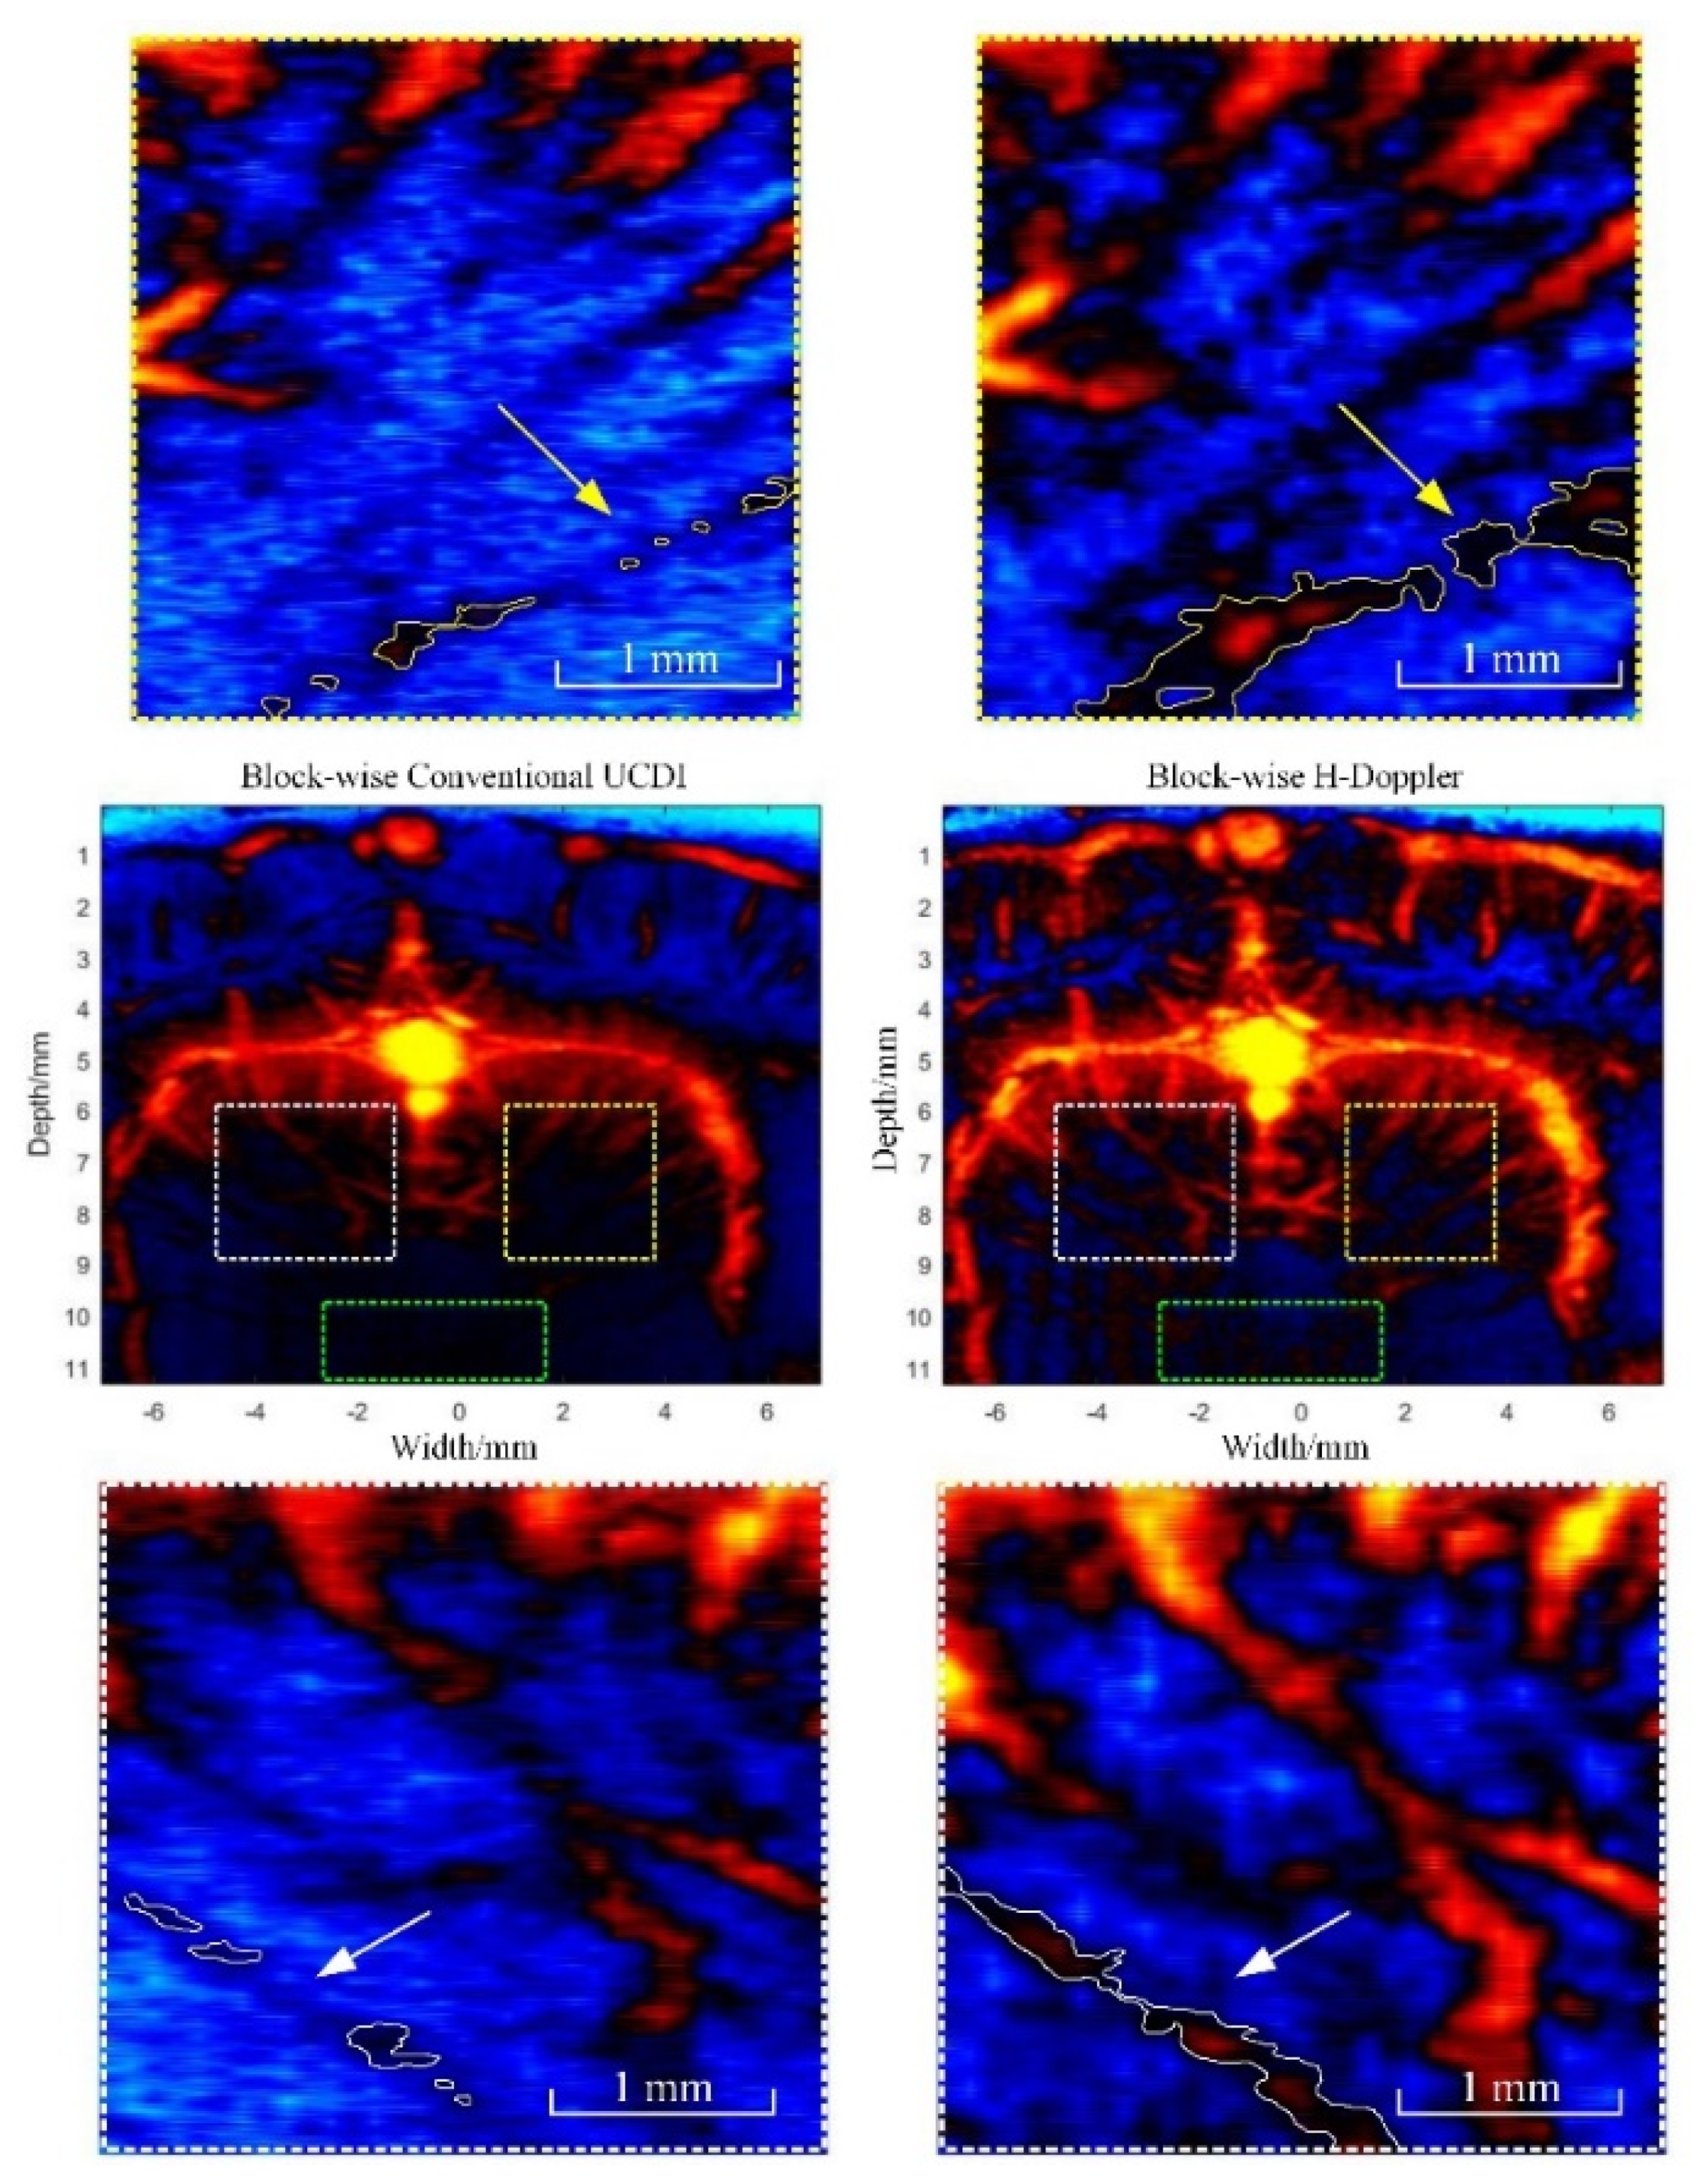
Figure 11 shows the comparison results of block-wise local SVD (BWL-SVD) filtering for conventional UCDI and H-Doppler processed with a fixed block and step size. The effects of different block parameters on the results were compared in detail [15]. The block parameters used in this experiment are block size = height: 128, width: 24 and overlap = height: 120, width: 20. According to the threshold selection strategy mentioned in Section 2.2, as the singular vector Doppler frequency curves of different blocks change, the thresholds of BWL-SVD result in a range rather than a fixed value with the same predefined Doppler frequency. For our experiment, the conventional UCDI method with BWL-SVD filtering has low-order thresholds ranging from 22 to 31 and high-order thresholds ranging from 232 to 264. H-Doppler method shares the same low-order thresholding as UCDI but does not require high-order thresholding. The images reveal that the Doppler results obtained by the H-Doppler retain more of the blood flow signals in the deep tissue. The zoomed images show more details. The CNRs of the conventional UCDI with BWL-SVD filtering were 20.1 dB (white) and 19.7 dB (yellow). The CNRs of the H-Doppler approach we proposed were upgraded to 23.2 dB (white) and 24.7 dB (yellow). To further illustrate the superiority of the H-Doppler method based on BWL-SVD, we selected two vessels at the same depth in Figure 11 (pointed by the arrows) for quantitative comparison. The target pixel numbers and mean intensities of the blood signals are calculated. The results show that the target pixel numbers and mean intensities of the H-Doppler approach in the yellow region are 27,663 pixels and 24.7 dB, surpassing the 2225 pixels and 15.1 dB of the traditional UCDI method. In the white region, the H-Doppler results are 16,077 pixels and 22.3 dB, surpassing 1841 pixels and 7.8 dB of the UCDI method.

4. Discussion

This paper presents an H-scan subtraction Doppler imaging technique based on ultrasound blood flow scattering identification to address several critical challenges of small-vessel Doppler imaging with ultrafast compounding plane waves. The flow phantom experiments with different blood concentrations, showing that the H-Scan is capable of estimating the relative size and spatial distribution of acoustic scattering objects. In the in vivo rabbit brain experiment, the H-Doppler method, together with global and block-wise local SVD (BWL-SVD) clutter filtering, is proposed to facilitate better power Doppler images with a significant improvement of background noise suppression. The detailed drawings also show the improvements of the H-Doppler method in contrast to CNR and its superiority to conventional UCDI techniques.
To sum up, the advantage of H-Doppler in the detection of small blood flow benefits from the fact that B-channel data contributed by the convolution outputs of GH8 are more sensitive to Rayleigh scattering of the blood (the size is smaller than the wavelength of ultrasonic signals). As shown in Figure 9c,f, the SVD filtering results based on the B channel data essentially contain more blood flow information. Besides, the H-scan helped preserve the axial resolution, because the convolution filtering has a data smoothing effect [23]. Therefore, one of the simple approaches suggested in this paper is to perform power Doppler imaging immediately after the GH8 convolution filtering is applied to the original RF signal, which can improve the quality of the Doppler image to some extent.
However, due to the involved tissue components and noise distribution in the biological tissue, it is difficult to determine the exact cutoff value of the high-order singular value thresholding in practice. The simple reason for that is the high-order SVT has always been based on the fair assumption that the blood flow signal and background noise have completely differing spatiotemporal characteristics. Moreover, the background noise is affected by many factors, such as ultrasonic attenuation and environmental vibration, which prevents us from obtaining a robust Doppler algorithm. In this study, we proposed a time domain subtraction method for H-scan power Doppler imaging, which can improve the CNR of the Doppler image. The proposed method only requires a preset low-order threshold in the process of SVD clutter filtering, which can be obtained directly through the estimation of blood flow Doppler frequency shift in practice. The feasibility of the previous time-domain subtraction method was proposed by Song [15]. They used a reference phantom to collect the background noise for the SVD filtering. Then, they used the noise field derived from the reference phantom to equalize the in vivo power Doppler image. The results show that the noise reduction method can increase the contrast of the Doppler image. However, the working sequence of this method is difficult to be applied in practice. For our method, after the convolution filtering of the H-scan, the R channel is essentially composed of more reflected signals of relatively large scatterers (large layer scattering), and the power Doppler results of which suggest that the R channel contains more tissue vibration information and high-frequency noise. The H-Doppler can directly give power Doppler images with high CNR by the subtraction of R channel data from B channel data.
One of the most important findings in this paper is that the loss of small blood flow signals in deep tissue caused by the global SVD filtering can be recovered to a certain extent through BWL-SVD processing. The H-Doppler method based on BWL-SVD filtering not only improves the Doppler image quality but, also, gives more abundant images of fine blood flow with the noise subtraction process block by block. The comparison results of Doppler images with different methods are summarized as Table 2.

Limitations

There are also some obvious limitations for fine blood flow detection with H-Doppler.
  • To successfully capture the signals encoded in the ultrasound data with Gaussian weighted Hermite polynomials kernels, the frequency bands of the ultrasound RF signal are assumed to contain the information on both large and small scattering objects. Therefore, the probe used in the H-Doppler method should be broadband.
  • According to the basic assumption of the H-scan, the emission waveform needs to be approximated as a GH4 kernel (13). This is also why an arbitrary waveform generator module was adopted in the experiment to obtain the best performance of tissue scattering classification for the H-scan.
  • Another limitation of the current H-scan method is that it cannot compensate for frequency-dependent attenuation. Since the GH2 and GH8 convolution outputs represent different frequency-dependent scattering, i.e., the B channel is contributed by higher frequency ultrasound signals reflected from small scatterers; the corresponding image quality will be diminished in deep tissue. These influences were ignored in this paper, but recently, some have proposed that the attenuation correction method can enhance the ability of tissue characterization for H-scan imaging, especially for deep tissue [33]. An adaptive attenuation correction that can match to the changing spectrum undergoing attenuation will be investigated in a future study to improve the visualization of the H-Doppler results in deep tissue.
  • Additionally, there is a lack of a ground truth of the actual vessel sizes and distributions in the in vivo images for comparison to the ultrasound images. The future work also includes obtaining histological sections of the rabbit brain together with the ultrasound imaging plane to visually verify the size and location of blood vessels for comparison with different beamforming approaches and the H-Doppler method.

5. Conclusions

This paper introduced an H-scan subtraction Doppler imaging method, which is the first attempt to improve the image quality of fine vessels with the classification of ultrasound scattering. A quantitative comparison of the H-Doppler and conventional UCDI with both global SVD clutter filtering and block-wise local SVD filtering demonstrated the superiority of the proposed approach for in vivo rabbit brain imaging and provided a deeper understanding of how variations in power Doppler imaging appearance are linked to underlying scatterer classes. The future work includes the combination with adaptive attenuation correction methods for the H-scan, as well as application-oriented optimization for the detection of abnormal changes in the blood, such as thrombotic diseases.

Author Contributions

Conceptualization, Y.J. and Z.W.; methodology, Y.J. and Y.C. (Yang Chen); software, Y.C. (Yang Chen); validation, Y.X.; writing—original draft preparation, Y.J.; writing—review and editing, D.Z.; visualization Y.X.; supervision, Y.C. (Yaoyao Cui) and funding acquisition, Y.J. and Y.C. (Yaoyao Cui). All authors have read and agreed to the published version of the manuscript.

Funding

This research was funded by the National Natural Science Foundation of China, Grant 51805529, Grant 11704397 and Grant 61901468. This research was funded by the Funds of Chinese Academy of Sciences, Grant NO. YJKYYQ20180031.

Conflicts of Interest

The authors declare no conflict of interest. The funders had no role in the design of the study; in the collection, analyses or interpretation of data; in the writing of the manuscript or in the decision to publish the results.

References

  1. Bercoff, J.; Montaldo, G.; Loupas, T.; Savery, D.; Mézière, F.; Fink, M.; Tanter, M. Ultrafast compound Doppler imaging: Providing full blood flow characterization. IEEE Trans. Ultrason. Ferroelectr. Freq. Control 2011, 58, 134–147. [Google Scholar] [CrossRef] [PubMed]
  2. Osmanski, B.-F.; Pernot, M.; Montaldo, G.; Bel, A.; Messas, E.; Tanter, M. Ultrafast Doppler imaging of blood flow dynamics in the myocardium. IEEE Trans. Med. Imaging 2012, 31, 1661–1668. [Google Scholar] [CrossRef] [PubMed]
  3. Podkowa, A.S.; Oelze, M.L.; Ketterling, J.A. High-frame-rate Doppler ultrasound using a repeated transmit sequence. Appl. Sci. 2018, 8, 227. [Google Scholar] [CrossRef] [PubMed] [Green Version]
  4. Rossi, S.; Ramalli, A.; Fool, F.; Tortoli, P. High-Frame-Rate 3-D Vector Flow Imaging in the Frequency Domain. Appl. Sci. 2020, 10, 5365. [Google Scholar] [CrossRef]
  5. Mace, E.; Montaldo, G.; Osmanski, B.-F.; Cohen, I.; Fink, M.; Tanter, M. Functional ultrasound imaging of the brain: Theory and basic principles. IEEE Trans. Ultrason. Ferroelectr. Freq. Control 2013, 60, 492–506. [Google Scholar] [CrossRef] [PubMed]
  6. Urs, R.; Ketterling, J.A.; Silverman, R.H. Ultrafast ultrasound imaging of ocular anatomy and blood flow. Investig. Ophthalmol. Vis. Sci. 2016, 57, 3810–3816. [Google Scholar] [CrossRef]
  7. Urs, R.; Ketterling, J.A.; Alfred, C.; Lloyd, H.O.; Yiu, B.Y.; Silverman, R.H. Ultrasound imaging and measurement of choroidal blood flow. Transl. Vis. Sci. Technol. 2018, 7, 5. [Google Scholar] [CrossRef] [Green Version]
  8. Correas, J.-M.; Anglicheau, D.; Joly, D.; Gennisson, J.-L.; Tanter, M.; Hélénon, O. Ultrasound-based imaging methods of the kidney—Recent developments. Kidney Int. 2016, 90, 1199–1210. [Google Scholar] [CrossRef]
  9. Baranger, J.; Arnal, B.; Perren, F.; Baud, O.; Tanter, M.; Demené, C. Adaptive spatiotemporal SVD clutter filtering for ultrafast Doppler imaging using similarity of spatial singular vectors. IEEE Trans. Med. Imaging 2018, 37, 1574–1586. [Google Scholar] [CrossRef] [Green Version]
  10. Demené, C.; Deffieux, T.; Pernot, M.; Osmanski, B.-F.; Biran, V.; Gennisson, J.-L.; Sieu, L.-A.; Bergel, A.; Franqui, S.; Correas, J.-M. Spatiotemporal clutter filtering of ultrafast ultrasound data highly increases Doppler and fUltrasound sensitivity. IEEE Trans. Med. Imaging 2015, 34, 2271–2285. [Google Scholar] [CrossRef]
  11. Hur, B.Y.; Lee, J.Y.; Chu, A.J.; Kim, S.H.; Han, J.K.; Choi, B.I. UltraFast Doppler ultrasonography for hepatic vessels of liver recipients: Preliminary experiences. Ultrasonography 2015, 34, 58. [Google Scholar] [CrossRef] [PubMed]
  12. Alfred, C.; Cobbold, R.S. Single-ensemble-based eigen-processing methods for color flow imaging-Part I. The Hankel-SVD filter. IEEE Trans. Ultrason. Ferroelectr. Freq. Control 2008, 55, 559–572. [Google Scholar]
  13. Alfred, C.; Lovstakken, L. Eigen-based clutter filter design for ultrasound color flow imaging: A review. IEEE Trans. Ultrason. Ferroelectr. Freq. Control 2010, 57, 1096–1111. [Google Scholar]
  14. Lovstakken, L.; Bjaerum, S.; Kristoffersen, K.; Haaverstad, R.; Torp, H. Real-time adaptive clutter rejection filtering in color flow imaging using power method iterations. IEEE Trans. Ultrason. Ferroelectr. Freq. Control 2006, 53, 1597–1608. [Google Scholar] [CrossRef]
  15. Song, P.; Manduca, A.; Trzasko, J.D.; Chen, S. Ultrasound small vessel imaging with block-wise adaptive local clutter filtering. IEEE Trans. Med. Imaging 2016, 36, 251–262. [Google Scholar] [CrossRef]
  16. Marčenko, V.A.; Pastur, L.A. Distribution of eigenvalues for some sets of random matrices. Math. Ussr-Sb. 1967, 1, 457. [Google Scholar] [CrossRef]
  17. Shankar, P.M. Ultrasonic tissue characterization using a generalized Nakagami model. IEEE Trans. Ultrason. Ferroelectr. Freq. Control 2001, 48, 1716–1720. [Google Scholar] [CrossRef]
  18. Takiuchi, S.; Rakugi, H.; Honda, K.; Masuyama, T.; Hirata, N.; Ito, H.; Sugimoto, K.; Yanagitani, Y.; Moriguchi, K.; Okamura, A. Quantitative ultrasonic tissue characterization can identify high-risk atherosclerotic alteration in human carotid arteries. Circulation 2000, 102, 766–770. [Google Scholar] [CrossRef]
  19. Parker, K. Scattering and reflection identification in H-scan images. Phys. Med. Biol. 2016, 61, L20–L28. [Google Scholar] [CrossRef]
  20. Parker, K. The H-scan format for classification of ultrasound scattering. OMICS J. Radiol. 2016, 5, 1000236. [Google Scholar]
  21. Khairalseed, M.; Xiong, F.; Kim, J.-W.; Mattrey, R.F.; Parker, K.J.; Hoyt, K. Spatial angular compounding technique for H-scan ultrasound imaging. Ultrasound Med. Biol. 2018, 44, 267–277. [Google Scholar] [CrossRef] [PubMed] [Green Version]
  22. Ouyang, Y.; Tsui, P.-H.; Wu, S.; Wu, W.; Zhou, Z. Classification of Benign and Malignant Breast Tumors Using H-Scan Ultrasound Imaging. Diagnostics 2019, 9, 182. [Google Scholar] [CrossRef] [PubMed] [Green Version]
  23. Khairalseed, M.; Xiong, F.; Mattrey, R.; Parker, K.; Hoyt, K. Detection of early tumor response to Abraxane using H-scan imaging: Preliminary results in a small animal model of breast cancer. In Proceedings of the 2017 IEEE International Ultrasonics Symposium (IUS), Washington, DC, USA, 6–9 September 2017; pp. 1–4. [Google Scholar]
  24. Khairalseed, M.; Javed, K.; Jashkaran, G.; Kim, J.W.; Parker, K.J.; Hoyt, K. Monitoring Early Breast Cancer Response to Neoadjuvant Therapy Using H-Scan Ultrasound Imaging: Preliminary Preclinical Results. J. Ultrasound Med. 2019, 38, 1259–1268. [Google Scholar] [CrossRef] [PubMed]
  25. Gary, R.G.; Laimes, R.; Pinto, J.; Guerrero, J.; Chavez, H.; Salazar, C.; Lavarello, R.J.; Parker, K.J. H-scan analysis of thyroid lesions. J. Med. Imaging 2018, 5, 013505. [Google Scholar]
  26. Cobbold, R.S. Foundations of Biomedical Ultrasound; Oxford University Press: Oxford, UK, 2006. [Google Scholar]
  27. Morse, P.M.; Ingard, K.U. Theoretical Acoustics; Princeton University Press: Princeton, NJ, USA, 1986. [Google Scholar]
  28. Huang, R.; Schmerr, L.; Sedov, A. Improving the Born approximation for the scattering of ultrasound in elastic solids. Ultrasonics 2006, 44, e981–e984. [Google Scholar] [CrossRef]
  29. Ruo, F. Ultrasonic Investigation of Blood. Acta Acust. 1989, 6, 170–177. [Google Scholar]
  30. Angelsen, B.A. Instantaneous frequency, mean frequency, and variance of mean frequency estimators for ultrasonic blood velocity Doppler signals. IEEE Trans. Biomed. Eng. 1981, 11, 733–741. [Google Scholar] [CrossRef]
  31. Shung, K.K.; Kuo, I.; Cloutier, G. Ultrasonic scattering properties of blood. In Intravascular Ultrasound; Springer: Berlin/Heidelberg, Germany, 1993; pp. 119–139. [Google Scholar]
  32. Montaldo, G.; Tanter, M.; Bercoff, J.; Benech, N.; Fink, M. Coherent plane-wave compounding for very high frame rate ultrasonography and transient elastography. IEEE Trans. Ultrason. Ferroelectr. Freq. Control 2009, 56, 489–506. [Google Scholar] [CrossRef]
  33. Tai, H.; Khairalseed, M.; Hoyt, K. Adaptive attenuation correction during H-scan ultrasound imaging using K-means clustering. Ultrasonics 2020, 102, 105987. [Google Scholar] [CrossRef]
Figure 1. Schematic description of the H-Doppler, including scattering and reflection identification with H-scan, and power Doppler imaging with spatiotemporal singular value decomposition clutter filtering. By applying the compounding plane waves (CPW) beamforming to the 2nd order Gaussian-weighted Hermite polynomials [ G H 2 ( t ) ] and the 8th Gaussian-weighted Hermite polynomials [ G H 8 ( t ) ] convolution filter output, ultrasound signals containing large layer scatterers are input into the R channel and the Rayleigh scattering signals contributed by blood flow are input into the B channel to obtain the H-scan image of the biological tissue. Doppler blood flow imaging was then performed with the multi-channel signals of the H-scan with the spatiotemporal singular value decomposition clutter filtering. The background noise corresponding to the R channel was removed by the B channel Doppler signals to obtain high-quality blood flow imaging results. SVD: singular value decomposition.
Applsci 10 07604 g001
Figure 2. Spectral content estimation of all singular vectors. To determine the low-order singular value cutoff threshold, a tissue motion frequency threshold needs to be set manually (i.e., 19 Hz). Then, the singular vector Doppler frequency curve is utilized to search for the corresponding horizontal coordinate (singular vector orders) as the low-order singular cutoff value for differentiation of the tissue and blood signals (i.e., 26, in this case).
Applsci 10 07604 g002
Figure 3. (a) Schematic diagram of the block-wise local (BWL)-SVD filtering approach. The size and overlap of each block are 128 × 24 and 120 × 24, respectively, and the overlap percentage is 78.125%. (b) Schematic diagram of the H-Doppler flow imaging with BWL-SVD filtering. The local SVD clutter filtering is separately applied to R and B channel dataset in block k. Then, the clutter-filtered results are performed with a subtraction operation to obtain the final H-Doppler image of block k.
Applsci 10 07604 g003
Figure 4. (a) A 15-MHz Gaussian window weighted sinusoidal transmitted signal (similar to GH4 kernel) generated by the Vantage arbitrary waveform generator toolbox. (b) Theoretical waveform of the GH4 kernel (upper image) and the transmitted waveform (lower image) received by the hydrophone in our experiments. The center frequency of the transmitted signal is about 14.9 MHz.
Applsci 10 07604 g004
Figure 5. (a) Power Doppler image of the in vivo rabbit brain using the proposed H-doppler. (b) A zoomed image of the brain blood flow signal. The white dashed region indicates the data processing Region of Interest (ROI) for the contrast-to-noise-ratio (CNR) evaluation, with the vessels manually selected and indicated by white lines and the rest of the signal within the white dashed ROI regarded as the background clutter signal. The green dashed box indicates the background noise ROI.
Applsci 10 07604 g005
Figure 6. B-mode image (upper image) and H-scan ultrasound image (lower image) of the flow phantom at a blood concentration of 50%. The color blue in the H-scan image is contributed by relatively small scatterers, and the red represents the opposite.
Applsci 10 07604 g006
Figure 7. The images of the envelopes of the normalized R-channel data (GH2 convolution outputs for large layer scattering), B-channel data (GH8 convolution outputs for Rayleigh scattering) and G-channel data [original Radio Frequency (RF) data]. The vascular graft is highlighted by the white dashed lines, and a 1.5-mm × 1.5-mm ROI (yellow dashed square) is selected to evaluate the signal strength of R channel and B channel.
Applsci 10 07604 g007
Figure 8. Bar plots of the R- and B-channel mean intensities of the bovine blood solution in ROI with concentrations ranging from 0% to 100%. Error bars are plotted from standard deviation of signal intensities of bovine blood solution in ROI.
Applsci 10 07604 g008
Figure 9. Correlation analysis results of the spatiotemporal characteristics of R-channel data (a), G-channel data (c) and B-channel data (e). Comparison results of power Doppler image of the R-channel (b), G-channel (d) and B-channel (f), with the same low-order singular value cutoff threshold of 22. Both (b), (d) and (f) are displayed under the 50-dB dynamic range.
Applsci 10 07604 g009aApplsci 10 07604 g009b
Figure 10. (a) Example of in vivo experiment on rabbit brain blood flow imaging. (b) B-mode image of the Field of View (FOV) with a dynamic range of 60 dB. (c) Conventional ultrafast compound Doppler imaging (UCDI) results using global SVD filtering with low- and high-order singular value thresholdings (SVTs). (d) H-Doppler results using global SVD filtering with only low-order SVT. Both (c) and (d) are displayed under a 50-dB dynamic range for comparison purposes.
Applsci 10 07604 g010
Figure 11. Comparison results of BWL-SVD filtering for conventional UCDI (left column) and H-Doppler (right column) under a 40-dB dynamic range; the block parameters used in this experiment are block size = height: 128, width: 24 and overlap = height: 120, width: 20. Zoomed images of the ROIs (white dashed rectangle and yellow dashed square) are given for each approach. The green dashed region was selected as the noise area for CNR calculation. The CNRs of the conventional UCDI with BWL-SVD filtering are 20.1 dB (white) and 19.7 dB (yellow). The CNRs of the H-Doppler approach we proposed upgrade to 23.2 dB (white) and 24.7 dB (yellow). The yellow and white arrows point at the identifiable blood vessels at the same depth in both UCDI and H-Doppler images.
Applsci 10 07604 g011
Table 1. Gaussian-weighted Hermite polynomials.
Order, nGH(t)nEnergy(n)
0(1)G π / 2
1(2t)G π / 2
2(4t2 − 2)G 3 π / 2
3(8t3 − 12t)G 15 π / 2
4(16t4 − 48t2 + 12)G 105 π / 2
5(32t5 − 160t3 + 120t)G 945 π / 2
Table 2. Summary of contrast-to-noise-ratio (CNR) measurements between ultrafast compound Doppler imaging (UCDI) and H-Doppler imaging. SVT: singular value thresholding and BWL-SVD: block-wise local-singular value decomposition.
Global SVD FilteringBWL-SVD Filtering
UCDIH-DopplerUCDIH-Doppler
Low-order SVT222222–3122–31
High-order SVT232/232–264/
CNR (white)15.5 dB19.6 dB20.1 dB23.2 dB
CNR (yellow)10.1 dB16.7 dB19.7 dB24.7 dB
Publisher’s Note: MDPI stays neutral with regard to jurisdictional claims in published maps and institutional affiliations.