Article

Hydrothermal Synthesis of ZnO–doped Ceria Nanorods: Effect of ZnO Content on the Redox Properties and the CO Oxidation Performance

1
Industrial, Energy and Environmental Systems Lab (IEESL), School of Production Engineering and Management, Technical University of Crete, GR-73100 Chania, Crete, Greece
2
Institute of Electronic Structure and Laser, Foundation for Research and Technology-Hellas (FORTH–IESL), P.O. Box 1527, Vasilika Vouton, GR-71110 Heraklion, Greece
3
Laboratory of Chemistry and Materials Technology, General (Core) Department, National and Kapodistrian University of Athens, GR-34400 Psachna Campus, Evia, Greece
*
Authors to whom correspondence should be addressed.
Appl. Sci. 2020, 10(21), 7605; https://doi.org/10.3390/app10217605
Submission received: 30 September 2020 / Revised: 25 October 2020 / Accepted: 26 October 2020 / Published: 28 October 2020

Abstract

:
The rational design of highly efficient, noble metal-free metal oxides is one of the main research priorities in the area of catalysis. To this end, the fine tuning of ceria-based mixed oxides by means of aliovalent metal doping has currently received particular attention due to the peculiar metal-ceria synergistic interactions. Herein, we report on the synthesis, characterization and catalytic evaluation of ZnO–doped ceria nanorods (NR). In particular, a series of bare CeO2 and ZnO oxides along with CeO2/ZnO mixed oxides of different Zn/Ce atomic ratios (0.2, 0.4, 0.6) were prepared by the hydrothermal method. All prepared samples were characterized by X-ray diffraction (XRD), N2 physisorption, temperature-programmed reduction (TPR), scanning electron microscopy with energy dispersive X-ray spectroscopy (SEM-EDS) and transmission electron microscopy (TEM). The CO oxidation reaction was employed as a probe reaction to gain insight into structure-property relationships. The results clearly showed the superiority of mixed oxides as compared to bare ones, which could be ascribed to a synergistic ZnO–CeO2 interaction towards an improved reducibility and oxygen mobility. A close correlation between the catalytic activity and oxygen storage capacity (OSC) was disclosed. Comparison with relevant literature studies verifies the role of OSC as a key activity descriptor for reactions following a redox-type mechanism.

Graphical Abstract

1. Introduction

Cerium oxide or ceria (CeO2) is considered one of the most promising metal oxides for numerous catalytic applications, such as catalytic oxidation of CO [1,2,3], NO reduction [4,5,6], water–gas shift reaction [7,8,9,10], reforming reactions [11,12] and soot combustion [13,14,15]. In particular, CeO2 has attracted extensive interest due to its abundant oxygen vacancies, interchangeability between Ce3+ and Ce4+ oxidation states and high oxygen storage capacity (OSC) [16,17,18]. During the past few decades, nanotechnology has made remarkable progress toward the development of ceria nanocomposites with distinct physical and chemical properties, greatly expanding their potential applications in energy and environmental catalysis [19,20]. In this perspective, we recently showed that among ceria nanocomposites of different shape, ceria nanorods possess enhanced reducibility that is linked to their high population in intrinsic defects and oxygen vacancies. The latter is considered responsible for their superior CO oxidation performance [21].
More importantly, ceria-based mixed oxides have recently gained increasing attention in the fields of materials science and heterogeneous catalysis, due to their unique surface, structural and electronic properties, which are completely different to those of parent counterparts. The combination of various transition metals with CeO2 nanoparticles leads to enhanced surface and redox properties due to the “synergistic” interactions between the oxide phases. Accordingly, various CeO2–based transition metals (M/CeO2, M = Mn, Fe, Co, Ni, Cu) have been widely employed in heterogeneous catalysis [22,23].
Among the different transition metal oxides, zinc oxide (ZnO) is a wide and direct band gap semiconductor, which has been used in many fields, due to its low cost and environmental sustainability [24,25,26]. Zinc is not a critical raw material, thus no direct impact on the environmental resources is considered. Moreover, it is abundant in the steel industry as one of the main recovered products in the metal scrap recycling process [27]. In view of this fact, the potential of a low-cost metal, able to further enhance the catalytic performance of CeO2, is of particular importance both from an environmental and economic point of view.
Although CeO2–ZnO composites have been extensively used in photocatalysis [28,29,30,31,32], only a few studies have been devoted to their catalytic applications. Xie et al. [33] reported on the enhanced CO oxidation activity of CeO2–ZnO composites, which is ascribed to the synergistic interaction between ZnO hollow microspheres and commercial CeO2 powders. In a similar manner, the synergistic interaction between ZnO and CeO2 is considered responsible for the enhanced CO oxidation performance of three-dimensional ordered macroporous CeO2–ZnO [34].
In light of the above aspects, the present work aims for a first time at investigating the impact of ZnO as modifier for ceria nanorods (NR), in an attempt to further adjusting their surface/redox properties. To this end, a series of pure CeO2 and ZnO along with CeO2/ZnO mixed oxides of different Zn:Ce atomic ratios (0.2, 0.4, 0.6) were prepared by the hydrothermal method. The as-prepared materials were thoroughly characterized by X-ray diffraction (XRD), N2 adsorption at −196 °C (Brunauer–Emmett–Teller (BET) method), scanning electron microscopy-energy dispersive X-ray spectroscopy (SEM–EDS), transmission electron microscopy (TEM) and H2 temperature-programmed reduction (H2–TPR). The oxidation of CO was used as a probe reaction to disclose structure-activity relationships.

2. Materials and Methods

2.1. Materials Synthesis

All of the chemicals used in this work were of analytical reagent grade. Ce(NO3)3·6H2O (purity ≥99.0%, Fluka, Bucharest, Romania), Zn(CH3COO)2·2H2O (purity ≥99%, Sigma-Aldrich, St. Louis, MO, USA) were used as precursors for the preparation of ceria-zinc materials. HO2CCO2H (purity ≥99%, Sigma-Aldrich, St. Louis, MO, USA), NaOH (purity ≥98%, Honeywell Fluka, Seelze, Germany) and absolute ethanol (purity 99.8%, ACROS Organics, Geel, Belgium) were also employed during the synthesis procedure.
Bare ceria nanorods were initially prepared by the hydrothermal method, as described in detail in our previous work [21]. CeO2/ZnO mixed oxides of different Zn:Ce ratios (0.2, 0.4, 0.6) were prepared by a modified hydrothermal method. In particular, 0.38 g HO2CCO2H, 0.64 g Zn(CH3COO)2·2H2O and a certain quantity of CeO2 nanorods (2.42, 1.21, 0.81 g for Zn/Ce = 0.2, 0.4 and 0.6, respectively), were dispersed in 40 mL of double deionized water under stirring for 20 min. Then, the suspension obtained was transferred to a plastic bottle and aged at 70 °C for 1 h. The precipitate was recovered by centrifugation, washed with double deionized water and ethanol, dried at room temperature overnight, and calcined at 500 °C for 2 h under air flow (heating ramp 5 °C/min). For comparison purposes, a pure zinc oxide sample was also prepared by the same method. The as-prepared materials are denoted as CeO2/ZnO–x, where x refers to Zn:Ce atomic ratio.
For comparison purposes, a mechanical mixture (CeO2+ZnO–0.4) was synthesized in agate by hand, by physically mixing ceria nanorods and ZnO, with the same composition as the CeO2/ZnO–0.4 sample.

2.2. Materials Characterization

The textural characteristics of the investigated samples were assessed by N2 adsorption-desorption isotherms at −196 °C (Nova 2200e Quantachrome flow apparatus, Boynton Beach, FL, USA). The structural properties were determined by X-ray diffraction (XRD) in a Rigaku diffractometer (model RINT 2000, Tokyo, Japan). Morphological/surface analysis was performed by scanning electron microscopy (SEM, JEOL JSM-6390LV, JEOL Ltd., Akishima, Tokyo, Japan) operating at 20 keV, equipped with an energy dispersive X-ray spectrometry (EDS) system and transmission electron microscopy (TEM) on a JEM-2100 instrument (JEOL, Tokyo, Japan). Redox properties were determined by means of H2 temperature-programmed reduction (H2–TPR). More details about the aforementioned characterization studies and the corresponding apparatus can be found elsewhere [2,35].

2.3. Catalytic Evaluation Studies

Catalytic experiments were carried out in a fixed-bed reactor (12.95 mm i.d.) loaded with 100 mg of catalyst. Feed composition was 0.2 vol.% of CO and 1 vol.% O2 balanced with He. The total feed stream was 80 cm3 min−1, corresponding to a gas hourly space velocity (GHSV) of 40,000 h−1.
All samples were pretreated with 10 °C min−1 up to 490 °C (30 min) under 20 vol.% O2 in He. Then, the temperature was leveled off to 25 °C, followed by He purging to remove any physisorbed species. Catalytic activity measurements were carried out up to 500 °C. Both reactants and products were analyzed by gas chromatography equipped with thermal conductivity detectors (TCD) and two capillary columns (Molecular Sieve 5X and PoraPlot Q).
CO conversion (XCO) was calculated according to the equation:
X CO ( % ) = [ CO ] in [ CO ] out [ CO ] in × 100
where [CO]in and [CO]out are the CO concentrations in the inlet and outlet gas streams, respectively.
Specific reaction rates of CO consumption, in terms of the catalyst’s mass (mol g−1 s−1) or surface area (mol m−2 s−1) were estimated under differential reaction conditions (W/F = 0.075 g s cm−3, XCO < 15%, T = 200 °C):
r ( mol g · s ) = X CO × [ CO ] in × F ( cm 3 min ) 100 × 60 ( s min ) × V m ( cm 3 mol ) × m cat ( g )
r ( mol m 2 · s ) = X CO × [ CO ] in × F ( cm 3 min ) 100 × 60 ( s min ) × V m ( cm 3 mol ) × m cat ( g ) × S BET ( m 2 g )
where Vm and F are gas molar volume and total flow rate, respectively, at 298 K and 1 bar, mcat is the mass of catalyst and SBET is the surface area.

3. Results and Discussion

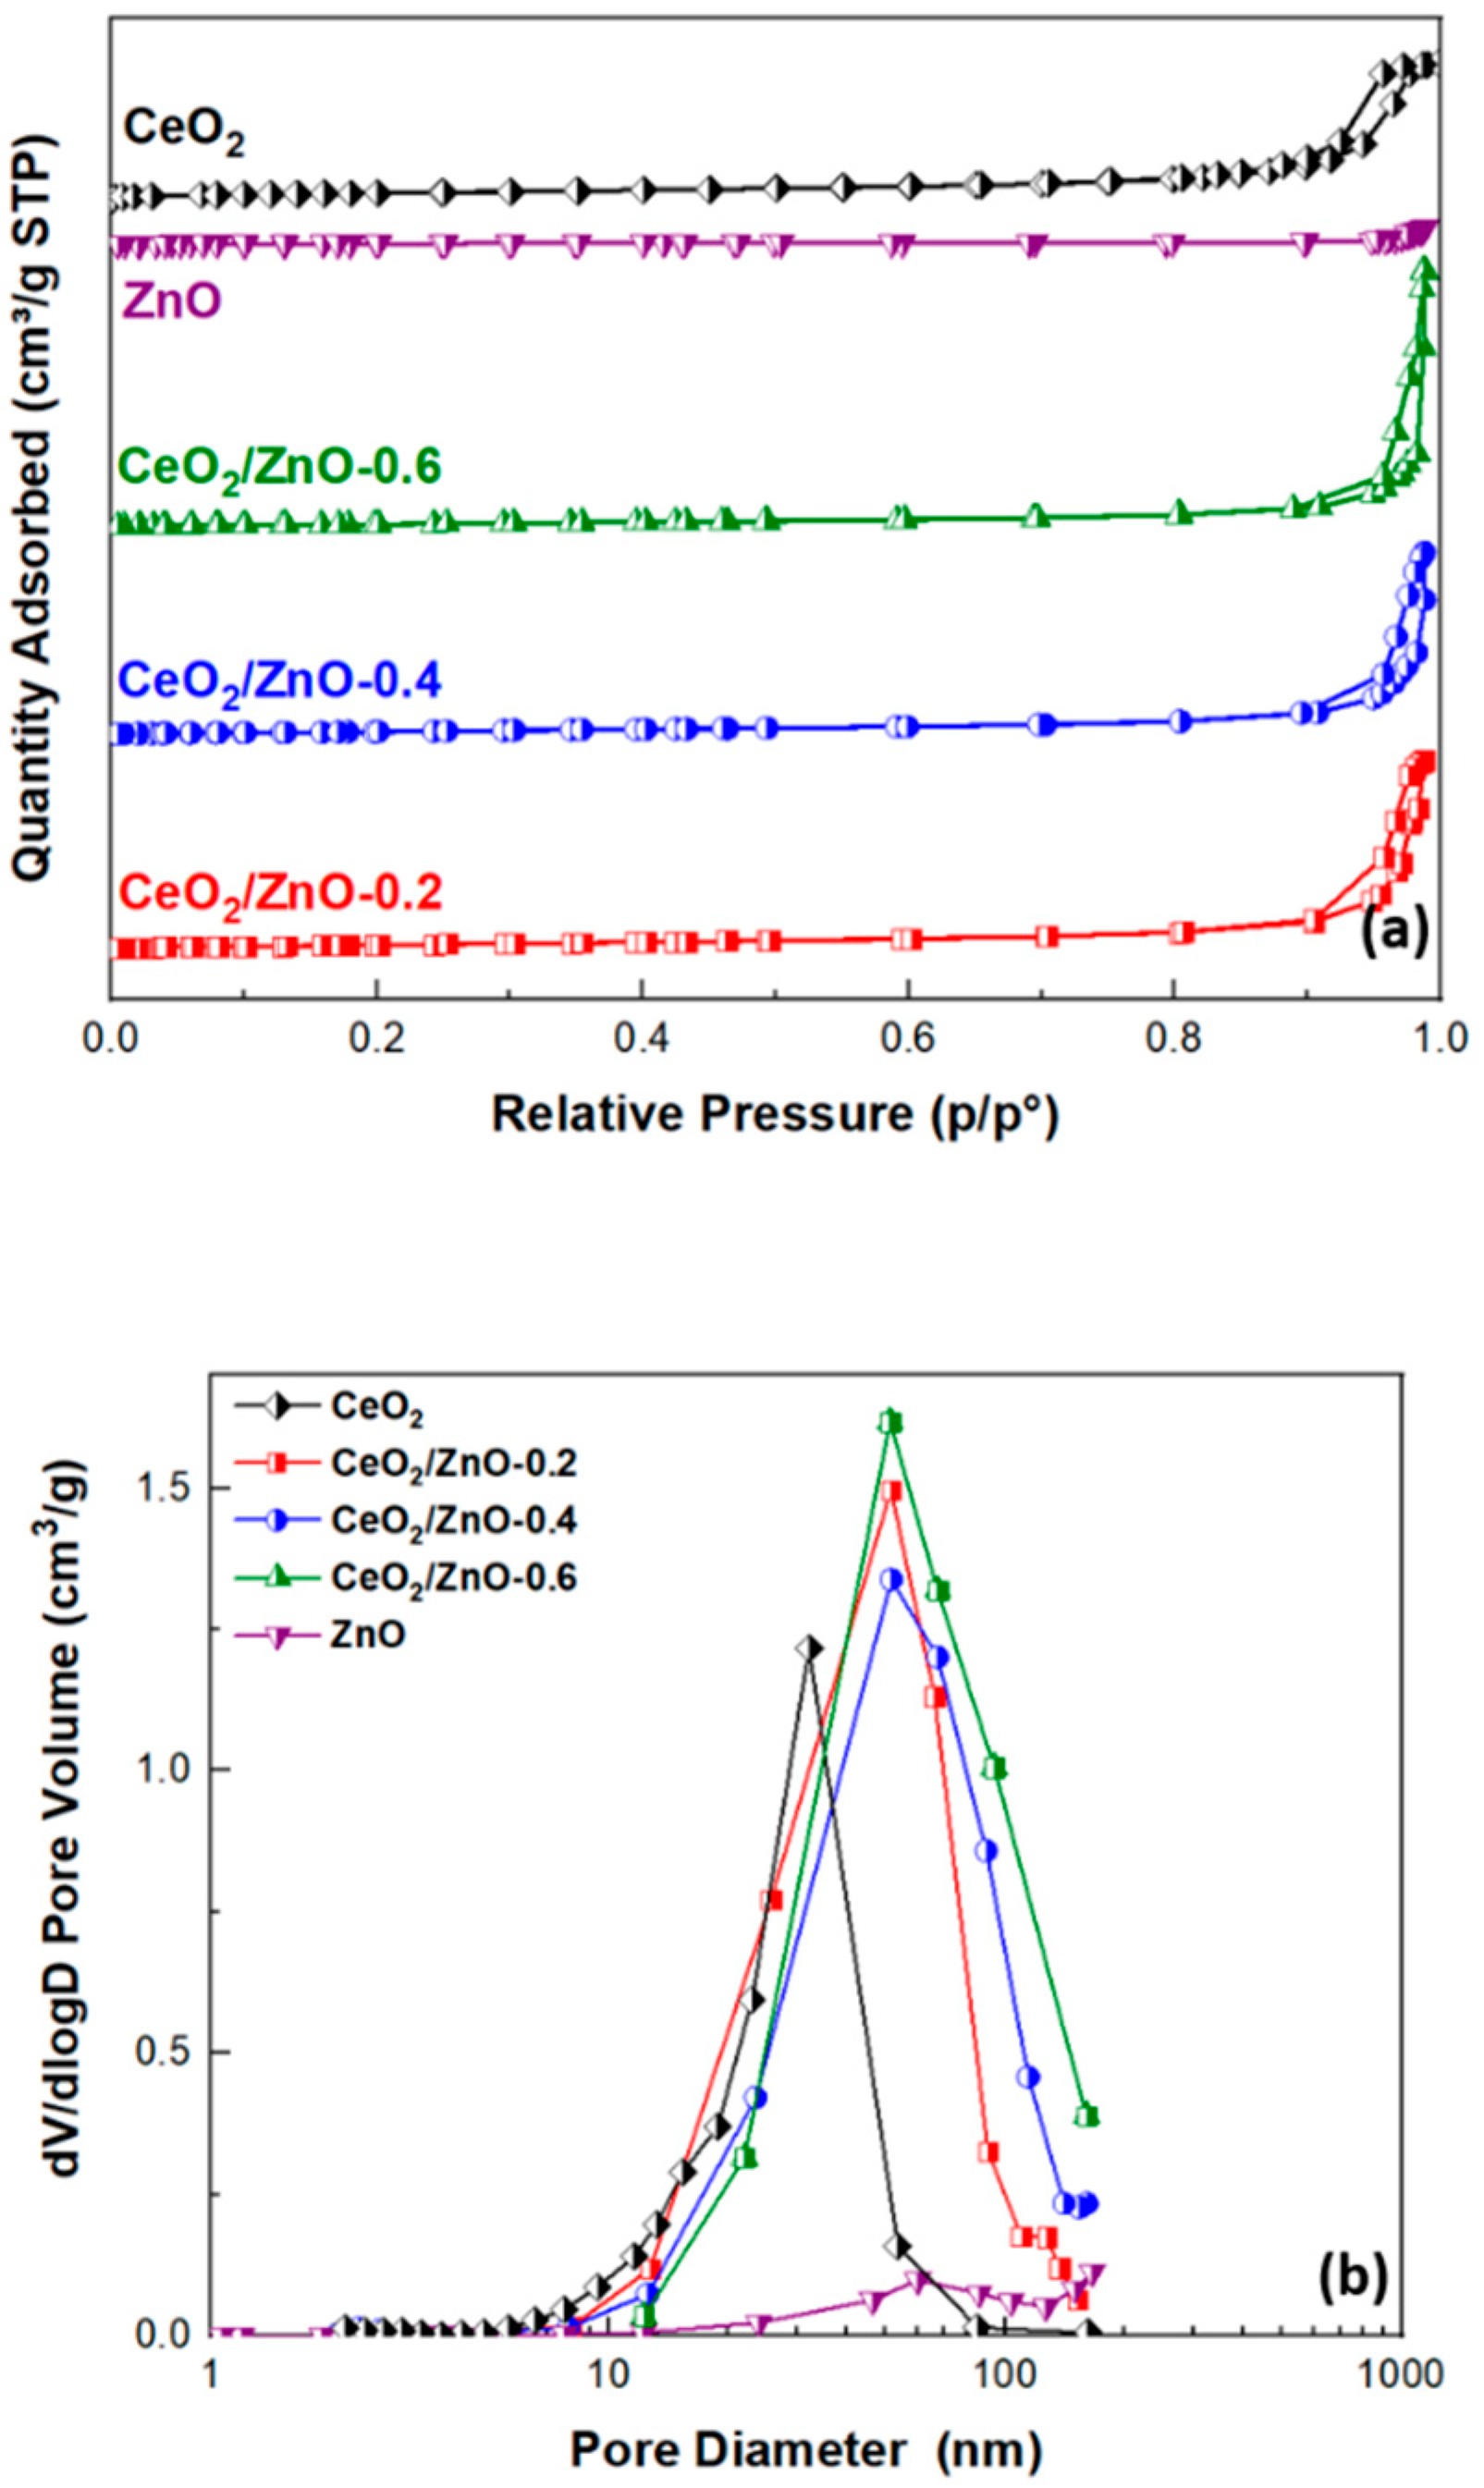
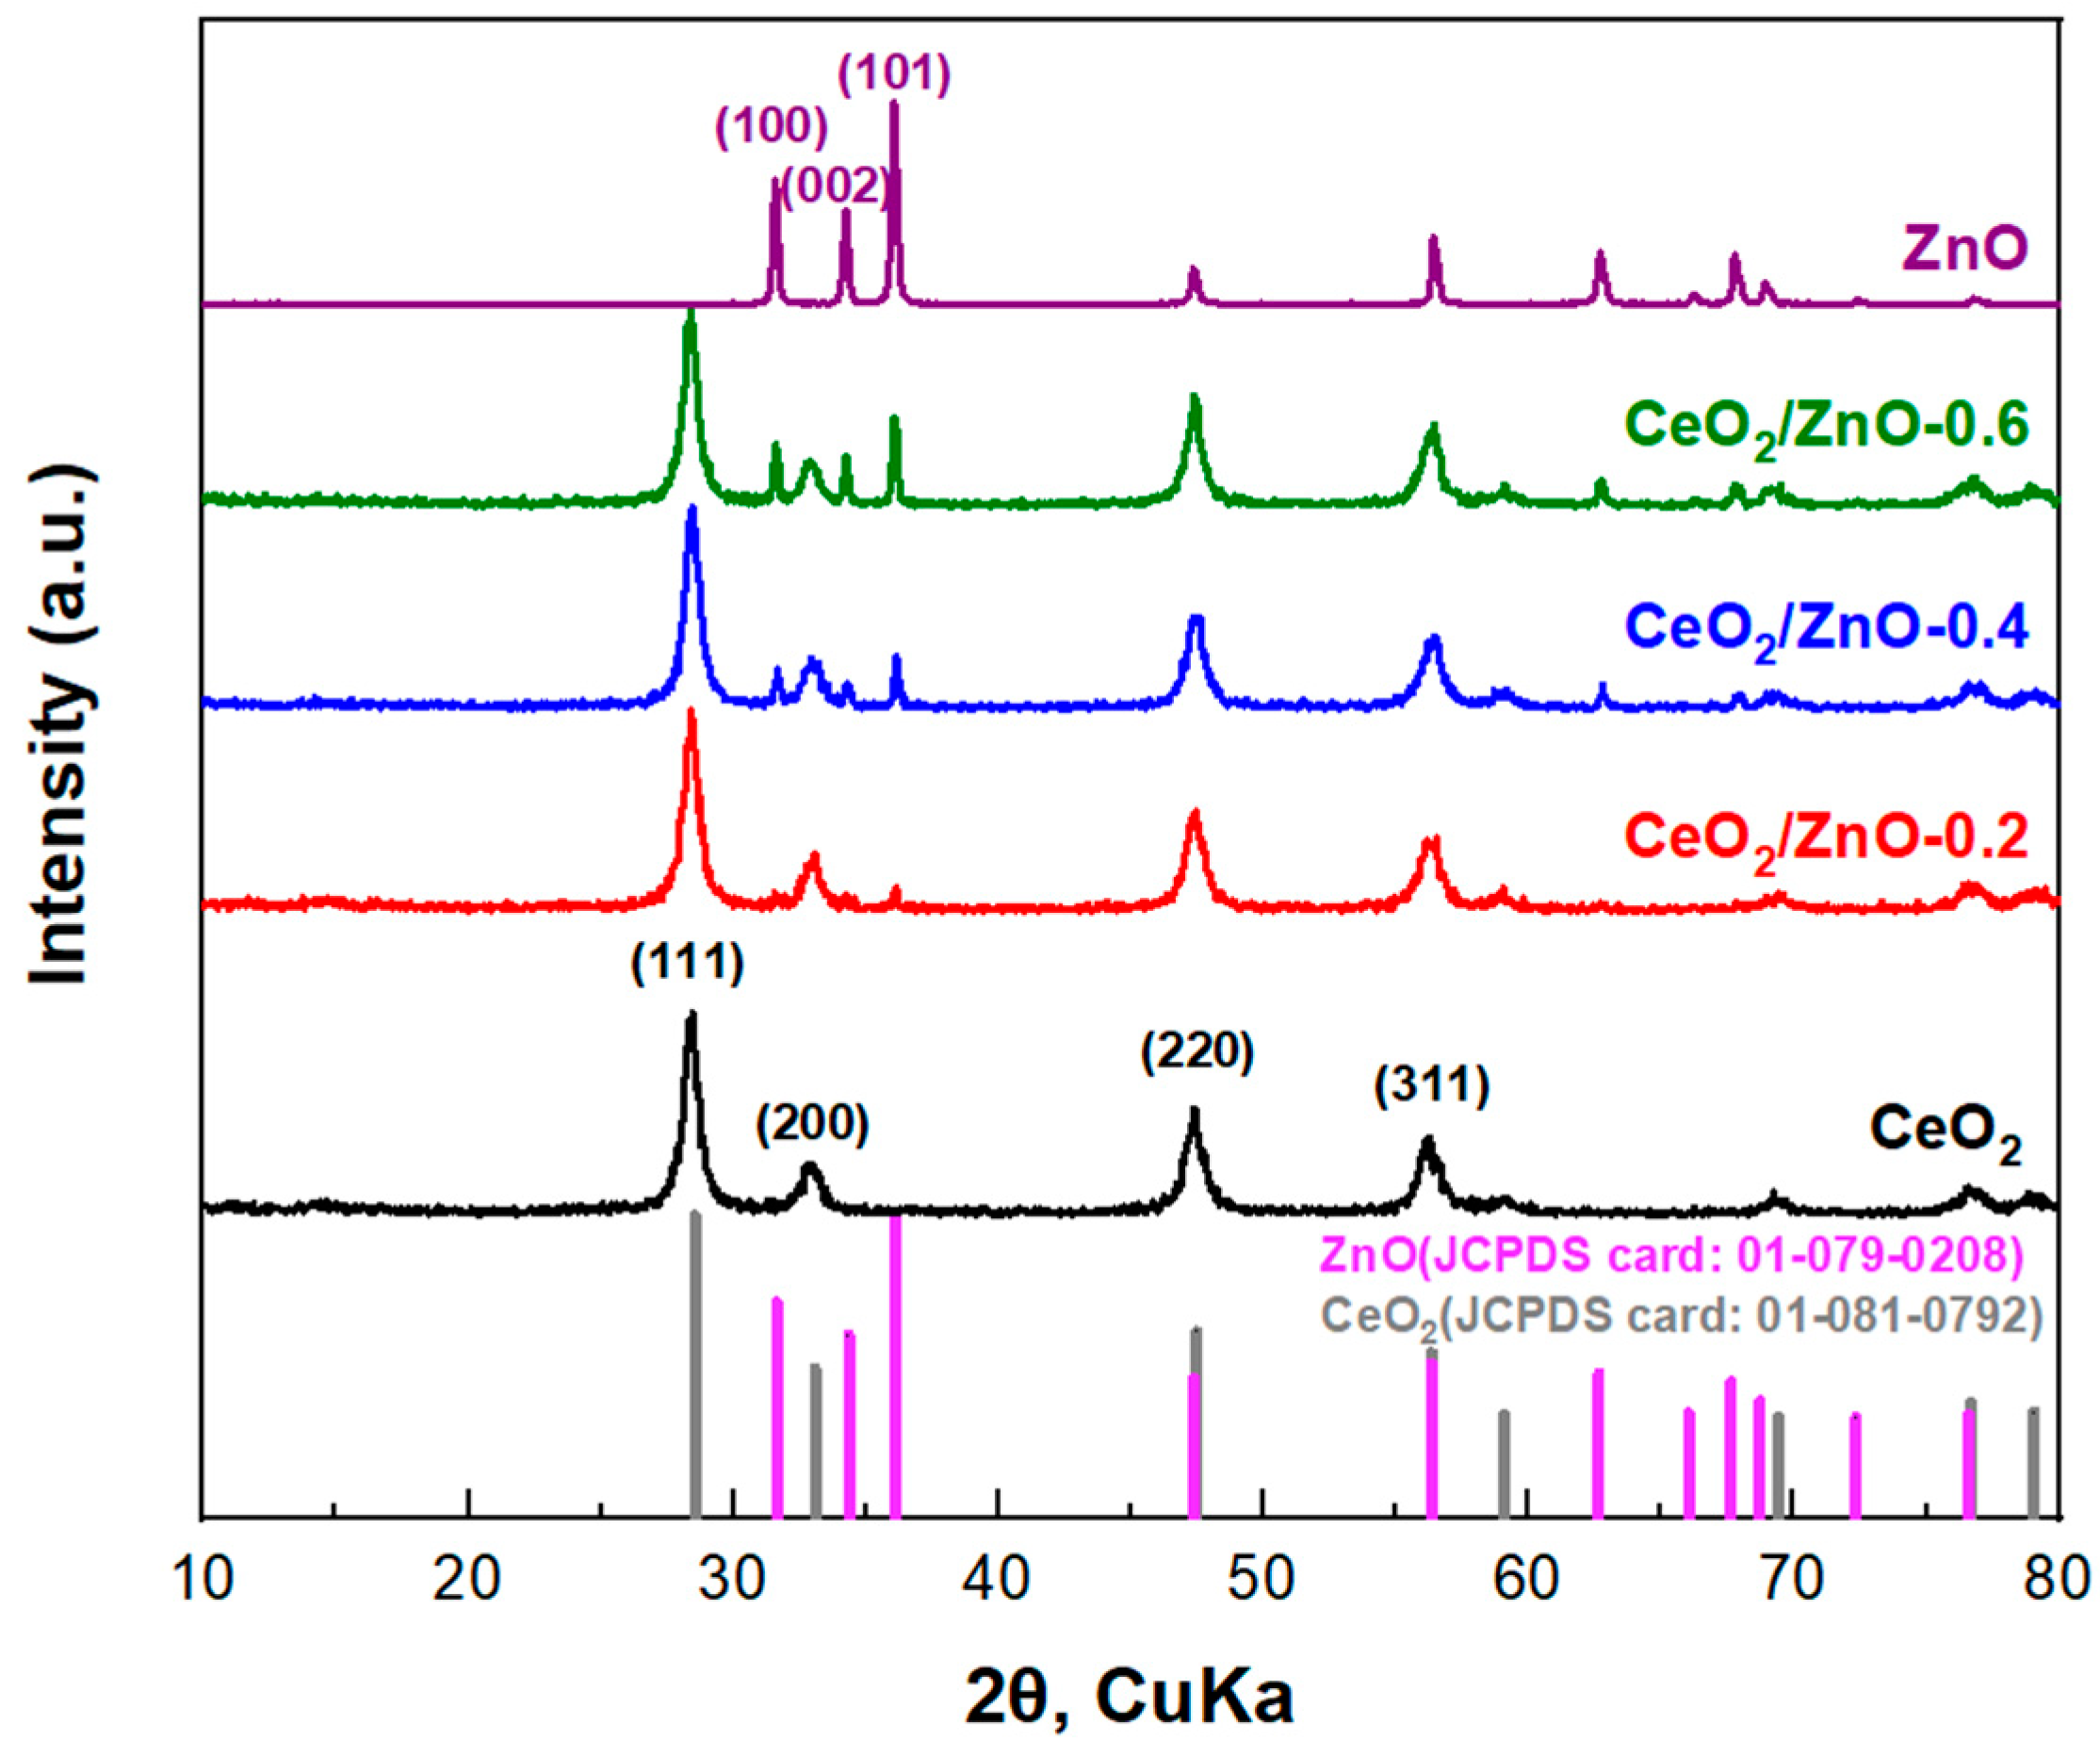
3.1. Textural and Structural Characterization

The determination of the textural properties (surface area, pore volume, pore size) of CeO2/ZnO samples was carried out by means of nitrogen adsorption-desorption (BET) analysis. The results obtained are summarized in Table 1. The lowest value in BET surface area is demonstrated by ZnO (7.05 m2/g). CeO2 nanorods exhibit the highest surface area (79.31 m2/g) followed by CeO2/ZnO–0.2 (76.22 m2/g), CeO2/ZnO–0.4 (62.21 m2/g), CeO2/ZnO–0.6 (56.12 m2/g) and ZnO (7.05 m2/g). In general, ZnO addition progressively decreases the BET surface area. This is also in agreement with the gradual increase of pore size with the increase of ZnO content, as discussed below.
The adsorption-desorption isotherms and the Barrett–Joyner–Halenda (BJH) desorption pore size distribution (PSD) of as-prepared samples are shown in Figure 1a,b, respectively. The pore size distribution in all samples is well within the mesopores region, which is further corroborated by the existence of type IV isotherms (Figure 1a). As presented in Table 1 and Figure 1b, the addition of ZnO leads to an increase in pore volume and average pore size, with the CeO2/ZnO–0.6 sample exhibiting the highest pore size (55.9 nm) followed by CeO2/ZnO–0.4 (40.6 nm), CeO2/ZnO–0.2 (34.4 nm), CeO2 (24.2 nm) and ZnO (23.0 nm).
Figure 2 depicts the XRD patterns of CeO2, ZnO and CeO2/ZnO (Zn:Ce = 0.2, 0.4, 0.6) mixed oxide phases. The main diffraction peaks for bare ceria at 2θ = 28.5°, 33.1°, 47.5° and 56.3° correspond to (111), (200), (220) and (311) planes, respectively. The diffraction peaks are attributed to ceria face-centered cubic fluorite structure (Fm3m symmetry, no. 225) (JCPDS card: 01-081-0792). Similarly, the XRD patterns of pure ZnO exhibit the typical hexagonal wurtzite structures (P63mc symmetry, no. 186) (JCPDS card: 01-079-0208). The strong peaks at 2θ = 31.7°, 34.4° and 36.2° can be attributed to (100), (002), (101) lattice planes, respectively. For the CeO2/ZnO samples, reflection planes perfectly matched to both indexed CeO2 cubic and ZnO hexagonal structures. The XRD patterns indicate the formation of mixed oxides with finely dispersed phases of parent oxides. When ZnO content is increased, the intensity of ZnO reflections at (100), (002) and (101) is also increased, while the XRD profile of CeO2 remains unaffected. The sharp diffraction peaks in the XRD patterns indicate that the synthesized catalysts are well crystallized. By applying the Scherrer equation, the average crystallite size of the as-prepared samples was calculated and the results are presented in Table 2. The lattice parameters are also included in Table 2. Bare CeO2 exhibits a crystallite size of 13.0 nm, while pure ZnO exhibits a much larger crystallite size (34.5 nm). For the CeO2/ZnO samples, ceria crystallite size displays a small decrease with the addition of ZnO, while the crystallite size of ZnO is increased. In addition, the lattice parameters of mixed oxides remain practically unaffected, as compared to the pure oxides, revealing well-dispersed phases of the different constituent oxides.

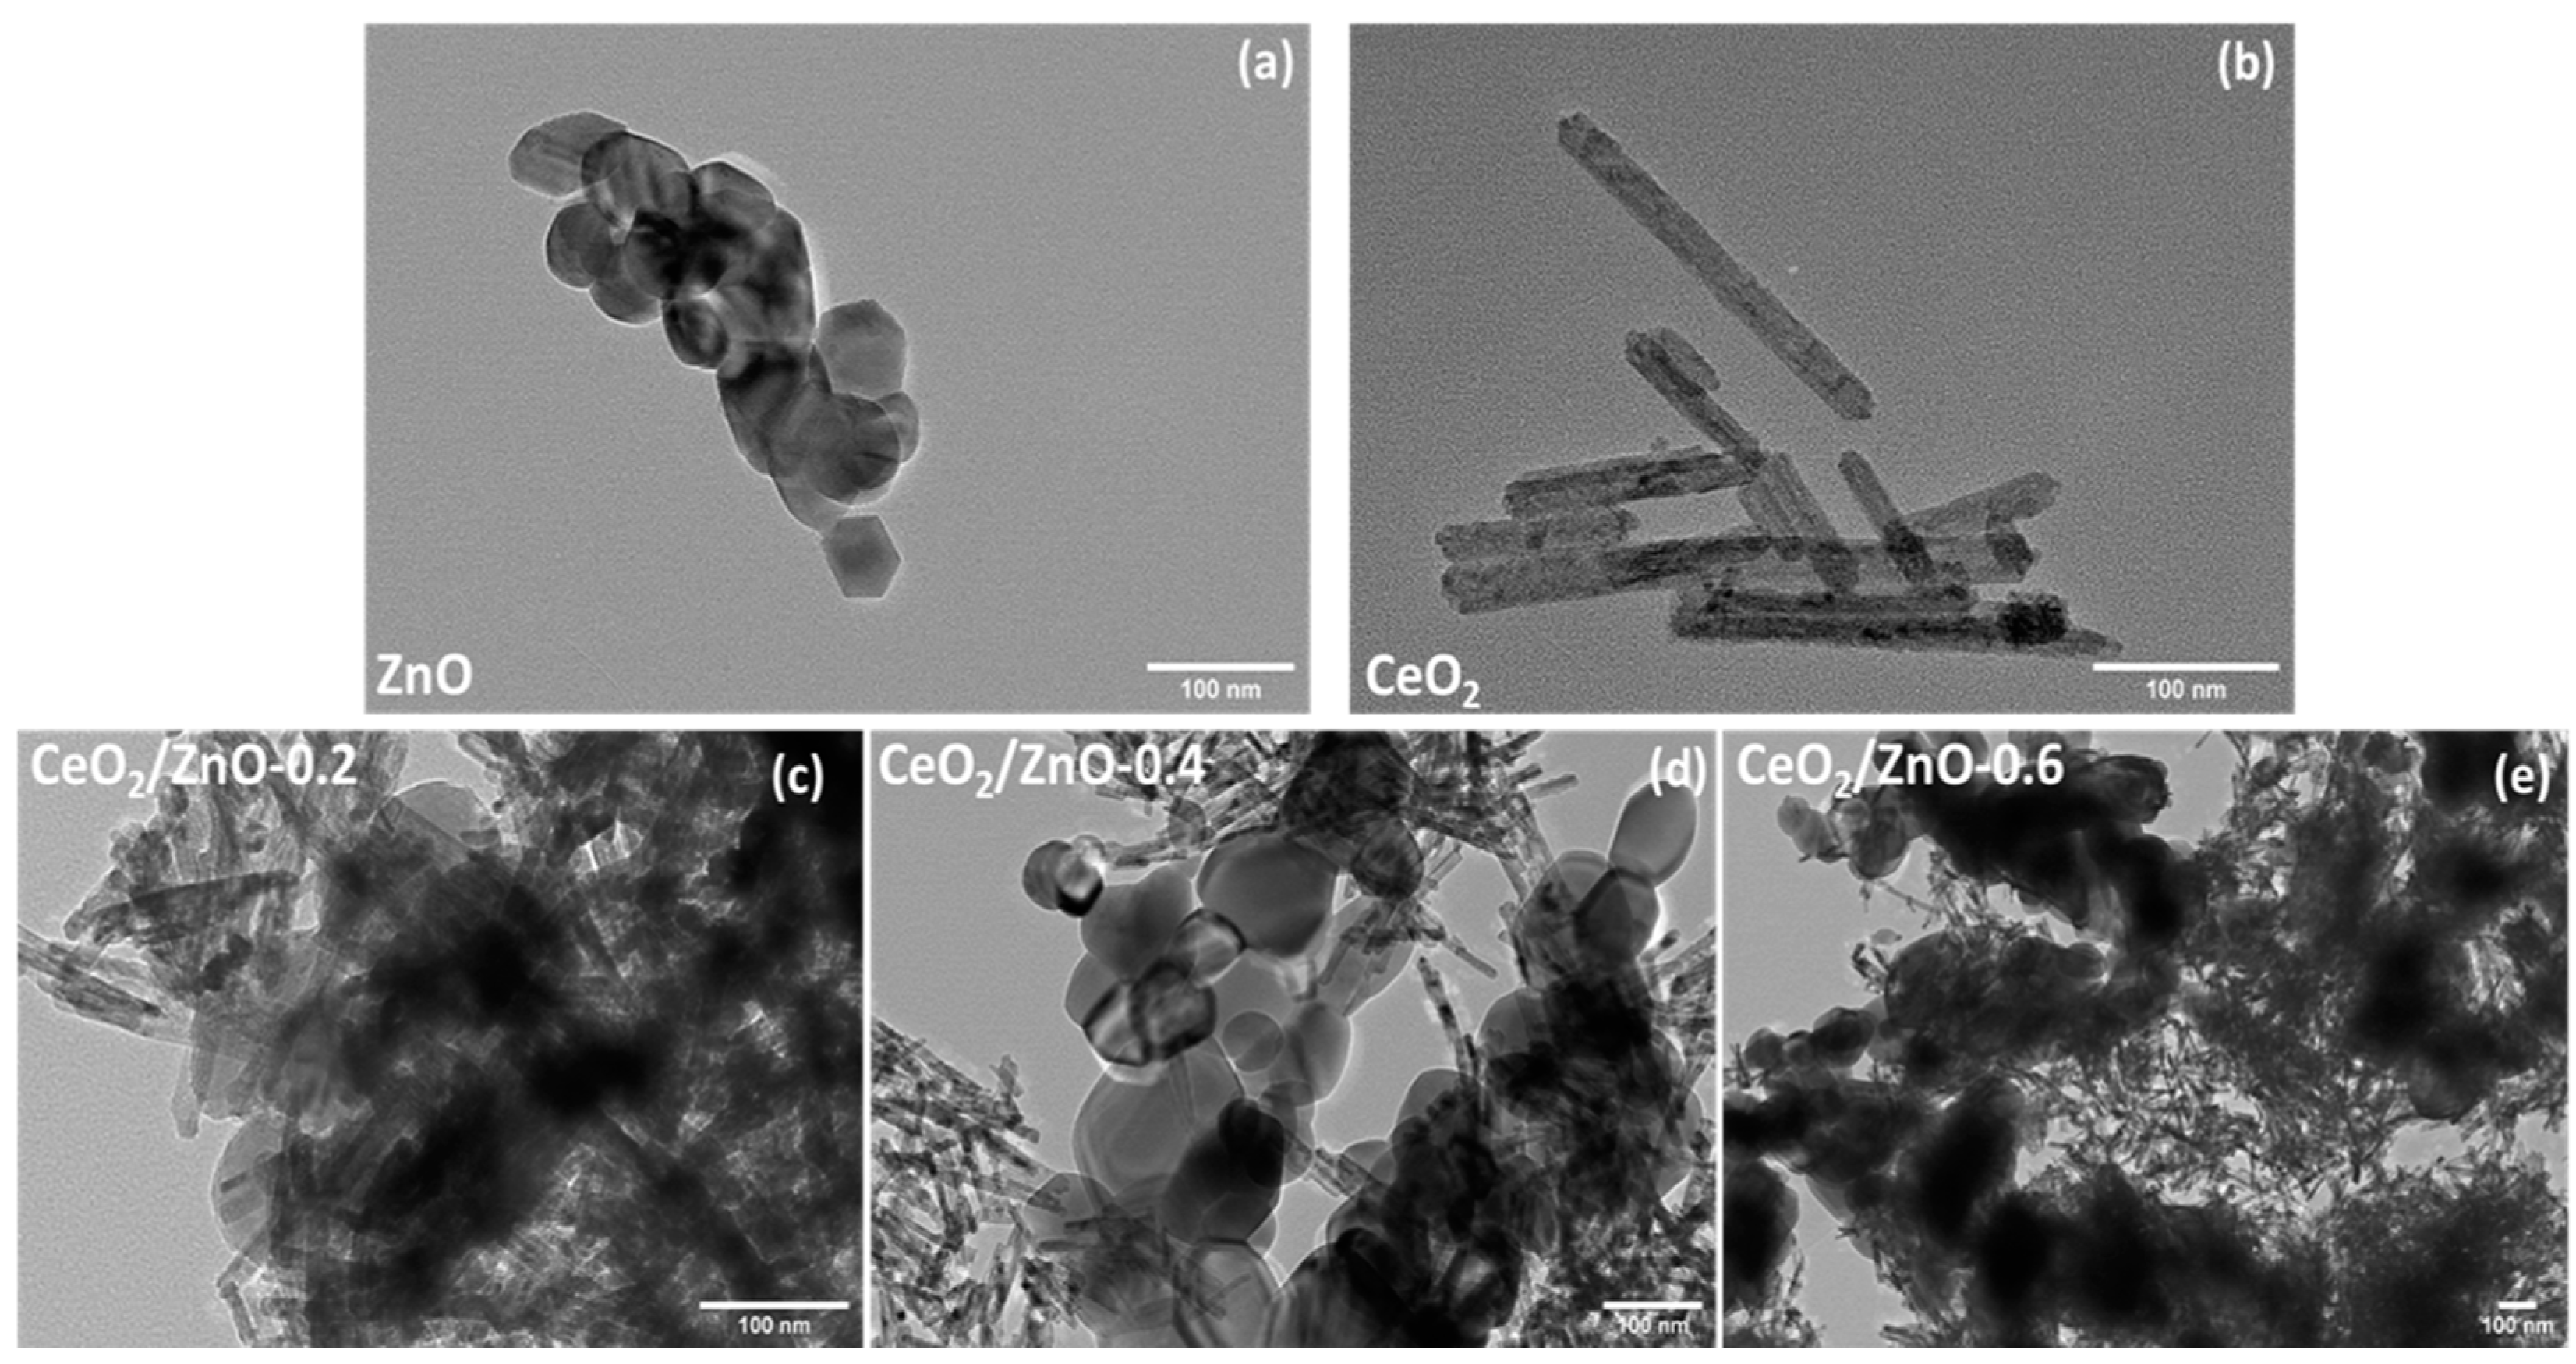
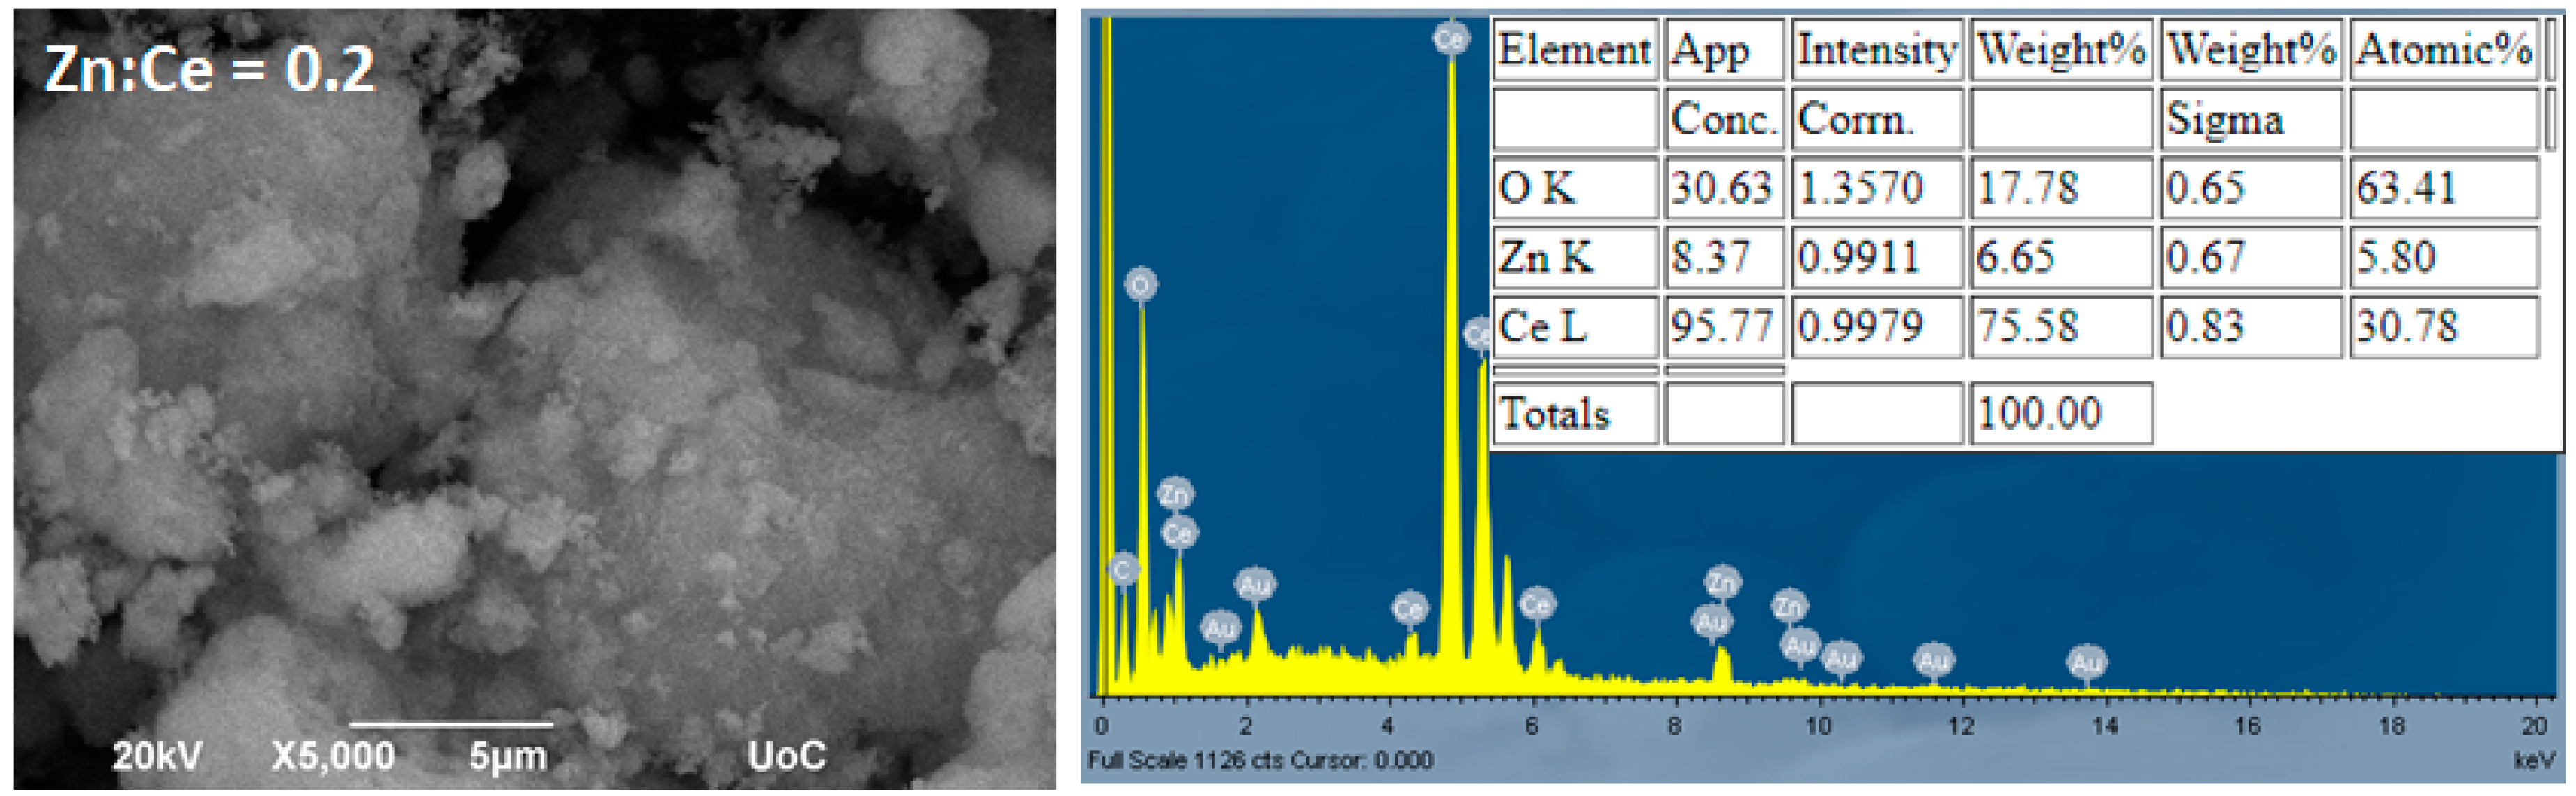
3.2. Morphological Characterization (TEM, SEM–EDS)

The morphological features of CeO2, ZnO and CeO2/ZnO mixed oxides were characterized by transmission electron microscopy analysis (TEM). Pure ZnO (Figure 3a) displays an irregular shape (50–100 nm), while bare CeO2 (Figure 3b) exhibits a distinct rod-like morphology (50–200 nm in length). In Figure 3c–e, the CeO2/ZnO mixed oxides are presented. It is evident that the mixed oxides exhibit the rod-like morphology of CeO2 nanorods, while separated ZnO particles of irregular morphology are also detected. These findings are in accordance with XRD results, implying the formation of distinct oxide phases.
Elemental analysis was indicatively carried out by scanning electron microscopy analysis along with energy dispersive X-ray spectrometry (SEM–EDS) over the CeO2/ZnO–0.2 sample. The SEM image along with the corresponding elemental analysis is shown in Figure 4. SEM–EDS analysis implies a Zn:Ce atomic ratio of ca. 0.19, being in good agreement with the nominal Zn/Ce ratio. The latter implies a uniform distribution of CeO2 and ZnO phases on the entire material.

3.3. Redox Properties (H2–TPR)

By means of H2–TPR experiments, the quality and quantity of the active oxygen sites of the catalysts can be determined. Such information is important for reactions following a redox-type mechanism, such as CO oxidation. Figure 5 shows the reduction profiles of bare and mixed oxides in the temperature range of 100–800 °C. The CeO2 sample shows a peak at 500–700 °C (peak C), which is ascribed to the loosely bound surface species, contrary to bulk oxygen, which is reduced at temperatures higher than 700 °C [1,36,37,38]. For the pure ZnO sample, two broad peaks are found located at 150–300 °C (peak A) and 410–530 °C (peak B) regions, which can be attributed to the reduction of the hydroxyl species related to ZnO and the surface oxygen reduction from ZnO, respectively [39]. Additionally, in the pristine ZnO, the Zn2+ reduction to Zn0 has been reported at 465 °C [40]. The TPR profiles of CeO2/ZnO samples consist of the distinct peaks of both CeO2 and ZnO phases. It is worth noticing that ZnO addition to CeO2 does not lead to a shift of TPR peaks, as recently found for CeO2/TiO2 [35] and Fe2O3/CeO2 [2] mixed oxides. This implies the structurally independent nature of ZnO and CeO2 in the mixed oxides. The latter is in agreement with XRD and TEM results showing distinct ZnO nanoparticles in the vicinity of CeO2 nanorods without incorporation of Zn in the nanostructure of CeO2 nanorods.
To gain greater insight into the influence of ZnO on the reducibility of CeO2/ZnO oxides, the H2 uptake in the temperature range of 50–700 °C was estimated by the quantification of the TPR peaks (Table 3). Interestingly, ZnO addition results in an increase of H2 uptake in the CeO2/ZnO samples, implying a facilitation of surface oxygen species detachment. It is also of worth noticing the increase of H2 uptake related to ceria reduction (peak C), despite the progressive decrease of ceria content. The latter denotes the facile reduction of ceria capping oxygen upon the increase of ZnO content. In particular, all mixed oxides exhibit a total H2 consumption of ca. 1.0 mmol H2/g, as compared to 0.59 and 0.31 mmol H2/g of bare CeO2 and ZnO, respectively. In terms of oxygen storage capacity (OSC), the following trend is obtained: CeO2/ZnO–0.6 (0.52 mmol O2/g) > CeO2/ZnO–0.4 (0.50 mmol O2/g) > CeO2/ZnO–0.2 (0.48 mmol O2/g) > CeO2 (0.29 mmol O2/g) > ZnO (0.15 mmol O2/g). This order coincides relatively well with the catalytic activity (see below), revealing the key role of reducibility. The abundance of reducible oxygen species is expected to affect the oxygen mobility and in turn the CO oxidation process, as will be further discussed below.

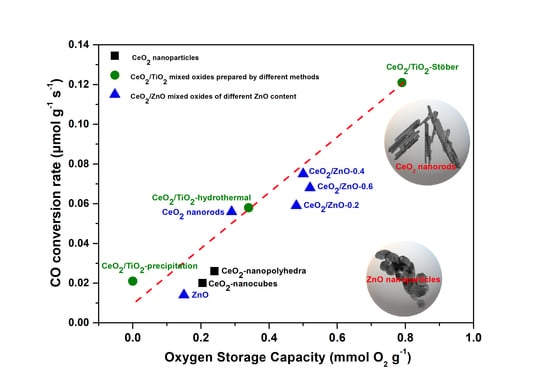
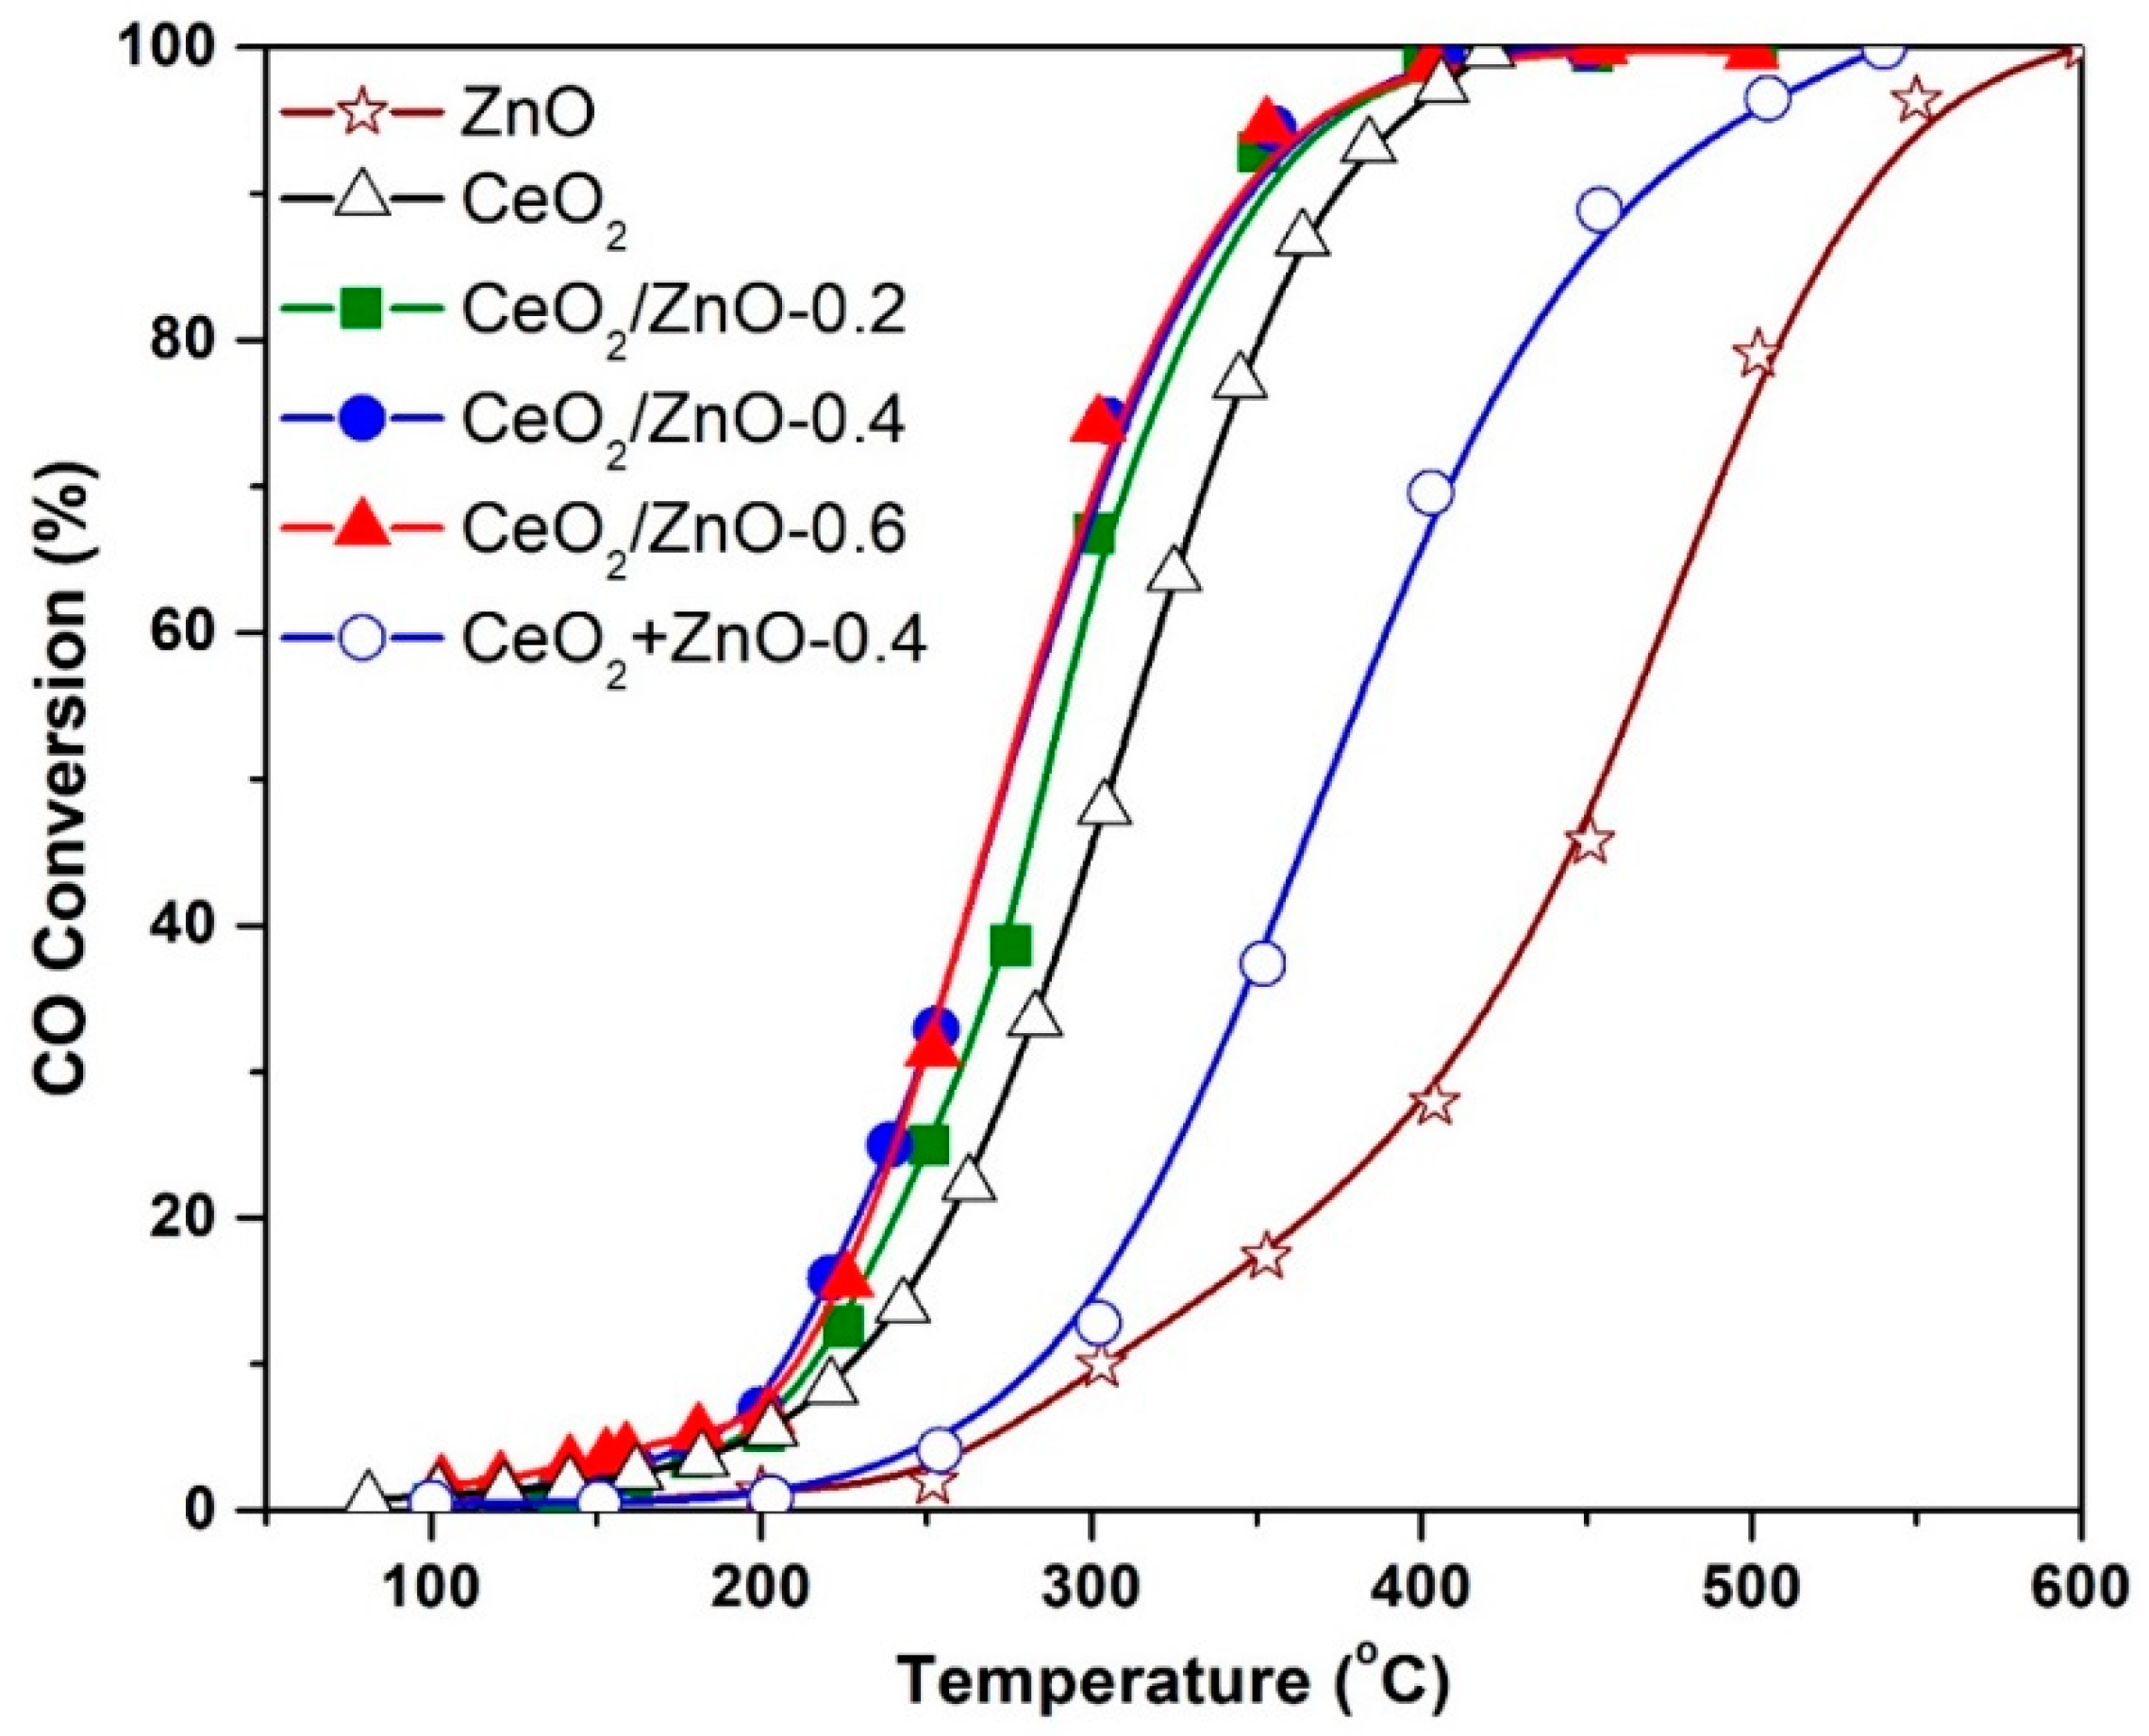
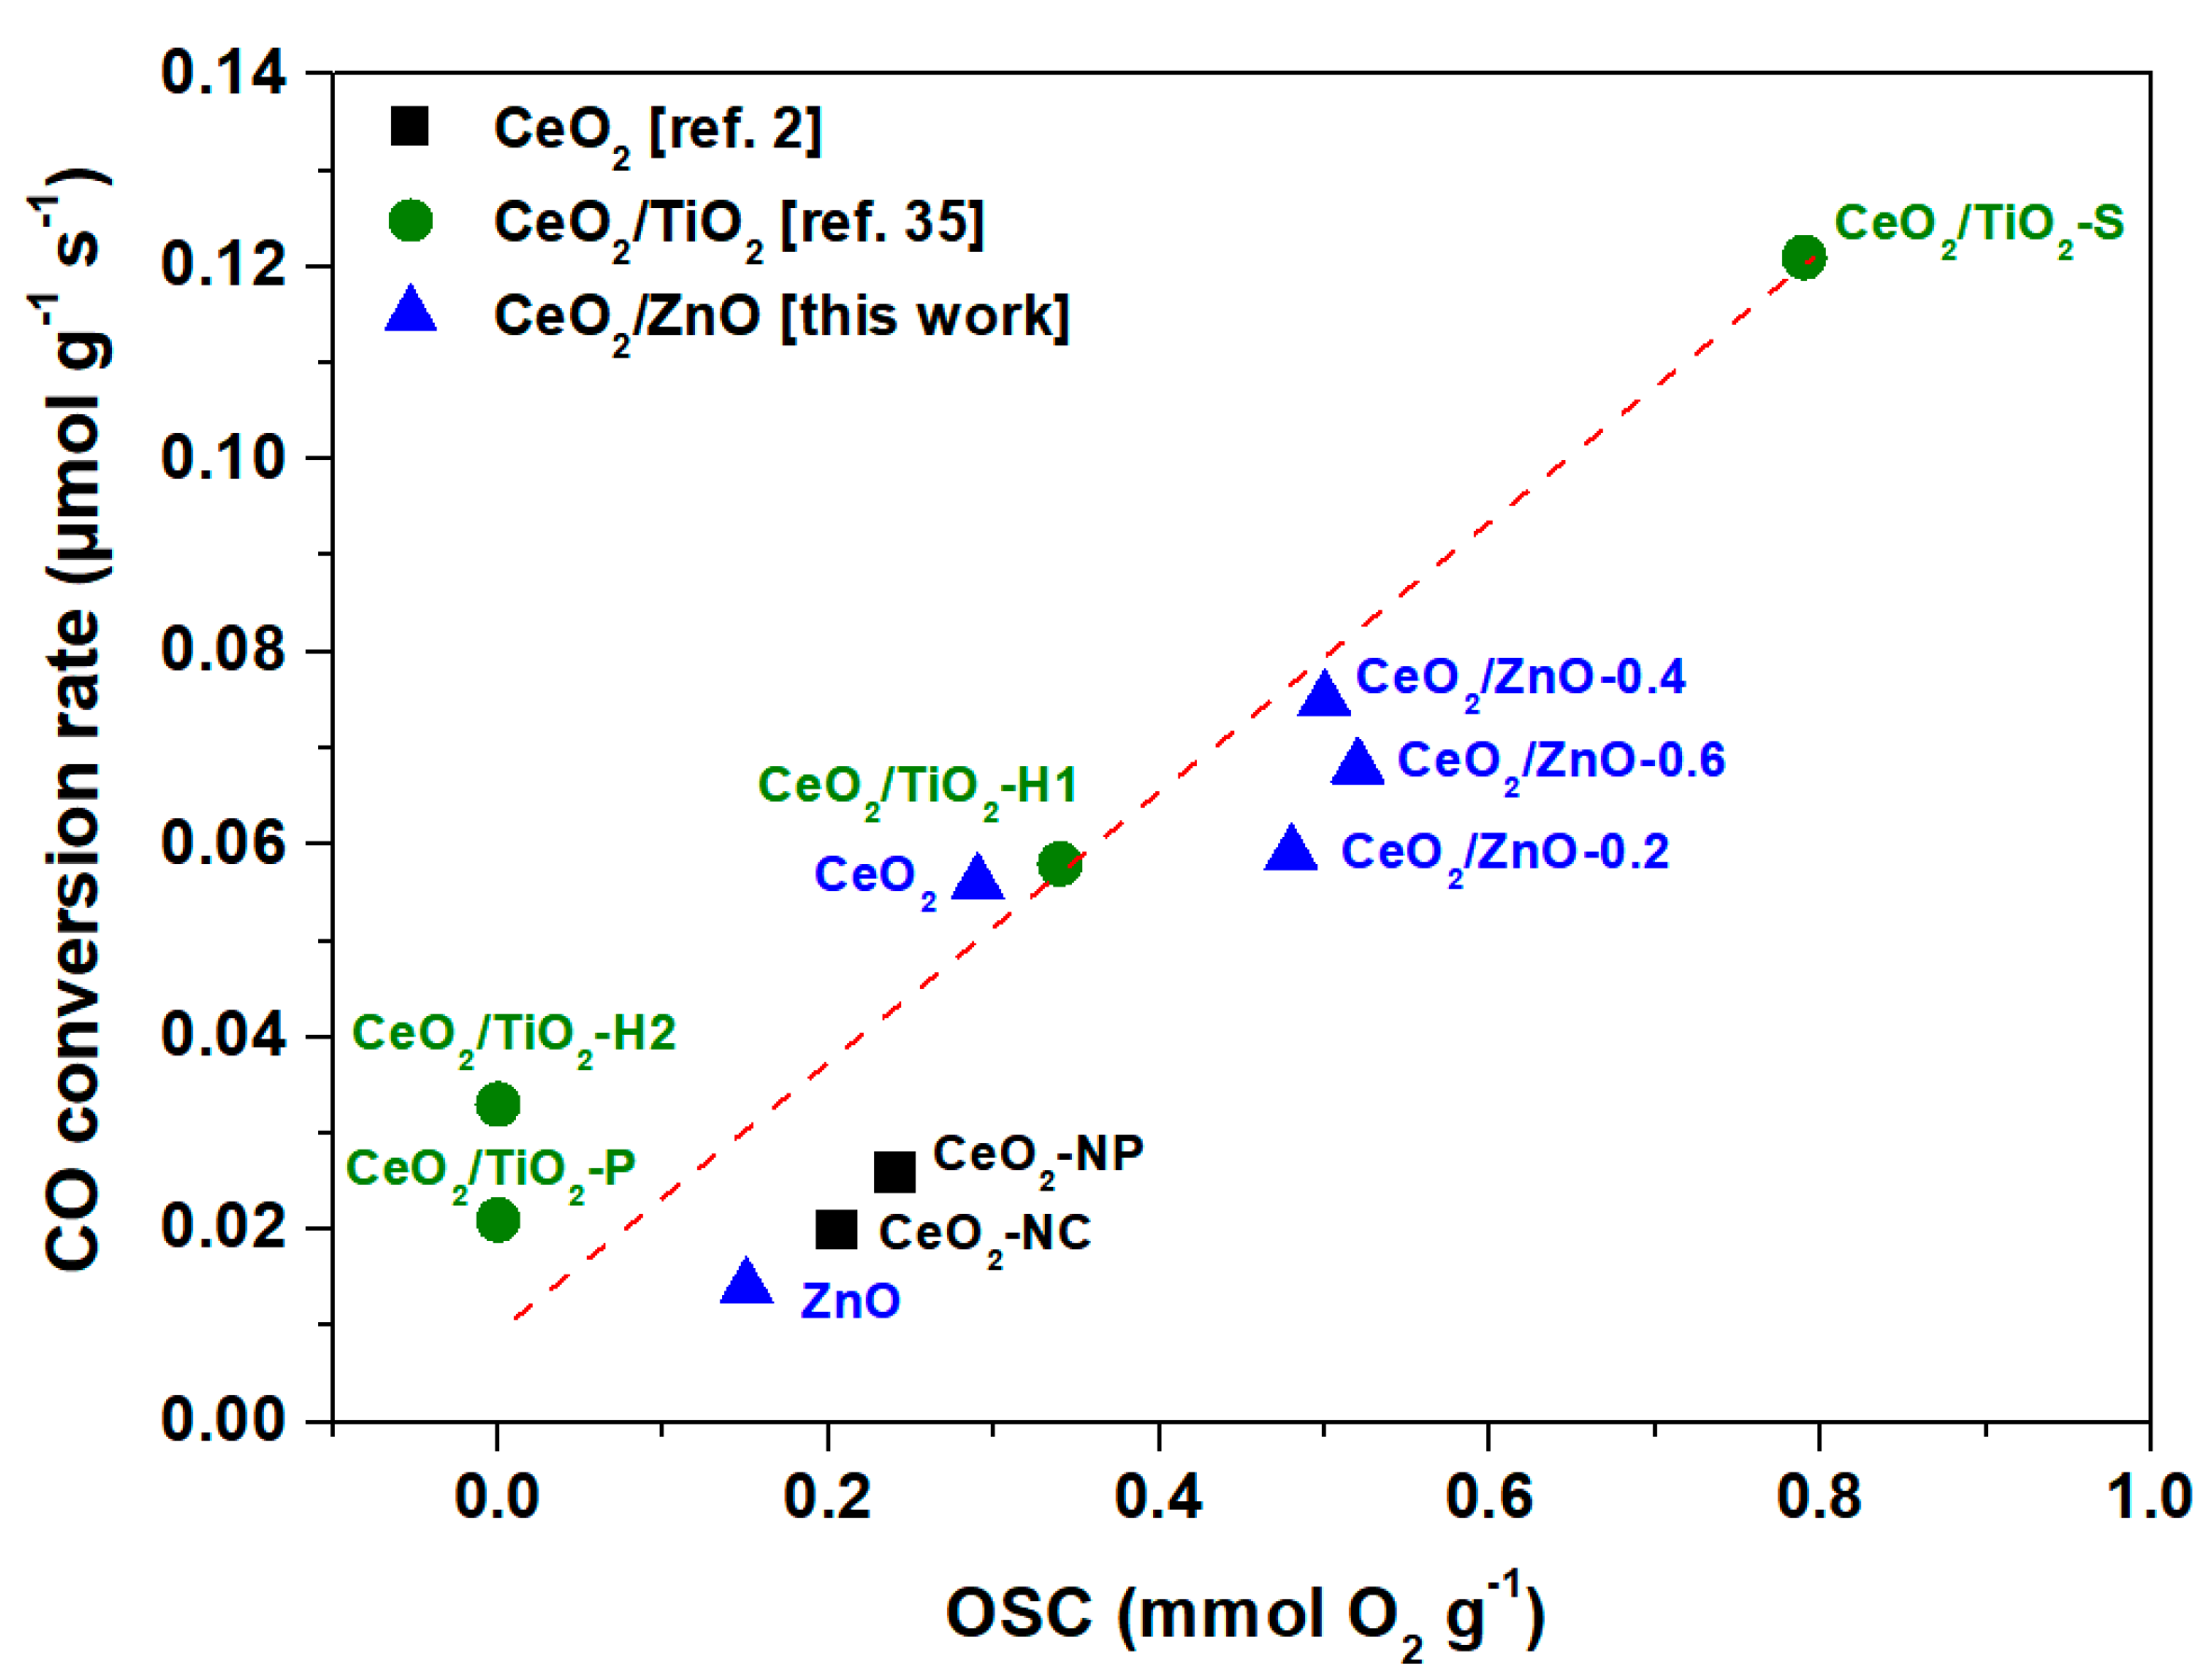
3.4. Catalytic Evaluation Studies

In Figure 6, the conversion profiles of CO over temperature for bare ZnO, CeO2 and CeO2/ZnO mixed oxides are shown. It is evident that all mixed oxides demonstrate superior performance as compared to bare ones. A similar performance was obtained between mixed oxides, with the CeO2/ZnO–0.4 being slightly better. To gain insight into the role of preparation method and the synergistic interaction between the different counterparts, the catalytic performance of a mechanical mixture (CeO2+ZnO–0.4) of exactly the same composition to the optimum sample (CeO2/ZnO–0.4) was explored in parallel. The bare ceria nanorods (CeO2) exhibit a catalytic profile shifted by ca. 30 °C to higher temperature than the optimum CeO2/ZnO–0.4 sample. ZnO is much less active with a profile located ca. 170 degrees higher. More importantly, the conversion profile of the mechanical mixture CeO2+ZnO–0.4 is shifted by ca. 100 °C to higher temperatures as compared to that of CeO2/ZnO–0.4, revealing the beneficial interaction between CeO2 and ZnO, which is induced by the preparation method (see experimental Section 2.1).
To obtain a better understanding in relation to the intrinsic activity of investigated samples, the specific activity, both in terms of catalyst mass (μmol g−1 s−1) and surface area (μmol m−2 s−1), was also estimated (Table 4). It is evident that the CeO2/ZnO–0.4 sample offers the best performance, in terms of both conversion and mass-normalized specific activity, revealing its superior reactivity. It should be noted, however, that in terms of area-normalized activity, both bare ceria and mixed oxides exhibited an inferior activity as compared to bare ZnO. The latter can be attributed to the low surface area of ZnO (7.05 m2/g), which is about one order of magnitude lower compared to bare CeO2 and CeO2/ZnO mixed oxides. Therefore, on the basis of the present results, the enhanced catalytic performance of CeO2/ZnO mixed oxides can be attributed to a compromise between redox and surface properties. Moreover, the optimum CeO2/ZnO–0.4 sample exhibits an apparent activation energy (Ea) of 32.1 kJ/mol, much lower than that of bare ceria (44.2 kJ/mol), ZnO (42.1 kJ/mol) and CeO2+ZnO–0.4 mechanical mixture (43.2 kJ/mol). These findings unveil the lower energy barrier for CO oxidation over the hydrothermally prepared mixed oxides, as compared to single oxides and mechanical mixture, demonstrating the beneficial synergistic interactions induced by synthesis procedure.
The CO oxidation process investigated here can be corroborated on the basis of a redox-type (Mars-van Krevelen) mechanism. This particular mechanism involves CO chemisorption on Ceδ+ active sites, followed by oxygen activation on oxygen vacancies [3,21,41]. CO oxidation is taking place between the Ceδ+–CO and adjacent oxygen species, followed by the regeneration of active sites and the reoccupation of oxygen vacancies through gas phase oxygen. The proposed reaction sequence is described in detail in our previous work [21].
In view of the above mechanistic aspects, the key role of the catalyst’s redox properties is clearly manifested. In detail, the high oxygen storage capacity (Table 3), linked to enhanced reducibility and oxygen exchange kinetics, can be accounted for the improved oxidation performance. Any structural or compositional modification in ceria that can affect the ceria-oxygen or ceria-oxygen-metal bond can eventually facilitate O2 activation and in turn CO oxidation. In this regard, we recently showed that the enhanced reducibility of CeO2 nanorods, linked to their abundance in oxygen vacancies, is the pivotal factor for their superior catalytic performance [21]. Furthermore, we demonstrated that when a transition metal element is incorporated in the structure of ceria nanorods, even if catalytically non-active (i.e., Ti), it can affect oxygen species coordination environment and in turn the OSC and the catalytic performance [35].
These arguments in relation to the crucial role of reducibility are clearly supported by the direct relationship between the redox properties (OSC, mmol g−1) and the normalized reaction rate (μmol g−1 s−1), as shown in Figure 7. Interestingly, the key role of OSC as an activity descriptor is further demonstrated in the present work by including in Figure 7 relevant literature data, previously obtained with bare CeO2 and CeO2/TiO2 oxides [2,35]. The latter is of particular importance towards the development of cost-effective and highly active metal oxides by appropriately adjusting their redox features.
Thus, regarding the present findings, although bare ZnO is catalytically far less active compared to CeO2 (Figure 6), their combination results in a synergistic effect towards the formation of CeO2/ZnO mixed oxides of improved activity. Similar synergistic interactions were previously revealed over TiO2–doped CeO2 [35], where, however, the doping element was incorporated in the nanostructure, resulting in the formation of Ce–O–Ti active sites. Notably, in the present work, ZnO is not incorporated in the CeO2 nanorod structure. As clearly shown by TEM images (Figure 3), ZnO nanoparticles are in close interaction with nanorods but clearly as separate particles. This is also verified by the XRD results (Figure 2), which indicate distinct oxide phases without the formation of solid solution. Hence, the improved catalytic activity of CeO2/ZnO mixed oxides, which is related to the population of active oxygen species and to the facile reduction of surface oxygen, can be attributed to the facilitation of ceria capping oxygen reduction by adjacent ZnO nanoparticles, which in turn leads to higher OSC (Figure 5, Table 3). Thus, although ZnO is not incorporated in the ceria nanorods structure, it notably contributes to surface oxygen reduction, most likely through the interfacial ZnO–CeO2 sites. The latter in combination with the abundance and lower cost of zinc compared to cerium oxide is a very interesting aspect in terms of catalyst design.

4. Conclusions

In the present work, CeO2/ZnO mixed oxides were synthesized by a two-step hydrothermal method. A thorough characterization study was carried out, revealing their textural, structural, morphological and redox features. CO oxidation was employed as a probe reaction to gain insight into the structure-activity relationships. The following order, both in terms of CO conversion and specific activity, was obtained: CeO2/ZnO–0.4 > CeO2/ZnO–0.6 > CeO2/ZnO–0.2 > CeO2 > ZnO. Despite the distinct appearance of ZnO and CeO2 phases in mixed oxides and the low reactivity of ZnO, mixed oxides exhibit improved catalytic performance as compared to bare ones. The latter was attributed to the synergistic CeO2–ZnO interactions towards an improved oxygen mobility and reducibility. Interestingly, a close relationship between the catalytic activity and the oxygen storage capacity was disclosed. Moreover, comparison with relevant literature studies verifies the role of OSC as a key activity descriptor for reactions following a redox-type mechanism. The present work reveals the significance of the rational design of noble metal-free mixed oxides towards the development of highly active materials that can be used in a variety of environmental and energy-related processes.

Author Contributions

S.S., M.L., V.B. and P.K.P. contributed to materials synthesis and characterization, results interpretation and paper–writing; V.N.S. and M.K. contributed to the conception, design, results interpretation and writing of the paper. M.K. reviewed, edited and submitted the manuscript in the final form. All authors have read and agreed to the published version of the manuscript.

Funding

This research has been co-financed by the European Union and Greek national funds through the Operational Program Competitiveness, Entrepreneurship and Innovation, under the calls RESEARCH—CREATE—INNOVATE (project code: T1EDK-00094).

Conflicts of Interest

The authors declare no conflict of interest.

References

  1. Lykaki, M.; Pachatouridou, E.; Iliopoulou, E.; Carabineiro, S.A.C.; Konsolakis, M. Impact of the synthesis parameters on the solid state properties and the CO oxidation performance of ceria nanoparticles. RSC Adv. 2017, 7, 6160–6169. [Google Scholar] [CrossRef] [Green Version]
  2. Lykaki, M.; Stefa, S.; Carabineiro, S.A.C.; Pandis, P.K.; Stathopoulos, V.N.; Konsolakis, M. Facet-Dependent Reactivity of Fe2O3/CeO2 Nanocomposites: Effect of Ceria Morphology on CO Oxidation. Catalysts 2019, 9, 371. [Google Scholar] [CrossRef] [Green Version]
  3. Wu, Z.; Li, M.; Overbury, S.H. On the structure dependence of CO oxidation over CeO2 nanocrystals with well-defined surface planes. J. Catal. 2012, 285, 61–73. [Google Scholar] [CrossRef]
  4. Zhang, S.; Li, Y.; Huang, J.; Lee, J.; Kim, D.H.; Frenkel, A.I.; Kim, T. Effects of Molecular and Electronic Structures in CoOx/CeO2 Catalysts on NO Reduction by CO. J. Phys. Chem. C 2019, 123, 7166–7177. [Google Scholar] [CrossRef]
  5. Zhang, S.; Lee, J.; Kim, D.H.; Kim, T. NO reduction by CO over CoOx/CeO2 catalysts: Effect of support calcination temperature on activity. Mol. Catal. 2020, 482, 110703. [Google Scholar] [CrossRef]
  6. Akter, N.; Zhang, S.; Lee, J.; Kim, D.H.; Boscoboinik, J.A.; Kim, T. Selective catalytic reduction of NO by ammonia and NO oxidation Over CoOx/CeO2 catalysts. Mol. Catal. 2020, 482, 110664. [Google Scholar] [CrossRef]
  7. Cámara, A.L.; Corberán, V.C.; Martínez-Arias, A.; Barrio, L.; Si, R.; Hanson, J.C.; Rodriguez, J.A. Novel manganese-promoted inverse CeO2/CuO catalyst: In situ characterization and activity for the water-gas shift reaction. Catal. Today 2020, 339, 24–31. [Google Scholar] [CrossRef]
  8. Chen, C.; Zhan, Y.; Zhou, J.; Li, D.; Zhang, Y.; Lin, X.; Jiang, L.; Zheng, Q. Cu/CeO2 Catalyst for Water-Gas Shift Reaction: Effect of CeO2 Pretreatment. ChemPhysChem 2018, 19, 1448–1455. [Google Scholar] [CrossRef] [PubMed]
  9. Ronda-Lloret, M.; Rico-Francés, S.; Sepúlveda-Escribano, A.; Ramos-Fernandez, E.V. CuOx/CeO2 catalyst derived from metal organic framework for reverse water-gas shift reaction. Appl. Catal. A Gen. 2018, 562, 28–36. [Google Scholar] [CrossRef]
  10. Damaskinos, C.M.; Vasiliades, M.A.; Stathopoulos, V.N.; Efstathiou, A.M. The Effect of CeO2 Preparation Method on the Carbon Pathways in the Dry Reforming of Methane on Ni/CeO2 Studied by Transient Techniques. Catalysts 2019, 9, 621. [Google Scholar] [CrossRef] [Green Version]
  11. Da Silva, A.M.; De Souza, K.R.; Jacobs, G.; Graham, U.M.; Davis, B.H.; Mattos, L.V.; Noronha, F.B. Steam and CO2 reforming of ethanol over Rh/CeO2 catalyst. Appl. Catal. B Environ. 2011, 102, 94–109. [Google Scholar] [CrossRef] [Green Version]
  12. Hou, T.; Yu, B.; Zhang, S.; Xu, T.; Wang, D.; Cai, W. Hydrogen production from ethanol steam reforming over Rh/CeO2 catalyst. Catal. Commun. 2015, 58, 137–140. [Google Scholar] [CrossRef]
  13. Kumar, P.A.; Tanwar, M.D.; Russo, N.; Pirone, R.; Fino, D. Synthesis and catalytic properties of CeO2 and Co/CeO2 nanofibres for diesel soot combustion. Catal. Today 2012, 184, 279–287. [Google Scholar] [CrossRef]
  14. Muroyama, H.; Hano, S.; Matsui, T.; Eguchi, K. Catalytic soot combustion over CeO2-based oxides. Catal. Today 2010, 153, 133–135. [Google Scholar] [CrossRef]
  15. Aneggi, E.; Wiater, D.; de Leitenburg, C.; Llorca, J.; Trovarelli, A. Shape-Dependent Activity of Ceria in Soot Combustion. ACS Catal. 2014, 4, 172–181. [Google Scholar] [CrossRef]
  16. Konsolakis, M.; Lykaki, M. Recent Advances on the Rational Design of Non-Precious Metal Oxide Catalysts Exemplified by CuOx/CeO2 Binary System: Implications of Size, Shape and Electronic Effects on Intrinsic Reactivity and Metal-Support Interactions. Catalysts 2020, 10, 160. [Google Scholar] [CrossRef] [Green Version]
  17. Montini, T.; Melchionna, M.; Monai, M.; Fornasiero, P. Fundamentals and Catalytic Applications of CeO2 -Based Materials. Chem. Rev. 2016, 116, 5987–6041. [Google Scholar] [CrossRef]
  18. Paier, J.; Penschke, C.; Sauer, J. Oxygen Defects and Surface Chemistry of Ceria: Quantum Chemical Studies Compared to Experiment. Chem. Rev. 2013, 113, 3949–3985. [Google Scholar] [CrossRef]
  19. Cargnello, M.; Doan-Nguyen, V.V.T.; Gordon, T.R.; Diaz, R.E.; Stach, E.A.; Gorte, R.J.; Fornasiero, P.; Murray, C.B. Control of Metal Nanocrystal Size Reveals Metal-Support Interface Role for Ceria Catalysts. Science 2013, 341, 771–773. [Google Scholar] [CrossRef] [Green Version]
  20. Tang, W.-X.; Gao, P.-X. Nanostructured cerium oxide: Preparation, characterization, and application in energy and environmental catalysis. MRS Commun. 2016, 6, 311–329. [Google Scholar] [CrossRef] [Green Version]
  21. Lykaki, M.; Pachatouridou, E.; Carabineiro, S.A.C.; Iliopoulou, E.; Andriopoulou, C.; Kallithrakas-Kontos, N.; Boghosian, S.; Konsolakis, M. Ceria nanoparticles shape effects on the structural defects and surface chemistry: Implications in CO oxidation by Cu/CeO2 catalysts. Appl. Catal. B Environ. 2018, 230, 18–28. [Google Scholar] [CrossRef]
  22. Elias, J.S.; Risch, M.; Giordano, L.; Mansour, A.N.; Shao-Horn, Y. Structure, Bonding, and Catalytic Activity of Monodisperse, Transition-Metal-Substituted CeO2 Nanoparticles. J. Am. Chem. Soc. 2014, 136, 17193–17200. [Google Scholar] [CrossRef] [PubMed]
  23. Bion, N.; Epron, F.; Moreno, M.; Mariño, F.; Duprez, D. Preferential Oxidation of Carbon Monoxide in the Presence of Hydrogen (PROX) over Noble Metals and Transition Metal Oxides: Advantages and Drawbacks. Top. Catal. 2008, 51, 76–88. [Google Scholar] [CrossRef]
  24. Wang, J.; Chen, R.; Xiang, L.; Komarneni, S. Synthesis, properties and applications of ZnO nanomaterials with oxygen vacancies: A review. Ceram. Int. 2018, 44, 7357–7377. [Google Scholar] [CrossRef]
  25. Sajjad, M.; Ullah, I.; Khan, M.I.; Khan, J.; Khan, M.Y.; Qureshi, M.T. Structural and optical properties of pure and copper doped zinc oxide nanoparticles. Results Phys. 2018, 9, 1301–1309. [Google Scholar] [CrossRef]
  26. Lee, C.-G.; Na, K.-H.; Kim, W.-T.; Park, D.-C.; Yang, W.-H.; Choi, W.-Y. TiO2/ZnO Nanofibers Prepared by Electrospinning and Their Photocatalytic Degradation of Methylene Blue Compared with TiO2 Nanofibers. Appl. Sci. 2019, 9, 3404. [Google Scholar] [CrossRef] [Green Version]
  27. Stathopoulos, V.N.; Papandreou, A.; Kanellopoulou, D.; Stournaras, C.J. Structural ceramics containing electric arc furnace dust. J. Hazard. Mater. 2013, 262, 91–99. [Google Scholar] [CrossRef]
  28. Rodwihok, C.; Wongratanaphisan, D.; Van Tam, T.; Choi, W.M.; Hur, S.H.; Chung, J.S. Cerium-Oxide-Nanoparticle-Decorated Zinc Oxide with Enhanced Photocatalytic Degradation of Methyl Orange. Appl. Sci. 2020, 10, 1697. [Google Scholar] [CrossRef] [Green Version]
  29. Ma, T.-Y.; Yuan, Z.-Y.; Cao, J.-L. Hydrangea-Like Meso-/Macroporous ZnO-CeO2 Binary Oxide Materials: Synthesis, Photocatalysis and CO Oxidation. Eur. J. Inorg. Chem. 2010, 2010, 716–724. [Google Scholar] [CrossRef]
  30. Lv, Z.; Zhong, Q.; Ou, M. Utilizing peroxide as precursor for the synthesis of CeO2/ZnO composite oxide with enhanced photocatalytic activity. Appl. Surf. Sci. 2016, 376, 91–96. [Google Scholar] [CrossRef]
  31. De Lima, J.F.; Martins, R.F.; Neri, C.R.; Serra, O.A. ZnO:CeO2-based nanopowders with low catalytic activity as UV absorbers. Appl. Surf. Sci. 2009, 255, 9006–9009. [Google Scholar] [CrossRef]
  32. Liu, I.-T.; Hon, M.-H.; Teoh, L.G. The preparation, characterization and photocatalytic activity of radical-shaped CeO2/ZnO microstructures. Ceram. Int. 2014, 40, 4019–4024. [Google Scholar] [CrossRef]
  33. Xie, Q.; Zhao, Y.; Guo, H.; Lu, A.; Zhang, X.; Wang, L.; Chen, M.-S.; Peng, D.-L. Facile Preparation of Well-Dispersed CeO2–ZnO Composite Hollow Microspheres with Enhanced Catalytic Activity for CO Oxidation. ACS Appl. Mater. Interfaces 2014, 6, 421–428. [Google Scholar] [CrossRef] [PubMed]
  34. Mu, G.; Liu, C.; Wei, Q.; Huang, Y. Three dimensionally ordered macroporous CeO2-ZnO catalysts for enhanced CO oxidation. Mater. Lett. 2016, 181, 161–164. [Google Scholar] [CrossRef]
  35. Stefa, S.; Lykaki, M.; Fragkoulis, D.; Binas, V.; Pandis, P.K.; Stathopoulos, V.N.; Konsolakis, M. Effect of the Preparation Method on the Physicochemical Properties and the CO Oxidation Performance of Nanostructured CeO2/TiO2 Oxides. Processes 2020, 8, 847. [Google Scholar] [CrossRef]
  36. Luo, J.-Y.; Meng, M.; Li, X.; Li, X.-G.; Zha, Y.-Q.; Hu, T.-D.; Xie, Y.-N.; Zhang, J. Mesoporous Co3O4–CeO2 and Pd/Co3O4–CeO2 catalysts: Synthesis, characterization and mechanistic study of their catalytic properties for low-temperature CO oxidation. J. Catal. 2008, 254, 310–324. [Google Scholar] [CrossRef]
  37. Liu, J.; Zhao, Z.; Wang, J.; Xu, C.; Duan, A.; Jiang, G.; Yang, Q. The highly active catalysts of nanometric CeO2-supported cobalt oxides for soot combustion. Appl. Catal. B Environ. 2008, 84, 185–195. [Google Scholar] [CrossRef]
  38. Yu, S.-W.; Huang, H.-H.; Tang, C.-W.; Wang, C.-B. The effect of accessible oxygen over Co3O4–CeO2 catalysts on the steam reforming of ethanol. Int. J. Hydrogen Energy 2014, 39, 20700–20711. [Google Scholar] [CrossRef]
  39. Subramanian, V.; Potdar, H.S.; Jeong, D.-W.; Shim, J.-O.; Jang, W.-J.; Roh, H.-S.; Jung, U.H.; Yoon, W.L. Synthesis of a Novel Nano-Sized Pt/ZnO Catalyst for Water Gas Shift Reaction in Medium Temperature Application. Catal. Lett. 2012, 142, 1075–1081. [Google Scholar] [CrossRef]
  40. Khan, A.; Smirniotis, P.G. Relationship between temperature-programmed reduction profile and activity of modified ferrite-based catalysts for WGS reaction. J. Mol. Catal. A Chem. 2008, 280, 43–51. [Google Scholar] [CrossRef]
  41. Mukherjee, D.; Rao, B.G.; Reddy, B.M. CO and soot oxidation activity of doped ceria: Influence of dopants. Appl. Catal. B Environ. 2016, 197, 105–115. [Google Scholar] [CrossRef]
Figure 1. (a) N2 adsorption-desorption isotherms and (b) pore size distribution of bare CeO2, ZnO and the CeO2/ZnO samples.
Applsci 10 07605 g001
Figure 2. XRD patterns of CeO2, ZnO and the CeO2/ZnO samples.
Applsci 10 07605 g002
Figure 3. TEM images of (a) ZnO, (b) CeO2, (c) CeO2/ZnO–0.2, (d) CeO2/ZnO–0.4 and (e) CeO2/ZnO–0.6.
Applsci 10 07605 g003
Figure 4. SEM–EDS analysis of the CeO2/ZnO–0.2 sample.
Applsci 10 07605 g004
Figure 5. H2-TPR profiles of CeO2 and the CeO2/ZnO samples.
Applsci 10 07605 g005
Figure 6. CO conversion profiles of CeO2, ZnO and CeO2/ZnO samples.
Applsci 10 07605 g006
Figure 7. Correlation of specific activity with oxygen storage capacity (OSC). Literature data are also included. Specific rates were obtained at 200 °C under the reaction conditions: 0.2 vol.% CO and 1 vol.% O2 in He. The dotted line simply represents the general trend of the data. The designation of the samples inside the figure refers to CeO2 nanopolyhedra (CeO2–NP), CeO2 nanocubes (CeO2–NC), CeO2–TiO2 nanoparticles prepared by precipitation (CeO2/TiO2–P), hydrothermal method in one and two steps (CeO2/TiO2–H1 and CeO2/TiO2–H2, respectively) and Stöber method (CeO2/TiO2–S).
Applsci 10 07605 g007
Table 1. Textural characteristics of bare CeO2, ZnO and the CeO2/ZnO samples.
SampleBET Analysis
Surface Area (m2/g)Pore Volume (cm3/g)Average Pore Size (nm)
CeO279.31 ± 0.150.4824.2
CeO2/ZnO–0.276.22 ± 0.120.6734.4
CeO2/ZnO–0.462.21 ± 0.110.6540.6
CeO2/ZnO–0.656.12 ± 0.090.9155.9
ZnO7.05 ± 0.010.0623.0
Table 2. Structural characteristics of CeO2, ZnO and the CeO2/ZnO samples.
SamplesXRD Analysis
Phase DetectedAverage Crystallite Size,
DXRD (nm)
Lattice Parameters (nm)
CeO2ZnO
CeO2Cerium (IV) oxide12.99 ± 0.01-a = b = c = 0.5430 ± 0.0001
CeO2/ZnO–0.2Cerium (IV) oxide
Zincite
12.14 ± 0.0144.41 ± 0.05a = b = c = 0.5439 ± 0.0001
a = b = 0.3180 ± 0.0001; c = 0.5232 ± 0.0001
CeO2/ZnO–0.4Cerium (IV) oxide
Zincite
11.92 ± 0.0144.65 ± 0.05a = b = c = 0.5430 ± 0.0001
a = b = 0.3262 ± 0.0001; c = 0.5225 ± 0.0001
CeO2/ZnO–0.6Cerium (IV) oxide
Zincite
11.56 ± 0.0139.32 ± 0.05a = b = c = 0.5439 ± 0.0001
a = b = 0.3267 ± 0.0001; c = 0.523 ± 0.0001
ZnOZincite-34.50 ± 0.05a = b = 0.3272 ± 0.0001; c = 0.5233 ± 0.0001
Table 3. Redox features of CeO2 and CeO2/ZnO samples.
SampleH2 Uptake (mmol H2/g) and OSC (mmol O2/g)
Peak APeak BPeak CH2 uptakeOSC
CeO2--0.590.590.29
CeO2/ZnO–0.20.150.210.610.970.48
CeO2/ZnO–0.40.150.230.631.010.50
CeO2/ZnO–0.60.160.250.631.040.52
ZnO0.140.17-0.310.15
Table 4. Conversion of CO and specific rates of CeO2 and CeO2/ZnO samples at 200 °C. Reaction conditions: 0.2 vol.% CO and 1 vol.% O2 in He.
SampleCO Conversion (%)Specific Rate
r
(μmol g−1 s−1)
r (×100)
(μmol m−2 s−1)
CeO25.10.0560.070
CeO2/ZnO–0.25.40.0590.077
CeO2/ZnO–0.46.90.0750.121
CeO2/ZnO–0.66.20.0680.121
ZnO1.30.0140.201
Publisher’s Note: MDPI stays neutral with regard to jurisdictional claims in published maps and institutional affiliations.

