SIM-D: An Agent-Based Simulator for Modeling Contagion in Population


1
Department of Information and Communication Engineering, Chosun University, Gwangju 61452, Korea
2
College of Science and Technology, Duksung Women’s University, Seoul 01369, Korea
3
Department of Computer Systems Engineering, University of Engineering and Technology (UET), Peshawar 25120, Pakistan
4
Department of Electrical Engineering, Jalozai, University of Engineering and Technology (UET), Peshawar 25120, Pakistan
*
Author to whom correspondence should be addressed.
Appl. Sci. 2020, 10(21), 7745; https://doi.org/10.3390/app10217745
Submission received: 12 September 2020
/
Revised: 29 October 2020
/
Accepted: 29 October 2020
/
Published: 2 November 2020
(This article belongs to the Special Issue Spreading of Infection Diseases like COVID-19 and Influenza: Modelling and Propagation Control)
Abstract
:The spread of infectious diseases such as COVID-19, flu influenza, malaria, dengue, mumps, and rubella in a population is a big threat to public health. The infectious diseases spread from one person to another person through close contact. Without proper planning, an infectious disease can become an epidemic and can result in large human and financial losses. To better respond to the spread of infectious disease and take measures for its control, the public health authorities need models and simulations to study the spread of such diseases. In this paper, an agent-based simulation engine is presented that models the spread of infectious diseases in the population. The simulation takes as an input the human-to-human interactions, population dynamics, disease transmissibility and disease states and shows the spread of disease over time. The simulation engine supports non-pharmaceutical interventions and shows its impact on the disease spread across locations. A unique feature of this tool is that it is generic; therefore, it can simulate a wide variety of infectious disease models (SIR), susceptible-infectious-susceptible (SIS) and susceptible-infectious (SI). The proposed simulation engine will help the policy-makers and public health authorities study the behavior of disease spreading; thus, allowing for better planning.
1. Introduction
Infectious diseases such as COVID-19, flu influenza, malaria, dengue, measles, mumps, and Ebola, etc. are a big threat to public health safety and security [1,2]. Every year, a new strain of epidemic diseases circulates around the globe and infects millions of people, resulting in thousands (and sometimes millions) of deaths. According to the 2019 report of the World Health Organization (WHO), the health systems across the world are weak and are not prepared for epidemic-like situations [3]. This means that the human lives across the globe are at an increased risk. This observation was validated by the recent wave of COVID-19, a pneumonia-like disease caused by the coronavirus. As of this writing, the disease has infected 40 million people and has killed over one million persons [4]. Every place and community was affected. The disease has spread to over 200 countries in a matter of two–four months [5].
The world is at a greater risk of epidemic spread, for several reasons. First, the world population is growing rapidly, which means that the number of people that can be infected is increasing. Second, many people are moving to cities for better life opportunities, thus increasing the population densities of the cities. This increases the number of human interactions and spreads the infection faster. Third, the increase in life expectancy means a larger portion of people are in old age. Old people are more vulnerable to infectious diseases, and their chances of developing complications are usually high. Finally, long-distance travel is getting easier, creating ground for the faster spread of disease to far-off countries.
According to the WHO, most countries in the world are not prepared for large-scale epidemics [3]. The spread of COVID-19 has shown that countries were not able to effectively respond to the spread of disease [6]. Many countries applied lockdowns, but since the lockdown measures were not driven by intelligent disease modeling, their precise impact was not significant [7]. An important lesson learnt was that more planning is needed. The planning should be backed by a model that can predict the spread of the disease under different conditions. For better understanding, the models are expected to enable the study of several variables, such as disease dynamics and social interactions.
Several models have been developed that study the spread of infectious disease in population. The models can be divided into two broad categories: deterministic and stochastic [8]. The deterministic epidemic models calculate the total numbers of infections using mathematical formulations. It is good at estimating the duration of epidemic, however it does not provide any day-to-day details of infections [9]. The stochastic epidemic models are more realistic and use realistic social-contact networks. The models provide the day-to-day details about the spread of disease at different locations [10]. Although the stochastic models do not capture every complex situation, they give more insights into the spread of disease compared to the deterministic models [11].
In this work, a stochastic simulation engine is developed that is capable of modeling the spread of disease in population. Input to the simulation is a person-to-person interaction graph. The network graph shows the daily interactions between agents (humans) in a population. Since the model is agent-based, the interactions are computed between all interacting agents. The simulation computes the probability of spread of infection between the interacting infectious and susceptible agents (using the duration of contact, disease dynamics and agent demographics).
The simulation engine is generic and is applicable to all epidemic diseases that spreads through interactions. The model is probabilistic and supports different disease states (incubation, infectious and recovered). Using the duration of disease, the model can be applied to susceptible-infectious-recovered (SIR), susceptible-infectious-susceptible (SIS) and susceptible-infectious (SI) models. The model is similar to CharmSimdemics [12], however, our model is direct person-to-person and does not enforce the location-based computational dependencies.
The rest of the paper is structured as follows. Section 2 describes the epidemic disease modeling parameters followed by related work in Section 3. Section 4 describes the SIM-D algorithm in detail. Section 5 discusses the implementation of proposed simulation engine. Section 6 shows the application of SIM-D in disease modeling. Limitations, concluding remarks and future work are presented in Section 7 and Section 8, respectively.
2. Disease Model Parameters
In this section, the modeling parameters of a networked susceptible exposed infectious recovered (SEIR) diseases are discussed. This model can be used to describe SIR, SIS and SI disease models. The disease states in the SEIR model are used in describing the progression of disease in the individuals and its transmission in the population [13] as shown in Figure 1.
The three most important parameters are transmissibility, infectious period and incubation period. The transmissibility () controls the diffusion intensity of the disease in population. It is the probability of transmission of disease from an infectious individual to a susceptible individual in one minute of contact [14].
The incubation period (), also known as the latent period, is the interval during which an infected individual cannot transmit the disease to other susceptible individuals. The infectious period () is the period during which an infected individual can transmit the disease to other susceptible individuals. Table 1 lists the dwell times in different disease states for typical influenza [15,16].
Based on the dwell times in exposed, infectious and recovered states, the diseases can be modelled using SIR, SIS and SI disease models as shown in Table 2. In SIR (susceptible→exposed→infectious→recovered), a person after recovering stays in the recovered state forever. The individual develops immunity to that strain of the disease and will not become susceptible again [17]. Typical influenza is usually modelled using SIR [13]. In SIS (susceptible→exposed→infectious→susceptible), a person after getting recovered becomes immediately susceptible to the disease again. The Measles, a well-known infectious disease, and most of the sexually transmitted diseases conform to SIS [18,19]. In SIR (susceptible→exposed→infectious), a person after becoming infectious remains infectious forever. The human immunodeficiency virus (HIV/AIDS), usually transmitted through bodily fluids, is modelled using SI [20].
The progression of disease within an agent is probabilistic and can be shown using a finite state machine as shown in Figure 2. The probability is dependent on whether the user is vaccinated or not. A person vaccinated against the disease is less likely to be infected compared to someone who is not vaccinated. The finite state machine (FSM) in Figure 2 shows the SIR model. For SI, the infectious period is changed to infinite. Moreover, for SIS, a transition is added from recovered to an uninfected state.
3. Related Work
The modelling of infectious disease is important for getting insights into its spread [21]. Two popular approaches have been tried for modelling the spread of infectious diseases: deterministic models and agent-based stochastic models [22,23]. A brief overview of each one is them is as follows:
3.1. Deterministic Models or Compartment Models
In deterministic or compartmental mathematical models, the population is divided into groups based on the state of the disease (i.e., susceptible, infected, and recovered people). Then, the model is applied to it, which determines the final count of infections and the duration of the epidemic [24,25,26]. The model assumes uniform contacts within the population. The model is not able to give the time-varying information about the infections. EpiModel is a package for mathematical modeling of infectious disease over social networks. It models SI, SIR, and SIS epidemics, with and without demography [27]. It also models deterministic compartmental models, stochastic individual contact models, and stochastic network models. A study conducted by Ko Kwok and his team analyzed the deterministic models for modeling of infectious disease in early state of disease outbreak [28]. The study concludes that mathematical models can help inform policy makers by evaluating the effectiveness of different existing intervention approaches in the early phase of epidemics.
3.2. Agent-Based Stochastic Models
Stochastic models are probabilistic models and the transmission of the disease depends on the probability of transmission as well as on the other agents (and their demographics). In an agent-based modeling approach, the infection occurs only by contact with infected individuals within the society [12,29]. These models give time-varying details about the spread of diseases, such as the number of infected people each day and their locations. This is a realistic approach for observing the spread of diseases and understanding its patterns [30].
Some of the most popular agent-based epidemic simulation models include EpiFast [31], EpiSims [13] and EpiSimdemics [11,32,33]. The models were good at modelling the epidemic in shared and distributed environments. AceMod, an agent-based modelling framework for studying influenza epidemics, was able to analyse the spatiotemporal spread of contagion and influenza spatial synchrony across the population [34]. Longini developed a similar simulation engine and its parallel implementation, but the agents in social networks were not real but surrogates [35].
Several other models have been developed for epidemic modelling. GLEAMviz is a desktop application that provides a simple, intuitive, and visual way to set up simulations, develop disease models and evaluate simulation results using a variety of maps, charts, and data analysis tools [36]. The dengueMe simulation engine can simulate the following cases. Proposed by Nishiura, the first case study describes a simple dengue transmission model based on ordinary differential equations [37]. The second is an Aegypti population dynamics model, which is also based on ordinary differential equations that were proposed by Lana et al. [38]. The second example includes simulating the application of insecticide in some areas of real urban space (geographic database). The third is an agent-based transmission model based on Medeiros et al. (2011) [39] and simulated in the same real urban space.
The Spatiotemporal Epidemiological Modeler (STEM) is free software available through the Eclipse Foundation [40]. Originally developed for research, the tool is designed to help scientists and public health officials to create and use spatial and temporal models of emerging infectious diseases. These models can aid in understanding and potentially preventing the spread of diseases. EpiFire [41,42,43] is an application programming interface and graphical user interface implemented in C++, which includes a fast and efficient library for generating, analyzing, and manipulating networks. Network-based percolation and chain-binomial simulations of susceptible-infected-recovered disease transmission, as well as traditional non-network simulations, can be performed using EpiFire.
4. The SIM-D Algorithm
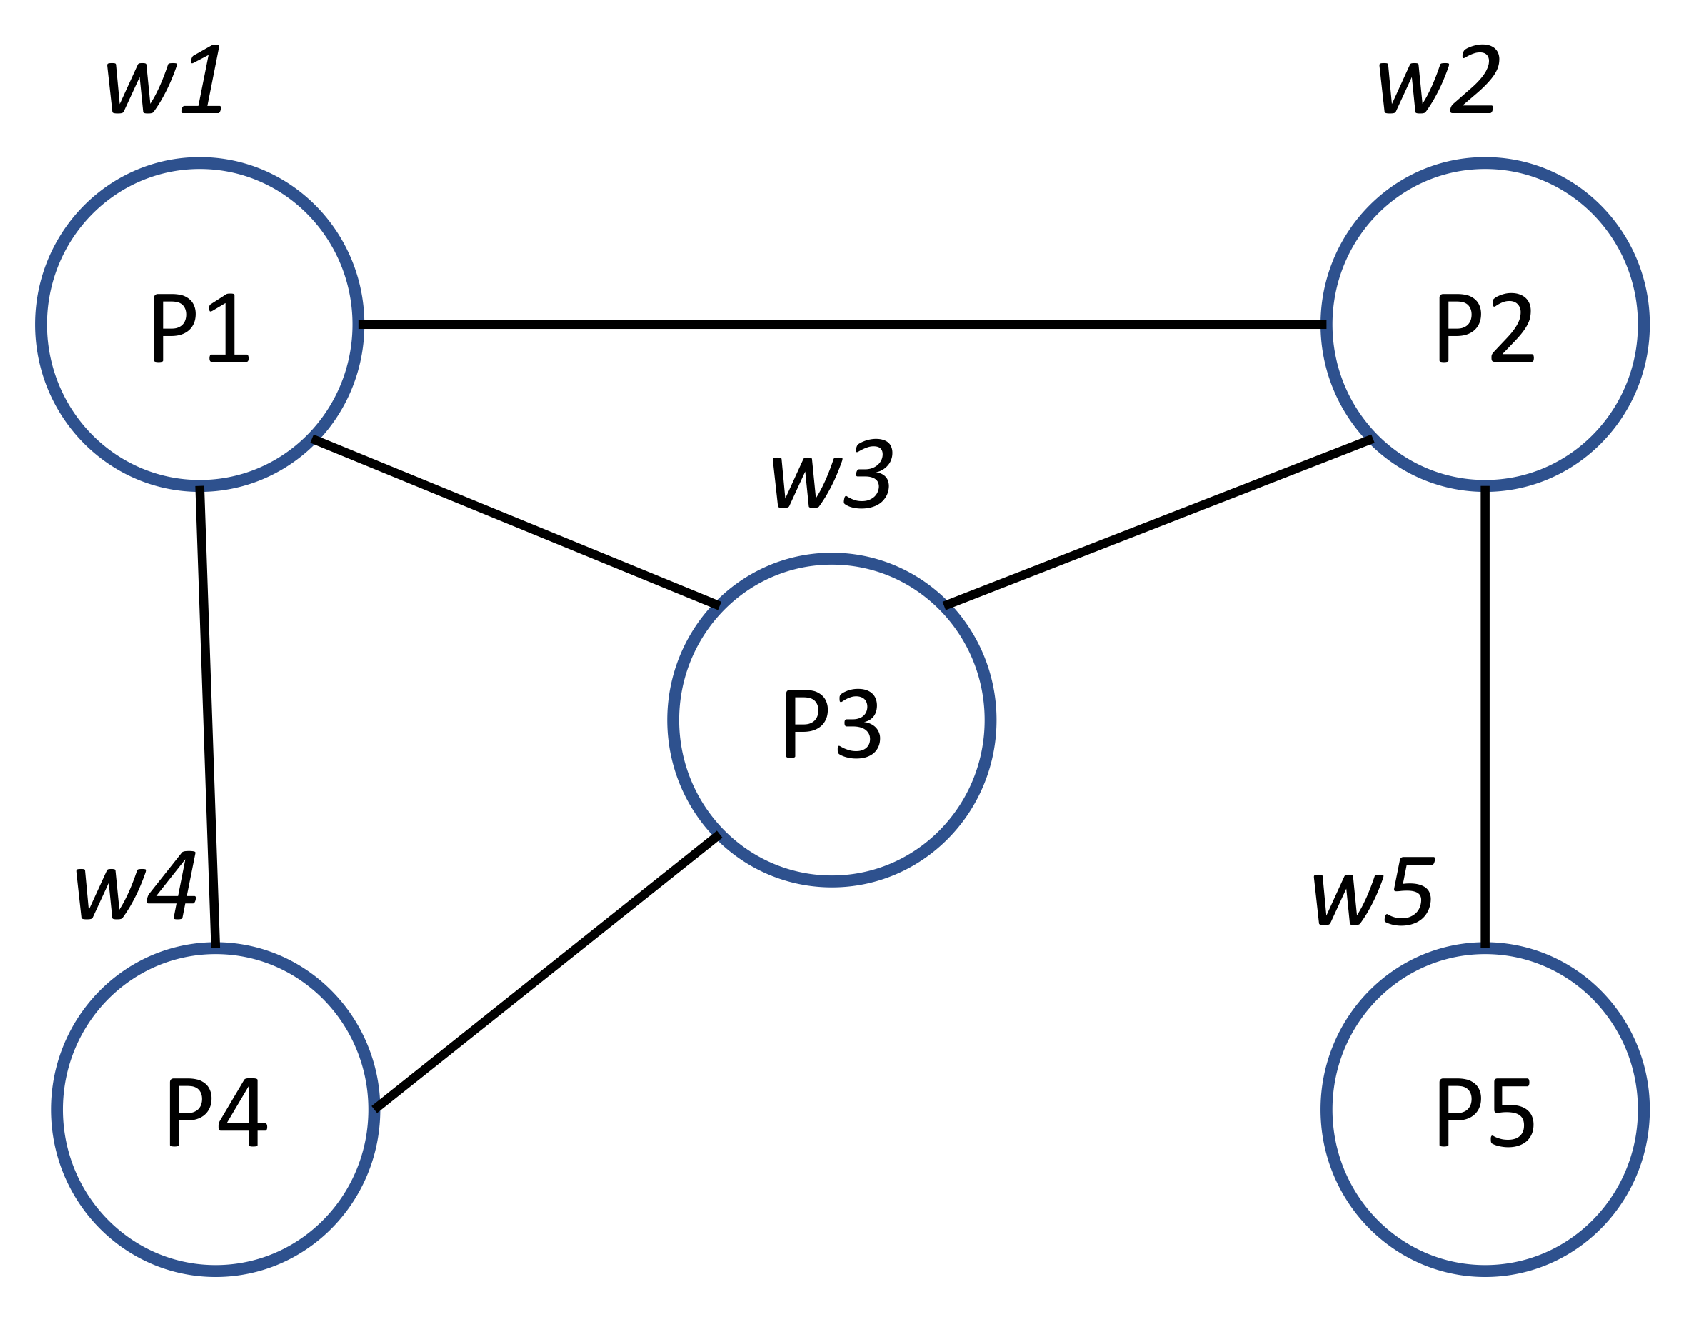
The SIM-D algorithm is based on information diffusion across a social interaction network, as shown in Algorithm 1. It performs interactions between the persons (also known as agents) according to the interaction graph shown in Figure 3. A brief description of SIM-D algorithm is summarized and given below and summarized in Algorithm 1.
| Algorithm 1: The general SIM-D algorithm, where P represents a Person, refers to an interaction between Person i and j and refers to the outcome of their interaction. N refers to the total number of simulation time-steps and K refers to the total number of persons. |
 |
SIM-D runs over sever time-steps also called the simulation days.
The processing of each iteration involves the following steps:
- Each person determines the list of persons that it is going to interact with based on a normative schedule, and individual behaviour and health state.
- The persons compute interactions with other persons. The computation uses disease transmissibility, person susceptibility and duration of contact. The interaction may or may not result in an infection, depending on a stochastic model. Disease propagation from one person to another person is modelled by Equation (1).where r is transmissibility, s is susceptibility, and t is the duration of contact. If the computed probability is greater than 0.5, the interaction results in the transmission of disease; otherwise, it is not.
- If a person gets infected, it is notified of the infection.
- At the end of time-step, the persons with outcomes update their state. The number of infections at locations are also updated.
5. Implementation
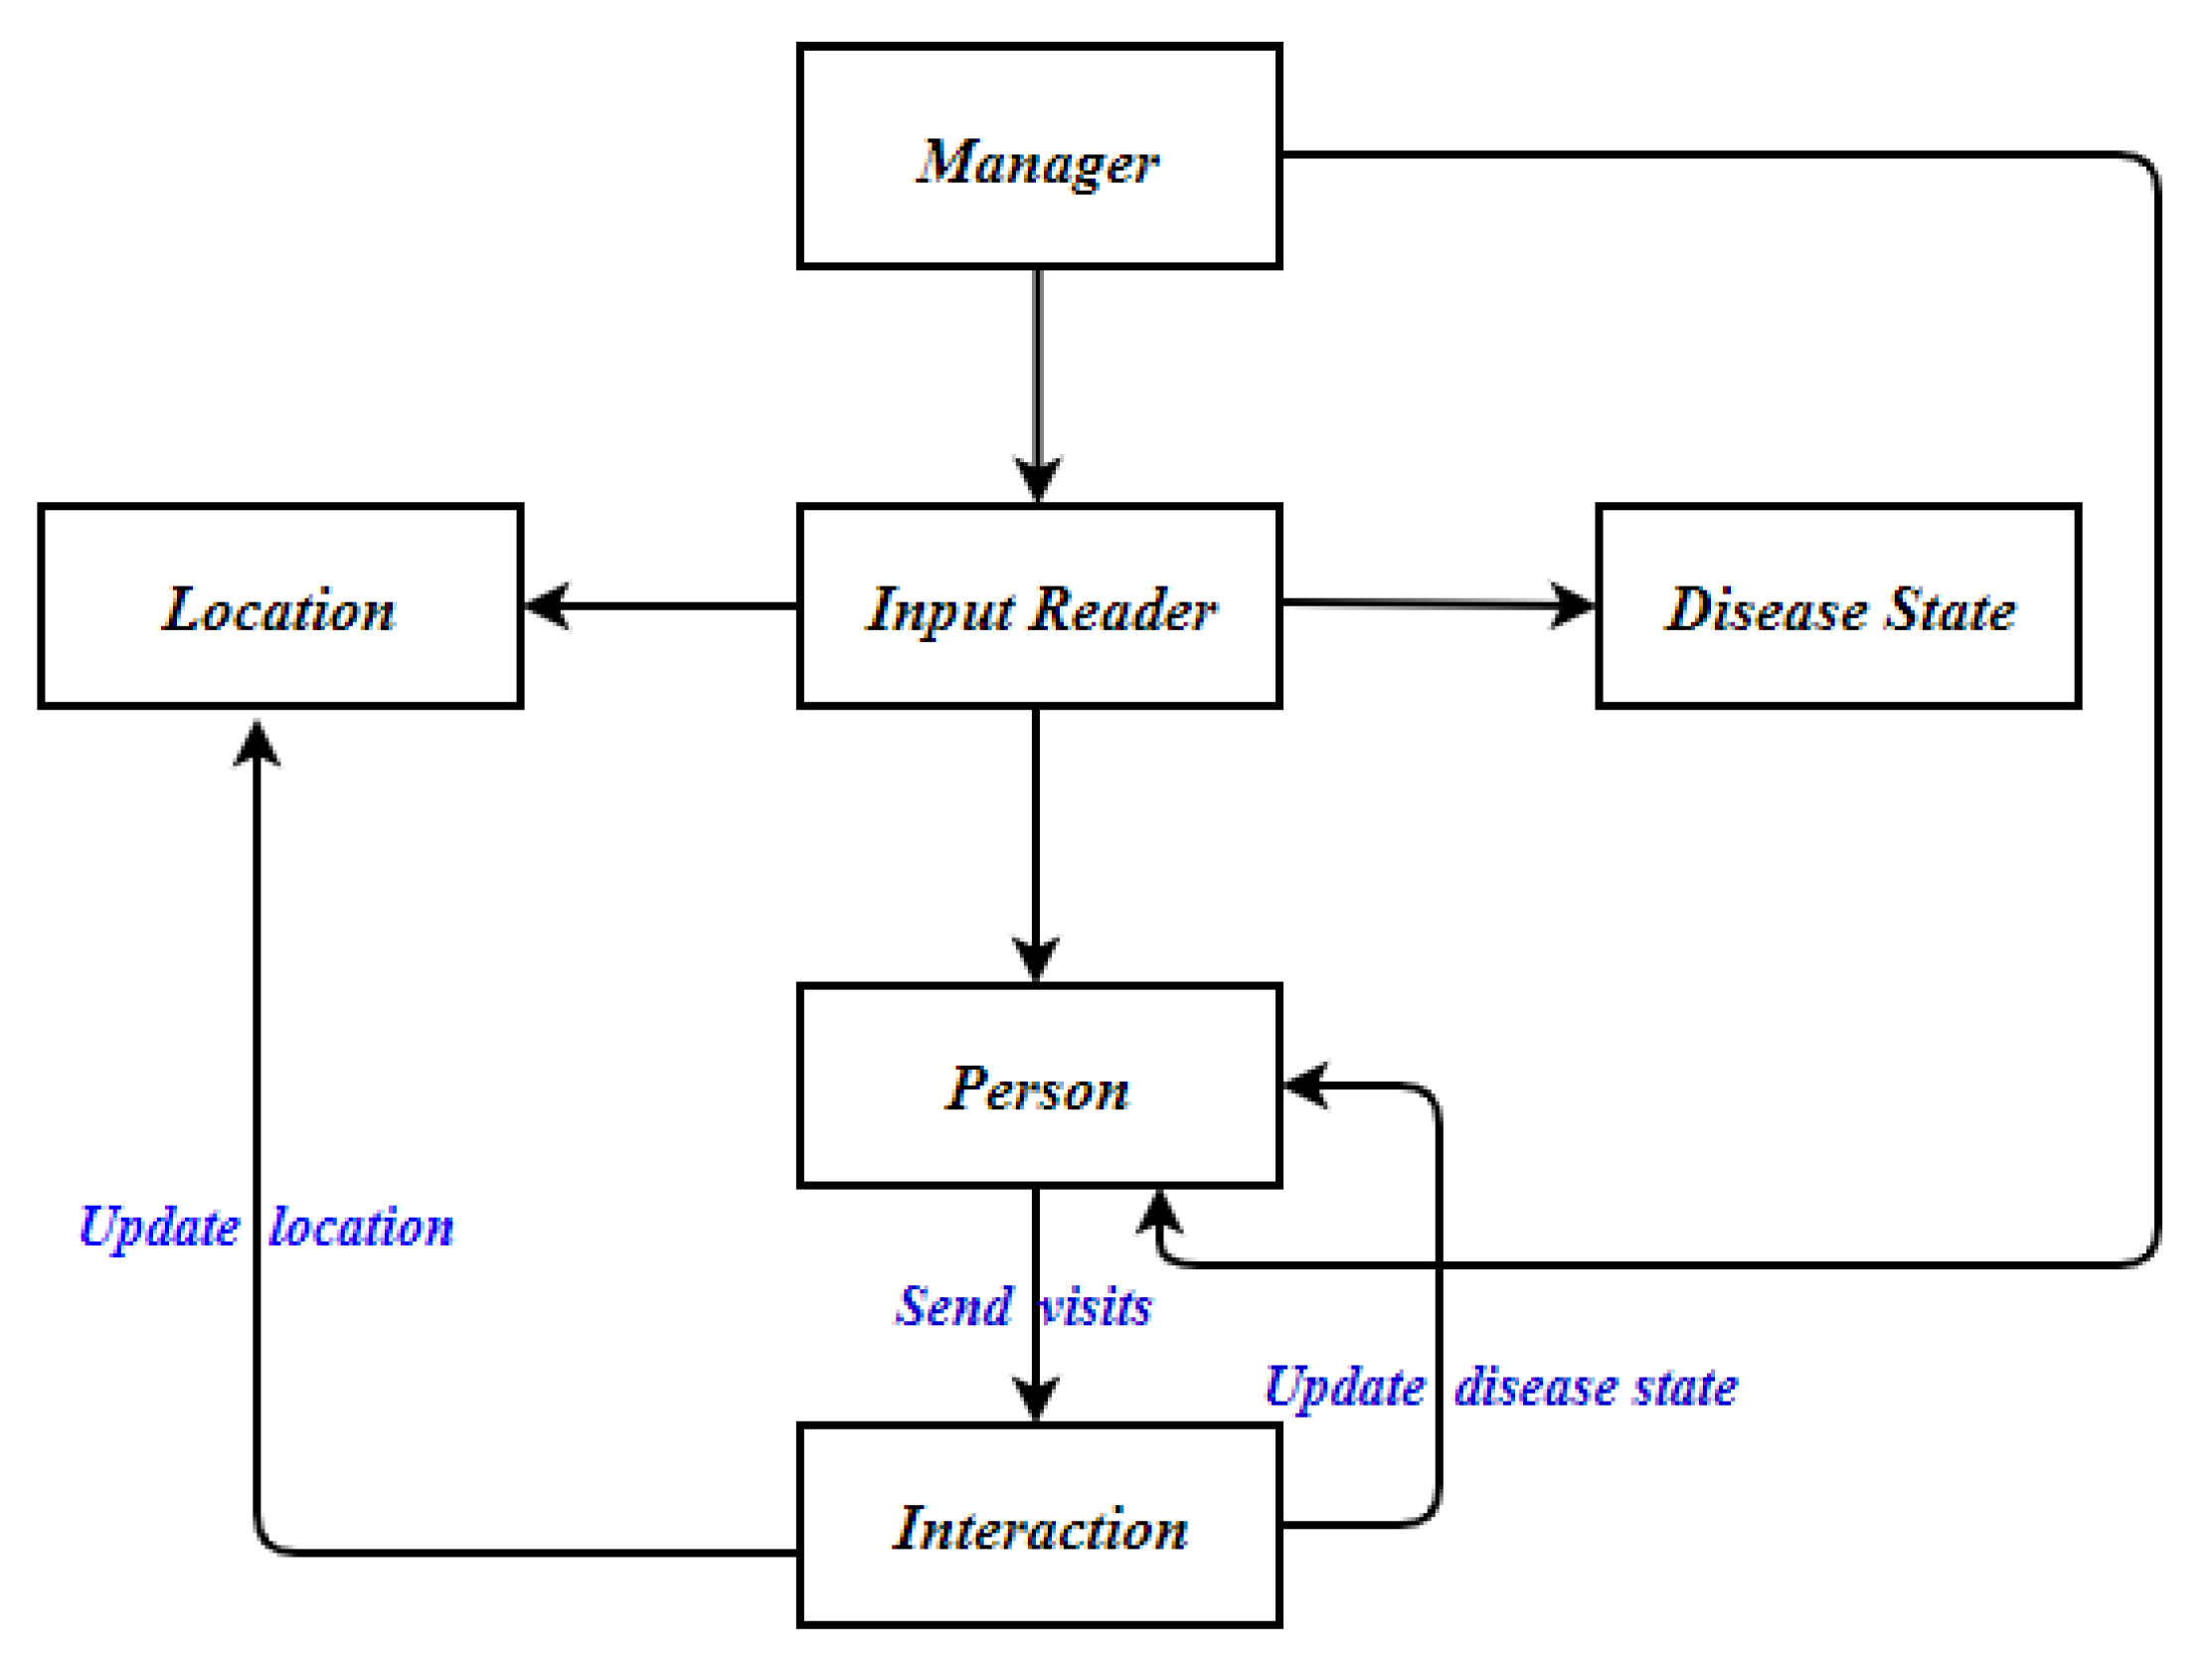
The SIM-D algorithm was implemented in C++ language using the concept of object-oriented programming (OOP). The persons were created using C++ objects interacting with each other objects through messages (function calls). A flowchart of the SIM-D is shown in Figure 4. The flowchart will be improved according to the selection of the disease.
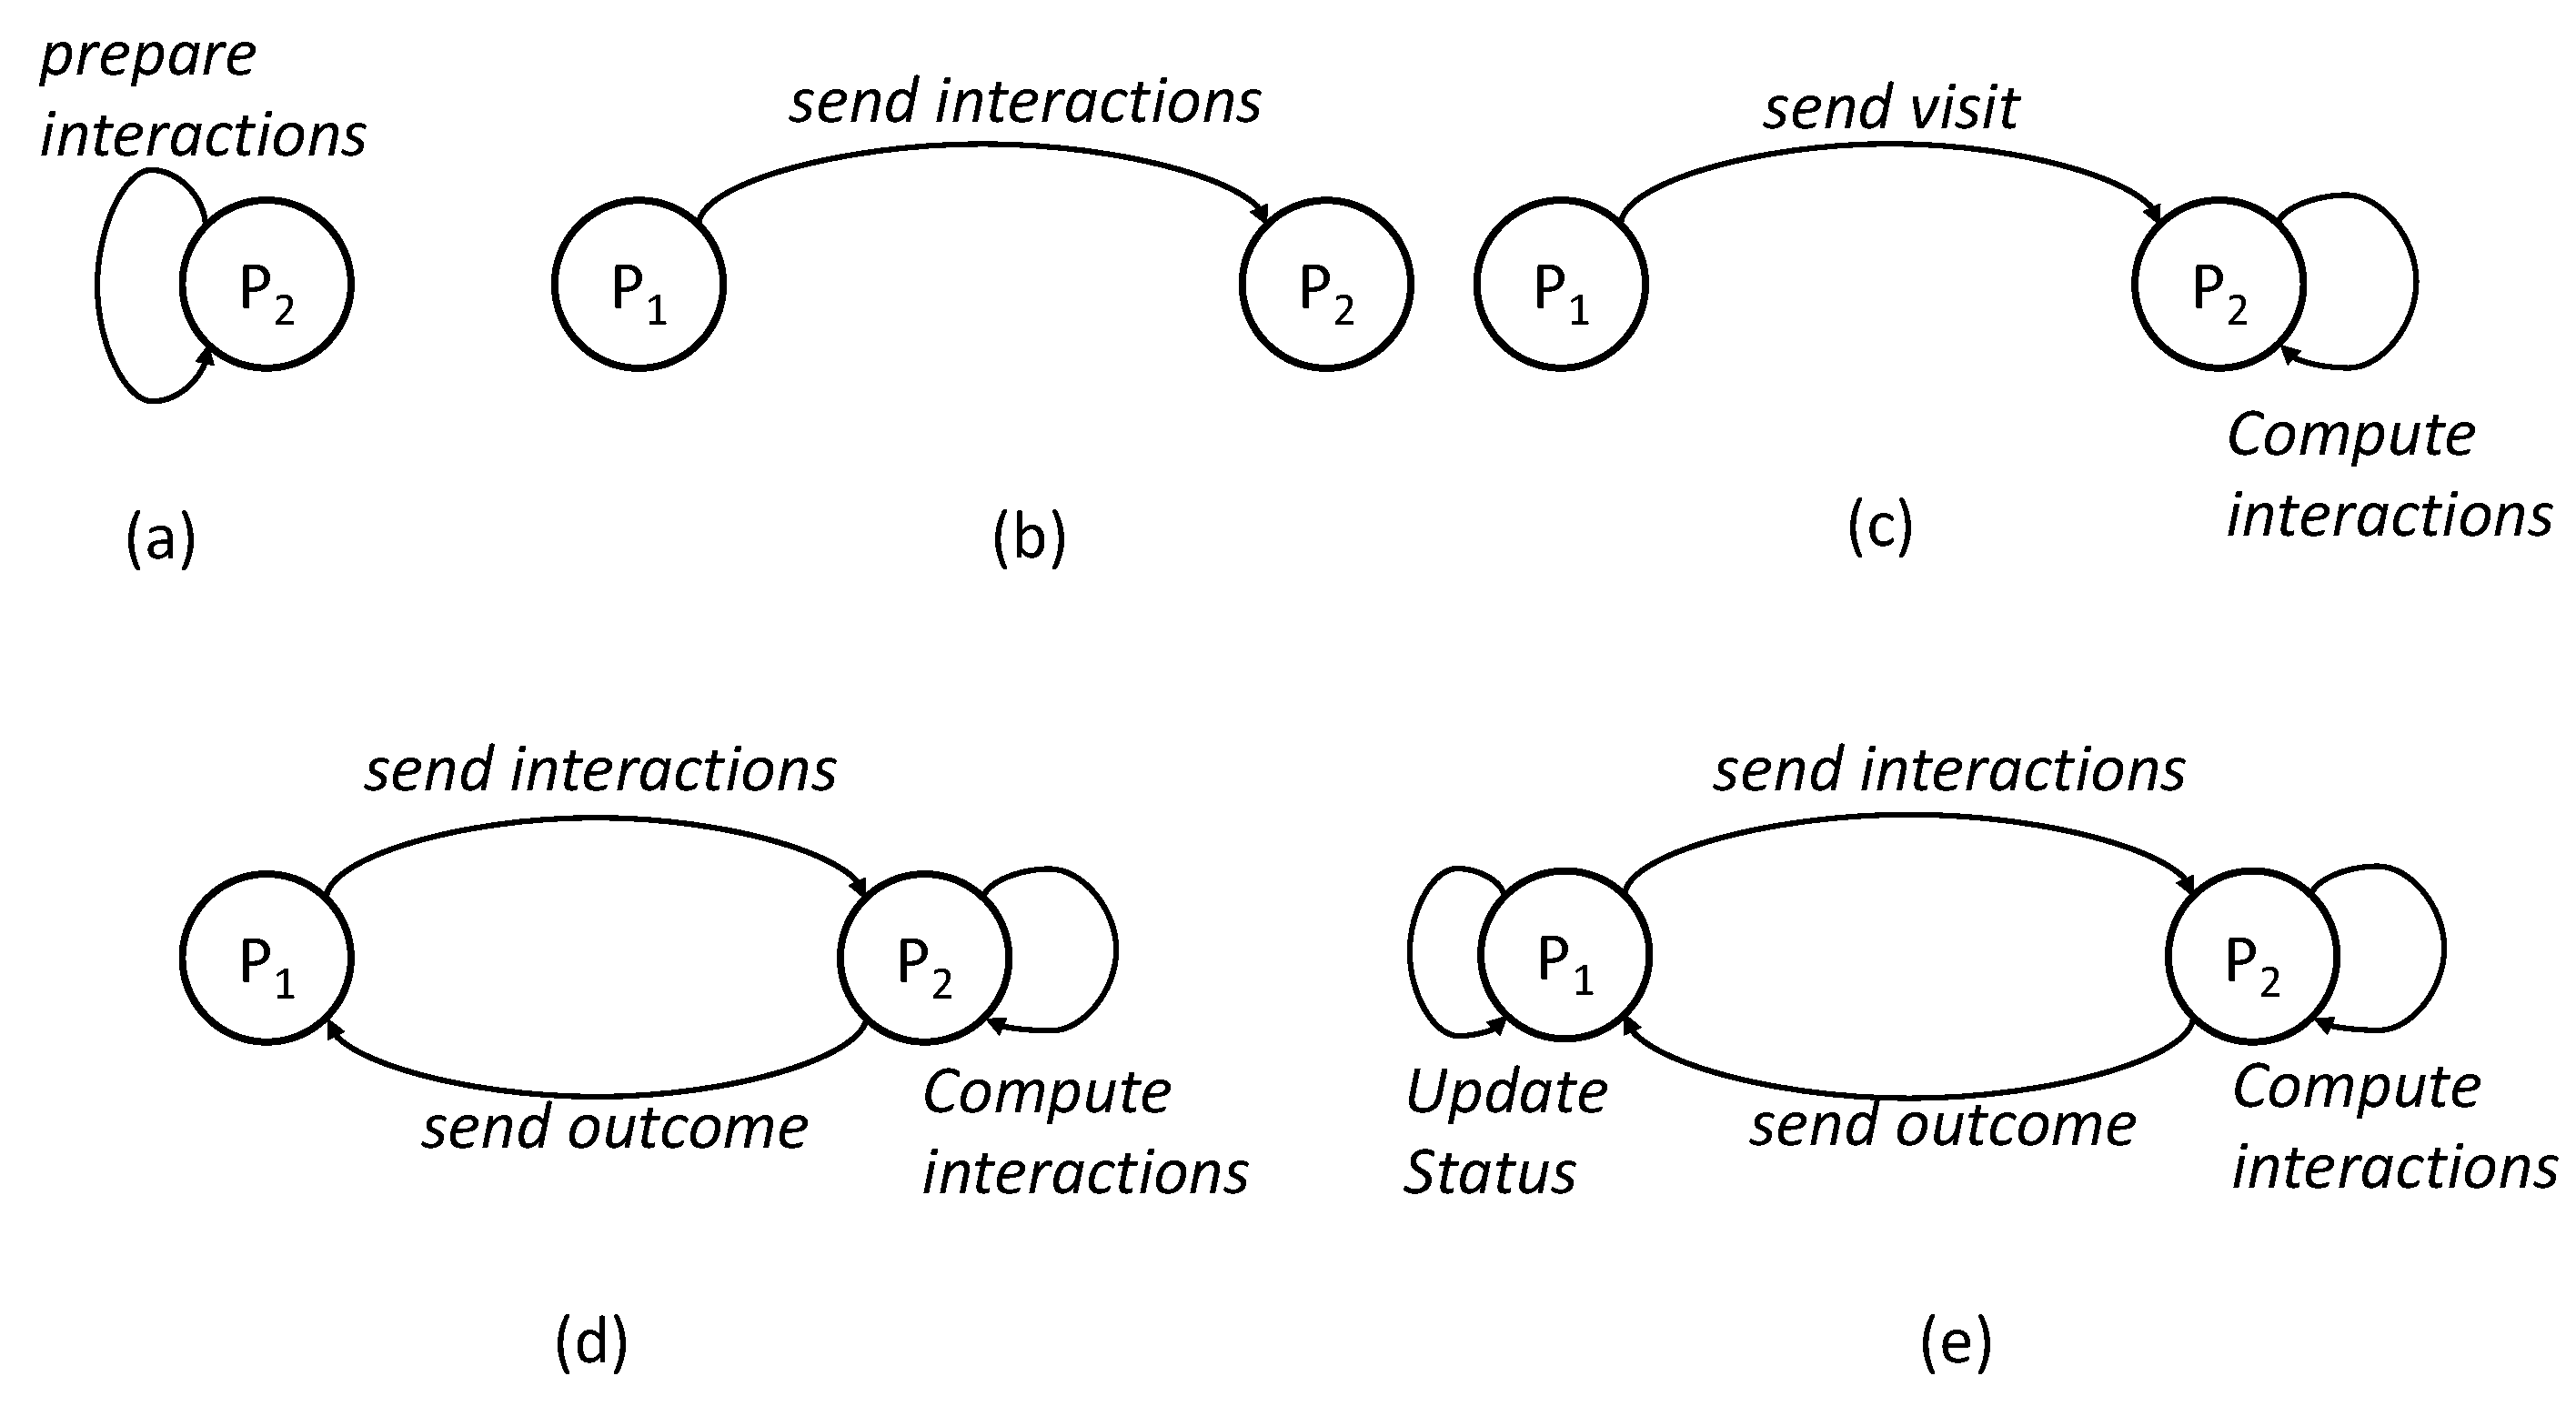
At the start of the simulation, the manager object first calls the input reader to initialize the Person, Location and Disease State objects. The person-person interaction graph is loaded into Person objects and the disease parameters are loaded into Disease State Object. The manager then starts the simulation time-step with the processing of person objects. As shown in Figure 5, each iteration has five basic steps.
- Prepare Interactions—The person objects calculate the interactions that it has to perform with other persons. The interactions are computed based on the input interaction graph, its status (infected or susceptible), its vaccination status and isolation criteria.
- Send Interactions—The person objects send the calculate interactions to intended person objects.
- Compute Interactions—The person objects compute one-to-one interactions between itself and received messages. The probability of infection is calculated using Equation (1).
- Send Outcomes—If an interaction results in an infection, a message is sent to the relevant person object with the outcome of the interaction.
- The person objects and location objects update their status according to the outcome of interactions.
6. Evaluation
In this section, the ability of SIM-D at simulating the spread of disease in a population is demonstrated. It is of interest in showing the spread of disease under normal conditions and to show the effect of different interventions. For each study, SIM-D was evaluated at showing the daily infections and the total number of infections. The variation of persons (agents) in states (susceptible, exposed, infectious and recovered) was also shown over the course of the simulation.
6.1. Experimental Setup
The experiments were performed on a quad-core machine with core i7 processors and 16GB of memory. The simulation was run over population networks of the Peshawar region of Pakistan and was run for 90 time-steps (also called the simulation days). The simulation was run for SIR and SIS models with different transmissibility numbers. The transmissibility, infectious period duration, and incubation period duration are chosen to mimic the spread of flu influenza [15].
6.2. SIR Infection Diffusion in Population
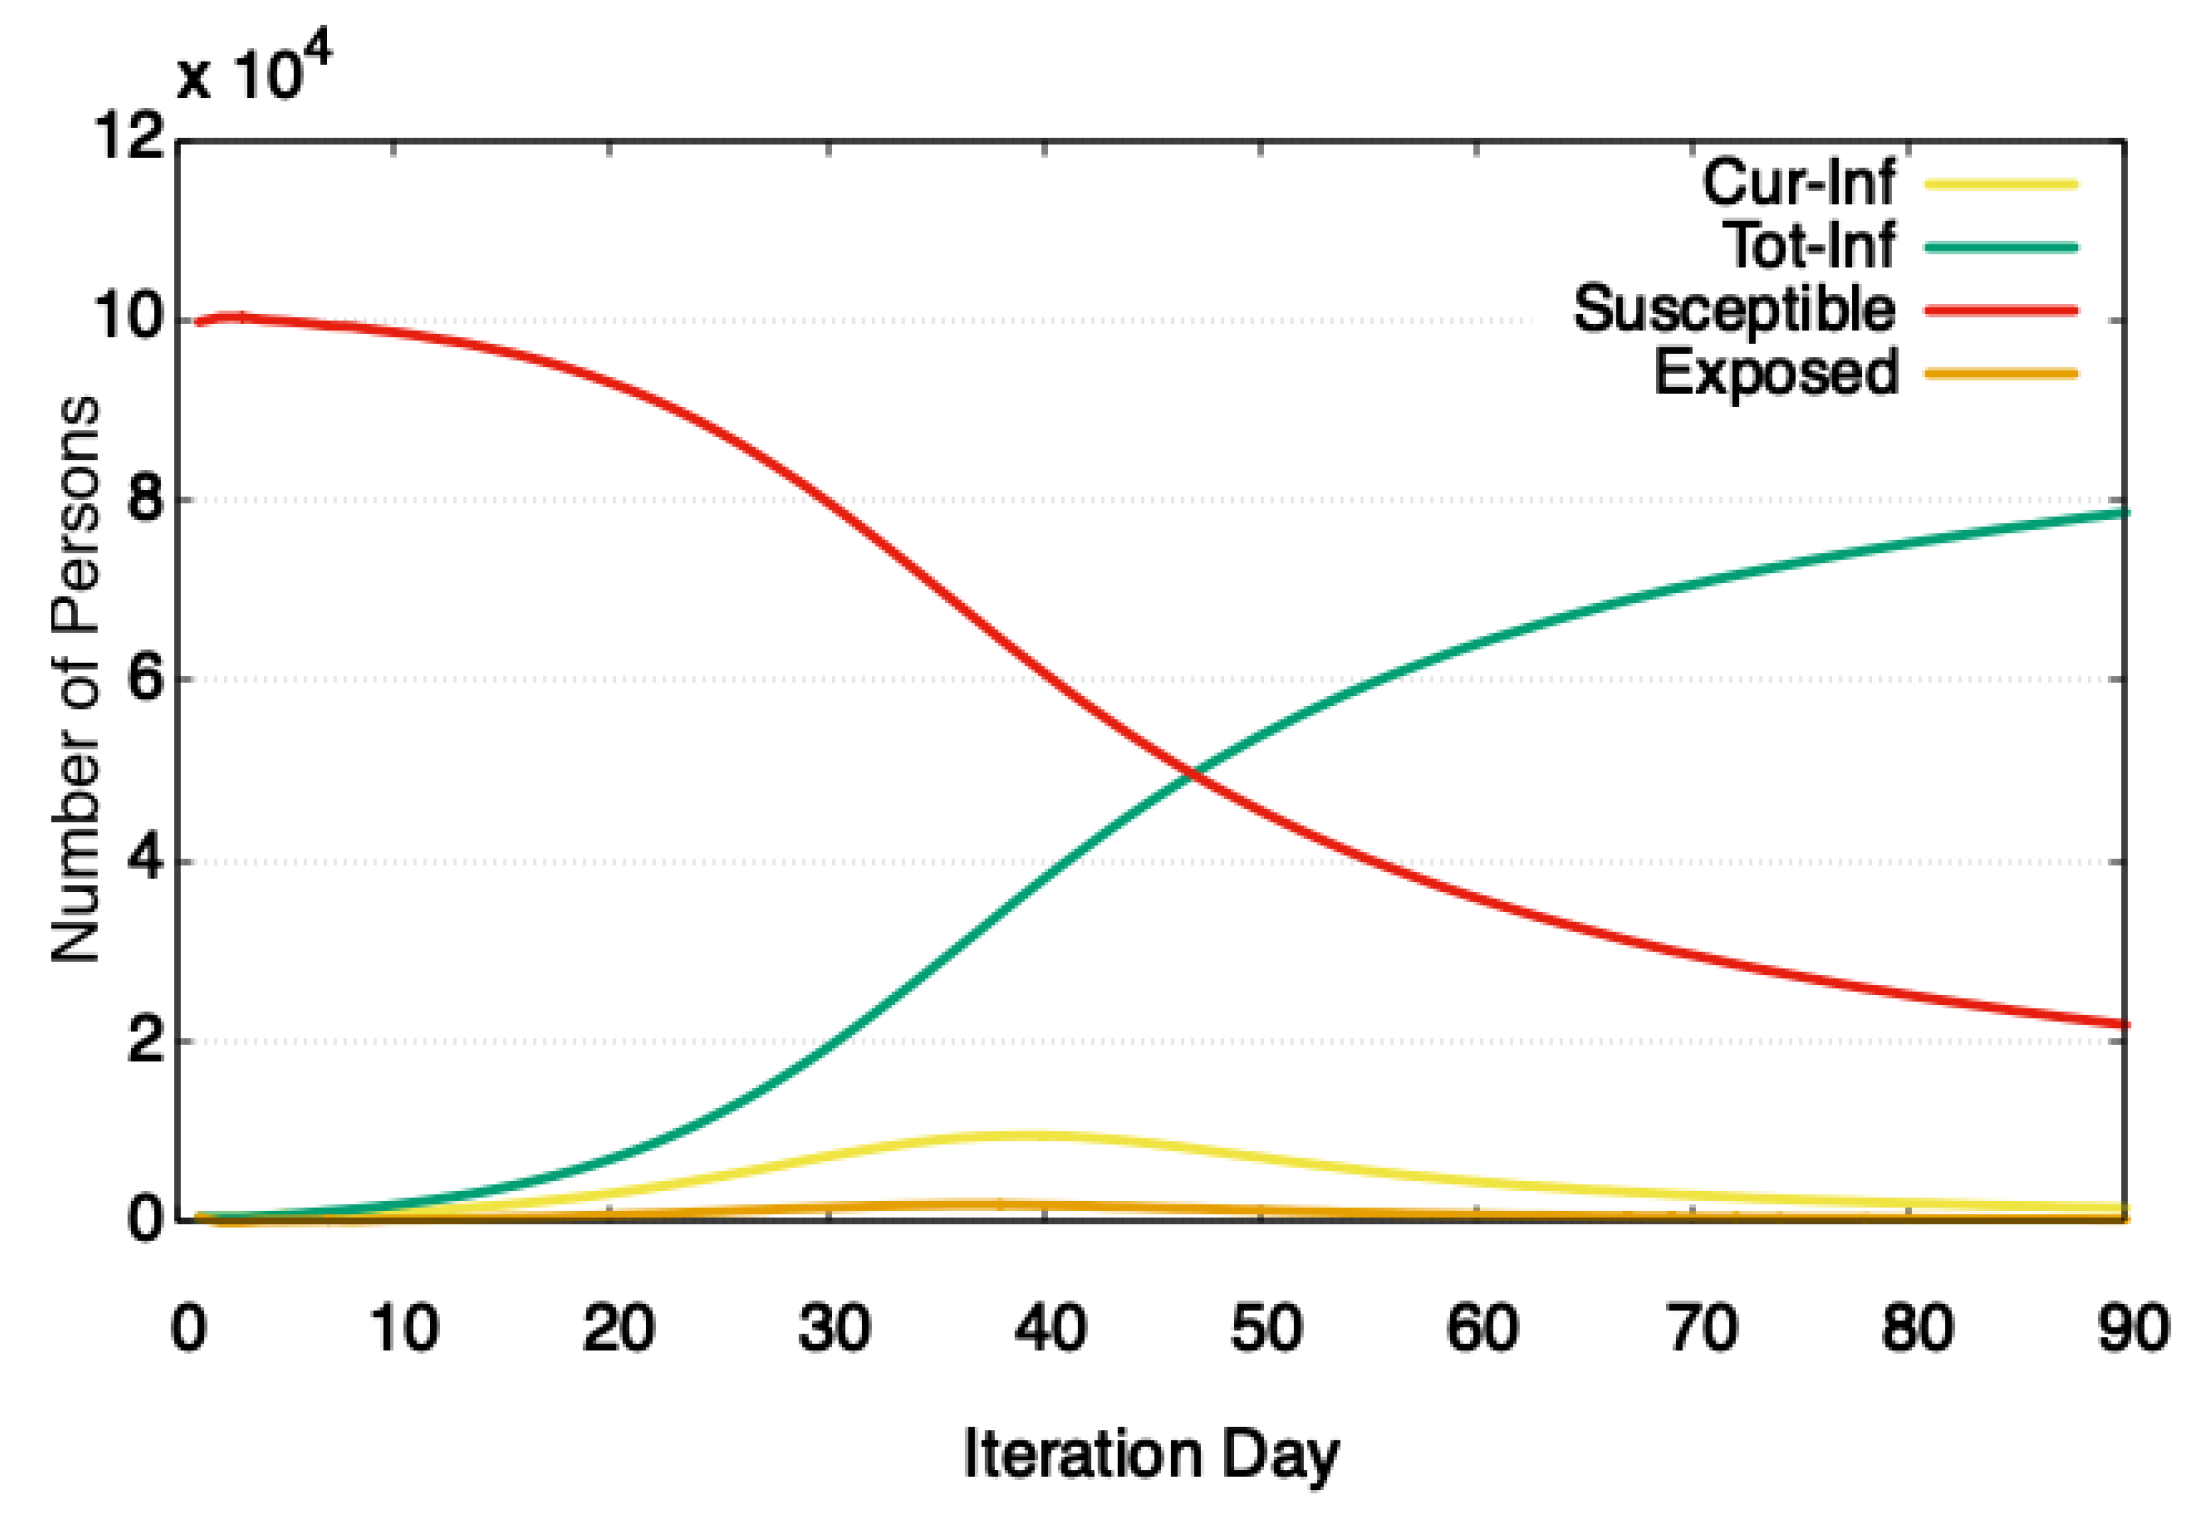
To show the spread of a disease that follows SIR model, a simulation was run over a population network of 100,000 agents. The disease transmissibility was set at 0.036. At the start of the simulation, 500 people were randomly marked as infected. The simulations are run without additional interventions and have an attack rate (total number of people infected in the simulation) of about 70%. Figure 6 shows that as the simulation progresses through steps, more people get infected, reducing the number of susceptible persons. The epidemic peaks around the 40th iteration and then starts falling as more people enter the recovered state. During the course of a simulation, 70% of people got infected. The reason for the high number of total infections is the higher transmissibility of disease and longer times in the infectious state (set at 11 simulation days).
It would be interesting to compare the numbers from SIM-D against the actual spread of infections. However, unfortunately, daily stats about disease spread during the season (Nov–Feb) are not available for Peshawar. A rough comparison can be done against the number of flu influenza cases reported in Khyber Pakhtunkhwa (KP) [44,45] as Peshawar is part of KP, therefore naturally possessing similar demographics. SIM-D was able to report comparative numbers (70,000 in comparison to 55,000 actual cases). One major reason for the difference is that the cases are often not reported and hence do not get recorded.
6.3. SIS Infection Diffusion in Population
To show the ability of SIM-D in modeling diseases, we ran a simulation for simulating the flu influenza over a population network of 100,000 agents. The disease transmissibility was set at 0.040. As is the case with flu influenza, we set the stay in infectious state at 7 simulation days. The incubation duration was set at 1 simulation day, which is a typical latent period for an infected person (with flu influenza) before he starts infecting others. At the start of the simulation, 2000 people were randomly marked as infected.
Figure 7 shows that as the simulation progresses through steps, more people get infected, while the number of susceptible people sharply reduces. The epidemic peaks around the 40th iteration. It is interesting to note that at any time there were no more than than 10% population infected at one time. However, over the course of the simulation, 80% of people got infected. The reason for a high number of total infections is the higher transmissibility of disease. Moreover, no intervention measures were applied, which leaves a major portion of population available for getting infected.
Technically, SIS allows re-infections, however, we do not get reinfections in this study. The reason for this is because in flu influenza, there is a small chance that a person might get infected in 90 days. To mimic this behavior, a recovery period of 90 days is applied. This means that the re-infection could happen after the person becomes susceptible again.
6.4. Effects of Transmissibility
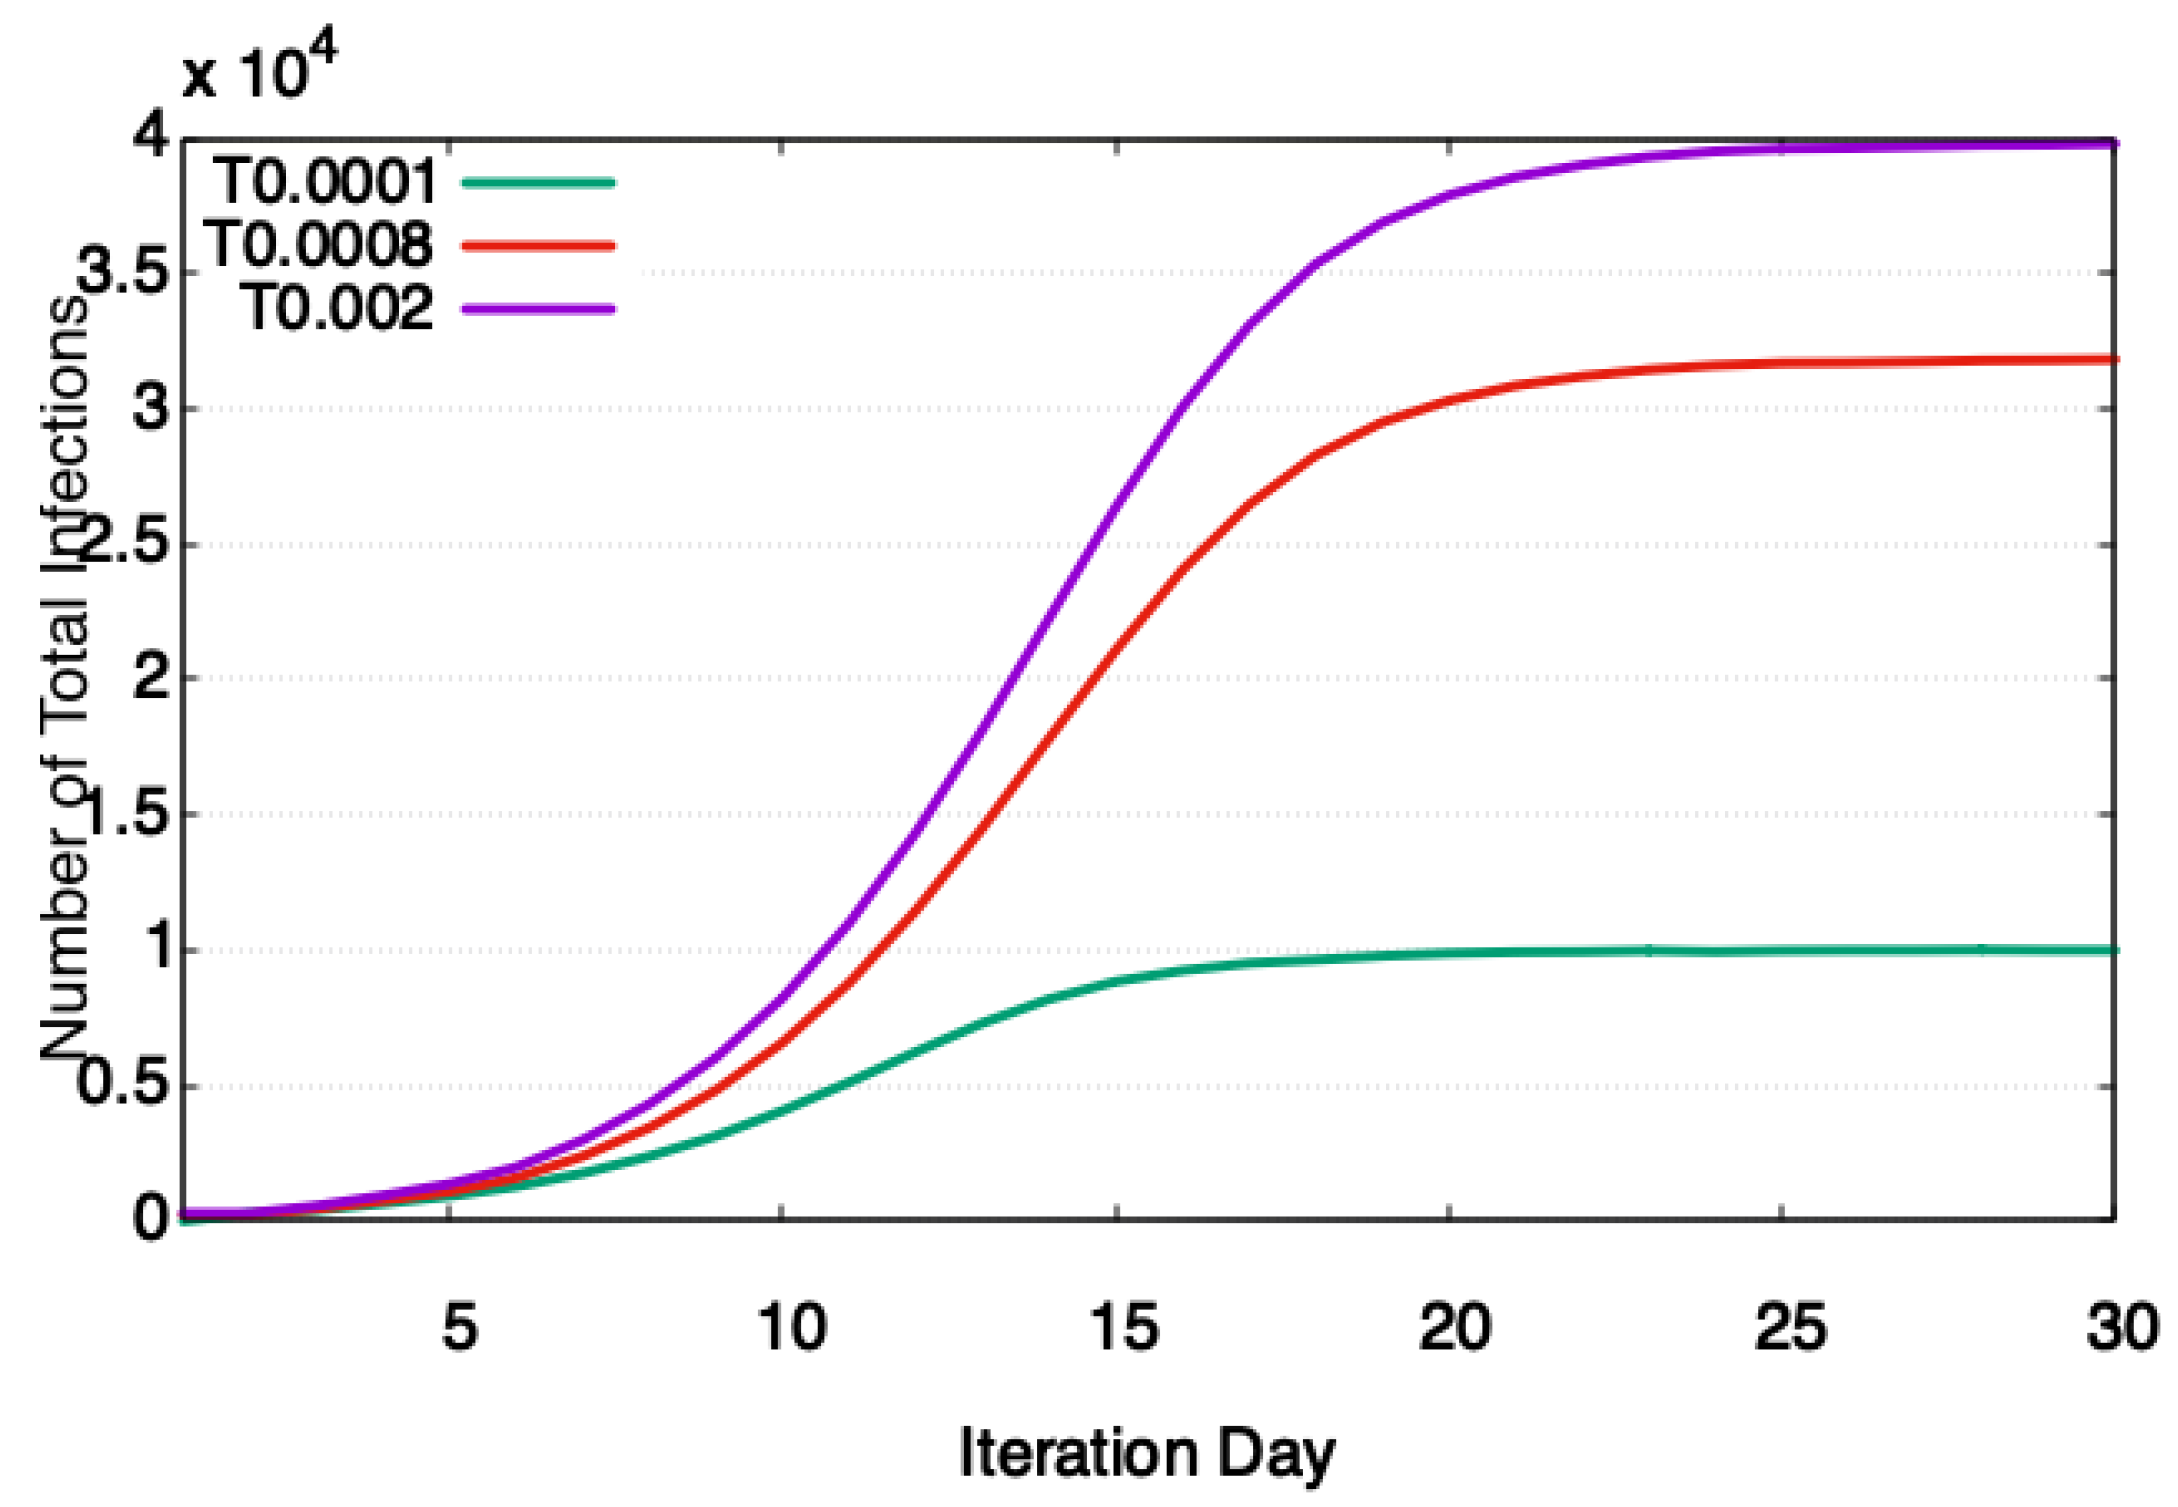
Transmissibility, also known as the attack rate, is the probability of transmission of disease in one minute of contact. In general, the increase in transmissibility results in faster transmission of disease from the infectious to susceptible individual. An experiment was performed using the SIS disease model to show this impact. In the experiment, the infectious period and incubation period were kept fixed at four iteration days and one iteration day, respectively, and vary transmissibility in the range of 0.0001–0.002. The infectious period of four was chosen because, at this infectious period, the compute time is between maximum and minimum. An incubation period of one was chosen to keep the number of people in the incubation state to a minimum. This way, the majority of the population stays in susceptible and infectious states and shows the maximum effect of transmissibility.
Figure 8 shows that as the transmissibility was increased from 0.0001 to 0.002, the number of total infection sharply increases. There are two reasons for this sharp increase. First, higher transmissibility has higher impact on the spread of disease, as can be seen in Equation (1). Therefore, infectious diseases such as COVID-19 (the first disease X is caused by a highly transmissible acute respiratory syndrome coronavirus) tend to spread faster compared to diseases with lower transmissibility such as HIV (HIV viral load and transmissibility of HIV infection—undetectable equals untransmittable).
6.5. Effects of Interventions
To study the progression of disease in the population, the government and health authorities are often interested in the impact of different interventions. Fortunately, SIM-D is capable of modelling the non-pharmaceutical interventions as well. To see the impact of interventions on the disease progression, an experiment was designed. In the experiment, the SIR model was simulated, and two types of interventions were applied to it: isolation and vaccination. In the isolation, the activities of individuals are limited to homes and only 10% of the time are they allowed to perform interactions outside the house. In the vaccination, 50% of the population is randomly vaccinated. A vaccinated person is nine times less susceptible to disease than a healthier person. Figure 9 shows that when 50% of the population is vaccinated, the progression of disease slows down significantly. The peak is also delayed by 10 days. Delay in peak is important as it gives the health authorities more time to respond to the outbreak. Figure 9 also shows the impact of isolation or lockdown on the disease progression. When a lockdown is applied around the 23rd iteration, the number of infections start falling. The disease picks up again slightly around the 50th iteration, when the lockdown was eased (40% of outside the house interactions were allowed).
7. Limitations of SIM-D
- The current version does not cover the seasonal mutations as it happens in different diseases. For example, if we want to simulate the seasonal flu influenza, we can do it using the SIS model given the known parameters (transmissibility, incubation period, infectious period). However, if we want to simulate flu influenza across the seasons, it will not be possible with the current simulation as the virus may mutate and its disease parameters (transmissibility, incubation period, infectious period) may change.
- It is a serial algorithm. Therefore, the number of agents (persons) that SIM-D could simulate are limited (to thousands) at this point.
- Currently, we have Equation 1 that applies to a certain class of diseases. To cover a larger number of diseases, SIM-D has to incorporate more equations.
- In its current form, the model is not directly applicable to other contagions such as habits, fear etc.
- SIM-D is not capable of simulating two diseases at the same time.
- Currently, we are using age, home location, state, and interaction list as a person’s demographics. Interaction list is used for computing interactions with other individuals. Age, home location and state are used for the filtering of simulation output. For example, what are the total number of infections in a particular area or what age group is most affected. The current version of SIM-D does not perform any analysis on these statistics.
- SIM-D does not model pharmaceutical interventions and it would be a good value addition in future.
8. Conclusions and Future Works
The recent wave of COVID-19 has shown that epidemic diseases could spread very quickly and incur huge human and financial losses. The healthcare systems across the globe were not prepared for its fast spread. The isolation or lockdown measures enforced by different countries were not very effective either, as they were not backed by proper simulation and modeling tools. Therefore, it is very important to have an epidemic modeling tool that will help before the epidemic starts and during epidemics get insights into the spread of infectious diseases.
Our simulation tool SIM-D tries to fill this gap by simulating the spread of disease in population. SIM-D is an agent-based model that computes interactions between agents and shows infections at locations over simulation time-steps. It effectively models the realistic behavioral phenomena of persons in a society; this means that the transmission of infectious disease could only occur if an infectious person meets with another susceptible person.
SIM-D is very helpful for the policy-makers and health authorities. It is generic and can simulate the infectious diseases belonging to SIR, SIS and SI disease models. Additionally, it has the capability to show the effect of non-pharmaceutical interventions on the spread of disease.
As part of future work, we would like to extend the functionality of SIM-D to all contagions, such as the spread of fear, information, habits and rumors. We would also like to develop parallel algorithms of SIM-D to increase its performance capacity to simulate larger data-sets and more complex interventions. An addition that covers mutations of diseases (viruses) will be a valuable addition and we plan to do that as well. A post simulation analysis on the statistics (i.e., age-groups and localities effected) would give us more insights and should be considered as a future work. Furthermore, the current version does not support the pharmaceutical interventions and it would be a good addition in future work. A GUI interface to the software will make it easier to use for the end-users, helping them perform quick analysis without understanding the complexities of the system.
In future, we would like to use more personal demographics like age, gender, social status, literacy, economic condition etc. to model the person in a better way. Equations that compute the individual and collective effects of these demographic will help in further improving the SIM-D model.
Author Contributions
Conceptualization, M.W., T.K. and A.K.; methodology, M.W., T.K., T.-W.U. and A.K.; software, M.W., T.K. and Z.U.Z.; validation, T.K., Z.U.Z., T.-W.U. and A.K.; formal analysis, T.K., T.-W.U. and A.K.; investigation, M.W., Z.U.Z. and T.K.; resources, T.K. and T.-W.U.; data curation, M.W. and T.K.; writing—original draft preparation, M.W. and T.K.; writing—review and editing, M.W., T.K. and T.-W.U.; visualization, M.W., T.-W.U. and T.K.; project administration, T.-W.U.; and funding acquisition, T.-W.U. All authors have read and agreed to the published version of the manuscript.
Funding
This work was supported by the Institute of Information & communications Technology Planning & Evaluation (IITP) grant funded by the Korea government (MSIT) (No. 2020-0-00833).
Conflicts of Interest
The authors declare that they have no conflict of interest.
Abbreviations
| WHO | World Health Organization |
| SEIR | Susceptible Exposed Infectious Recovered |
| SIR | Susceptible Infectious Recovered |
| SIS | Susceptible Infectious Susceptible |
| SI | Susceptible Infectious |
| FSM | Finite State Machine |
| STEM | Spatiotemporal Epidemiological Modeler |
| OOP | Object-Oriented Programming |
References
- Wang, C.; Pan, R.; Wan, X.; Tan, Y.; Xu, L.; Ho, C.S.; Ho, R.C. Immediate psychological responses and associated factors during the initial stage of the 2019 coronavirus disease (COVID-19) epidemic among the general population in China. Int. J. Environ. Res. Public Health 2020, 17, 1729. [Google Scholar] [CrossRef] [Green Version]
- Alexandre, D.; El Ayadi, A.; Sidibe, S.; Delvaux, T.; Camara, B.; Sandouno, S.D.; Beavogui, A.; Rutherford, G.; Okumura, J.; Zhang, W.H.; et al. Effect of Ebola virus disease on maternal and child health services in Guinea: A retrospective observational cohort study. Lancet Glob. Health 2017, 448–457. [Google Scholar] [CrossRef] [Green Version]
- WHO. A World at Risk: Annual Report on Global Preparedness for Health Emergencies. Available online: https://www.preventionweb.net/publications/view/67706 (accessed on 25 March 2020).
- WHO. Worldometer. Available online: https://www.worldometers.info/coronavirus/ (accessed on 2 April 2020).
- Chakraborty, I.; Maity, P. COVID-19 Outbreak: Migration, Effects on Society, Global Environment and Prevention. Sci. Total Environ. 2020, 728, 138882. [Google Scholar] [CrossRef]
- Alvarez, F.E.; Argente, D.; Lippi, F. A Simple Planning Problem for COVID-19 Lockdown. 2020. Available online: https://ideas.repec.org/p/nbr/nberwo/26981.html (accessed on 27 March 2020).
- Contreras, G.W. Getting ready for the next pandemic COVID-19: Why we need to be more prepared and less scared. J. Emerg. Manag. (Weston Mass.) 2020, 18, 87–89. [Google Scholar] [CrossRef]
- Chowell, G.; Sattenspiel, L.; Bansal, S.; Viboud, C. Mathematical models to characterize early epidemic growth: A Review. Phys. Life Rev. 2016, 66–97. [Google Scholar] [CrossRef] [Green Version]
- Sharkey, K.J. Deterministic Epidemiological Models at the Individual Level. J. Math. Biol. 2008, 57, 311–331. [Google Scholar] [CrossRef] [Green Version]
- Garner, M.; Hamilton, S. Principles of epidemiological modelling. Rev. Sci. Tech. (Int. Off. Epizoot.) 2011, 30, 407–416. [Google Scholar] [CrossRef] [PubMed]
- Barrett, C.; Bisset, K.; Eubank, S.; Feng, X.; Marathe, M. EpiSimdemics: An efficient algorithm for simulating the spread of infectious disease over large realistic social networks. In Proceedings of the 2008 ACM/IEEE Conference on Supercomputing SC ’08, Austin, TX, USA, 15–21 November 2008; pp. 1–12. [Google Scholar] [CrossRef]
- Bisset, K.R.; Aji, A.M.; Bohm, E.; Kale, L.V.; Kamal, T.; Marathe, M.V.; Yeom, J. Simulating the Spread of Infectious Disease over Large Realistic Social Networks Using Charm++. In Proceedings of the 2012 IEEE 26th International Parallel and Distributed Processing Symposium Workshops PhD Forum, Shanghai, China, 21–25 May 2012; pp. 507–518. [Google Scholar]
- Eubank, S. Scalable, efficient epidemiological simulation. In Proceedings of the 2002 ACM Symposium on Applied Computing; Association for Computing Machinery: New York, NY, USA, 2002; pp. 139–145. [Google Scholar] [CrossRef] [Green Version]
- d’Alché Buc, F.; Schachter, V. Modeling and simulation of biological networks. In Proceedings of the International Symposium on Applied Stochastic Models and Data Analysis, Brest, France, 17–20 May 2005. [Google Scholar]
- Cauldwell, A.V.; Long, J.S.; Moncorgé, O.; Barclay, W.S. Viral determinants of influenza A virus host range. J. Gen. Virol. 2014, 95, 1193–1210. [Google Scholar] [CrossRef] [PubMed] [Green Version]
- Veljkovic, V.; Veljkovic, N.; Muller, C.P.; Müller, S.; Glisic, S.; Perovic, V.; Köhler, H. Characterization of conserved properties of hemagglutinin of H5N1 and human influenza viruses: Possible consequences for therapy and infection control. BMC Struct. Biol. 2009, 9, 21. [Google Scholar] [CrossRef] [Green Version]
- Johnson, T.; McQuarrie, B. Mathematical modeling of diseases: Susceptible-infected-recovered (sir) model. In Proceedings of the Math 4901 Senior Seminar, University of Minnesota, Morris, MN, USA, 12 January 2009. [Google Scholar]
- Laubenbacher, R. Modeling and Simulation of Biological Networks; American Mathematical Soc.: Providence, RI, USA, 2007; Volume 64. [Google Scholar]
- Bisset, K.; Chen, J.; Feng, X.; Kumar, S.; Marathe, M. EpiFast: A fast algorithm for large scale realistic epidemic simulations on distributed memory systems. In Proceedings of the International Conference on Supercomputing; Association for Computing Machinery: New York, NY, USA, 2009; pp. 430–439. [Google Scholar] [CrossRef]
- Reluga, T.; Medlock, J.; Perelson, A. Backward Bifurcations and Multiple Equilibria in Epidemic Models with Structured Immunity. J. Theor. Biol. 2008, 252, 155–165. [Google Scholar] [CrossRef] [Green Version]
- Keeling, M.J.; Rohani, P. Modeling Infectious Diseases in Humans and Animals; Princeton University Press: Princeton, NJ, USA, 2008; Available online: https://www.jstor.org/stable/j.ctvcm4gk0 (accessed on 4 April 2020).
- Thieme, H. Persistence under Relaxed Point-Dissipativity (with Application to an Endemic Model). SIAM J. Math. Anal. 1993, 24, 407–435. [Google Scholar] [CrossRef]
- Institute of Medicine. Modeling Community Containment for Pandemic Influenza: A Letter Report; The National Academies Press: Washington, DC, USA, 2006; Available online: https://www.nap.edu/catalog/11800/modeling-community-containment-for-pandemic-influenza-a-letter-report (accessed on 9 April 2020).
- Riley, S. Large-Scale Spatial-Transmission Models of Infectious Disease. Science (N. Y.) 2007, 316, 1298–1301. [Google Scholar] [CrossRef] [PubMed] [Green Version]
- Ferguson, N.; Keeling, M.; Edmunds, W.; Gani, R.; Grenfell, B.; Anderson, R.; Leach, S. Planning for Smallpox Outbreaks. Nature 2003, 425, 681–685. [Google Scholar] [CrossRef]
- Posny, D.; Wang, J. Computing the basic reproductive numbers for epidemiological models in nonhomogeneous environments. Appl. Math. Comput. 2014, 242, 473–490. [Google Scholar] [CrossRef]
- Courtejoie, N.; Zanella, G.; Durand, B. Bluetongue transmission and control in Europe: A systematic review of compartmental mathematical models. Prev. Vet. Med. 2018, 156, 113–125. [Google Scholar] [CrossRef] [PubMed]
- Ballesteros, A.; Blasco, A.; Gutierrez-Sagredo, I. Hamiltonian Structure of Compartmental Epidemiological Models. arXiv 2020, arXiv:2006.00564. [Google Scholar]
- Eubank, S.; Guclu, H.; Kumar, S.; Marathe, M.; Srinivasan, A.; Toroczkai, Z.; Wang, N. Modeling Disease Outbreaks in Realistic Urban Social Networks. Nature 2004, 429, 180–184. [Google Scholar] [CrossRef]
- Kwok, K.; Tang, A.; Wei, V.W.I.; Park, W.; Yeoh, E.; Riley, S. Epidemic Models of Contact Tracing: Systematic Review of Transmission Studies of Severe Acute Respiratory Syndrome and Middle East Respiratory Syndrome. Comput. Struct. Biotechnol. J. 2019, 17, 186–194. [Google Scholar] [CrossRef]
- Jenness, S.; Goodreau, S.; Morris, M. EpiModel: An R Package for Mathematical Modeling of Infectious Disease over Networks. J. Stat. Softw. 2018, 84, 1–47. [Google Scholar] [CrossRef] [Green Version]
- Hunter, E.; Mac Namee, B.; Kelleher, J. A Taxonomy for Agent-Based Models in Human Infectious Disease Epidemiology. J. Artif. Soc. Soc. Simul. 2017, 20, 1–2. [Google Scholar] [CrossRef] [Green Version]
- Mniszewski, S.; Del Valle, S.; Stroud, P.; Riese, J.; Sydoriak, S. EpiSimS simulation of a multi-component strategy for pandemic influenza. In Proceedings of the 2008 Spring Simulation Multiconference, SpringSim 2008, Ottawa, ON, Canada, 14–17 April 2008; pp. 556–563. [Google Scholar] [CrossRef]
- Bhatele, A.; Yeom, J.; Jain, N.; Kuhlman, C.J.; Livnat, Y.; Bisset, K.R.; Kale, L.V.; Marathe, M.V. Massively Parallel Simulations of Spread of Infectious Diseases over Realistic Social Networks. In Proceedings of the 2017 17th IEEE/ACM International Symposium on Cluster, Cloud and Grid Computing (CCGRID), Madrid, Spain, 14–17 May 2017; pp. 689–694. [Google Scholar] [CrossRef]
- Cliff, O.M.; Harding, N.; Piraveenan, M.; Erten, E.Y.; Gambhir, M.; Prokopenko, M. Investigating spatiotemporal dynamics and synchrony of influenza epidemics in Australia: An agent-based modelling approach. Simul. Model. Pract. Theory 2018, 87, 412–431. [Google Scholar] [CrossRef] [Green Version]
- Longini, I.; Nizam, A.; Xu, S.; Ungchusak, K.; Hanshaoworakul, W.; Cummings, D.; Halloran, M. Containing Pandemic Influenza at the Source. Science (N. Y.) 2005, 309, 1083–1087. [Google Scholar] [CrossRef] [PubMed] [Green Version]
- GLEAMviz Simulator. Available online: Gleamviz:http://www.gleamviz.org/simulator/GLEAMviz_client_manual_v6.8.pdf (accessed on 3 February 2020).
- Rodrigues, H.S.; Monteiro, M.T.T.; Torres, D.F. Vaccination models and optimal control strategies to dengue. Math. Biosci. 2014, 247, 1–12. [Google Scholar] [CrossRef] [PubMed] [Green Version]
- Lana, R.M.; Carneiro, T.G.; Honório, N.A.; Codeco, C.T. Seasonal and nonseasonal dynamics of Aedes aegypti in Rio de Janeiro, Brazil: Fitting mathematical models to trap data. Acta Trop. 2014, 129, 25–32. [Google Scholar] [CrossRef]
- Medeiros, L.; Castilho, C.; Braga, C.; Souza, W.; Regis, L.; Monteiro, A. Modeling the Dynamic Transmission of Dengue Fever: Investigating Disease Persistence. PLoS Negl. Trop. Dis. 2011, 5, e942. [Google Scholar] [CrossRef]
- Edlund, S.B.; Davis, M.A.; Kaufman, J.H. The Spatiotemporal Epidemiological Modeler. In Proceedings of the 1st ACM International Health Informatics Symposium; Association for Computing Machinery: New York, NY, USA, 2010; pp. 817–820. [Google Scholar] [CrossRef]
- Hladish, T.; Melamud, E.; Barrera, L.; Galvani, A.; Meyers, L. EpiFire: An open source C++ library and application for contact network epidemiology. BMC Bioinform. 2012, 13, 76. [Google Scholar] [CrossRef] [PubMed] [Green Version]
- Fox, S.J.; Miller, J.C.; Meyers, L.A. Seasonality in risk of pandemic influenza emergence. PLoS Comput. Biol. 2017, 13. [Google Scholar] [CrossRef] [Green Version]
- Farrukh, M.J.; Ming, L.C.; Zaidi, S.T.; Khan, T. Barriers and strategies to improve influenza vaccination in Pakistan. J. Infect. Public Health 2017, 10, 881–883. [Google Scholar] [CrossRef]
- Nisar, N.; Badar, N.; Aamir, U.B.; Yaqoob, A.; Tripathy, J.P.; Laxmeshwar, C.; Munir, F.; Zaidi, S.S.Z. Seasonality of influenza and its association with meteorological parameters in two cities of Pakistan: A time series analysis. PLOS ONE 2019, 14, e0219376. [Google Scholar] [CrossRef] [PubMed] [Green Version]
Figure 1.
The four states of a basic Susceptible-Exposed-Infectious-Recovered (SEIR) disease model. (), (), and () show the dwell times in exposed, infectious, and recovered states, respectively. The model can be used to describe (SIR), susceptible-infectious-susceptible (SIS) and susceptible-infectious (SI) disease models.

Figure 2.
A simple disease model that shows the progression of disease within an agent. Ovals represent disease states, while the lines represent the transition between states. The labels on lines show the probabilities of transitions.
Figure 2.
A simple disease model that shows the progression of disease within an agent. Ovals represent disease states, while the lines represent the transition between states. The labels on lines show the probabilities of transitions.

Figure 3.
A simple population network graph. The vertices represent persons and the edges show interactions between them. The weights on vertices show the demographics of the individuals.
Figure 3.
A simple population network graph. The vertices represent persons and the edges show interactions between them. The weights on vertices show the demographics of the individuals.

Figure 4.
The SIM-D simulator flowchart. The Manager reads population network files and assigns population network to Persons, and disease parameters to Disease State. The Persons interact with other persons and update its status when interaction has outcome. The persons also update locations when outcome is calculated.

Figure 5.
Five steps of a simulation day. (a) A person compute interactions for the day. (b) A person sends interactions to other interacting persons. (c) Person performs interaction between received requests. (d) Person send outcomes to sending person if infection happens (e) Persons and locations updates their status.

Figure 6.
Modeling of SIR using SIM-D. The number of people in different states varies as the simulation progresses through steps.
Figure 6.
Modeling of SIR using SIM-D. The number of people in different states varies as the simulation progresses through steps.

Figure 7.
Modeling of SIS using SIM-D. The number of people in different states vary as the simulation progresses through steps.
Figure 7.
Modeling of SIS using SIM-D. The number of people in different states vary as the simulation progresses through steps.

Figure 8.
SIM-D showing the effect of transmissibility on the number of total infections. At very small values of transmissibility (0.0001), the attack rate is 10%. At transmissibility of 0.0008, the attack rate is 33%. At transmissibility of 0.002, the attack rate is 40%.
Figure 8.
SIM-D showing the effect of transmissibility on the number of total infections. At very small values of transmissibility (0.0001), the attack rate is 10%. At transmissibility of 0.0008, the attack rate is 33%. At transmissibility of 0.002, the attack rate is 40%.

Figure 9.
Effect of interventions on the spread of disease. In no intervention case, the attack rate is 35%. In the isolation case, the attack rate is 18%. In the vaccination case, the attack rate is 13%.
Figure 9.
Effect of interventions on the spread of disease. In no intervention case, the attack rate is 35%. In the isolation case, the attack rate is 18%. In the vaccination case, the attack rate is 13%.


Table 1.
Typical influenza ranges for disease state parameters.
| Disease State | Math Term | Typical Influenza Range (Days) |
|---|---|---|
| Exposed | 1–2 | |
| Infectious | 3–7 | |
| Recovered |
Fixed at Simulation Length.
Table 2.
Shows the dwell times in different disease states for SIR, SIS and SI disease models [21].
Table 2.
Shows the dwell times in different disease states for SIR, SIS and SI disease models [21].
| Model | |||
|---|---|---|---|
| SIR | 0–∞ | 0–∞ | ∞ |
| SIS | 0–∞ | 0–∞ | 0 |
| SI | 0–∞ | N/A |
Fixed at Simulation Length.
Publisher’s Note: MDPI stays neutral with regard to jurisdictional claims in published maps and institutional affiliations. |
© 2020 by the authors. Licensee MDPI, Basel, Switzerland. This article is an open access article distributed under the terms and conditions of the Creative Commons Attribution (CC BY) license (http://creativecommons.org/licenses/by/4.0/).
Share and Cite
MDPI and ACS Style
Waleed, M.; Um, T.-W.; Kamal, T.; Khan, A.; Zahid, Z.U. SIM-D: An Agent-Based Simulator for Modeling Contagion in Population. Appl. Sci. 2020, 10, 7745. https://doi.org/10.3390/app10217745
AMA Style
Waleed M, Um T-W, Kamal T, Khan A, Zahid ZU. SIM-D: An Agent-Based Simulator for Modeling Contagion in Population. Applied Sciences. 2020; 10(21):7745. https://doi.org/10.3390/app10217745
Chicago/Turabian StyleWaleed, Muhammad, Tai-Won Um, Tariq Kamal, Aftab Khan, and Zaka Ullah Zahid. 2020. "SIM-D: An Agent-Based Simulator for Modeling Contagion in Population" Applied Sciences 10, no. 21: 7745. https://doi.org/10.3390/app10217745
Note that from the first issue of 2016, this journal uses article numbers instead of page numbers. See further details here.