Article

An Improved Biocompatible Probe for Photoacoustic Tumor Imaging Based on the Conjugation of Melanin to Bovine Serum Albumin

1
Center for Preclinical Imaging, Department of Molecular Biotechnology and Health Sciences, University of Torino, Via Ribes 5, 10010 Colleretto Giacosa, Italy
2
Molecular Imaging Center, Department of Molecular Biotechnology and Health Sciences, University of Torino, Via Nizza 52, 10126 Torino, Italy
3
Institute of Biostructures and Bioimaging (IBB), Italian National Research Council (CNR), Via Nizza 52, 10126 Torino, Italy
*
Author to whom correspondence should be addressed.
These authors contributed equally to the work.
Appl. Sci. 2020, 10(23), 8313; https://doi.org/10.3390/app10238313
Submission received: 13 October 2020 / Revised: 16 November 2020 / Accepted: 20 November 2020 / Published: 24 November 2020
(This article belongs to the Special Issue Recent Advances in Optical Bioimaging)

Abstract

:
A novel, highly biocompatible, well soluble melanin-based probe obtained from the conjugation of melanin macromolecule to bovine serum albumin (BSA) was tested as a contrast agent for photoacoustic tumor imaging. Five soluble conjugates (PheoBSA A-E) were synthesized by oxidation of dopamine (DA) in the presence of variable amounts of BSA. All systems showed the similar size and absorbance spectra, being PheoBSA D (DA:BSA ratio 1:2) the one showing the highest photoacoustic efficiency. This system was then selected for the investigations as it showed a marked enhancement of the photoacoustic (PA) contrast in the tumor region upon iv injection. Biodistribution studies confirmed the accumulation of PheoBSA D within the tumor region and showed fast renal elimination, lack of cell toxicity, and good hemocompatibility. A higher PA contrast enhancement was observed in the case of PC3 prostate tumor xenograft when compared to the TS/A breast one, likely reflecting different vascularization/extravasation properties between the two tumor murine models. The improved PA properties shown by PheoBSA D allowed to set up a 3D dynamic contrast-enhanced (DCE) approach that demonstrated a persistent increase of the PA signal in the tumor region for a long period. Overall, the herein reported results demonstrate that PheoBSA D is a promising blood pool contrast agent for in vivo PA imaging, particularly useful for the set-up of 3D DCE-PA approaches to monitor tumor vascular properties.

Graphical Abstract

1. Introduction

PhotoAcoustic Imaging (PAI) contrast is based on laser-generated ultrasounds [1], featuring concurrently the contrast ability of optical imaging and the high spatial resolution and penetration depth of ultrasounds [2]. Several endogenous molecules (i.e., hemoglobin, melanins, and lipids) have a unique optical absorption spectrum in the NIR region [3] and are exploited in multispectral optoacoustic tomography to detect cancer pathological transformations, for example in the visualization of the tumor-associated changes in blood oxygenation, flow, perfusion, and vascular permeability [4,5,6,7]. Melanin signal has been exploited to assess the metastatic status of the sentinel lymph node in melanoma patients [8].
The contrast enhancement shown by endogenous molecules has inspired the design of exogenous PAI contrast agents (CAs) [9,10]. The PAI-CAs allow to get improved contrast between anatomical structures and provide specific physiological information [11,12,13]. To date, exogenous PAI contrast agents are based on several platforms, including small-molecule dyes like indocyanine green [14,15,16], eventually confined in silica nanoparticles [17,18], carbon nanoparticles [19,20,21], gold nanostructures [22,23,24,25,26], iron-based nanosystems [27], pyrroles [28,29] and biodegradable particles [30]. All these newly developed CAs have been exploited for assessing several properties of the cancer microenvironment [31,32,33,34,35]. As for other medically oriented applications of exogenous nanoparticles, biocompatibility and toxicity issues may hamper the use of nano-sized PAI CAs towards their clinical translation. In fact, although they can be highly specific and provide good contrast, they often show slow renal clearance and may accumulate non-specifically in the mononuclear phagocyte system [36]. Accordingly, the design of less toxic nanoparticles based on endogenous molecules or optically active biodegradable materials attracted much attention in the last few years [10,30].
Melanin is a ubiquitous natural biopolymer found in skin, hair, eyes, and other tissues and it was early recognized as a source of optoacoustic imaging response since it displays a marked absorption over a large spectral region [8,37,38,39]. Melanins can be classified into four major categories [40] based on involved precursors, their color and distribution, namely (i) black to brown eumelanin derived from S-3,4-dihydroxyphenylalanine (L-dopa) consisting of oligomers of 5,6-dihydroxyindole (DHI) and 5,6-dihydroxyindole-2-carboxylic acid (DHICA) as main constituents; (ii) reddish to light brownish pheomelanin containing benzothiazine and benzothiazole units resulting from the oxidative polymerization of 5-S-cysteinyl-dopa or 2-S-cysteinyl-dopa[41]; (iii) allomelanin (mainly present in fungi and other microorganisms) obtained from the oxidation of catechols and 1,8-dihydroxynaphtalene; (iv) neuromelanin (NM), a complex macromolecular pigment found primarily in dopaminergic neurons of the human substantia nigra (SN) of the central nervous system. Although the precise structure of this biopolymer is not well known, it is thought to be a mixture of eumelanin and pheomelanin obtained by autoxidation of dopamine (DA) by iron to form DA-quinone, with the possible participation of 5-cysteinyl-catechol derivatives [42].
Several PAI contrast agents based on melanin-like nanoparticles (MNPs) have been already reported in the literature. These nanosystems were prepared from synthetic melanin granules [43] or from the oxidation of dopamine to yield size-controllable MNPs able to form sufficiently stable suspensions in water and biological media [44,45,46,47,48,49,50,51,52]. A common aspect of all these approaches dealt with the need for introducing chemical modifications aiming at improving their overall hydrophilicity. In this work, we tackled the same task by developing a melanin biopolymer obtained by the autoxidation of DA in the presence of different amounts of bovine serum albumin (BSA). The selected conjugate was tested as a PAI contrast agent for assessing tumor vascularization in mice.

2. Materials and Methods

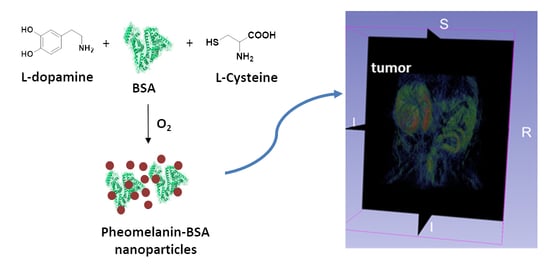
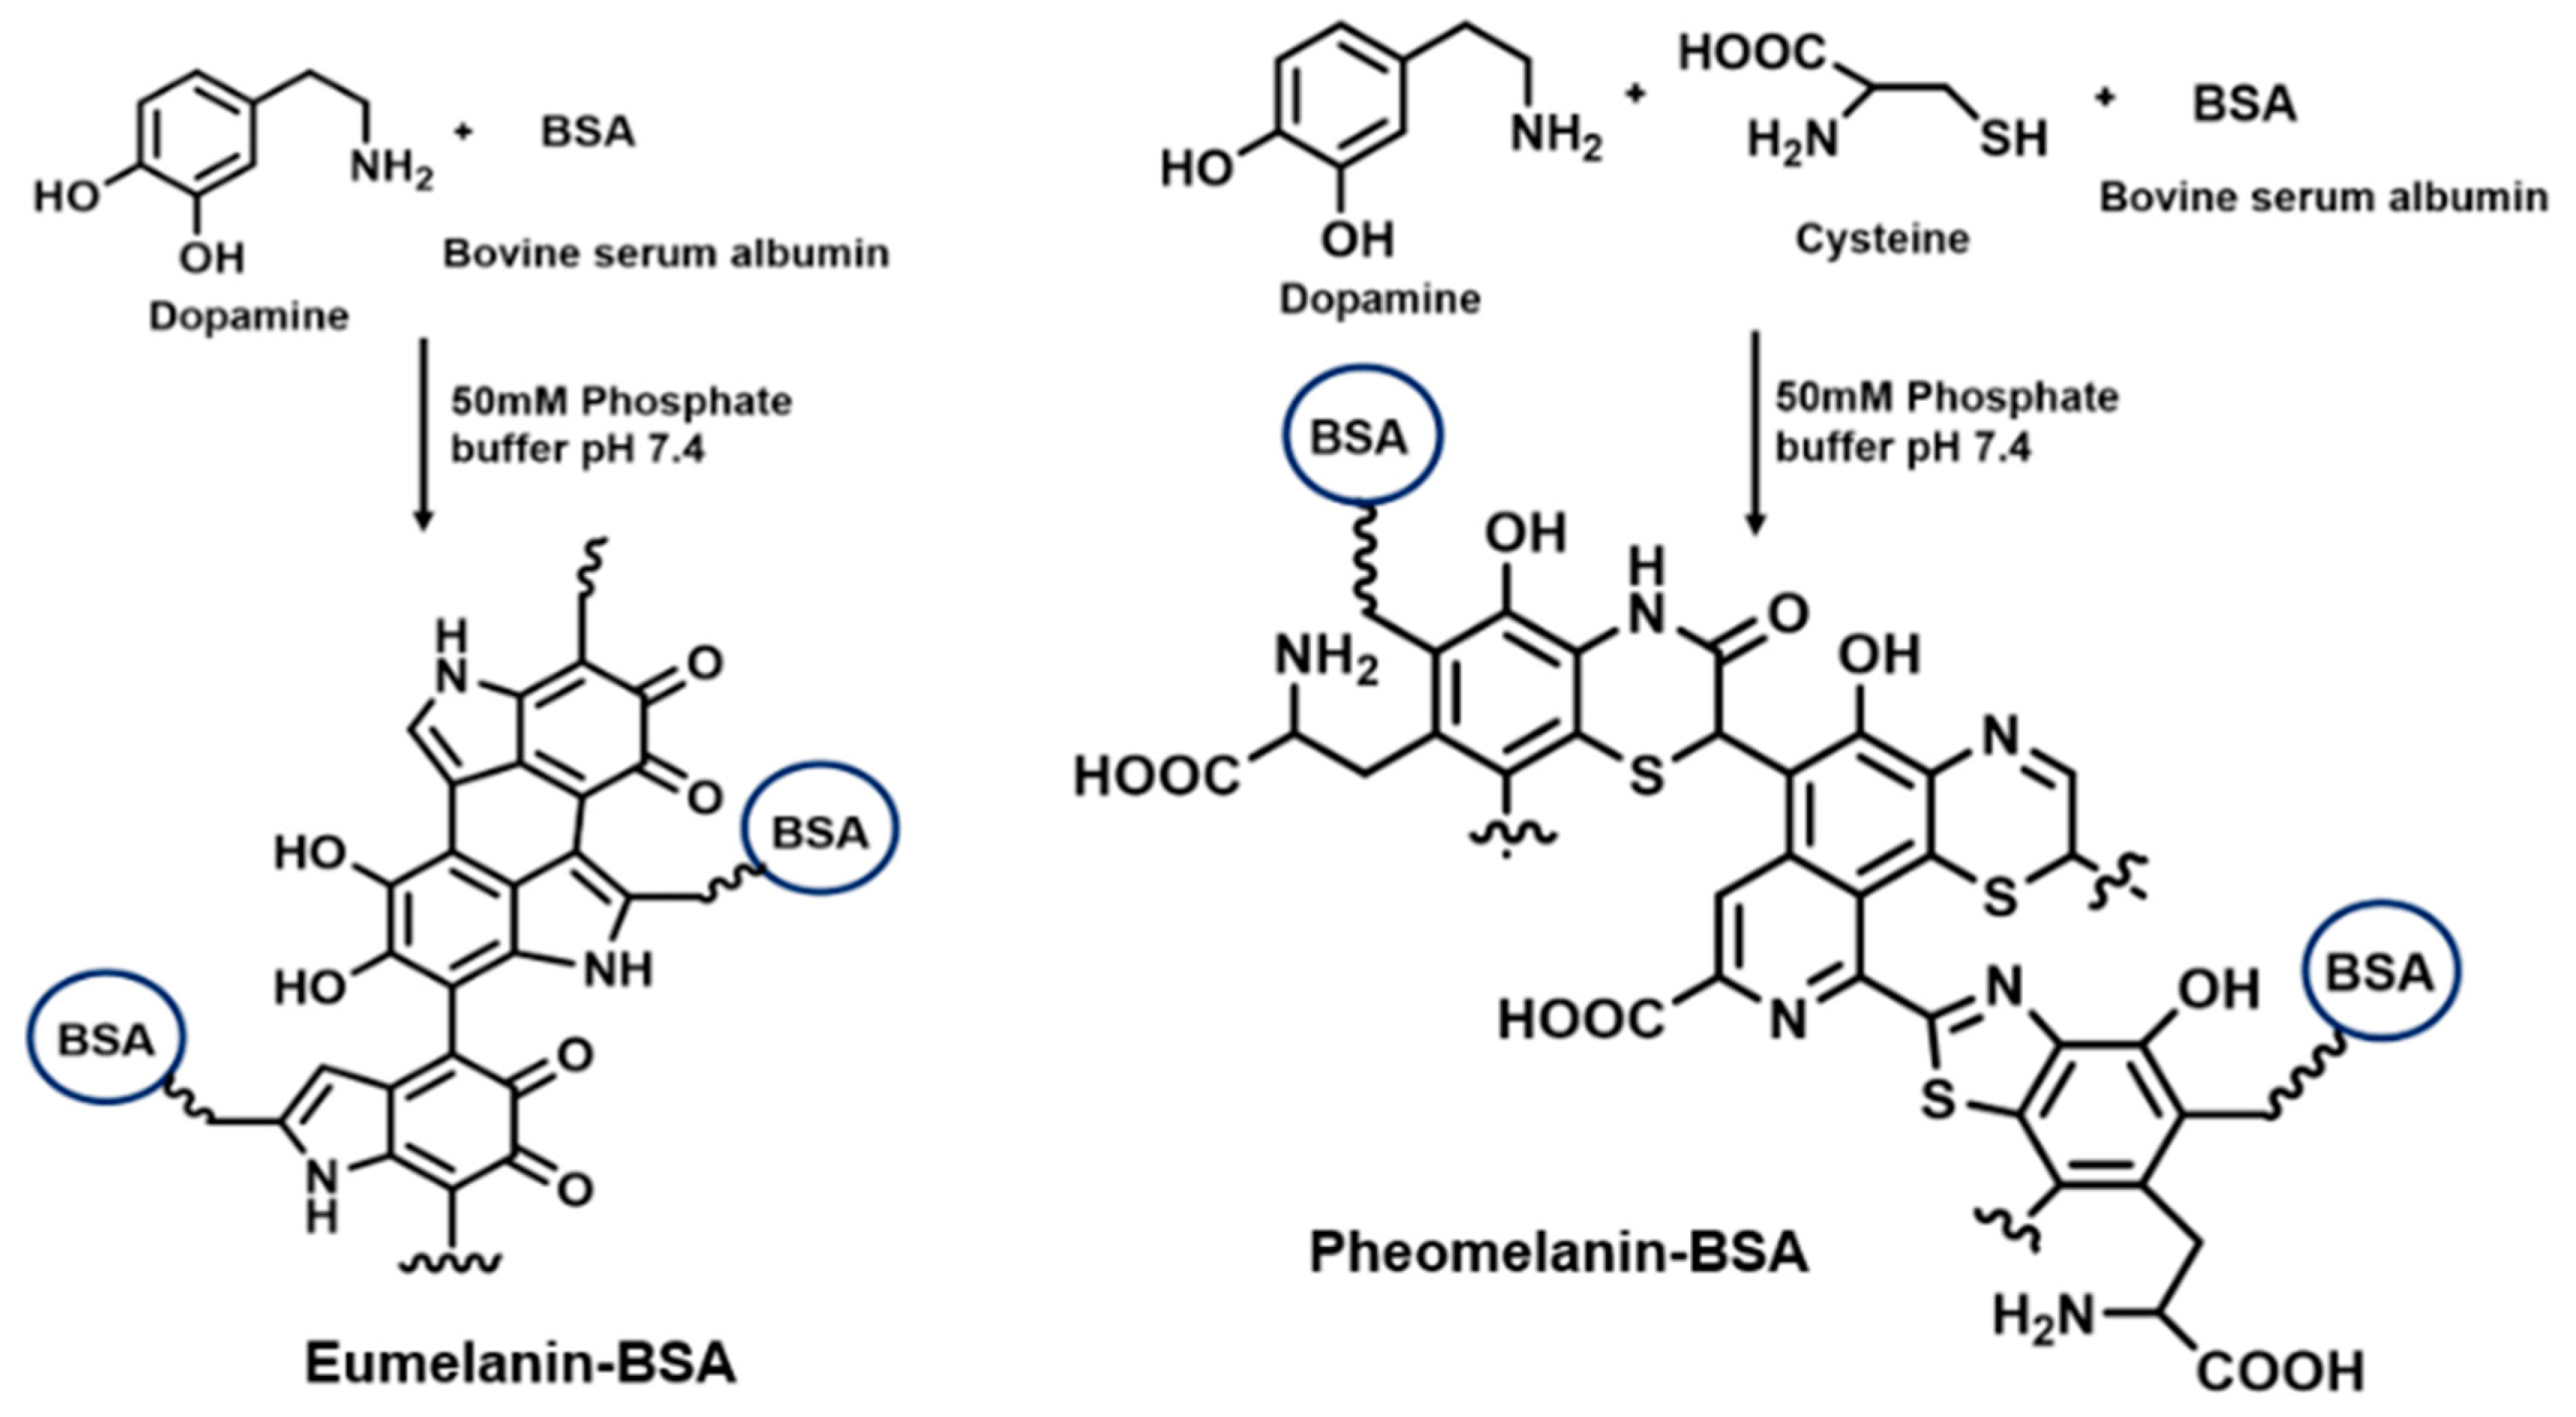
2.1. Synthesis of Melanin-BSA Conjugates and PheoBSA-FITC Conjugates

Dopamine hydrochloride, Bovine Serum Albumin (BSA), Potassium phosphate monobasic KH2PO4, Dibasic potassium phosphate K2HPO4, sodium hydroxide NaOH, Fluorescein isothiocyanate (FITC) were purchased by Sigma-Aldrich (Steinheim, Germany). The melanin-BSA conjugates were prepared by autoxidation of dopamine in the presence of the protein (Figure 1). To obtain water-soluble eumelanin-BSA conjugates (EuBSA), 450 mg of DA and BSA in the amounts necessary to give stoichiometric ratios of 1:2 and 2:1 (w/w) were allowed to react in air in 200 mL of 50 mM phosphate buffer, pH 7.4, at 37 °C while protected from light. The conjugates between pheomelanin and BSA (PheoBSA) were prepared similarly, through the autoxidation of 450 mg of DA in the presence of cysteine (DA:Cys molar ratio 5:1) and BSA in the same proportions as above, DA/BSA = 1:2 and 2:1 (w/w) and in the proportions 1:1 (w/w), in 200 mL of 50 mM phosphate buffer, pH 7.4. These solutions were allowed to react in the air at 37 °C while protected from light. The obtained conjugates were dialyzed for two days using tubing with a 12 kDa cutoff against Milli-Q water that was replaced three times to eliminate unreacted DA and small DAQ (dopaminoquinone) oligomers that were not bound to BSA. The dialyzed conjugates were then lyophilized to obtain brown-black solids. A summary of the various melanin-BSA conjugates that were prepared is given in Table S1 (Supplementary Material). They are named A, B, C, D, E according to the initial ratios of the reagents employed during their preparation and to the reaction time. The lyophilized samples were dissolved in Milli-Q water to make a stock solution of 10 mg/mL. To conjugate FITC to Pheo-BSA-D (PheoBSA-FITC), 8 mg of PheoBSA D was dissolved in a solution of sodium carbonate 0.1 M (pH = 9.4) and then fluorescein isothiocyanate in DMSO (1 µmol, 1 mg/mL, 0.4 mL) was added. The reaction was stirred at room temperature in the dark for 8 h. The solution was dialyzed against water to eliminate unreacted FITC and then lyophilized and stored at 4 °C. The fluorescein bounded to Pheo-BSA D was quantified spectrophotometrically by measuring the absorbance intensity of the PheoBSA-FITC dissolved in water (0.2 mg/mL) at 495 nm against Pheo-BSA D as blank. For the calibration curve, standard solutions of FITC (1 μM to 10 μM) were prepared in water starting from 250 mg/L of fresh solution of FITC in sodium carbonate 0,1 M (Figure S2). To confirm that the labeling procedure did not affect the fluorescent properties of FITC, excitation and emission spectra of PheoBSA-FITC solution were measured by a high-resolution spectrofluorometer FluoroMax-40 (Horiba Jobin Yvon, New York, NY, USA). The fluorescence emission spectrum was obtained by setting 485 nm as the excitation wavelength and acquiring the fluorescent signal in the range between 495 and 600 nm. The fluorescent excitation spectrum was obtained exciting the sample in the range between 350 and 510 nm and setting 520 nm as emission wavelength (Figure S3).

2.2. Cell Line and Animal Models

Murine macrophagic cells (J774A.1) and human prostate cancer cells (PC-3) were supplied by ATCC. Spontaneous breast cancer cell line from a BALB/c mouse (TS/A) was kindly provided by Prof. Federica Cavallo, University of Torino, Torino, Italy. J774A.1 cells were cultured in DMEM high glucose medium, PC-3 cells were cultured in Ham’s F-12K, TS/A cells were maintained in RPMI 1640, all media were supplemented with 10% FBS, 2 mM glutamine, 100 IU/mL penicillin, and 100 μg/mL streptomycin. For the preparation of the prostate tumor model, athymic nude mice (aged 6 weeks and weighted 18–22 g) were purchased from Harlan Laboratories. To these mice, a suspension of 5 × 10⁶ PC-3 cells in 0.15 mL Phosphate Buffer Solution (PBS) was subcutaneously injected at the right flank of each male mouse. Imaging experiments were carried out approximately 21 days after cell implantation. For the preparation of the TS/A tumor model, 2.5 × 10⁵ cells in 0.15 mL PBS were inoculated subcutaneously at the right flank of each wild-type female BALB/c mice, purchased from Charles River Laboratories. All the procedures involving the animals were conducted according to the national and international laws on experimental animals (L.D. 26/2014; Directive 2010/63/EU). For the optical imaging studies, all animals were maintained with VRF1 (P) sterile diet, in pellets (ø 12 mm), by SDS (Special Diets Services Ltd., Witham, England), up to the end of the acclimation period (five days). A special diet aimed at reducing auto-fluorescence, AIN-76a rodent irradiated diet, manufactured by Research Diets (New Brunswick, NJ, USA), was then used until the end of the experiment.

2.3. In Vitro Characterization of Melanin-BSA Conjugates

UV/Vis spectra were recorded on Jenway 6715 (Staffordshire, UK) UV/Vis (spectral window: 400–1000 nm). The hydrodynamic sizes of the conjugates were determined by dynamic light scattering (DSL) using a 90 Plus particle size analyzer (Malvern, Zetasizer). The protein content of the BSA conjugate D was obtained by NMR analysis as described by Casella [53]. Shortly, 10 mg of PheoBSA D was added to a solution of 4 mL of 6 M hydrochloric acid for protein hydrolysis. The solution was sealed and heated at 110 °C for 24 h. After cooling, the mixture was evaporated and then dissolved in 1 mL of deuterium oxide and centrifuged to remove the insoluble melanic portion. The supernatant was collected and a standard solution of 0.3 M sucrose in D2O was added to achieve a final concentration of 3 mM. The 1H NMR spectra of the hydrolyzed conjugates were recorded on a Bruker (Rheinstetten. Germany) AVANCE 600 spectrometer, accumulating 16 scans.
The photoacoustic signal was evaluated in vitro by a VevoLazr 2100 (Visualsonics, Fujifilm, Toronto, ON, Canada). In the VevoLazr 2100 system, light is generated by a tunable laser (flashlamp-pumped Q-switched Nd:YAG laser with an optical parametric oscillator and second harmonic generator; wavelength range: 680–970 nm; pulse duration 7–10 ns; laser pulse rate 20 Hz) and delivered through fiber optic bundles integrated into a 256-element linear array ultrasonic detector (LZ250 characterized by a broadband ultrasound frequency in the range of 13–24 MHz, center frequency 21 MHz), producing an axial resolution of 75 μm and a lateral resolution of 165 μm. Data acquisition time is 0.2 s/wavelength. Photoacoustic spectra were acquired in the range from 680 nm to 970 nm with a step size of 5 nm, and persistence of 3. The scanning time of the whole spectrum is less than 60 s. To register the photoacoustic spectra the solution was loaded in polyethylene tubes (PE-100) embedded in solidified agar (1% w/v, in milliQ water). An acoustic gel was used as a coupling agent between the ultrasound transducer and the phantom. Agar-based phantoms were used for PAI analysis with the VevoLazr PAI system, with several tubes inserted into each phantom. In each tube different concentrations were used (2.5 mg/mL, 5 mg/mL, 10 mg/mL) of A, B, C, D, and E specimens. Photoacoustic signals at 730 nm were plotted vs. dye concentration to evaluate photoacoustic efficiency and the slopes were compared.

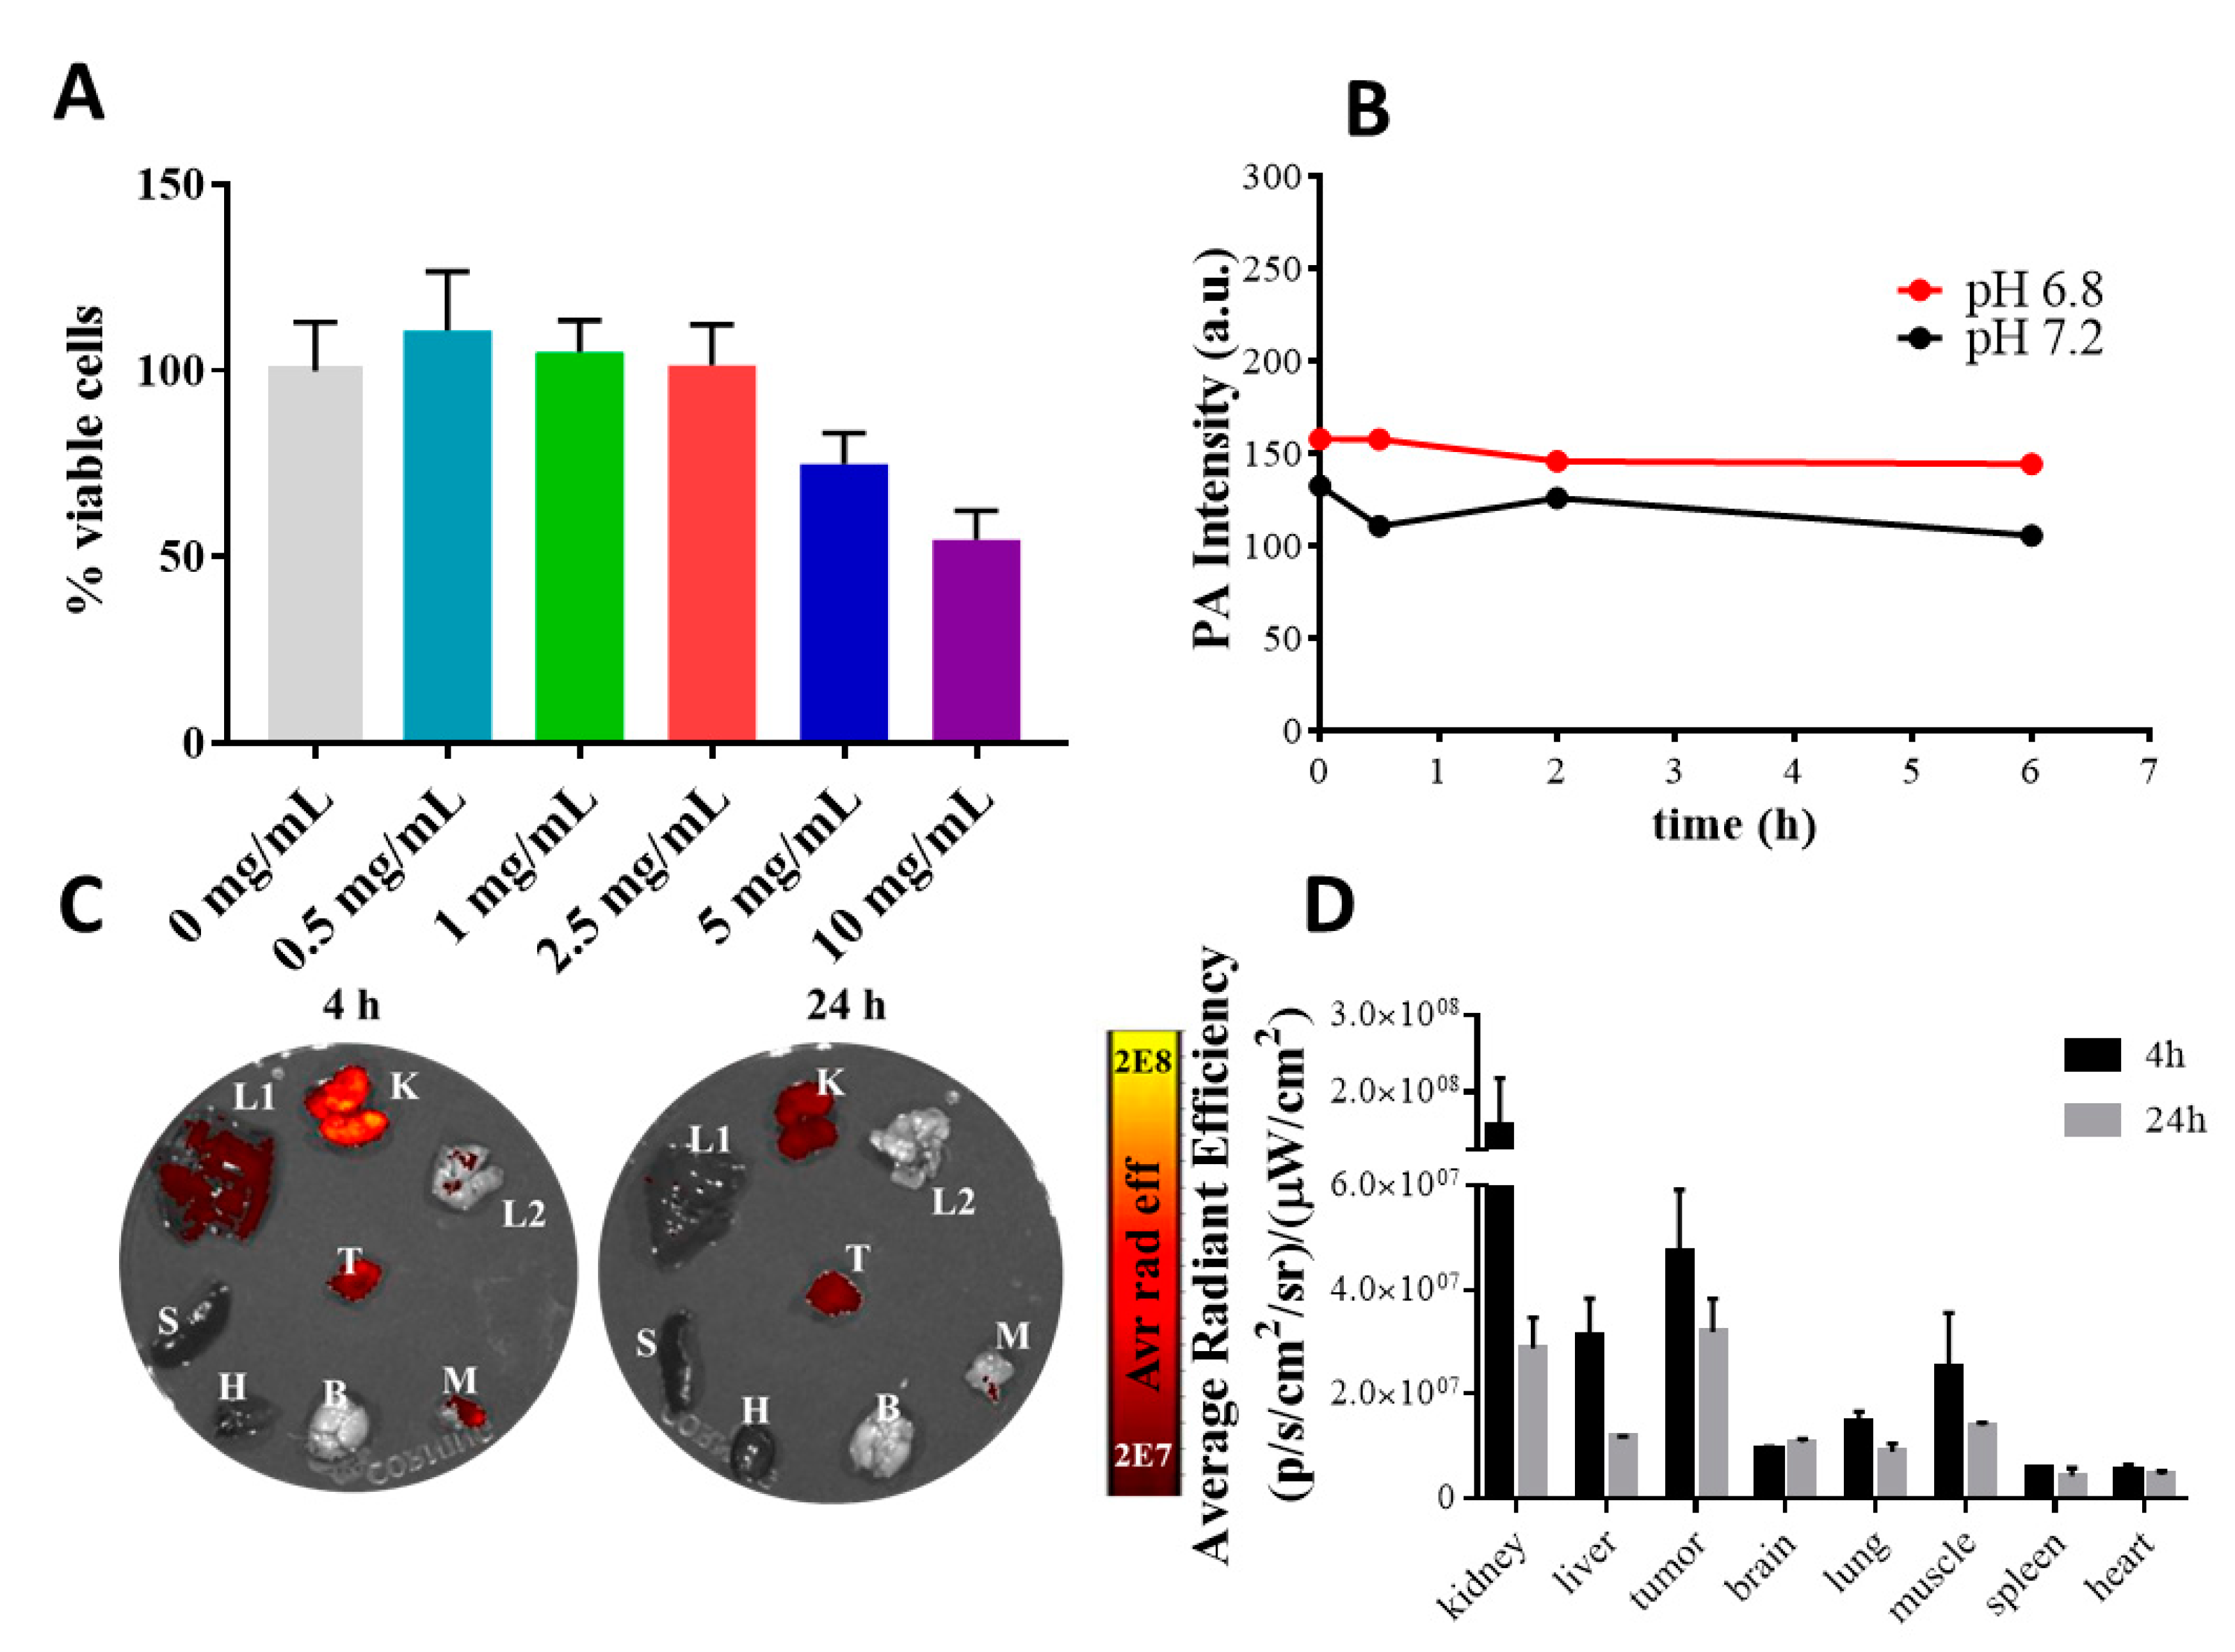
2.4. Cell Viability Assay

To evaluate the cytotoxic effect of PheoBSA D, a CellTiter-Blue Cell Viability Assay (Promega Corporation, Durham, NC, USA) was performed. J774 (10 × 103) cells were plated in 96-well culture plates and treated with different concentration of PheoBSA D (ranging from 0.5 mg/mL to 10 mg/mL) for 24 h. Then, cells were washed with PBS, and CellTiter-Blue reagent was added to each well following manufacturer instructions. Fluorescence was measured at 560Ex/590Em using a 96-well plate reader. Each assay was repeated at least three times. Data are presented as the percentage of viable cells normalized to their respective controls.

2.5. PheoBSA-FITC In Vivo Biodistribution Test

PheoBSA-FITC (300 µL/mouse of 2 mg/mL solution) was administered intravenously (IV) to PC-3 tumor-bearing animals when the tumors reached approximately 150–200 mm3. Mice were anesthetized under 3–4% Sevoflurane gas anesthesia (O2 97.0–96.0%) and euthanized by cervical dislocation 4 h (n = 3) and 24 h (n = 3) after injection. Tumors and main organs (liver, brain, kidneys, spleen, heart, lungs, and muscle) were then excised for ex-vivo fluorescent signal measurement. The optical imaging experiments were performed on an IVIS Instrument SPECTRUM (Perkin Elmer Italia S.p.A.), equipped with a CCD camera and irradiated with filtered light of wavelength 500 nm (bandwidth of 30 nm) and light of emission intensity was collected at 540 nm (bandwidth of 20 nm). ROIs corresponding to the entire organ were selected by an operator over harvested tissues. The signal intensity within the ROIs were determined automatically by the software and tissue biodistribution was evaluated.

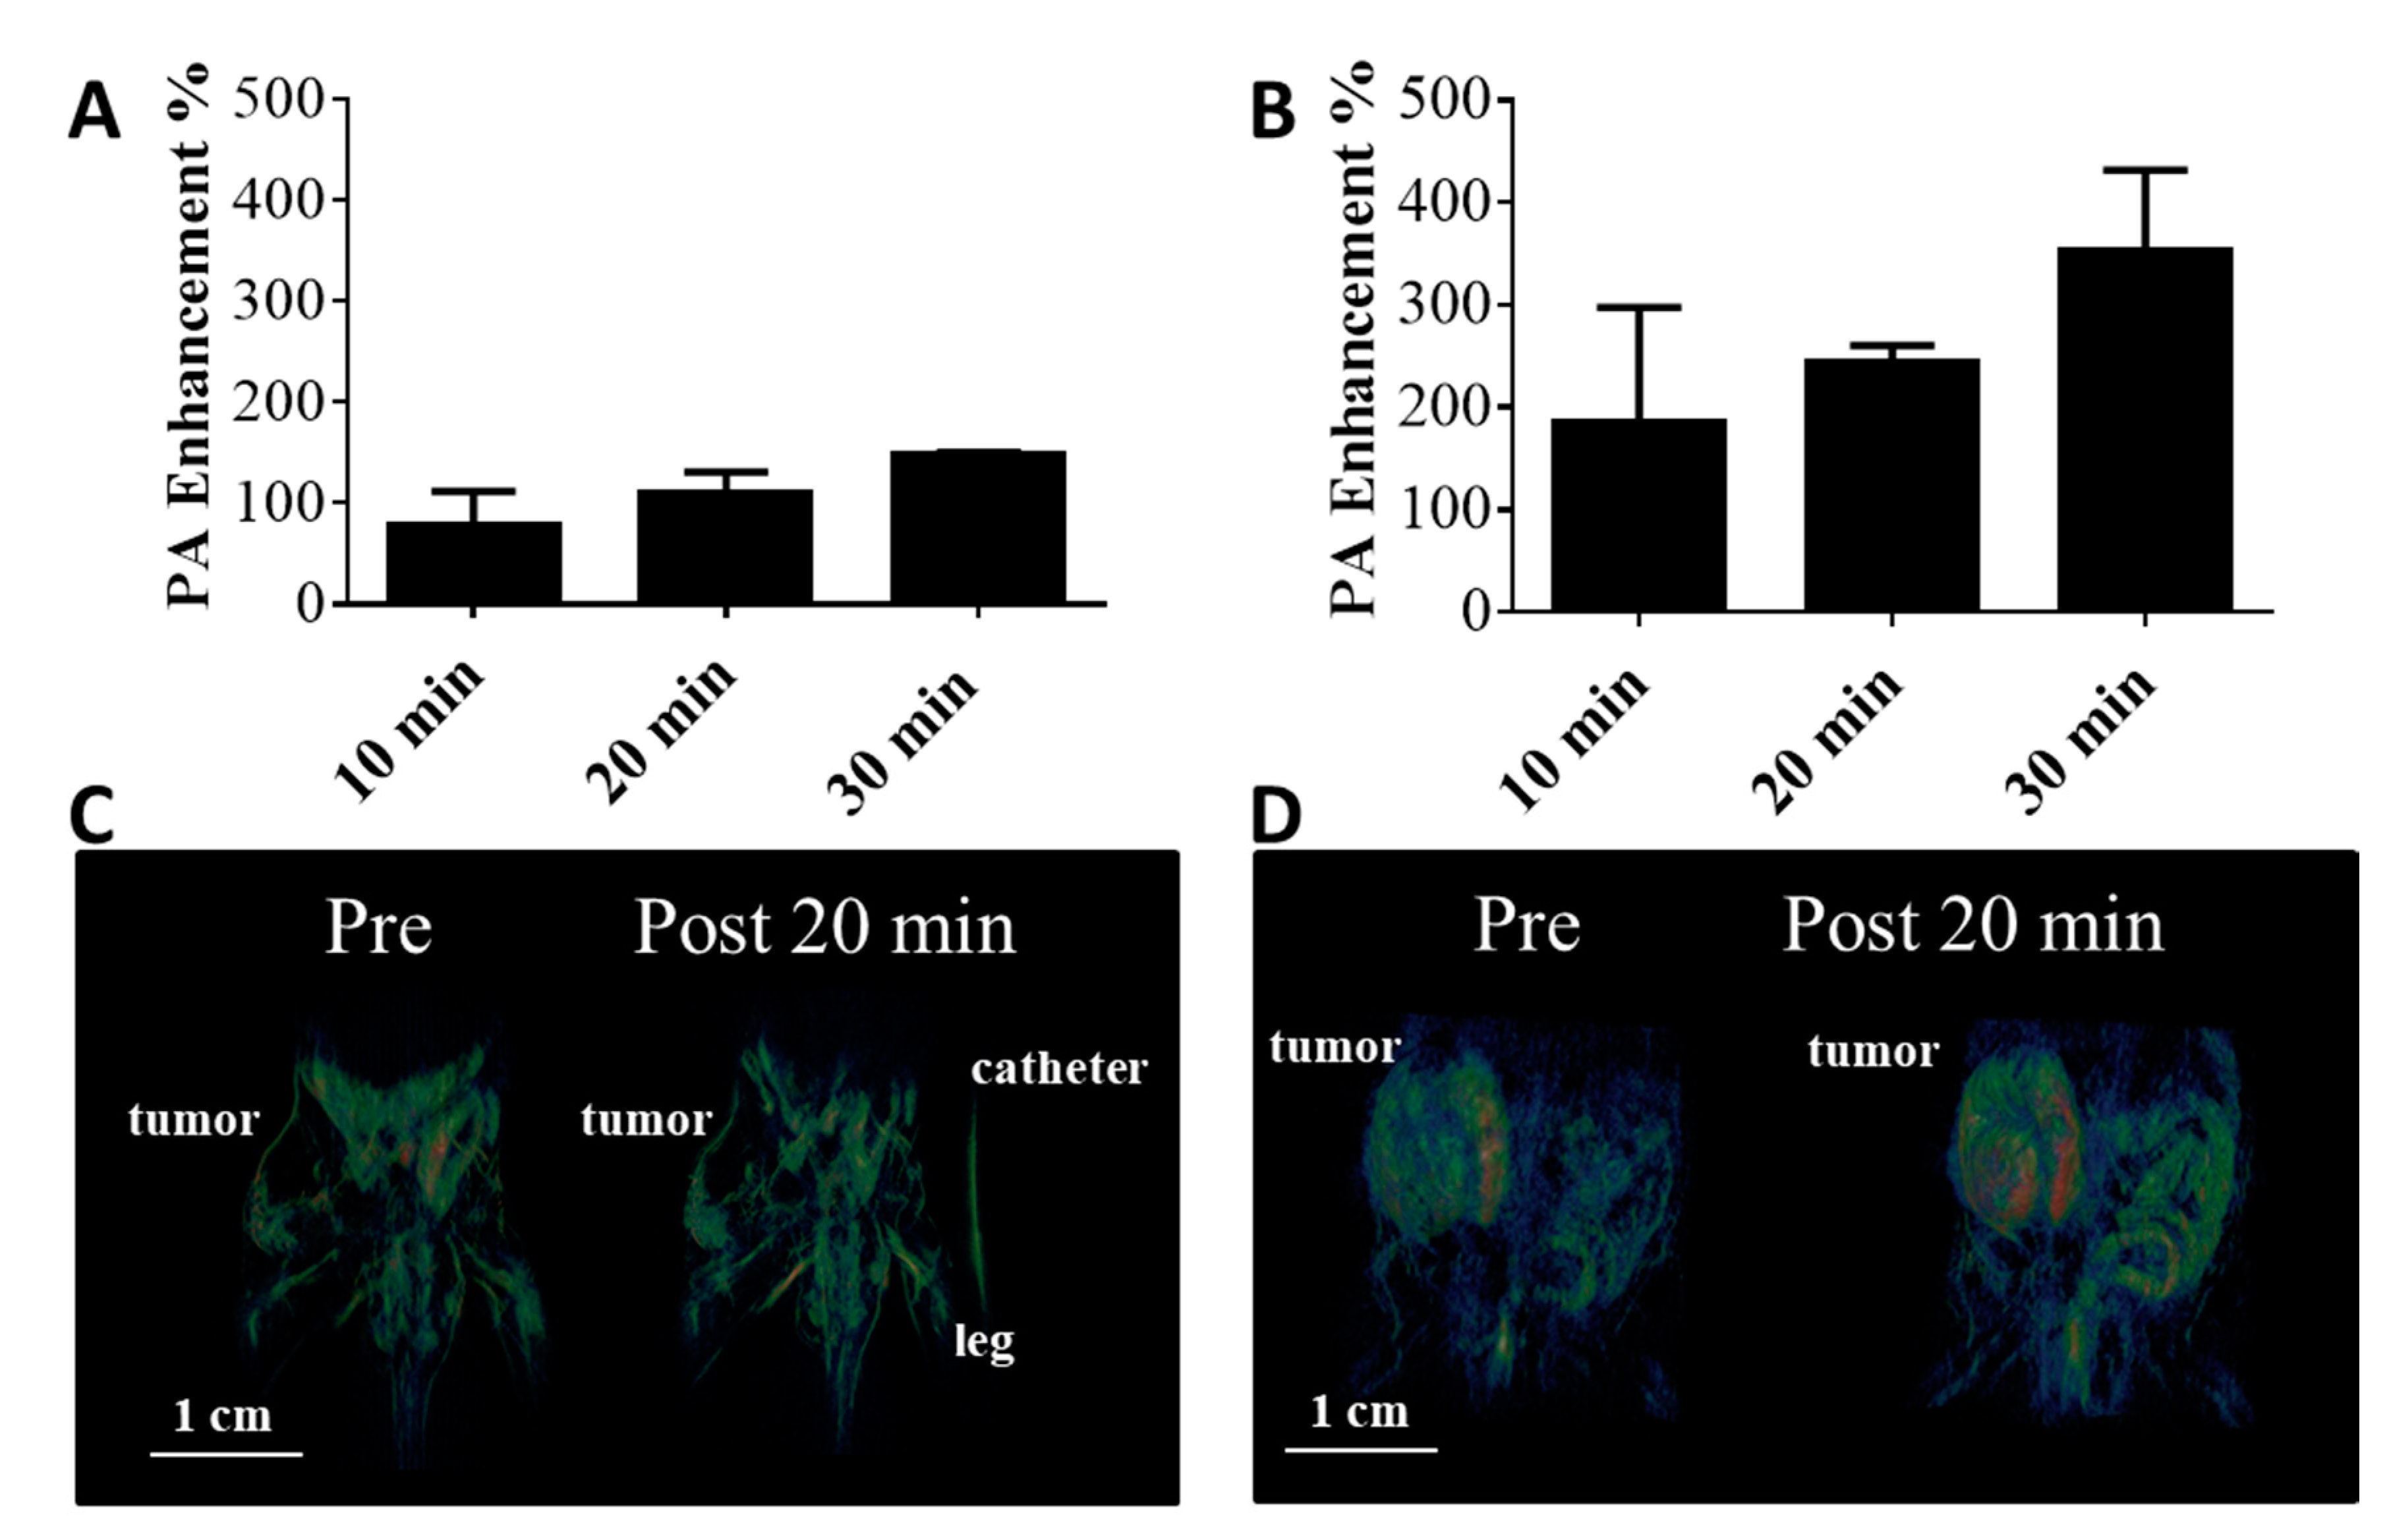
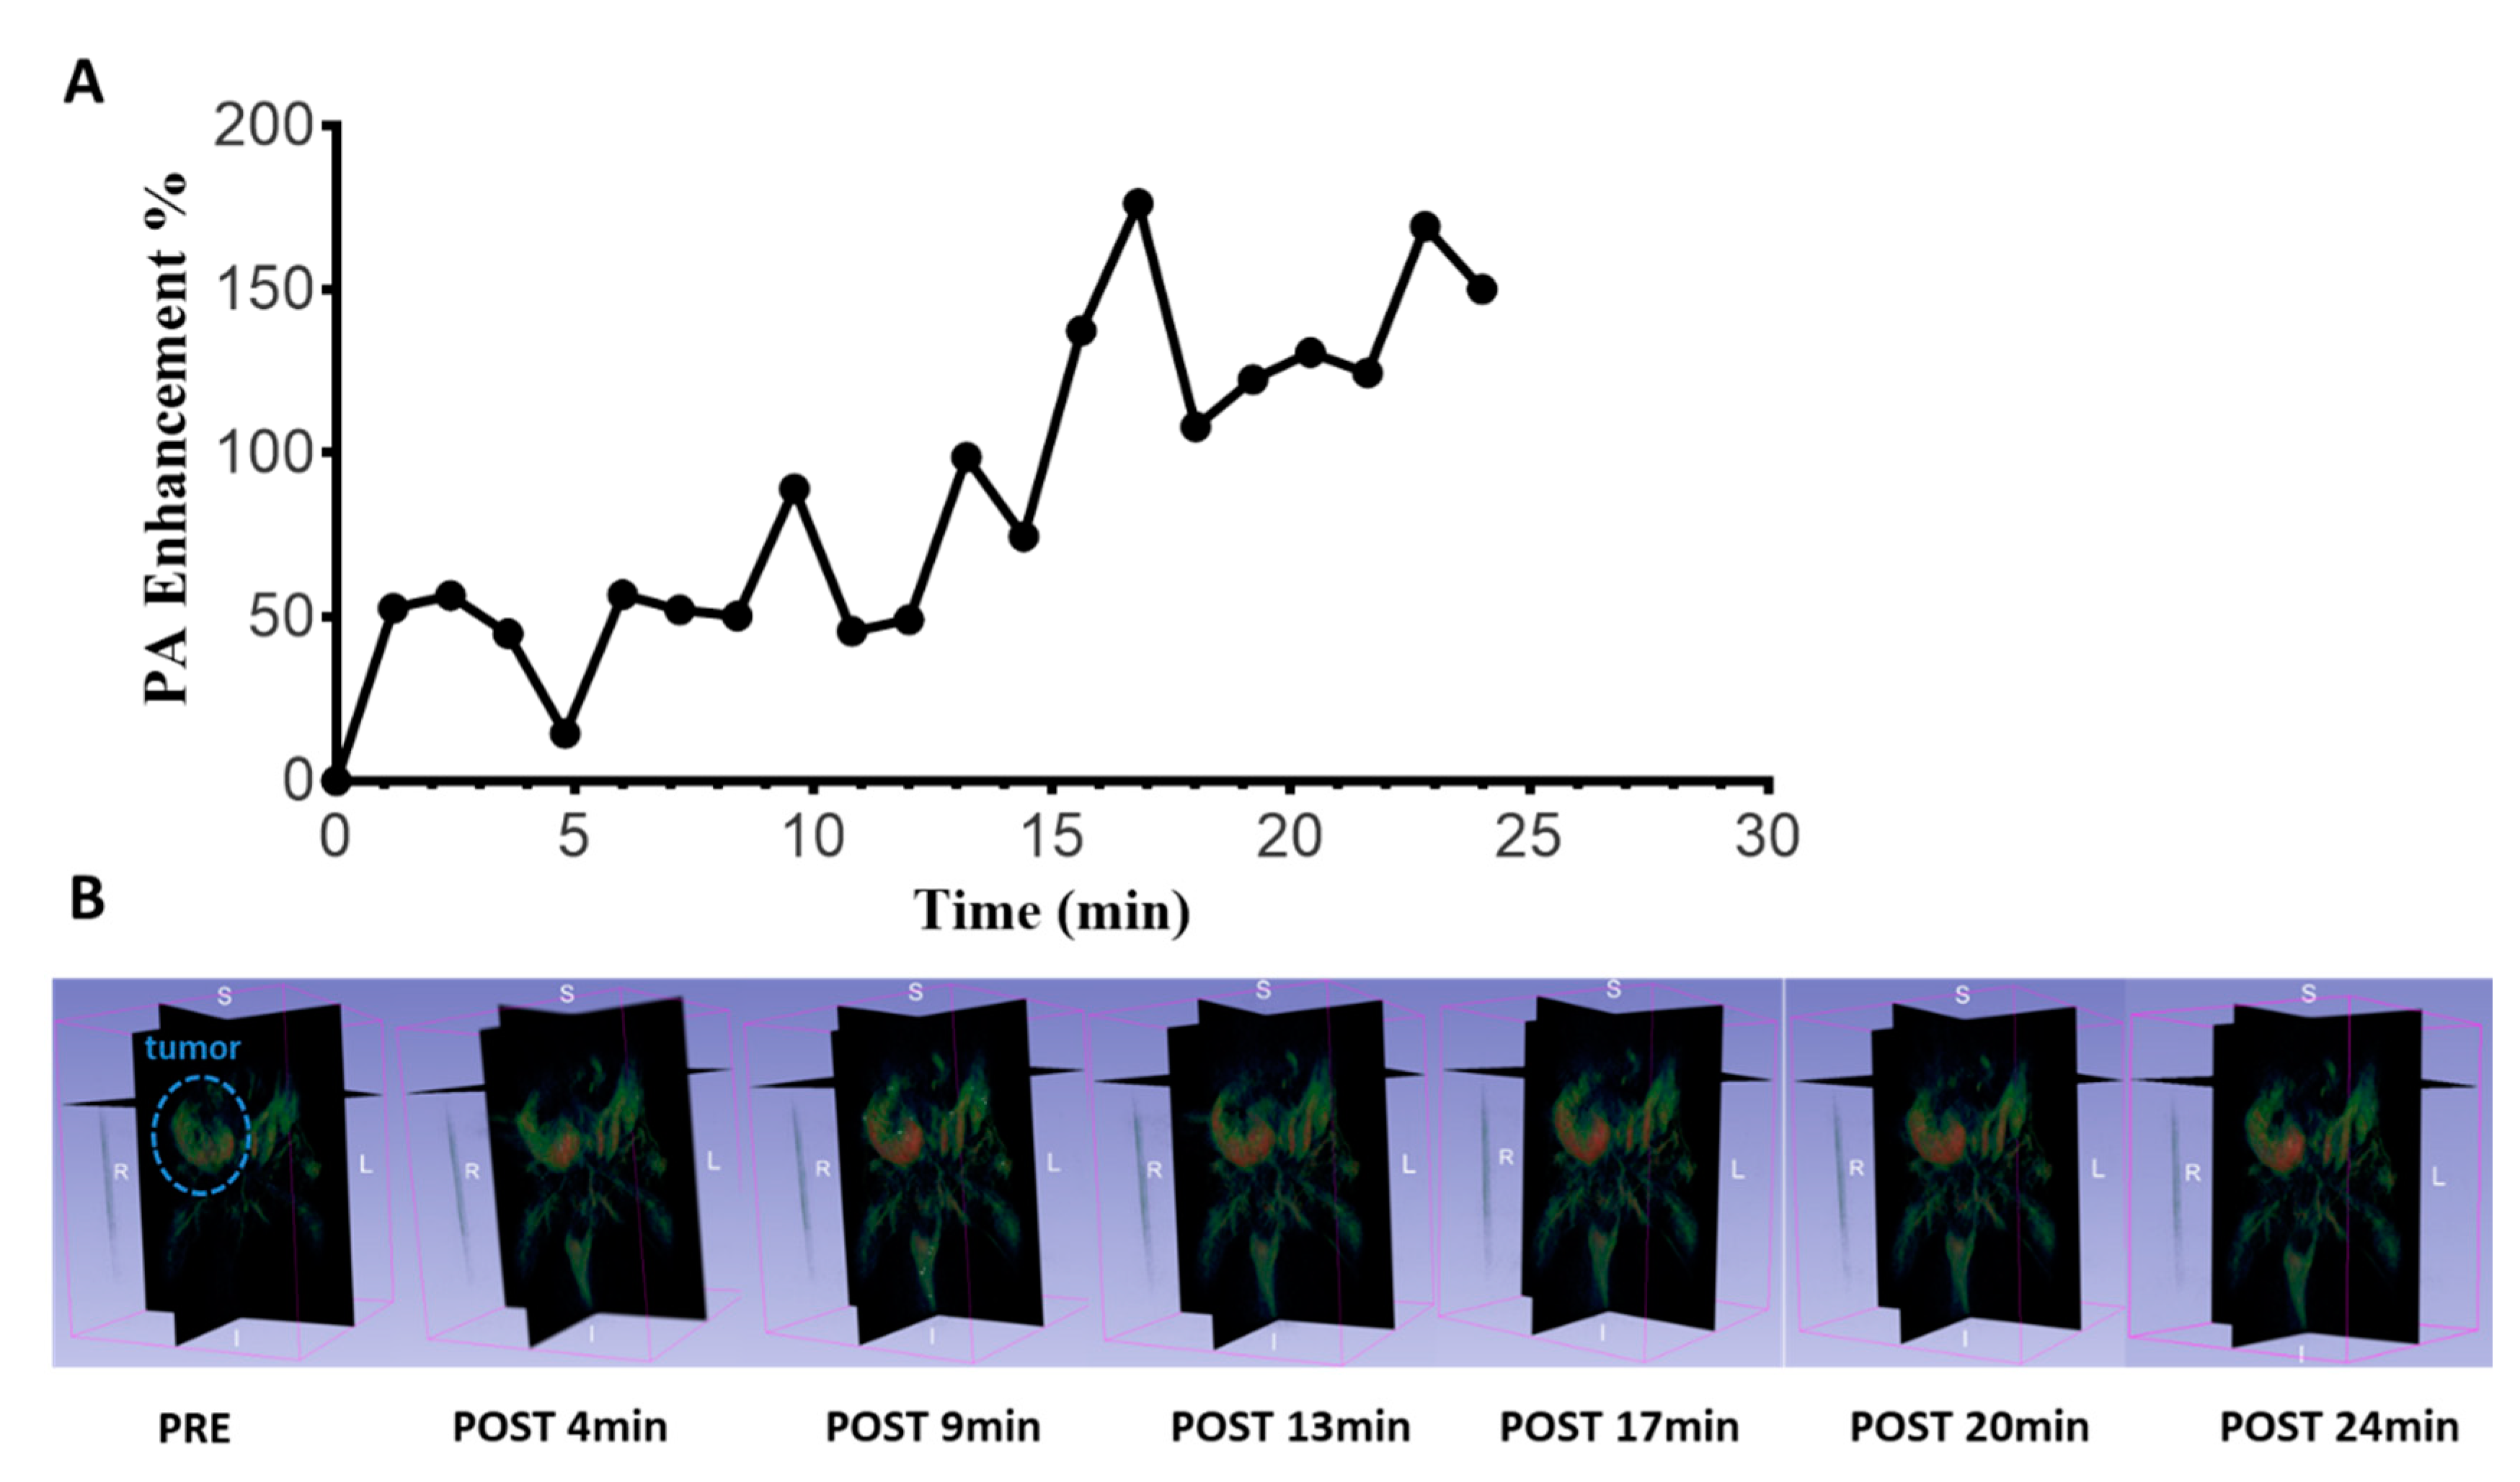
2.6. In Vivo Photoacoustic Imaging

The in vivo experiments were performed by a VevoLazr 2100 Photoacoustic Image System (Visualsonics, Fujifilm, Toronto, Canada) and by the LOIS 3D Pre-clinical Imaging System (Tomowave, Houston, TX, USA).
The Laser Optoacoustic Imaging System, LOIS-3D (TomoWave Systems, Houston, TX, USA), is equipped with a laser (Q-switched Nd:YAG pumped Ti:Sapphire laser, pulse duration 8 ns, peak energy between 50 to 100 mJ, wavelength range 730–850 nm) and an arc-shaped array of ultrawide-band ultrasonic transducers (bandwidth of 50 kHz to 8 MHz at −6 dB) characterized by an aperture of 115 deg with a radius of 65 mm, which resulted in spatial resolution of 0.3 mm.
The PheoBSA D was IV injected (100 μL, 5 mg/mL solution) in the mice. The first set of experiments was performed on TS/A breast tumor model (n = 4) with VevoLazr PAI. Signals were acquired at 730 nm before and every 5 min for a total of 30 min after PheoBSA D administration. Data acquisition time is 0.2 s.
A second set of experiments was performed on TS/A tumor model (n = 2) and PC-3 prostate tumor model (n = 2) with the LOIS 3D Imaging system. Images at 730 nm were acquired pre and post-injection (post 1, 10, 20, and 30 min) for a total of 30 min. A third set of experiments was performed on TS/A tumor model (n = 1) with an imaging sampling of 72 s at 730 nm with the LOIS 3D Imaging system for a dynamic contrast enhancement approach.

3. Results and Discussion

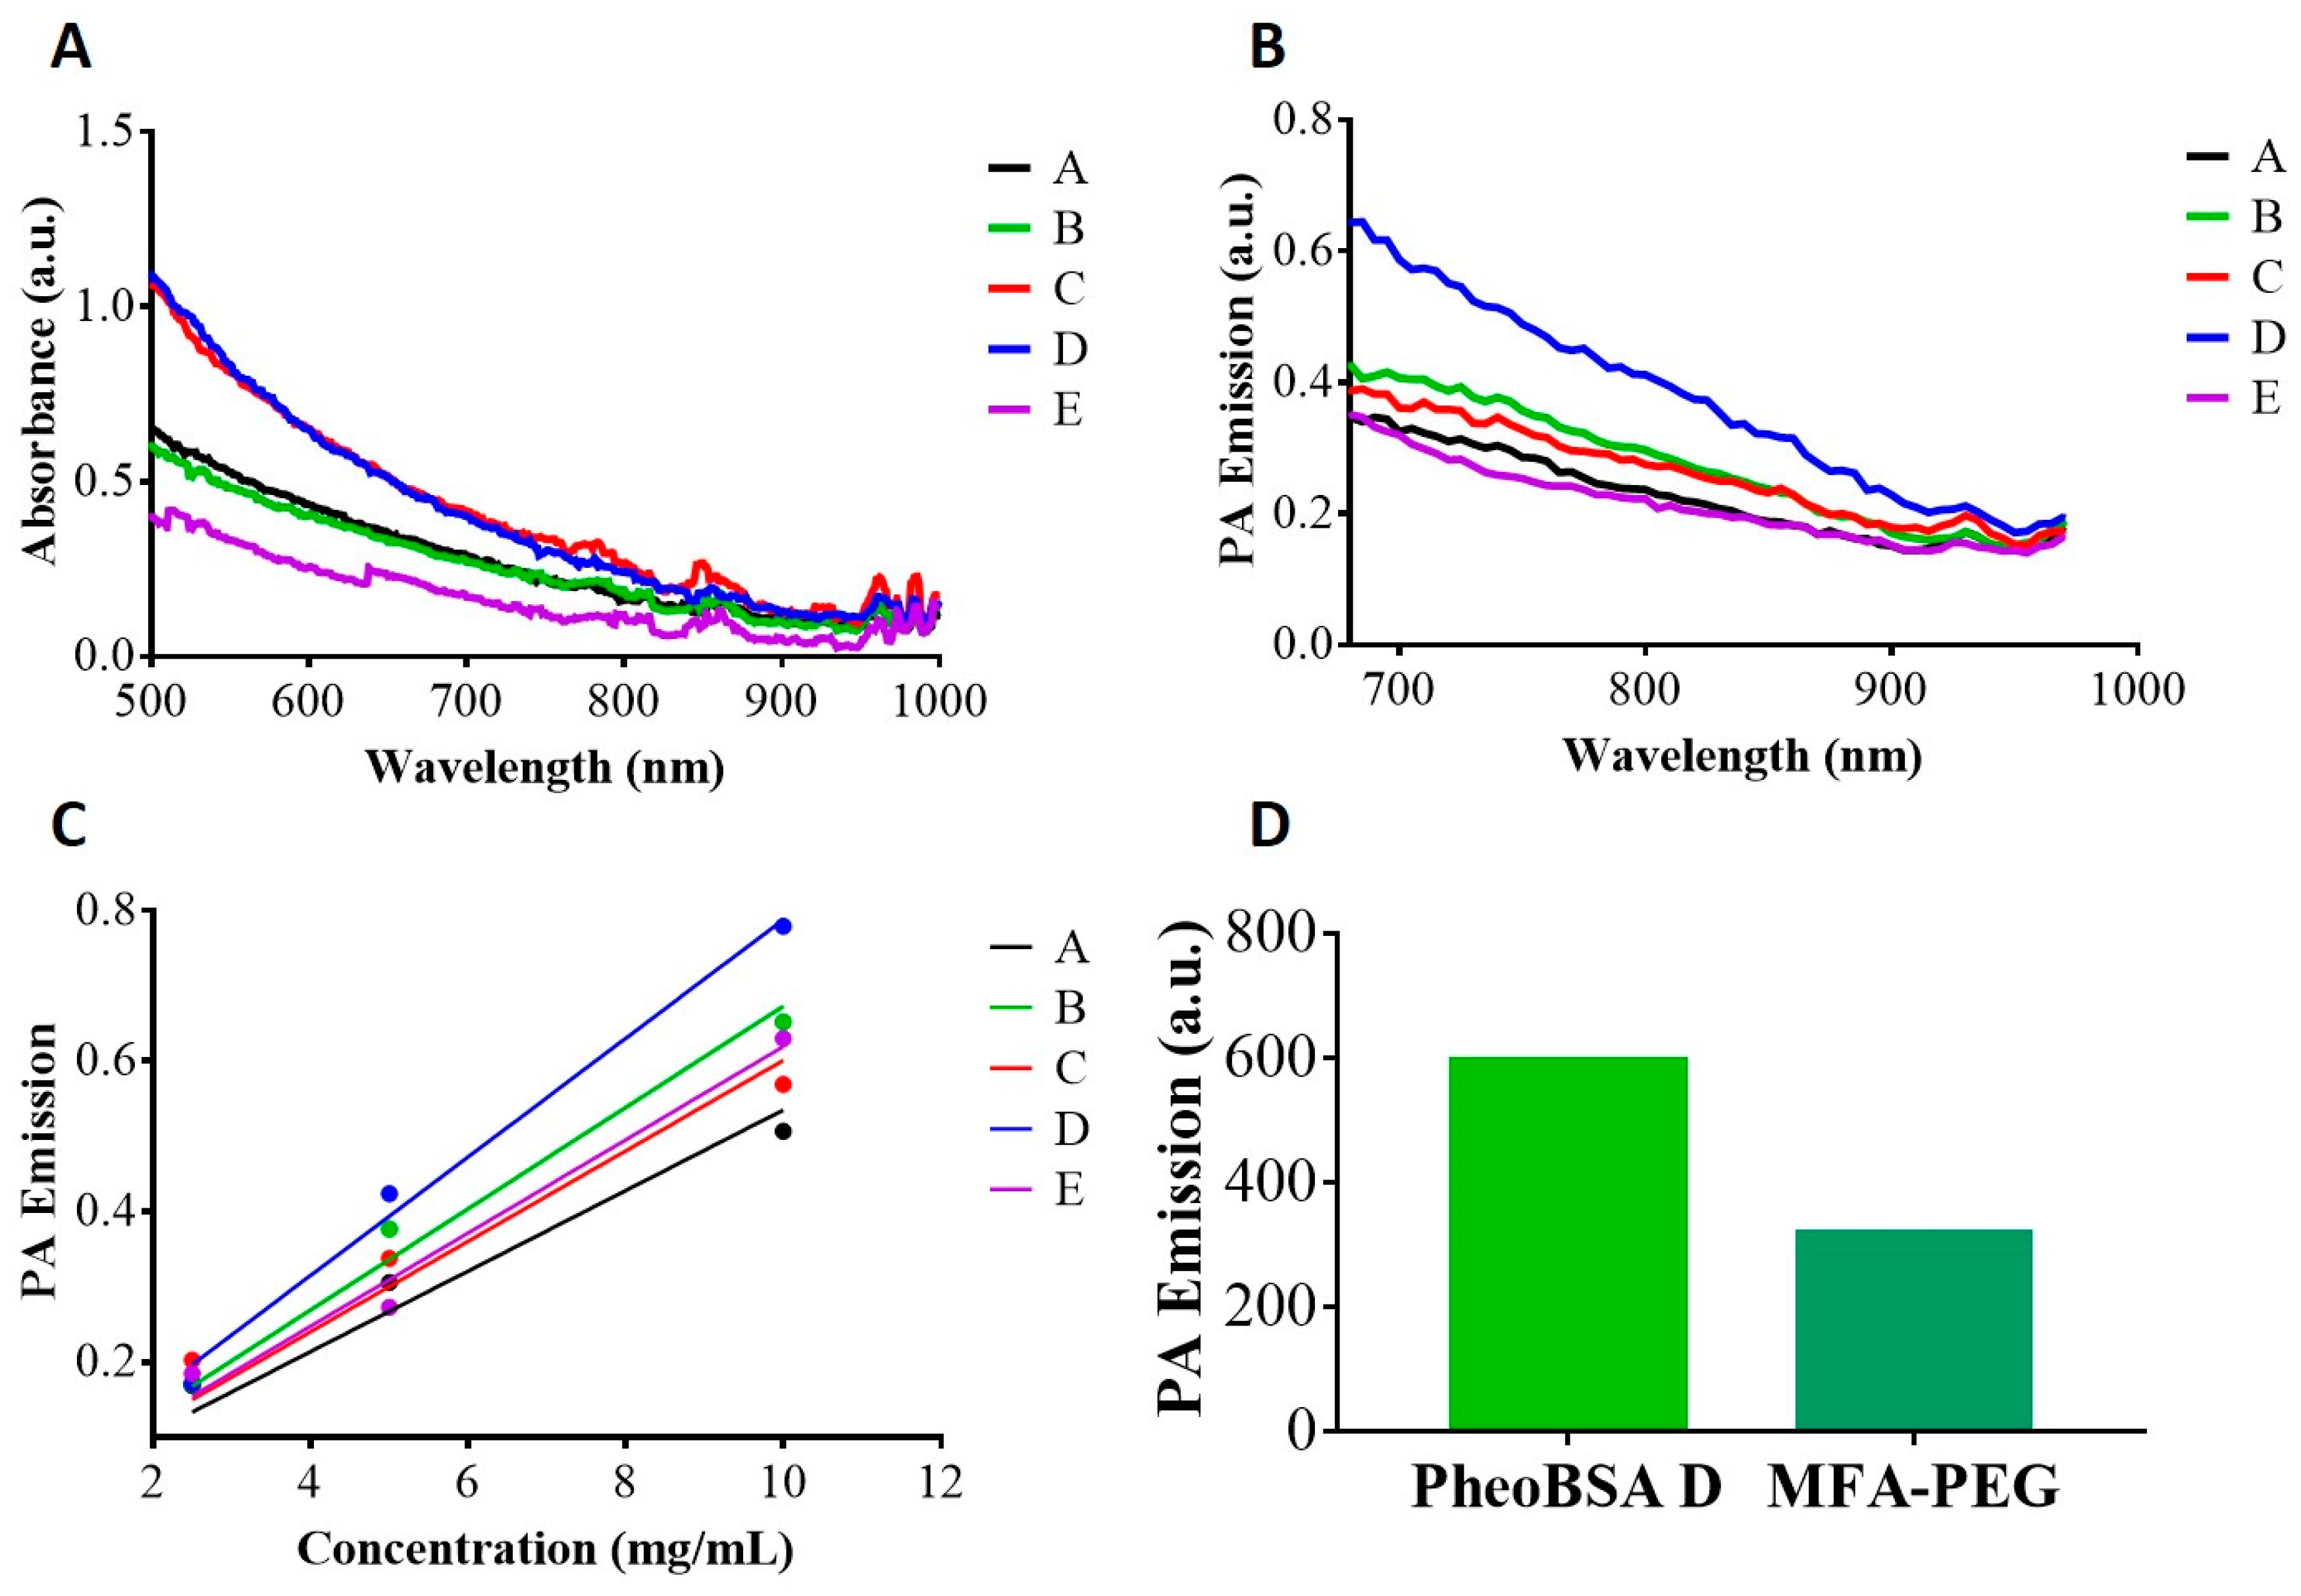
3.1. Synthesis and Characterization of Melanin-BSA Conjugates

The spontaneous oxidation of DA yields an untreatable, insoluble polymeric material (synthetic melanin or eumelanin). When DA oxidation is carried out in the presence of enough BSA equivalents, water-soluble melanin-BSA conjugates could be obtained. Melanin-BSA was prepared according to a modified version of a reported procedure [53], through the autoxidation of dopamine (Figure 1). The quinone compounds formed by the oxidation of DA react with the nucleophilic groups present in the protein (cysteine, histidine, lysine) and the growing melanic oligomers remain covalently linked to the protein, generating eumelanin-type conjugates (EuBSA). PheoBSA-type conjugates were prepared under the same conditions from dopamine and L-cysteine (DA:Cys molar ratio of 5:1). Different melaninBSA conjugates were prepared by varying the ratio DA/BSA w/w (2:1; 1:1; 1:2) and the time of reaction as reported in Table S1 (Supplementary Material). After dialysis and lyophilization, the solubility of the conjugates was tested by adding 10 mg of solid powder to 1 mL of water. The solubility of the conjugates depends on the ratio between the melanic and protein contents, which reflect the used ratio of DA/BSA w/w reagents and the applied reaction time. Conjugates A, B, C, D, E resulted to be well soluble at the tested concentration of 10 mg/mL. Most of them were prepared in the presence of cysteine, and hence are classified as Pheo-BSA conjugates, with smaller DA oligomers bound to the protein.
Each melanin–BSA conjugates displayed the typical absorption profile of melanin extending from the UV to the visible range (Figure 2A). Their sizes (diameter) were as follows: 18.8 ± 0.5 nm (conjugate A); 2.3 ± 0.5 nm (conjugate B); 5.3 ± 0.5 nm (conjugate C); 5.2 ± 0.5 nm (conjugate D); 4.6 ± 0.5 nm (conjugate E) (Figure S1). The smallest sizes were observed for the Pheo-BSA conjugates, as expected based on a lower DA polymerization in the presence of cysteine. The quantification of BSA in the PheoBSA D was estimated after complete hydrolysis of the protein by NMR, according to a reported procedure [53]. The method is based on the quantification of the aromatic protons of tyrosine (20 residues in BSA) and the methyl groups of threonine (33 residues in BSA) that give easily recognizable 1H NMR signals, using sucrose as standard. The result suggested an averaged ratio of 20% of the protein (w/w).
FITC was conjugated with PheoBSA D for in vivo biodistribution studies. A FITC calibration curve was used for the quantification of FITC conjugated to PheoBSA D using PheoBSA D as a blank at the same concentration in mg/mL. We calculated an amount of 2 μmol of FITC per g of PheoBSA D.
Photoacoustic measurements of the conjugates showed broad absorption spectra, typical of natural melanin (Figure 2B). PheoBSA D showed the highest PA contrast properties at a concentration of 2.5 mg/mL. Despite PheoBSA C displayed comparable absorbance properties to PheoBSA D, a lower PA emission efficiency was observed, likely reflecting different PA efficiency due to a different polymerization degree when compared to PheoBSA D. Photoacoustic emission showed a linear dependence with the concentration for all the investigated systems (Figure 2C). When compared with a previously reported system, melanin free acid (MFA-PEG) [47], it was found that PheoBSA D displayed almost a two-fold increase in PA contrast capability (Figure 2D).

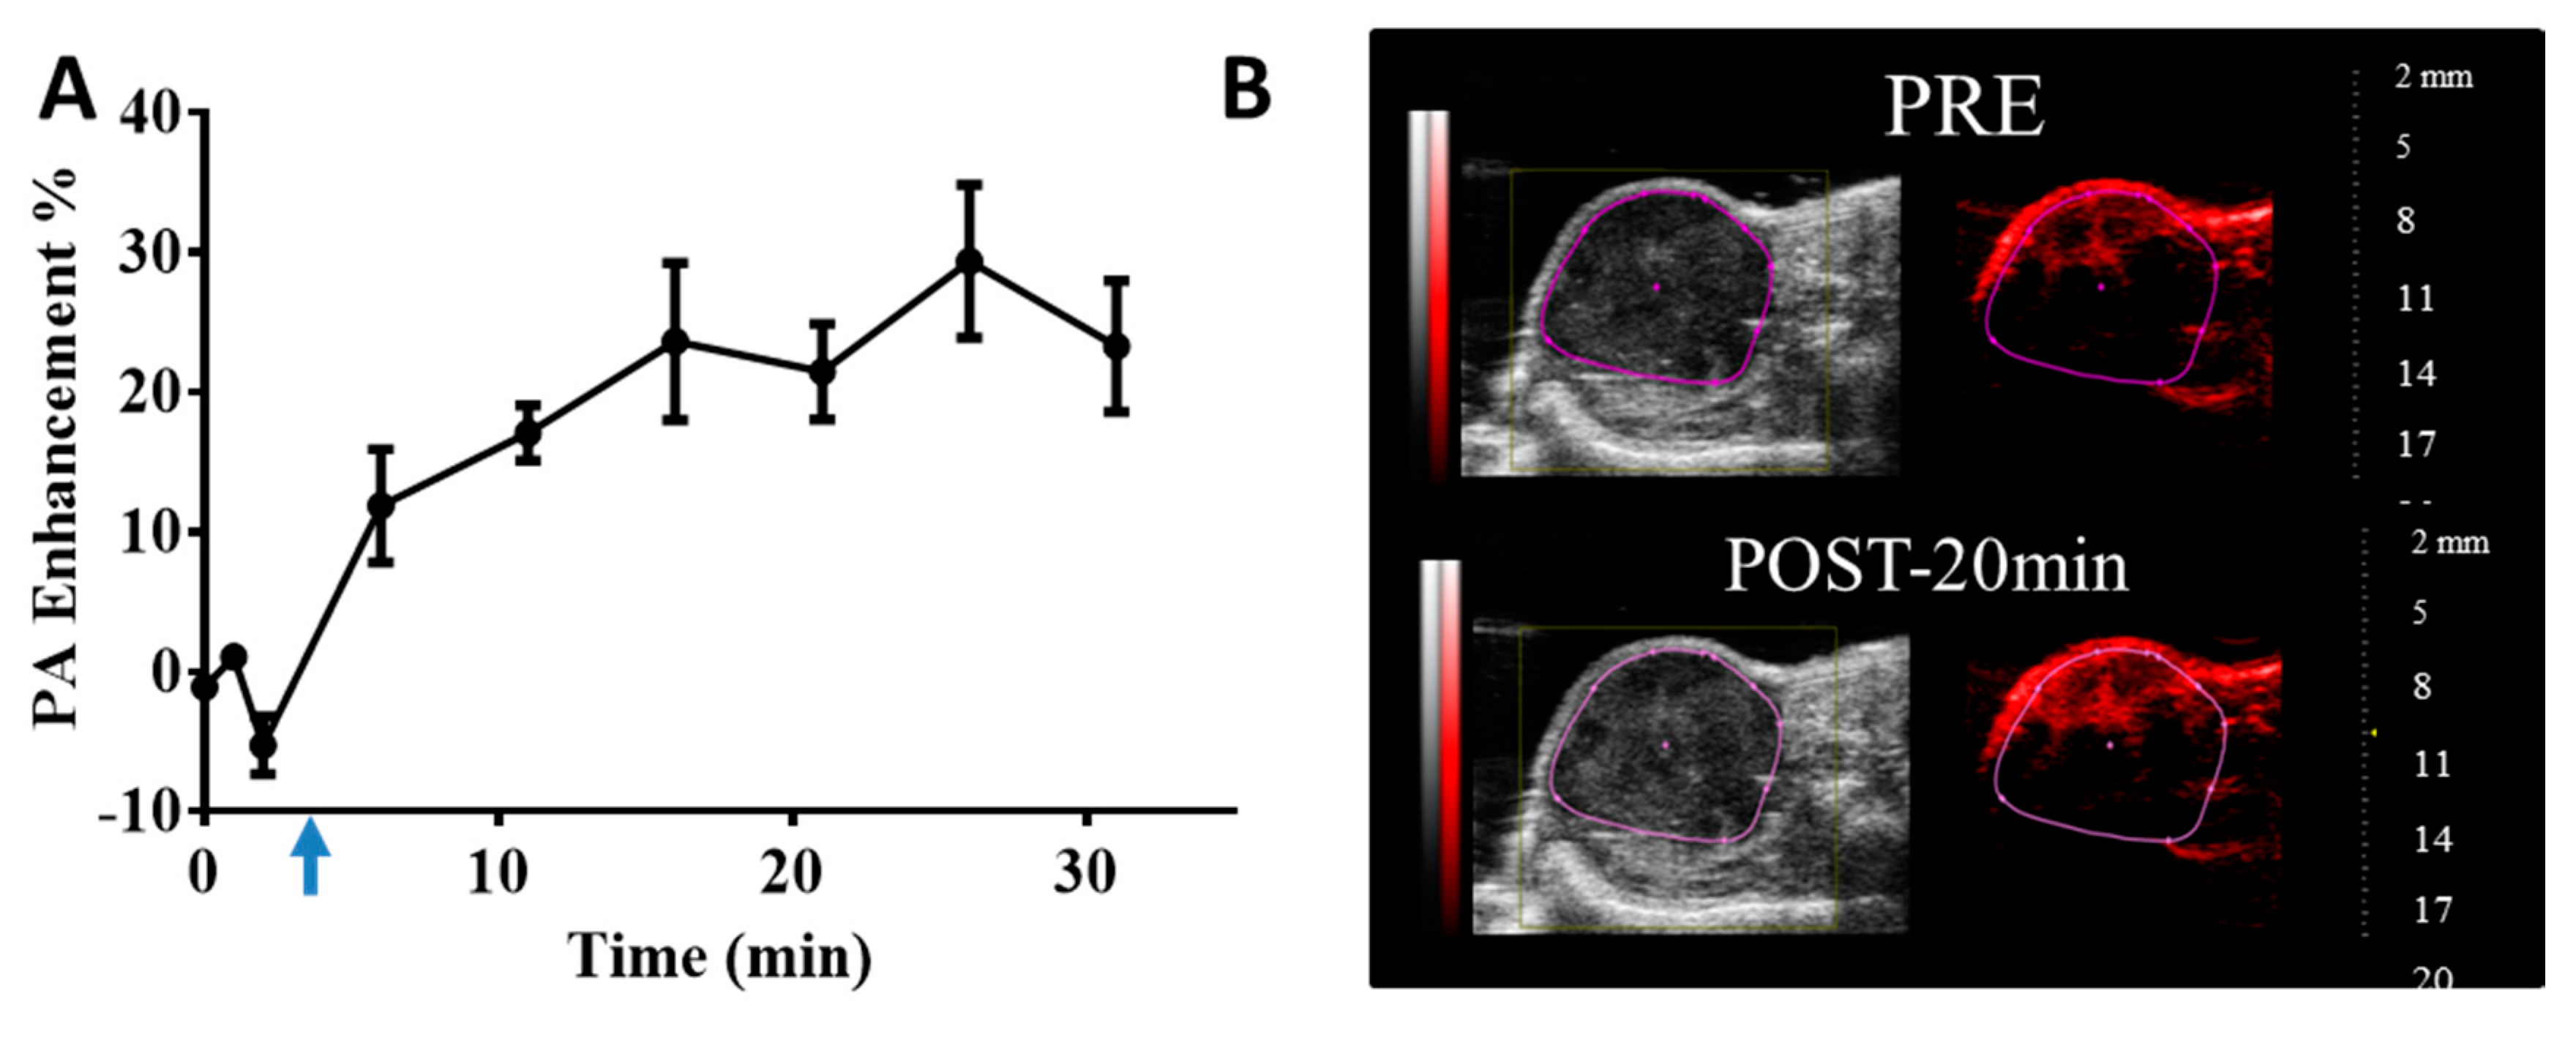
3.2. PheoBSA Conjugate D In Vivo Biodistribution and Tumor Detection

The toxicity of PheoBSA D was evaluated by incubating J774A.1 cells in presence of several concentrations of the melanin/BSA conjugate. As can be seen from the graph (Figure 3A), after three days, no cell toxicity was detected. The vitality of the J774A.1 cells was completely unaffected by the presence of the PheoBSA conjugate up to the concentration of 2.5 mg/mL, whereas at higher concentrations, a moderate toxicity was measured, although any side effects in any of the injected animal was observed. The PheoBSA D showed also high stability in serum for several hours and titrated at different pH (Figure 3B).
The distribution of PheoBSA-FITC (300 µL/mouse of a 2 mg/mL solution) after IV administration was investigated in male Athymic nude mice (n = 6) which were subcutaneously inoculated with human prostate PC-3 cancer cells. Ex vivo optical imaging experiments on excised organs, i.e., tumor, liver, brain, kidneys, spleen, heart, lungs, and muscle were performed at 4 h and 24 h post-injection (Figure 3C,D). Images recorded 4 h after the injection showed an intense signal at kidneys and in the tumor regions whereas very weak signals were detected for liver, muscle, and lungs. No signal could be detected from the brain, heart, and spleen. After 24 h post-injection, the signal decreased although it remained still detectable in tumor and kidneys. All the other organs showed a signal comparable with the fluorescence observed in not treated animals (data not show).
The capability of PheoBSA D for tumor imaging was further assessed by acquiring PA images in HER2 positive breast TS/A tumor models. The acquisitions were carried out either on VevoLazr 2100 (Visualsonic) and LOIS 3D (Tomowave) systems (Figure 4 and Figure 5). A net tumor contrast enhancement during the first 30 min from the administration of the CA was observed on both scanners. The VevoLazr photoacoustic imager generates a lower tumor enhancement compared to those obtained with the LOIS 3D, as reported in Figure 4 and Figure 5.
A possible reason for the observed findings appears related to the different instrument configuration that allows one to acquire a 3D image with the LOIS and 2D with the Vevo with different penetration depth [54,55]. Photoacoustic signal is partly limited to the epithelial tumor zone by Vevo, so the enhancement is calculated from about one-third to one-half of the entire ROI drawn on the tumor (Figure 4B). However, the VevoLazr is closer to a clinical setup with a handheld probe.
Upon comparing the results obtained using the LOIS 3D system it was found that PheoBSA D photoacoustic enhancement in the prostate tumor model roughly doubled the signal enhancement observed for the TS/A tumor model. This observation may be accounted for in terms of a larger vascularization of prostate cancer and consequently the major distribution of the blood pool agent. As a proof of concept for a DCE-PA imaging experiment that exploits the altered permeability of tumor vasculature, the photoacoustic signal was acquired every 72 s and the uptake of the melanin-based contrast agent PheoBSA D over time was assessed in the tumor region (Figure 6). This result demonstrated a slow but steady increase of the PA signal with a peak at about 15–25 min after the injection of PheoBSA D, that one may assume as the time needed for the extravasation and accumulation of the nano-sized agent in the tumor region. More quantitative analysis for DCE-PA imaging has also been proposed for taking into account the different compartments and laser fluence [56,57]. In the last years, similar dynamic contrast enhancement photoacoustic 3D PA studies using ICG as contrast agent have been performed [58,59,60,61]. However, ICG applications are limited by their rapid clearance, low photostability, low water solubility, and tendency to form aggregates. Herein we propose a melanin-based nanoparticle endowed with a longer circulation time compared to ICG-albumin adduct that allows for prolonged DCE experiments.

4. Conclusions

The herein reported results show that PheoBSA D is a promising melanin-based contrast agent for photoacoustic imaging. This nanosystem represents the prototype of a class of PAI-CAs based on the melanin-albumin conjugates, characterized by a relatively small size, improved photoacoustic properties, and excellent biocompatibility. The in vivo tumor uptake was evaluated by two different optoacoustic scanners which showed the capability of this nanosystem to report on tumor vascularity in two murine tumor models. Further studies are needed to evaluate the PAI properties of these compounds in comparison to FDA approved dyes such as indocyanine green.

Supplementary Materials

The following are available online at https://www.mdpi.com/2076-3417/10/23/8313/s1, Figure S1: Hydrodynamic sizes of the conjugates determined by dynamic light scattering (DSL) using a 90 Plus particle size analyzer (Malvern, Zetasizer). Figure S2: Calibration curve for FITC quantification. Figure S3: Excitation and emission spectra of PheoBSA-FITC. Table S1: Summary of the several prepared melanin-BSA conjugates.

Author Contributions

Conceptualization, S.A. and D.L.L.; data curation, R.S., L.R., F.A., and A.A.; formal analysis, L.C., A.A. and J.C.; funding acquisition, S.A.; methodology, M.C. and R.S.; software, L.R. and J.C.; supervision, S.A.; validation, D.L.L.; writing—original draft, M.C., R.S., F.A., L.C., and A.A.; writing—review and editing, D.L.L. and S.A. All authors have read and agreed to the published version of the manuscript.

Funding

M.C. was supported by an AIRC fellowship for Italy (AIRC #20124).

Acknowledgments

We thank Alexander Oraevsky from Tomowave for the loan of the LOIS 3D Pre-clinical Imaging System, Richard Su for helping in image processing and Angelo Ferrario for the loan of the Quanta laser.

Conflicts of Interest

The authors declare no conflict of interest.

References

  1. Bell, A.G. On the production and reproduction of sound by light. Am. J. Sci. 1880, 20, 305–324. [Google Scholar] [CrossRef] [Green Version]
  2. Zackrisson, S.; van de Ven, S.M.; Gambhir, S.S. Light in and sound out: Emerging translational strategies for photoacoustic imaging. Cancer Res. 2014, 74, 979–1004. [Google Scholar] [CrossRef] [PubMed] [Green Version]
  3. Jacques, S.L. Optical properties of biological tissues: A review. Phys. Med. Biol. 2013, 58, R37–R61. [Google Scholar] [CrossRef] [PubMed]
  4. Schwarz, M.; Buehler, A.; Aguirre, J.; Ntziachristos, V. Three-dimensional multispectral optoacoustic mesoscopy reveals melanin and blood oxygenation in human skin in vivo. J. Biophotonics 2016, 9, 55–60. [Google Scholar] [CrossRef]
  5. Bohndiek, S.E.; Sasportas, L.S.; Machtaler, S.; Jokerst, J.V.; Hori, S.; Gambhir, S.S. Photoacoustic Tomography Detects Early Vessel Regression and Normalization During Ovarian Tumor Response to the Antiangiogenic Therapy Trebananib. J. Nucl. Med. 2015, 56, 1942–1947. [Google Scholar] [CrossRef] [Green Version]
  6. Heijblom, M.; Piras, D.; Brinkhuis, M.; van Hespen, J.C.; van den Engh, F.M.; van der Schaaf, M.; Klaase, J.M.; van Leeuwen, T.G.; Steenbergen, W.; Manohar, S. Photoacoustic image patterns of breast carcinoma and comparisons with Magnetic Resonance Imaging and vascular stained histopathology. Sci. Rep. 2015, 5, 11778. [Google Scholar] [CrossRef] [Green Version]
  7. Heijblom, M.; Klaase, J.M.; van den Engh, F.M.; van Leeuwen, T.G.; Steenbergen, W.; Manohar, S. Imaging tumor vascularization for detection and diagnosis of breast cancer. Technol. Cancer Res. Treat. 2011, 10, 607–623. [Google Scholar] [CrossRef] [Green Version]
  8. Stoffels, I.; Morscher, S.; Helfrich, I.; Hillen, U.; Lehy, J.; Burton, N.C.; Sardella, T.C.; Claussen, J.; Poeppel, T.D.; Bachmann, H.S.; et al. Metastatic status of sentinel lymph nodes in melanoma determined noninvasively with multispectral optoacoustic imaging. Sci. Transl. Med. 2015, 7, 317ra199. [Google Scholar] [CrossRef]
  9. Fu, Q.; Zhu, R.; Song, J.; Yang, H.; Chen, X. Photoacoustic Imaging: Contrast Agents and Their Biomedical Applications. Adv. Mater. 2019, 31, e1805875. [Google Scholar] [CrossRef]
  10. Weber, J.; Beard, P.C.; Bohndiek, S.E. Contrast agents for molecular photoacoustic imaging. Nat. Methods 2016, 13, 639–650. [Google Scholar] [CrossRef] [Green Version]
  11. Wu, D.; Huang, L.; Jiang, M.S.; Jiang, H. Contrast agents for photoacoustic and thermoacoustic imaging: A review. Int. J. Mol. Sci. 2014, 15, 23616–23639. [Google Scholar] [CrossRef] [PubMed]
  12. Borg, R.E.; Rochford, J. Molecular Photoacoustic Contrast Agents: Design Principles & Applications. Photochem. Photobiol. 2018, 94, 1175–1209. [Google Scholar] [CrossRef] [PubMed]
  13. Luke, G.P.; Yeager, D.; Emelianov, S.Y. Biomedical applications of photoacoustic imaging with exogenous contrast agents. Ann. Biomed. Eng. 2012, 40, 422–437. [Google Scholar] [CrossRef] [PubMed]
  14. Bhattacharyya, S.; Wang, S.; Reinecke, D.; Kiser, W.; Kruger, R.A.; DeGrado, T.R. Synthesis and evaluation of near-infrared (NIR) dye-herceptin conjugates as photoacoustic computed tomography (PCT) probes for HER2 expression in breast cancer. Bioconjug. Chem. 2008, 19, 1186–1193. [Google Scholar] [CrossRef] [Green Version]
  15. Beziere, N.; Lozano, N.; Nunes, A.; Salichs, J.; Queiros, D.; Kostarelos, K.; Ntziachristos, V. Dynamic imaging of PEGylated indocyanine green (ICG) liposomes within the tumor microenvironment using multi-spectral optoacoustic tomography (MSOT). Biomaterials 2015, 37, 415–424. [Google Scholar] [CrossRef]
  16. Capozza, M.; Blasi, F.; Valbusa, G.; Oliva, P.; Cabella, C.; Buonsanti, F.; Cordaro, A.; Pizzuto, L.; Maiocchi, A.; Poggi, L. Photoacoustic imaging of integrin-overexpressing tumors using a novel ICG-based contrast agent in mice. Photoacoustics 2018, 11, 36–45. [Google Scholar] [CrossRef]
  17. Kim, G.; Huang, S.W.; Day, K.C.; O’Donnell, M.; Agayan, R.R.; Day, M.A.; Kopelman, R.; Ashkenazi, S. Indocyanine-green-embedded PEBBLEs as a contrast agent for photoacoustic imaging. J. Biomed. Opt. 2007, 12, 044020. [Google Scholar] [CrossRef] [Green Version]
  18. Ferrauto, G.; Carniato, F.; Di Gregorio, E.; Tei, L.; Botta, M.; Aime, S. Large photoacoustic effect enhancement for ICG confined inside MCM-41 mesoporous silica nanoparticles. Nanoscale 2017, 9, 99–103. [Google Scholar] [CrossRef]
  19. De la Zerda, A.; Zavaleta, C.; Keren, S.; Vaithilingam, S.; Bodapati, S.; Liu, Z.; Levi, J.; Smith, B.R.; Ma, T.J.; Oralkan, O.; et al. Carbon nanotubes as photoacoustic molecular imaging agents in living mice. Nat. Nanotechnol. 2008, 3, 557–562. [Google Scholar] [CrossRef]
  20. Pramanik, M.; Swierczewska, M.; Green, D.; Sitharaman, B.; Wang, L.V. Single-walled carbon nanotubes as a multimodal-thermoacoustic and photoacoustic-contrast agent. J. Biomed. Opt. 2009, 14, 034018. [Google Scholar] [CrossRef] [Green Version]
  21. Xiang, L.; Yuan, Y.; Xing, D.; Ou, Z.; Yang, S.; Zhou, F. Photoacoustic molecular imaging with antibody-functionalized single-walled carbon nanotubes for early diagnosis of tumor. J. Biomed. Opt. 2009, 14, 021008. [Google Scholar] [CrossRef] [PubMed] [Green Version]
  22. Lu, W.; Huang, Q.; Ku, G.; Wen, X.; Zhou, M.; Guzatov, D.; Brecht, P.; Su, R.; Oraevsky, A.; Wang, L.V.; et al. Photoacoustic imaging of living mouse brain vasculature using hollow gold nanospheres. Biomaterials 2010, 31, 2617–2626. [Google Scholar] [CrossRef] [PubMed] [Green Version]
  23. Li, W.; Chen, X. Gold nanoparticles for photoacoustic imaging. Nanomedicine 2015, 10, 299–320. [Google Scholar] [CrossRef] [PubMed] [Green Version]
  24. Song, K.H.; Kim, C.; Cobley, C.M.; Xia, Y.; Wang, L.V. Near-infrared gold nanocages as a new class of tracers for photoacoustic sentinel lymph node mapping on a rat model. Nano Lett. 2009, 9, 183–188. [Google Scholar] [CrossRef] [Green Version]
  25. Locatelli, E.; Li, Y.; Monaco, I.; Guo, W.; Maturi, M.; Menichetti, L.; Armanetti, P.; Martin, R.C.; Comes Franchini, M. A novel theranostic gold nanorods- and Adriamycin-loaded micelle for EpCAM targeting, laser ablation, and photoacoustic imaging of cancer stem cells in hepatocellular carcinoma. Int. J. Nanomed. 2019, 14, 1877–1892. [Google Scholar] [CrossRef] [Green Version]
  26. Du, Y.; Jiang, Q.; Beziere, N.; Song, L.; Zhang, Q.; Peng, D.; Chi, C.; Yang, X.; Guo, H.; Diot, G.; et al. DNA-Nanostructure-Gold-Nanorod Hybrids for Enhanced In Vivo Optoacoustic Imaging and Photothermal Therapy. Adv. Mater. 2016, 28, 10000–10007. [Google Scholar] [CrossRef]
  27. Armanetti, P.; Flori, A.; Avigo, C.; Conti, L.; Valtancoli, B.; Petroni, D.; Doumett, S.; Cappiello, L.; Ravagli, C.; Baldi, G.; et al. Spectroscopic and photoacoustic characterization of encapsulated iron oxide super-paramagnetic nanoparticles as a new multiplatform contrast agent. Spectrochim. Acta. A Mol. Biomol. Spectrosc. 2018, 199, 248–253. [Google Scholar] [CrossRef]
  28. Merkes, J.M.; Zhu, L.; Bahukhandi, S.B.; Rueping, M.; Kiessling, F.; Banala, S. Photoacoustic Imaging Probes Based on Tetrapyrroles and Related Compounds. Int. J. Mol. Sci. 2020, 21, 3082. [Google Scholar] [CrossRef]
  29. Banala, S.; Fokong, S.; Brand, C.; Andreou, C.; Krautler, B.; Rueping, M.; Kiessling, F. Quinone-fused porphyrins as contrast agents for photoacoustic imaging. Chem. Sci. 2017, 8, 6176–6181. [Google Scholar] [CrossRef] [Green Version]
  30. Jokerst, J.V.; Van de Sompel, D.; Bohndiek, S.E.; Gambhir, S.S. Cellulose Nanoparticles are a Biodegradable Photoacoustic Contrast Agent for Use in Living Mice. Photoacoustics 2014, 2, 119–127. [Google Scholar] [CrossRef] [Green Version]
  31. Chekkoury, A.; Nunes, A.; Gateau, J.; Symvoulidis, P.; Feuchtinger, A.; Beziere, N.; Ovsepian, S.V.; Walch, A.; Ntziachristos, V. High-Resolution Multispectral Optoacoustic Tomography of the Vascularization and Constitutive Hypoxemia of Cancerous Tumors. Neoplasia 2016, 18, 459–467. [Google Scholar] [CrossRef] [PubMed] [Green Version]
  32. Razansky, D.; Ntziachristos, V. Optical and Optoacoustic Imaging. Recent Results Cancer Res. 2020, 216, 155–187. [Google Scholar] [CrossRef] [PubMed]
  33. Haedicke, K.; Agemy, L.; Omar, M.; Berezhnoi, A.; Roberts, S.; Longo-Machado, C.; Skubal, M.; Nagar, K.; Hsu, H.T.; Kim, K.; et al. High-resolution optoacoustic imaging of tissue responses to vascular-targeted therapies. Nat. Biomed. Eng. 2020, 4, 286–297. [Google Scholar] [CrossRef] [PubMed]
  34. Tomaszewski, M.R.; Gehrung, M.; Joseph, J.; Quiros-Gonzalez, I.; Disselhorst, J.A.; Bohndiek, S.E. Oxygen-Enhanced and Dynamic Contrast-Enhanced Optoacoustic Tomography Provide Surrogate Biomarkers of Tumor Vascular Function, Hypoxia, and Necrosis. Cancer Res. 2018, 78, 5980–5991. [Google Scholar] [CrossRef] [Green Version]
  35. Pagel, M.D. Science to practice: Can photoacoustic imaging be used to monitor tumor oxygenation and the effects of antivascular chemotherapies? Radiology 2015, 275, 1–2. [Google Scholar] [CrossRef] [Green Version]
  36. Longmire, M.; Choyke, P.L.; Kobayashi, H. Clearance properties of nano-sized particles and molecules as imaging agents: Considerations and caveats. Nanomedicine 2008, 3, 703–717. [Google Scholar] [CrossRef] [Green Version]
  37. Oh, J.T.; Li, M.L.; Zhang, H.F.; Maslov, K.; Stoica, G.; Wang, L.V. Three-dimensional imaging of skin melanoma in vivo by dual-wavelength photoacoustic microscopy. J. Biomed. Opt. 2006, 11, 34032. [Google Scholar] [CrossRef]
  38. Stoffels, I.; Dissemond, J.; Pöppel, T.; Schadendorf, D.; Klode, J. Intraoperative Fluorescence Imaging for Sentinel Lymph Node Detection: Prospective Clinical Trial to Compare the Usefulness of Indocyanine Green vs Technetium Tc 99m for Identification of Sentinel Lymph Nodes. JAMA Surg. 2015, 150, 617–623. [Google Scholar] [CrossRef]
  39. Silvestri, B.; Armanetti, P.; Sanità, G.; Vitiello, G.; Lamberti, A.; Calì, G.; Pezzella, A.; Luciani, G.; Menichetti, L.; Luin, S.; et al. Silver-nanoparticles as plasmon-resonant enhancers for eumelanin’s photoacoustic signal in a self-structured hybrid nanoprobe. Mater. Sci. Eng. C Mater. Biol. Appl. 2019, 102, 788–797. [Google Scholar] [CrossRef]
  40. Fedorow, H.; Tribl, F.; Halliday, G.; Gerlach, M.; Riederer, P.; Double, K.L. Neuromelanin in human dopamine neurons: Comparison with peripheral melanins and relevance to Parkinson’s disease. Prog. Neurobiol. 2005, 75, 109–124. [Google Scholar] [CrossRef]
  41. Ito, S.; Wakamatsu, K. Chemistry of mixed melanogenesis—Pivotal roles of dopaquinone. Photochem. Photobiol. 2008, 84, 582–592. [Google Scholar] [CrossRef] [PubMed]
  42. Zucca, F.A.; Segura-Aguilar, J.; Ferrari, E.; Muñoz, P.; Paris, I.; Sulzer, D.; Sarna, T.; Casella, L.; Zecca, L. Interactions of iron, dopamine and neuromelanin pathways in brain aging and Parkinson’s disease. Prog. Neurobiol. 2017, 155, 96–119. [Google Scholar] [CrossRef] [PubMed]
  43. Fan, Q.; Cheng, K.; Hu, X.; Ma, X.; Zhang, R.; Yang, M.; Lu, X.; Xing, L.; Huang, W.; Gambhir, S.S.; et al. Transferring biomarker into molecular probe: Melanin nanoparticle as a naturally active platform for multimodality imaging. J. Am. Chem. Soc. 2014, 136, 15185–15194. [Google Scholar] [CrossRef] [PubMed] [Green Version]
  44. Liopo, A.; Oraevsky, A. Methods and Compositions for Carrier Agents and Clearing Agents Used in Optoacoustic Imaging Systems. U.S. Patent No. 9,615,750, 11 April 2017. [Google Scholar]
  45. Liopo, A.; Su, R.; Oraevsky, A.A. Melanin nanoparticles as a novel contrast agent for optoacoustic tomography. Photoacoustics 2015, 3, 35–43. [Google Scholar] [CrossRef] [PubMed] [Green Version]
  46. Repenko, T.; Fokong, S.; De Laporte, L.; Go, D.; Kiessling, F.; Lammers, T.; Kuehne, A.J. Water-soluble dopamine-based polymers for photoacoustic imaging. Chem. Commun. 2015, 51, 6084–6087. [Google Scholar] [CrossRef] [PubMed] [Green Version]
  47. Longo, D.L.; Stefania, R.; Callari, C.; De Rose, F.; Rolle, R.; Conti, L.; Consolino, L.; Arena, F.; Aime, S. Water Soluble Melanin Derivatives for Dynamic Contrast Enhanced Photoacoustic Imaging of Tumor Vasculature and Response to Antiangiogenic Therapy. Adv. Health Mater. 2017, 6, 1600550. [Google Scholar] [CrossRef] [Green Version]
  48. Ju, K.Y.; Kang, J.; Pyo, J.; Lim, J.; Chang, J.H.; Lee, J.K. pH-Induced aggregated melanin nanoparticles for photoacoustic signal amplification. Nanoscale 2016, 8, 14448–14456. [Google Scholar] [CrossRef] [Green Version]
  49. Li, Y.; Jiang, C.; Zhang, D.; Wang, Y.; Ren, X.; Ai, K.; Chen, X.; Lu, L. Targeted polydopamine nanoparticles enable photoacoustic imaging guided chemo-photothermal synergistic therapy of tumor. Acta Biomater 2017, 47, 124–134. [Google Scholar] [CrossRef] [Green Version]
  50. Zhang, L.; Su, H.; Cai, J.; Cheng, D.; Ma, Y.; Zhang, J.; Zhou, C.; Liu, S.; Shi, H.; Zhang, Y.; et al. A Multifunctional Platform for Tumor Angiogenesis-Targeted Chemo-Thermal Therapy Using Polydopamine-Coated Gold Nanorods. ACS Nano 2016, 10, 10404–10417. [Google Scholar] [CrossRef]
  51. Zhang, L.; Sheng, D.; Wang, D.; Yao, Y.; Yang, K.; Wang, Z.; Deng, L.; Chen, Y. Bioinspired Multifunctional Melanin-Based Nanoliposome for Photoacoustic/Magnetic Resonance Imaging-Guided Efficient Photothermal Ablation of Cancer. Theranostics 2018, 8, 1591–1606. [Google Scholar] [CrossRef]
  52. Longo, D.L.; Stefania, R.; Aime, S.; Oraevsky, A. Melanin-Based Contrast Agents for Biomedical Optoacoustic Imaging and Theranostic Applications. Int. J. Mol. Sci. 2017, 18, 1719. [Google Scholar] [CrossRef] [PubMed] [Green Version]
  53. Ferrari, E.; Engelen, M.; Monzani, E.; Sturini, M.; Girotto, S.; Bubacco, L.; Zecca, L.; Casella, L. Synthesis and structural characterization of soluble neuromelanin analogs provides important clues to its biosynthesis. J. Biol. Inorg. Chem. 2013, 18, 81–93. [Google Scholar] [CrossRef] [PubMed]
  54. Tsyboulski, D.A.; Liopo, A.V.; Su, R.; Ermilov, S.A.; Bachilo, S.M.; Weisman, R.B.; Oraevsky, A.A. Enabling in vivo measurements of nanoparticle concentrations with three-dimensional optoacoustic tomography. J. Biophotonics 2014, 7, 581–588. [Google Scholar] [CrossRef] [PubMed] [Green Version]
  55. Su, R.; Ermilov, S.A.; Liopo, A.V.; Oraevsky, A.A. Three-dimensional optoacoustic imaging as a new noninvasive technique to study long-term biodistribution of optical contrast agents in small animal models. J. Biomed. Opt. 2012, 17, 101506. [Google Scholar] [CrossRef] [PubMed]
  56. Xiao, T.G.; Weis, J.A.; Gayzik, F.S.; Thomas, A.; Chiba, A.; Gurcan, M.N.; Topaloglu, U.; Samykutty, A.; McNally, L.R. Applying dynamic contrast enhanced MSOT imaging to intratumoral pharmacokinetic modeling. Photoacoustics 2018, 11, 28–35. [Google Scholar] [CrossRef]
  57. Hupple, C.W.; Morscher, S.; Burton, N.C.; Pagel, M.D.; McNally, L.R.; Cardenas-Rodriguez, J. A light-fluence-independent method for the quantitative analysis of dynamic contrast-enhanced multispectral optoacoustic tomography (DCE MSOT). Photoacoustics 2018, 10, 54–64. [Google Scholar] [CrossRef]
  58. Okumura, K.; Yoshida, K.; Yoshioka, K.; Aki, S.; Yoneda, N.; Inoue, D.; Kitao, A.; Ogi, T.; Kozaka, K.; Minami, T.; et al. Photoacoustic imaging of tumour vascular permeability with indocyanine green in a mouse model. Eur. Radiol. Exp. 2018, 2, 5. [Google Scholar] [CrossRef] [Green Version]
  59. Herzog, E.; Taruttis, A.; Beziere, N.; Lutich, A.A.; Razansky, D.; Ntziachristos, V. Optical imaging of cancer heterogeneity with multispectral optoacoustic tomography. Radiology 2012, 263, 461–468. [Google Scholar] [CrossRef] [Green Version]
  60. Ermolayev, V.; Dean-Ben, X.L.; Mandal, S.; Ntziachristos, V.; Razansky, D. Simultaneous visualization of tumour oxygenation, neovascularization and contrast agent perfusion by real-time three-dimensional optoacoustic tomography. Eur. Radiol. 2016, 26, 1843–1851. [Google Scholar] [CrossRef]
  61. Ding, L.; Razansky, D.; Dean-Ben, X.L. Model-Based Reconstruction of Large Three-Dimensional Optoacoustic Datasets. IEEE Trans. Med. Imaging. 2020, 39, 2931–2940. [Google Scholar] [CrossRef]
Figure 1. The synthesis scheme of Pheomelanin-BSA and Eumelanin-BSA conjugates.
Applsci 10 08313 g001
Figure 2. In vitro imaging characterization of different melanin-BSA conjugates. (A) Absorption spectra. (B) Photoacoustic spectra. (C) Photoacoustic emission registered at 730 nm at different concentrations. (D) Comparison of photoacoustic efficiency between PheoBSA D and MFA-PEG.
Applsci 10 08313 g002
Figure 3. (A) J774A.1 cell viability measured after 24 h of incubation with different concentrations of PheoBSA D. Data are shown as mean percentage ± SD of viable cells normalized to untreated cells. (B) Serum stability measured at different pH. (C) Ex-vivo optical imaging of tumor (T), liver (L1), heart (H), brain (B), kidney (K), lung (L2), spleen (S), and muscle (M) of PC-3 tumor-bearing mice (n = 3 mice/group) at 4 and 24 h post-PheoBSA-FITC injection. (D) Ex-vivo optical signal PC-3 tumor-bearing mice after PheoBSA-FITC administration at 4 and 24 h post-injection, expressed as Average Radiant Efficiency (mean ± SD).
Applsci 10 08313 g003
Figure 4. Photoacoustic signal measured by Vevo Lazr before and after (arrow) IV administration of PheoBSA D at a dose of 10 mg/kg in TS/A tumors (n = 4). (A) Photoacoustic enhancement measured at 730 nm. (B) B-mode ultrasound (left) and photoacoustic images (right) of a representative TS/A tumor-bearing mouse before and 20 min after the intravenous injection of PheoBSA D (dose: 10 mg/kg).
Applsci 10 08313 g004
Figure 5. Photoacoustic signal measured by Lois 3D Tomowave after 10, 20, and 30 min IV administration of PheoBSA D at a dose of 10 mg/kg in (A) TS/A tumor-bearing mice (n = 2) and (B) PC3 tumor-bearing mice. (C) Representative images before (PRE) and 20 min post-injection in TS/A breast tumor-bearing mice and (D) PC3 prostate tumor-bearing mice.
Applsci 10 08313 g005
Figure 6. Dynamic contrast enhancement 3D photoacoustic enhancement after IV administration of 10 mg/kg of PheoBSA D. (A) photoacoustic signal enhancement and (B) representative images at several time points. Sampling time = 72 s.
Applsci 10 08313 g006
Publisher’s Note: MDPI stays neutral with regard to jurisdictional claims in published maps and institutional affiliations.

