Article

PICCOLO White-Light and Narrow-Band Imaging Colonoscopic Dataset: A Performance Comparative of Models and Datasets

by
Luisa F. Sánchez-Peralta
1,*,
J. Blas Pagador
1,
Artzai Picón
2,
Ángel José Calderón
3,
Francisco Polo
3,
Nagore Andraka
4,
Roberto Bilbao
4,
Ben Glover
5,
Cristina L. Saratxaga
2 and
Francisco M. Sánchez-Margallo
1
1
Jesús Usón Minimally Invasive Surgery Centre, N-521, km 41.7, E-10071 Cáceres, Spain
2
TECNALIA, Basque Research and Technology Alliance (BRTA), Parque Tecnológico de Bizkaia, C/Geldo. Edificio 700, E-48160 Derio-Bizkaia, Spain
3
Gastroenterology Department, Hospital Universitario Basurto, Avenida Montevideo, 18. E-48013 Bilbao, Spain
4
Basque Biobank, Basque Foundation for Health Innovation and Research-BIOEF, Ronda de Azkue 1, E-48902 Barakaldo, Spain
5
Imperial College London, Exhibition Road, South Kensington, London SW7 2BU, UK
*
Author to whom correspondence should be addressed.
Appl. Sci. 2020, 10(23), 8501; https://doi.org/10.3390/app10238501
Submission received: 30 October 2020 / Revised: 20 November 2020 / Accepted: 22 November 2020 / Published: 28 November 2020
(This article belongs to the Special Issue Deep Learning Applied to Image Processing)

Abstract

:

Featured Application

This dataset can be used for supervised training of models for colorectal polyp detection, localisation, segmentation and classification.

Abstract

Colorectal cancer is one of the world leading death causes. Fortunately, an early diagnosis allows for effective treatment, increasing the survival rate. Deep learning techniques have shown their utility for increasing the adenoma detection rate at colonoscopy, but a dataset is usually required so the model can automatically learn features that characterize the polyps. In this work, we present the PICCOLO dataset, that comprises 3433 manually annotated images (2131 white-light images 1302 narrow-band images), originated from 76 lesions from 40 patients, which are distributed into training (2203), validation (897) and test (333) sets assuring patient independence between sets. Furthermore, clinical metadata are also provided for each lesion. Four different models, obtained by combining two backbones and two encoder–decoder architectures, are trained with the PICCOLO dataset and other two publicly available datasets for comparison. Results are provided for the test set of each dataset. Models trained with the PICCOLO dataset have a better generalization capacity, as they perform more uniformly along test sets of all datasets, rather than obtaining the best results for its own test set. This dataset is available at the website of the Basque Biobank, so it is expected that it will contribute to the further development of deep learning methods for polyp detection, localisation and classification, which would eventually result in a better and earlier diagnosis of colorectal cancer, hence improving patient outcomes.

Graphical Abstract

1. Introduction

Colorectal Cancer (CRC) represents a 10% of overall new cases and presents higher incidence rate in developed countries [1] and could be considered a “lifestyle” disease associated with a diet high in calories and animal fat, and sedentarism [2]. In the United States, it has increased from over 132,000 estimated new cases and nearly 50,000 estimated deaths in 2015 [3] to 147,000 estimated new cases and 53,200 estimated deaths in 2020, being the third most commonly diagnosed cancer type [4]. Despite this, CRC detection increases the 5-year survival rate from 18% to 88.5% if diagnosed at an early stage. Furthermore, screening programs allow for detection before the appearance of symptoms so up to 22% of symptomatic cases could be treated earlier [5]. Colonoscopy is the gold standard procedure for detection and treatment of colorectal lesions, and its efficacy is related to the Adenoma Detection Rate (ADR) of the endoscopist, defined as the percentage of colonoscopies with at least one adenoma identified [6]. It is shown that higher ADR is associated with lower interval CRC rates [7], and that flat/sessile and small lesions are frequently more missed than pedunculated/sub-pedunculated and large ones [8,9]. Therefore, different approaches might be followed to improve ADR and reduce the number of missed lesions. During colonoscopy, these approaches include endoscope caps, positional manoeuvres, as well as the use of imaging modalities such as narrow-band imaging (NBI) which emphasize the capillary pattern and mucosa surface which emphasize the capillary pattern and mucosa surface [10]. It is clear that further development of Computer Assisted Diagnosis (CAD) systems is justified thanks to their potential to eventually improve the patient outcome [11].
In recent years, artificial intelligence (AI) and deep learning (DL) [12] have significantly contributed to the field of medical imaging analysis [13,14,15] and the use of AI in colonoscopy has showed promising results to increase ADR, although it should be further evaluated in more randomized controlled trials [16]. In the same trend, DL has also boosted the appearance of methods for polyp detection, localisation and segmentation, where end-to-end methods based on convolutional neural networks accompanied by data augmentation strategies are frequently used [17]. Nevertheless, methods for polyp detection are currently more advanced than methods for polyp classification, which might be due to a lack of available datasets for this task [18]. Lastly, it is important to mention that the availability of high-quality endoscopic images and the increased understanding of the technology by the endoscopists are two important factor for the further development of DL for endoscopy [19].
All deep learning approaches rely on a dataset based from which features can be learnt. If the training method is supervised, then the dataset should be labelled. Alternatively, semi-supervised training makes the most of labelled and unlabelled datasets. In the case of medical imaging datasets [20], data are hard to retrieve from healthcare systems, so it is necessary to obtain ethical approval and differently to labelling natural images, manually annotation of medical images is a cumbersome, time-consuming process that requires expert knowledge [21]. Especially when segmentation is the target, two main limitations are also usually recognized: scarce annotations and weak annotations [22]. Therefore, labelled datasets are usually smaller than non-labelled datasets, but in both cases, they are difficult to obtain, and, in many cases, they are proprietary datasets not publicly available for the research community.
There are currently some publicly available datasets of colonoscopy images that can be used for polyp detection, localisation and segmentation [17,18]. A general trend is that the more precise the annotation is, the smaller the dataset size is. In the matter at hand, annotation of manual precise binary masks is more time demanding than just labelling frames. The size of the publicly available datasets might range from hundreds of frames when a precise manually segmented binary mask is provided, to thousands of video frames if an approximated binary mask is created. The dataset CVC-EndosceneStill [23] provides manually segmented binary masks for polyp, background, lumen and specular lights classes. In all, 912 images are available. It also splits the dataset into training, validation and test sets and indicates the recommended metrics, so providing a common dataset which facilitates the proper comparison of methods. Kvasir-SEG [24] includes 1000 polyp images for which a polygonal binary mask and a bounding box are provided. On the other hand, CVC-VideoClinicDB [21,25] provides an elliptical approximation for over 30,000 frames. Nevertheless, these datasets lack clinical metadata, such as the polyp size or histological diagnosis and only provide the Paris classification [26,27] in the best of the cases. Just recently, HyperKvasir [20] has been released. It includes labelled data for supervised training, but also provides unlabelled data. Regarding polyps, besides the images and binary masks of the Kvasir-SEG dataset, it also includes 1028 images and 73 videos labelled with the “polyp” class and 99,417 unlabelled images. All these datasets include white light (WL) images, but not NBI images.
For purposes of polyp classification, only one publicly available dataset is available [28]. This dataset includes 76 colonoscopy videos, using both WL and NBI imaging, of 15 serrated adenomas, 21 hyperplastic lesions and 40 adenomas.
The objective of this paper is to present the PICCOLO dataset with its associated clinical metadata and compare the performance results of different deep learning models trained with it and other publicly available datasets, as well as analyse the influence of the polyp morphology in the results. This paper is organized as follows: Section 2 details the acquisition and annotation protocols to obtain the PICCOLO dataset, as well as the public datasets and networks used in this study. In Section 3, we present and discuss the results of the experiments. Lastly, conclusions of this work are included in Section 4.

2. Materials and Methods

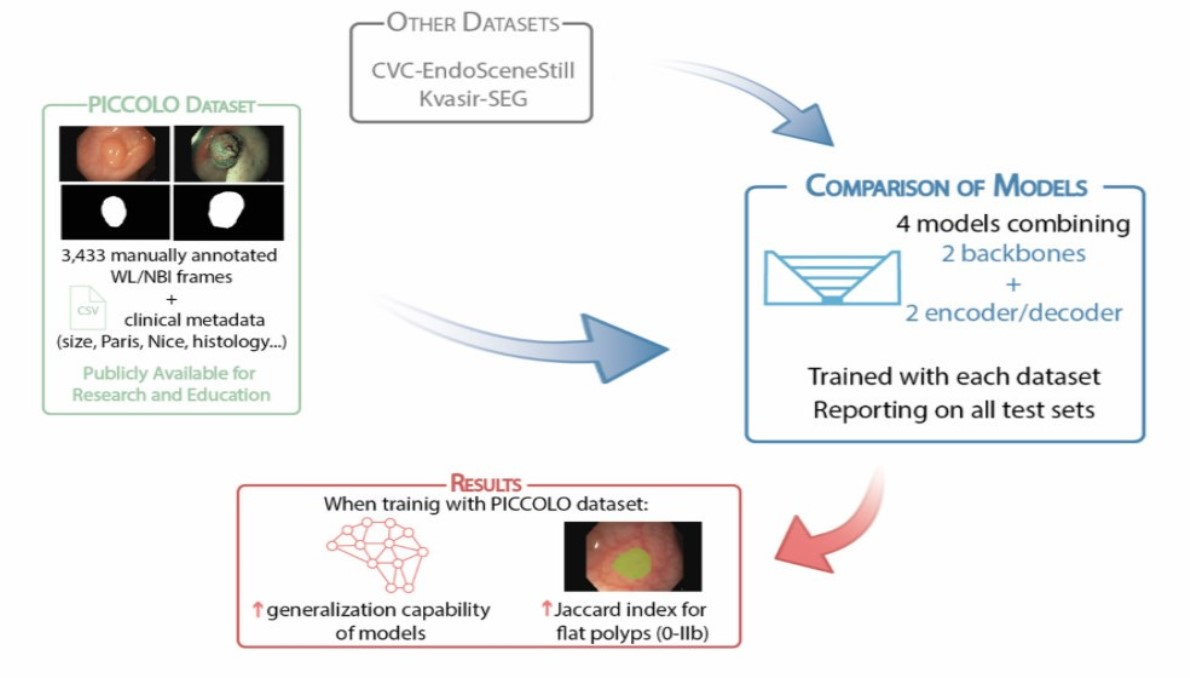
2.1. PICCOLO Dataset

The PICCOLO dataset contains several annotated frames from colonoscopy videos together with clinical metadata. In this dataset, both WL and NBI imaging technologies are included. The following subsections describe the acquisition and annotation protocols to generate the dataset.

2.1.1. Acquisition Protocol

An acquisition protocol was followed to obtain relevant information at Hospital Universitario Basurto (Bilbao, Spain):
  • Patients included in the colon cancer screening and surveillance program were informed about the study and asked for permission to collect images/videos obtained during routine colonoscopy with the associated information via informed consent and patient information sheet. If the patient gave permission, the rest of the protocol was followed.
  • If a suspicious lesion was found during the procedure, it was resected using the most appropriate method and sent to the Department of Pathological Anatomy for diagnosis.
  • Images/videos with the associated clinical information were anonymized.
  • Videos were analysed and edited/processed by the gastroenterologists who performed the colonoscopy. The video of the full procedure was divided into fragments, indicating if the tissue was healthy or pathological and the region on the colon where it was found. Further details on the annotation process are given in the following subsection.
  • The gastroenterologist completed part of the associated metadata:
    • Number of polyps of interest found during the procedure;
    • Current polyp ID;
    • Polyp size, in millimetres;
    • Paris classification [26,27];
    • NICE classification [29];
    • Preliminary diagnosis.
  • The pathologist completed part of the associated metadata:
    • Final diagnosis;
    • Histological stratification.
  • Clinical metadata were exported into a csv file.
The protocol and all experiments comply with current Spanish and European Union legal regulations. The Basque Biobank was the source of samples and data. Each patient signed a specific document that was approved by the Ethics Committee of the Basque Country (CEIm-E) with identification code: PI+CES-BIOEF 2017-03.

2.1.2. Annotation Protocol

In order to obtain the annotated dataset, a systematic procedure was established (Figure 1):
  • Video clips were processed to extract the individual frames. Uninformative frames were discarded from this process and they includeD (Figure S1):
    • Frames outside the patient;
    • Blurry frames;
    • Frames with high presence of bubbles;
    • Frames with high presence of stool;
    • Transition frames between WL and NBI.
  • All frames were analysed and categorized into showing a polyp or not, as well as identifying the type of light source (WL or NBI).
  • One out of 25 polyp frames (i.e., one frame per second) was selected to be manually annotated.
  • A researcher prepared three equally distributed sets of images to be processed using GTCreator [21]. Each set was manually annotated by one independent expert gastroenterologist with more than 15,000–25,000 (Á.J.C.; F.P.) and 500 (B.G.) colonoscopies. Furthermore, a void mask was also generated to indicate the valid endoscopic area of the image.
  • Segmented frames were collected and revised by a researcher to check completeness of the dataset prior to its use.
  • Manually segmented masks were automatically corrected with the void mask to adjust segmentations to the endoscopic image area.

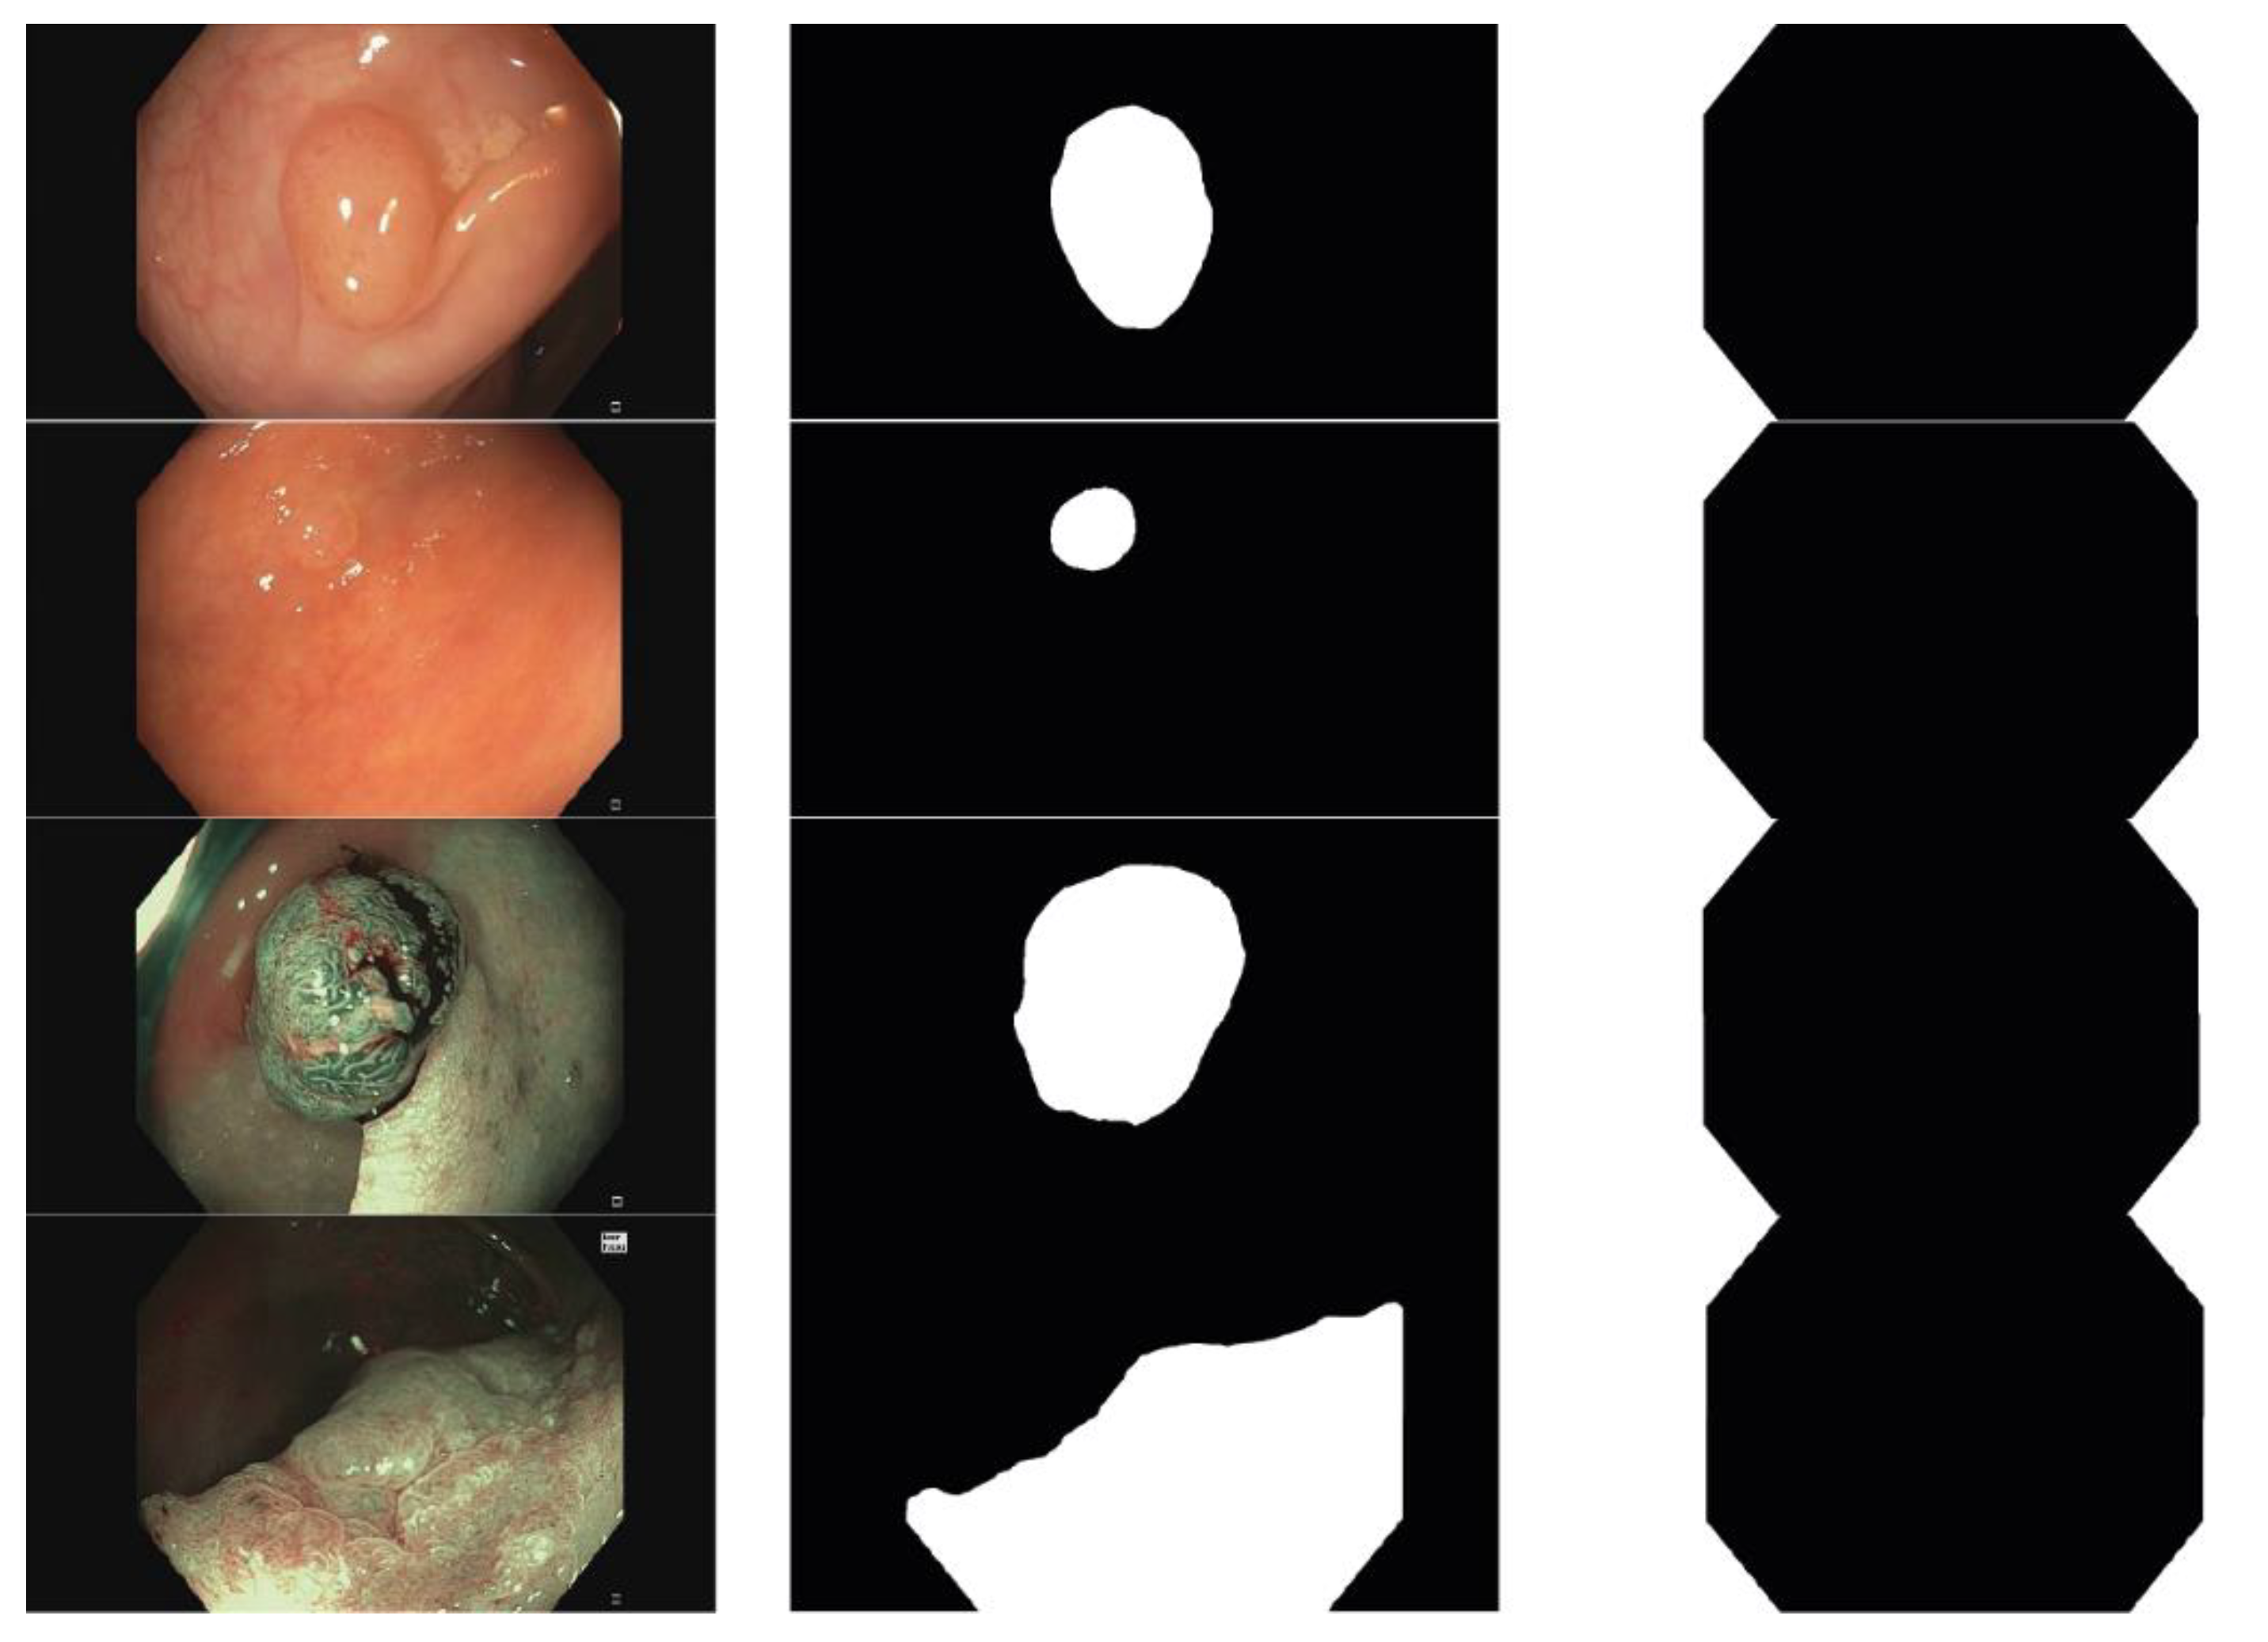
2.1.3. PICCOLO Dataset Details

Lesions were recorded between October 2017 and December 2019 at Hospital Universitario Basurto (Bilbao, Spain) using Olympus endoscopes (CF-H190L and-CF-HQ190L). Videos were recorded with an AVerMedia video capture and a hard drive storage. In all, the PICCOLO dataset included 76 lesions from 40 patients. In total, 62 out of these 76 lesions included white light (WL) and narrow band imaging (NBI) frames, while the remaining 14 lesions are recorded only using WL. Original videos were of length equal to 70.05 ± 59.28 s (range: 6–345 s), which corresponds to 1965.49 ± 1677.57 frames per clip (range: 187–10,364 frames). In all, more than 145,000 frames were revised. Out of the 80,847 frames showing a polyp, 3433 frames were selected for manual segmentation: 2131 WL images and 1302 NBI images (Table 1).
Image resolution are either 854 × 480 or 1920 × 1080, depending on the video they are acquired from. For each frame, three images are provided (Figure 2):
-
Frame itself: png files showing the WL or NBI image.
-
Mask: Binary mask indicating the area corresponding to the lesion.
-
Void: Binary mask indicating the black area of the image.
In the binary masks, pixels labelled with 1 correspond to the class (lesion or void area), and 0 otherwise (Figure 2).
Acquired images have been assigned to the train, validation or test set. In order to assure patient independence between sets, lesions originated from the same video are assigned to the same set. In all, there are 2203 (64.17%), 897 (26.13%) and 333 (9.70%) images in the train, validation and test set, respectively. Their clinical information is provided in Table 2. Furthermore, Table S1 in Supplementary Material provides all clinical information and assigned set for each of the 76 lesions.
The PICCOLO dataset is publicly available at the website of the Basque Biobank (https://www.biobancovasco.org/en/Sample-and-data-catalog/Databases/PD178-PICCOLO-EN.html), although a dedicated form to request downloading must be completed (the use of the dataset is restricted to research and educational purposes and use for commercial purposes is forbidden without prior written permission).

2.2. Public Datasets

In order to establish the utility of our dataset and range the learning capabilities of models trained over the present dataset, the other two publicly available datasets have been used in this work:
  • CVC-EndoSceneStill [23]. It contains 912 WL images which are manually segmented. A distribution into training, validation and test sets is provided by the owners. Each set contains 547, 183 and 182 images, respectively. This dataset is available at http://www.cvc.uab.es/CVC-Colon/index.php/databases/cvc-endoscenestill/.
  • Kvasir-SEG [24]. It contains 1000 WL images which are manually segmented. Distribution into training, validation and test sets has been randomly done, so each set includes 600, 200 and 200 images, respectively. This dataset is available at https://datasets.simula.no/kvasir-seg/.
These datasets do not provide clinical information of the images they include. In both cases, for each image, a binary mask indicating the polyp area is provided. While CVC-EndoSceneStill also provides void area binary masks, Kvasir-SEG does not. The polyp binary mask is used at training and testing, but the void binary mask is used to report metrics with respect to the valid endoscopic image, so void binary masks have been manually created for the images included in the test set of Kvasir-SEG.

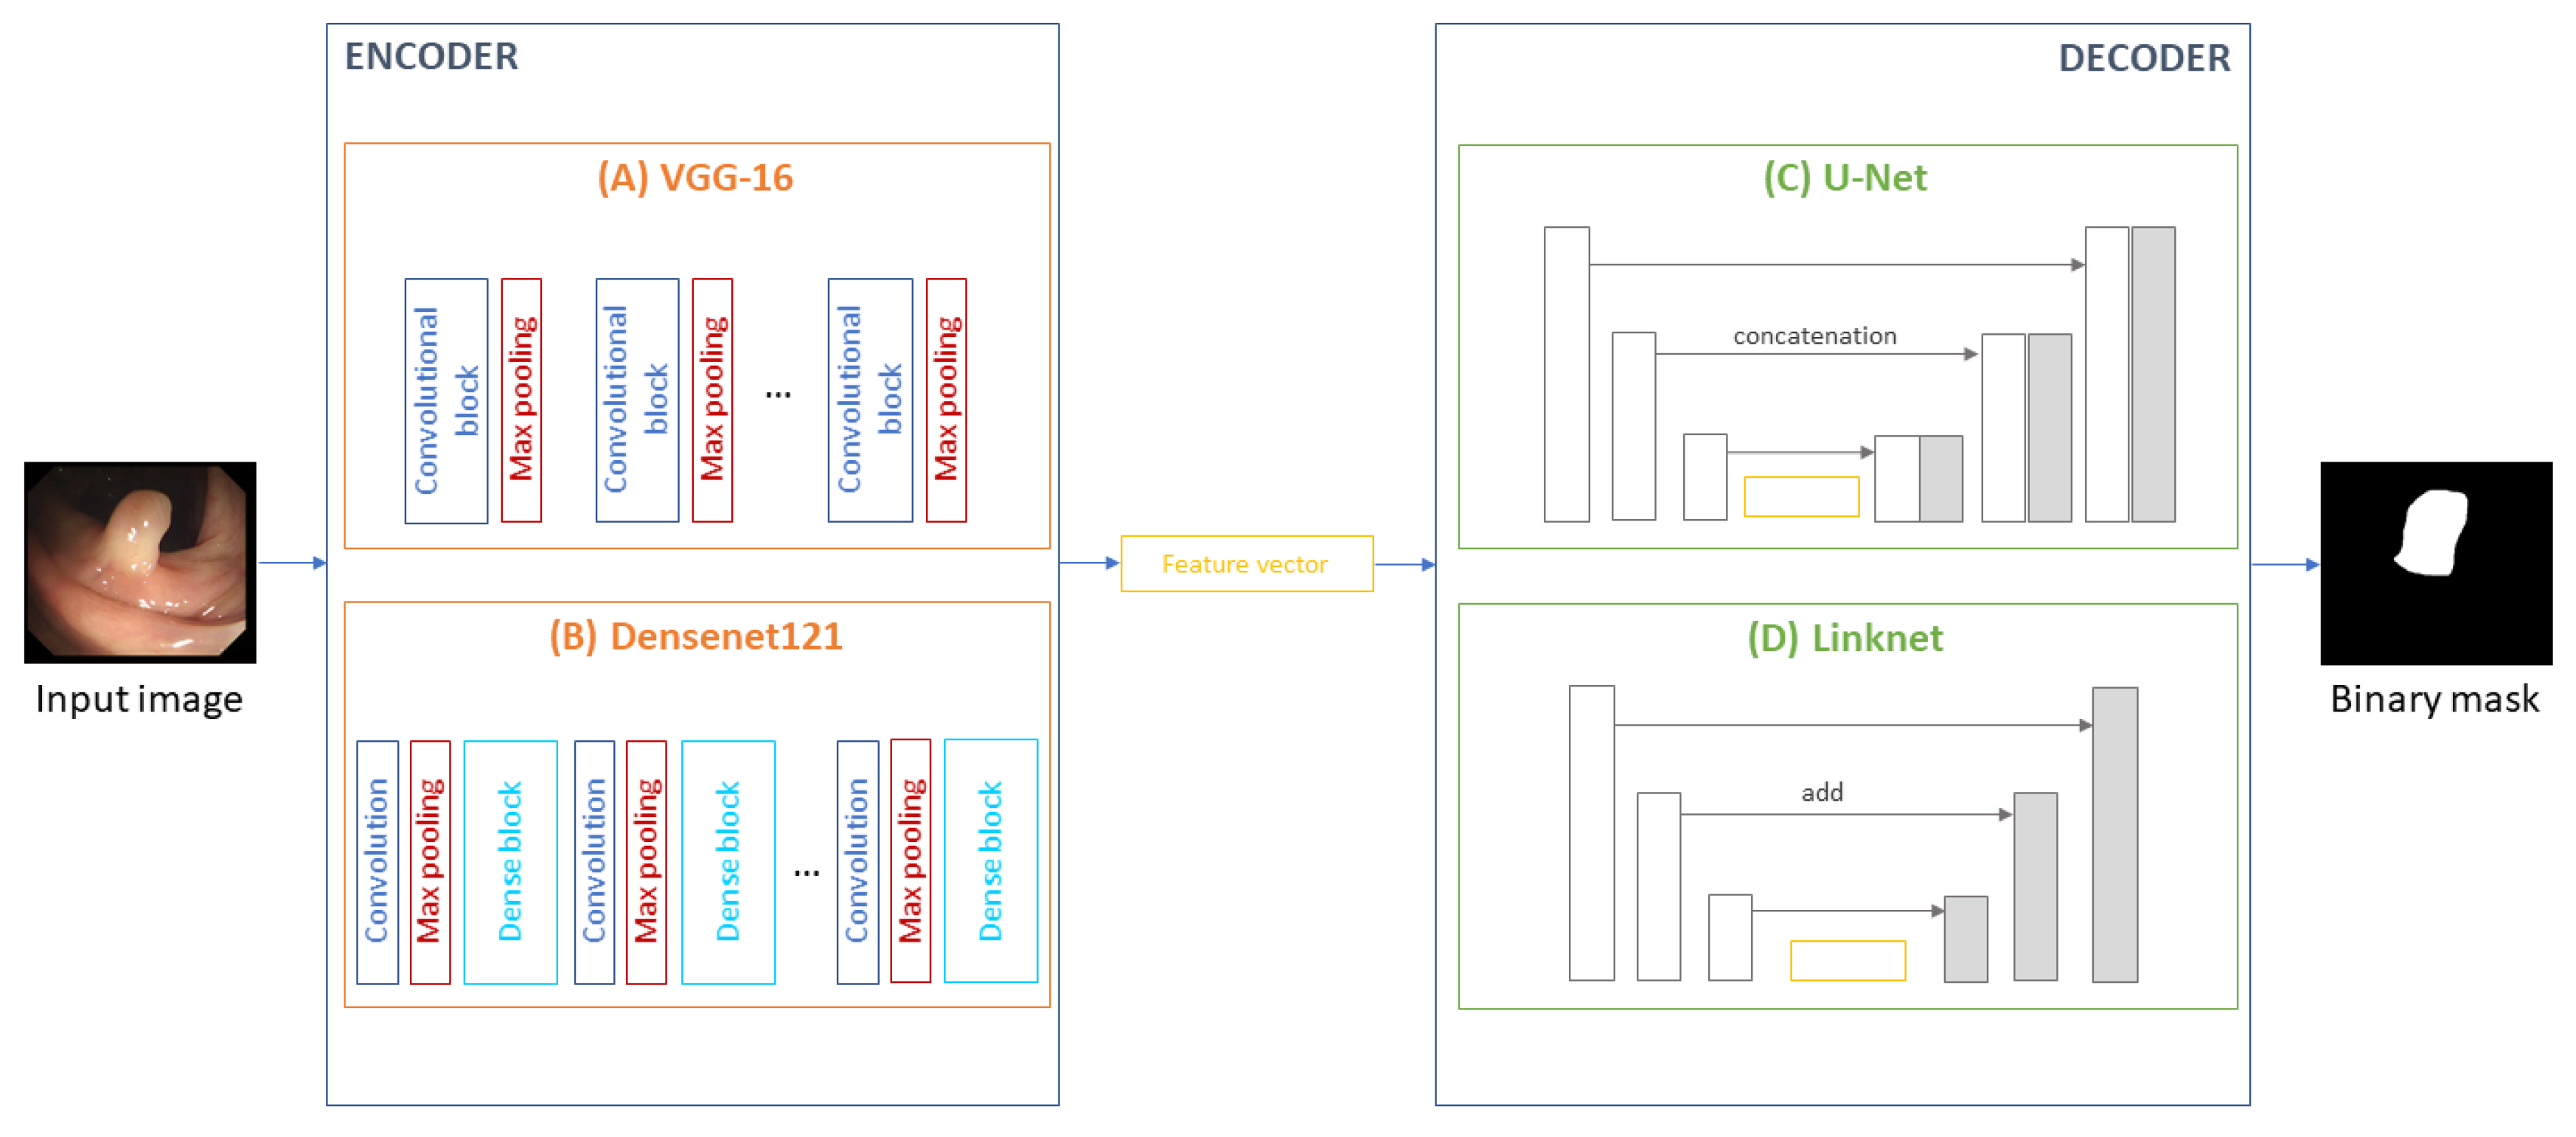
2.3. Architectures and Training Process

In this study, we consider four models (Figure 3) which are obtained by combining a backbone (VGG-16 [30] or Densenet121 [31]) and a encoder–decoder architecture (U-Net [32] or LinkNet [33]), replicating the architectures and training parameters defined by Sánchez-Peralta et al. [34]. For implementation, segmentations models [35], Keras [36] and Tensorflow [37] have been used. Each model has been independently trained with the train and validation sets of each of the three datasets.

2.4. Reporting

In order to properly compare results, they are always reported over the test set of each dataset, thus over 182, 200 and 333 images for CVC-EndoSceneStill, Kvasir-SEG and PICCOLO, respectively. Furthermore, results are also reported over the whole test images (i.e., 715 images).
In order to characterize the images in each dataset, the following objective measures are calculated on each of the test sets:
  • Percentage of the image that corresponds to void area;
  • Percentage relative to the valid area that is polyp;
  • Mean value of the brightness channel in HSV [38], in the range [0, 1];
  • Histogram flatness measure [39], in the range [0, 1];
  • Histogram spread [39], in the range [0, 1].
For each test image, seven metrics are calculated: accuracy, precision, recall, specificity, F2-score, Jaccard index and Dice index, all of them based on the elements of the confusion matrix [34]. Only the valid area of the image (indicated in the void binary mask) is considered.

3. Results and Discussion

3.1. Characterization of the Datasets

Table 3 shows the objective measures to characterize the datasets. Largest polyps are found in PICCOLO, but also with greater variability of sizes. Brightest and highest contrast images can be found in Kvasir-SEG, while CVC-EndoSceneStill and PICCOLO show similar appearance in these aspects.
It is also important to remark that the PICCOLO dataset includes WL and NBI images, which results in lower values in the brightness channel at the same time that the contrast is increased (higher values for the histogram flatness measure and lower values for histogram spread).

3.2. Comparison of Models Performance

Results of the Jaccard index for the different experiments are shown in Table 4. Tables with all metrics are provided in the Supplementary Material (Tables S2–S5). When reporting over the test set in CVC-EndoSceneStill, the best results are distributed between models trained with that same dataset and models trained with Kvasir-SEG. On the other hand, results in Kvasir-SEG and PICCOLO test sets are, in all cases but one, obtained when models are trained with the same dataset. Lastly, if all test sets are gathered and analysed together as whole, the best performance is obtained with models trained using the PICCOLO dataset. Models trained with Kvasir-SEG show better performance than those trained with CVC-EndoSceneStill. Therefore, it can be observed that the PICCOLO dataset allows for training more generalized models, that perform more uniformly along all datasets, rather than obtaining the best results for its own test set.
If comparison is done over the different test sets, the lowest results are obtained in the PICCOLO dataset, which might be because it contains a wider range of different polyps which makes it more difficult to learn with any of the used datasets. This result might be due to the presence of bias within each dataset, which would lead to the recommendation of multi-centre or cross-dataset evaluation for DL methods in order to properly understand the performance of such models in a real-world settings [40].
Similar to the results found in previous works [34], it can be concluded that in general terms, Densenet121 works better than VGG-16 as backbone and the LinkNet encoder–decoder architecture obtains better results than U-Net.
Sets independence is assured in our dataset, as all lesions obtained from the same patient are assigned to the same dataset. This is also considered when determining train, validation and test sets in CVC-EndoSceneStill [23]. On the other hand, Kvasir-SEG does not indicate the origin of each image nor provide a predefined division into sets, it is not possible to determine if the random allocation of images might have violated this independency. Should this happen, then the higher values for models trained and reported on Kvasir-SEG might be explained.
Regarding the clinical characteristics of the lesions in the test sets, it is not possible to establish a comparison as CVC-EndoSceneStill and Kvasir-SEG datasets do not provide clinical information.
Lastly, the inclusion of WL together with NBI images in the PICCOLO dataset might increase independence against changes in colour when training the models, showing better generalization when results are reported over the test sets of the other two datasets. In this regard, metrics have been calculated considering only the WL frames of the test set in the PICCOLO dataset for a fairer comparison for the other datasets. Results in the PICCOLO test sets remains similar regardless of the type of images considered (Table S4). When the three datasets are analysed together, including only the WL frames from PICCOLO (Table S5), the performances of Kvasir-SEG and PICCOLO are more similar.

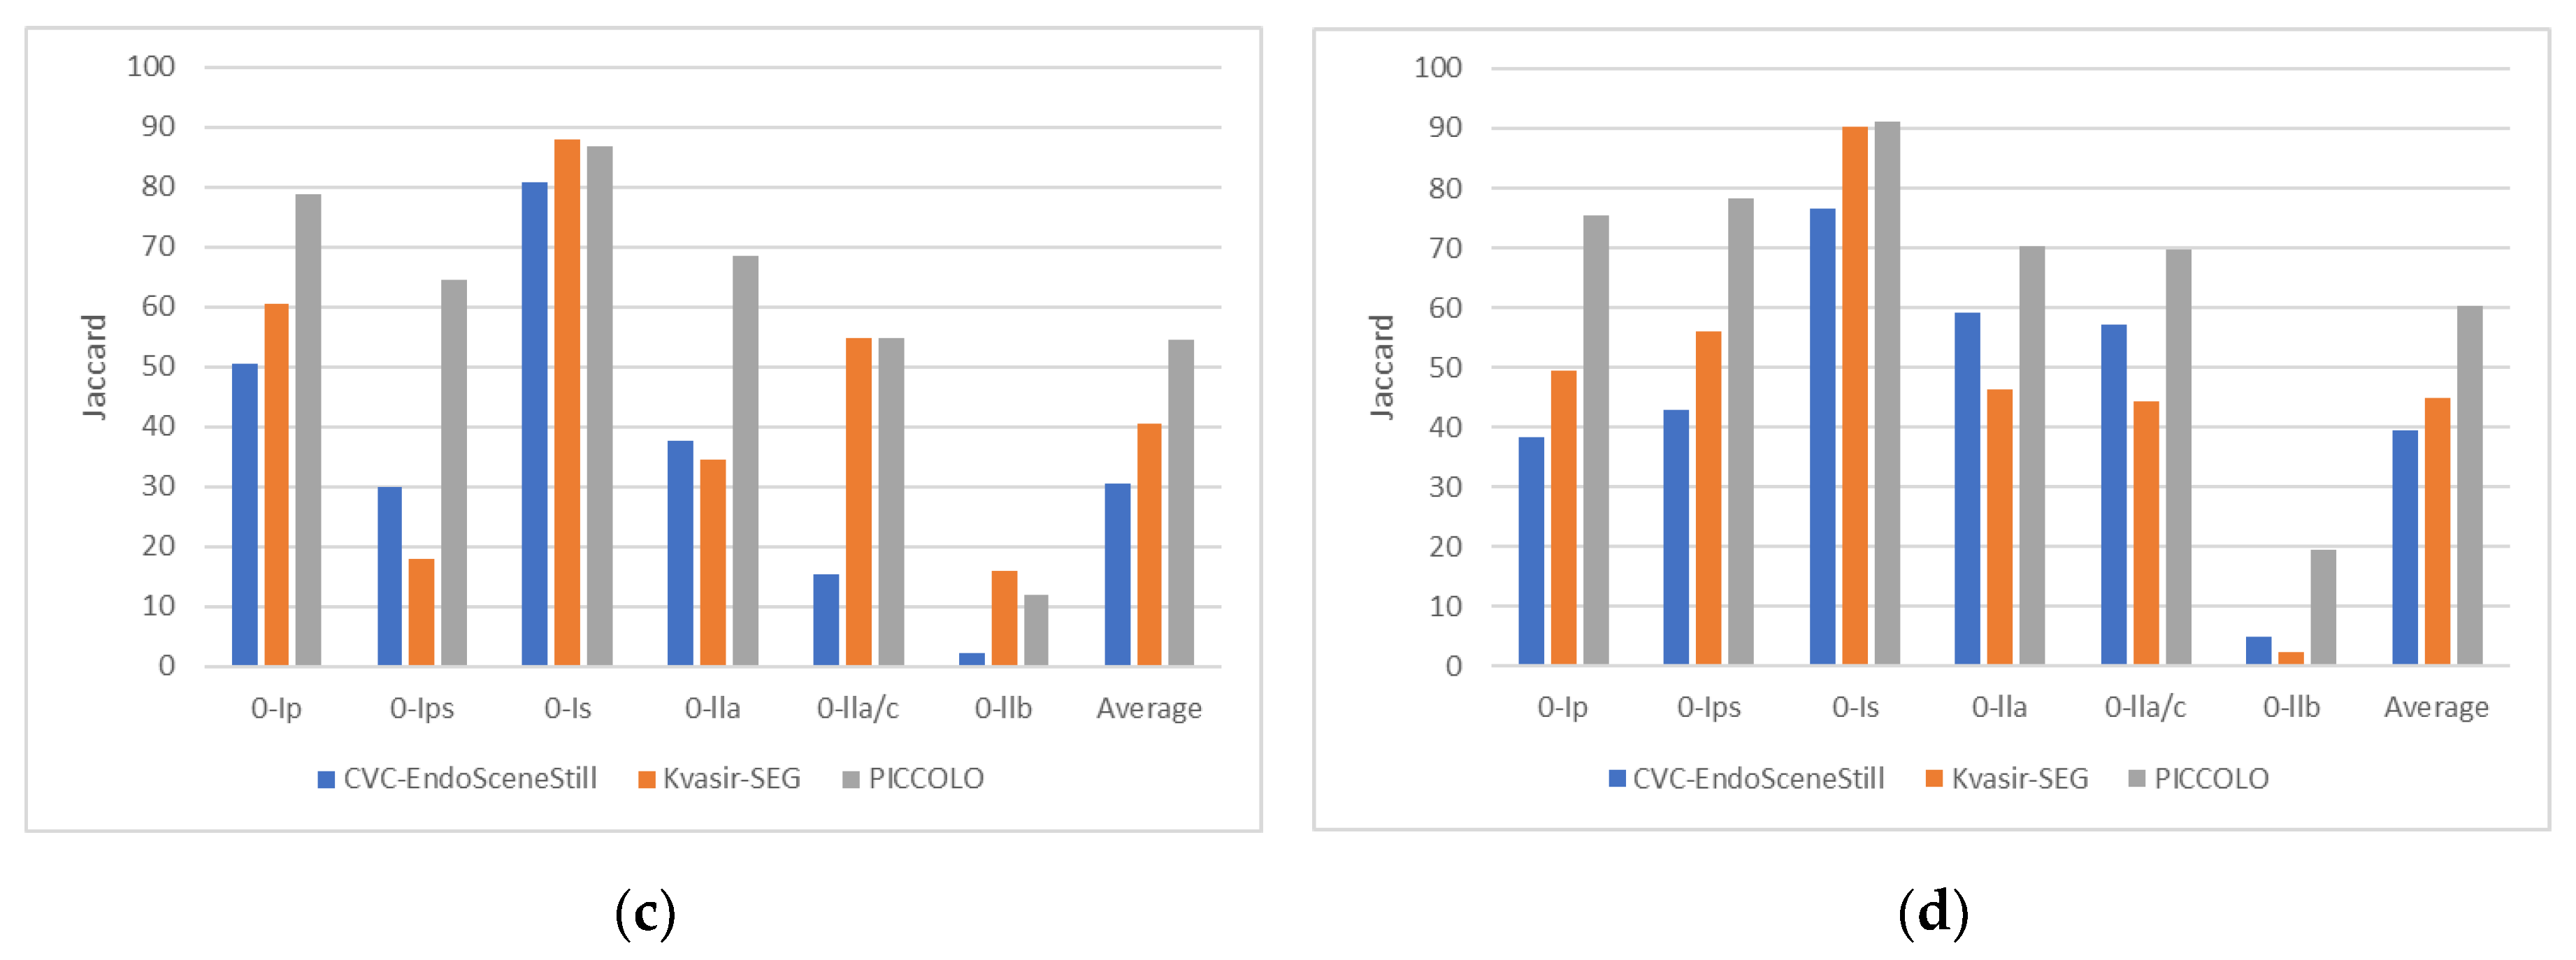
3.3. Influence of the Polyp Morphology in the Results

Figure 4 shows the Jaccard index for the four analysed models, when polyps in the test set of the PICCOLO dataset are classified based on their morphology accordingly to the Paris classification. It can be clearly seen that flat polyps (0-IIb) obtain the lowest results in all models, and that pedunculated and sessile polyps (0-Ip, 0-Ips and 0-Is) outperform the flat ones (0-IIa, 0-IIa/c and 0-IIb). This result is well aligned with the clinical findings shown by clinical works [8,9]. Furthermore, it is important to remark that the best results for flat polyps are obtained with models trained with PICCOLO dataset in three out of the four considered models. Regretfully, this analysis cannot be done with models trained using CVC-EndoSceneStill and Kvasir-SEG, as polyp morphology is not available for those datasets. Similarly, Lee et al. [41] employed a proprietary dataset to train the polyp detection method based on YOLOv2, and they also found that DL methods show lower sensitivity for flat polyps.

3.4. Current Limitations and Future Work

This work has also some limitations that should be acknowledged. In the first place, flat polyps, specially 0-IIb, according to the Paris classification, are still underrepresented in the dataset, in common with other datasets. This type is less frequently identified, therefore a longer, multicentre acquisition campaign would be necessary to increase their presence in the public datasets. Furthermore, these polyps are also the most difficult to be detected due to their subtle appearance, thus the Computer Assisted Diagnosis (CAD) systems would be more helpful to assist their detection [42]. We consider that increasing the number of images showing these challenging polyps would increase the clinical utility of the CAD systems, although assistance for the rest of types would also remain useful for novice endoscopists with lower Adenoma Detection Rate (ADR). Secondly, images in the dataset are mainly “polyp centred”. This means that the polyp is clearly visible in the image. This type of image is highly convenient for polyp segmentation as well as classification. Nevertheless, we consider that the inclusion of images where the lumen at or near the screen centre, leaving the polyps peripheral, a typical setup during the clinical exploration, would be of help for detection systems. Besides, the availability of long video sequences, even if not all frames are manually segmented, would also benefit the development of such systems. Lastly, manual segmentation is prone to inter-observer variability in medical images [43,44], therefore uncertainty should be considered and analysed, both at the dataset creation stage, but it would also be interesting to take it into account the analysis of segmentation results [45].
As future work, we consider the expansion of the current dataset to include some of the previously mentioned images and sequences. A joint global initiative to gather all efforts would result in a larger and more diverse dataset of polyps, increasing the possibilities of the research community.
Lastly, it is worth mentioning that, after developing any deep learning method, it is essential to carry out prospective studies and randomized trials to compare their performance with experts clinicians, which is so far not well proven [46], with the final aim of increasing the adenoma detection rate, as indicator of CRC detection. In this regard, a survey is currently undergoing to compare the identification of polyps done by expert gastroenterologists and residents with a deep learning model trained with the PICCOLO dataset.

4. Conclusions

This work presents a new dataset for polyp detection, localisation and segmentation. It provides 3433 polyp images together with a manually annotated binary mask of the polyp area. It also provides a set of clinical metadata for each of the lesions included. Besides, we have compared four different models trained with our PICCOLO dataset and two other publicly available datasets (CVC-EndoSceneStill and Kvasir-SEG). Our results show that the PICCOLO dataset is suitable for training deep learning models for polyp segmentation, which results in better generalization capabilities as well as better results for flat polyps. We also provide clinical metadata which, as far as the authors know, are not available in other publicly available datasets, and which might eventually increase the potential use of this dataset for polyp classification purposes.

Supplementary Materials

The following are available online at https://www.mdpi.com/2076-3417/10/23/8501/s1, Table S1: Clinical metadata and distribution of lesions into training, validation and test sets. Table S2: Metrics obtained in the CVC-EndoSceneStill test set for the different models and datasets used during training. Table S3: Metrics obtained in the Kvasir-SEG test set for the different models and datasets used during training. Table S4: Metrics obtained in the PICCOLO test set for the different models and datasets used during training. Table S5: Metrics obtained for all test sets as a whole for the different models and datasets used during training. Figure S1: Uninformative frames.

Author Contributions

Conceptualization, L.F.S.-P., J.B.P. and A.P.; methodology, L.F.S.-P., J.B.P., A.P., N.A., R.B. and C.L.S.; software, L.F.S.-P., and A.P.; validation, L.F.S.-P., J.B.P. and A.P.; formal analysis, L.F.S.-P.; investigation, L.F.S.-P., Á.J.C., F.P., N.A., R.B. and B.G.; resources, J.B.P., A.P., R.B., C.L.S., and F.M.S.-M.; data curation, L.F.S.-P., Á.J.C., F.P., N.A. and B.G.; writing—original draft preparation, L.F.S.-P. and J.B.P.; writing—review and editing, L.F.S.-P., J.B.P., A.P., Á.J.C., F.P., N.A., R.B., B.G., C.L.S., and F.M.S.-M.; visualization, L.F.S.-P.; supervision, J.B.P., A.P. and F.M.S.-M.; project administration, J.B.P., A.P. and C.L.S.; funding acquisition, J.B.P., A.P., R.B., C.L.S. and F.M.S.-M. All authors have read and agreed to the published version of the manuscript.

Funding

This work was partially supported by PICCOLO project. This project has received funding from the European Union’s Horizon2020 research and innovation programme under grant agreement No 732111. The sole responsibility of this publication lies with the author. The European Union is not responsible for any use that may be made of the information contained therein. Furthermore, this publication has also been partially supported by GR18199 from Consejería de Economía, Ciencia y Agenda Digital of Junta de Extremadura (co-funded by European Regional Development Fund–ERDF. “A way to make Europe”/ “Investing in your future”. This work has been performed by the ICTS “NANBIOSIS” at the Jesús Usón Minimally Invasive Surgery Centre.

Acknowledgments

Authors want to thank for their invaluable contribution to the data acquisition process to the pathologists from Hospital Universitario Basurto: Nagore Arbide, Jaques Velasco and Maria Carmen Etxezárraga; Ainara Egia and technical staff from Basque Biobank, Basque Foundation for Health Innovation and Research-BIOEF; as well as Virginia Cabezón and Agueda Azpeitia.

Conflicts of Interest

The authors declare no conflict of interest.

References

  1. International Agency for Research on Cancer. Colorectal Cancer Factsheet; International Agency for Research on Cancer: Lyon, France, 2018. [Google Scholar]
  2. World Health Organization. World Cancer Report 2014; Stewart, B.W., Wild, C.P., Eds.; International Agency for Research on Cancer: Lyon, France, 2014; ISBN 978-92-832-0429-9. [Google Scholar]
  3. Siegel, R.L.; Miller, K.D.; Jemal, A. Cancer statistics, 2015. CA Cancer J. Clin. 2015, 65, 29. [Google Scholar] [CrossRef] [PubMed]
  4. Siegel, R.L.; Miller, K.D.; Jemal, A. Cancer statistics, 2020. CA Cancer J. Clin. 2020, 70, 7–30. [Google Scholar] [CrossRef] [PubMed]
  5. Wiegering, A.; Ackermann, S.; Riegel, J.; Dietz, U.A.; Götze, O.; Germer, C.T.; Klein, I. Improved survival of patients with colon cancer detected by screening colonoscopy. Int. J. Colorectal Dis. 2016, 31, 1039–1045. [Google Scholar] [CrossRef] [PubMed]
  6. Kaminski, M.F.; Thomas-Gibson, S.; Bugajski, M.; Bretthauer, M.; Rees, C.J.; Dekker, E.; Hoff, G.; Jover, R.; Suchanek, S.; Ferlitsch, M.; et al. Performance measures for lower gastrointestinal endoscopy: A European Society of Gastrointestinal Endoscopy (ESGE) quality improvement initiative. United Eur. Gastroenterol. J. 2017, 5, 309–334. [Google Scholar] [CrossRef]
  7. Lund, M.; Trads, M.; Njor, S.H.; Erichsen, R.; Andersen, B. Quality indicators for screening colonoscopy and colonoscopist performance and the subsequent risk of interval colorectal cancer: A systematic review. JBI Database Syst. Rev. Implement. Reports 2019. [Google Scholar] [CrossRef]
  8. Kim, N.H.; Jung, Y.S.; Jeong, W.S.; Yang, H.-J.; Park, S.-K.; Choi, K.; Park, D. Il Miss rate of colorectal neoplastic polyps and risk factors for missed polyps in consecutive colonoscopies. Intest. Res. 2017, 15, 411. [Google Scholar] [CrossRef] [Green Version]
  9. Klare, P.; Sander, C.; Prinzen, M.; Haller, B.; Nowack, S.; Abdelhafez, M.; Poszler, A.; Brown, H.; Wilhelm, D.; Schmid, R.M.; et al. Automated polyp detection in the colorectum: A prospective study (with videos). Gastrointest. Endosc. 2019, 89, 576–582. [Google Scholar] [CrossRef]
  10. Ishaq, S.; Siau, K.; Harrison, E.; Tontini, G.E.; Hoffman, A.; Gross, S.; Kiesslich, R.; Neumann, H. Technological advances for improving adenoma detection rates: The changing face of colonoscopy. Dig. Liver Dis. 2017, 49, 721–727. [Google Scholar] [CrossRef]
  11. Byrne, M.F.; Shahidi, N.; Rex, D.K. Will Computer-Aided Detection and Diagnosis Revolutionize Colonoscopy? Gastroenterology 2017, 153, 1460–1464. [Google Scholar] [CrossRef] [Green Version]
  12. LeCun, Y.; Bengio, Y.; Hinton, G. Deep learning. Nature 2015, 521, 436–444. [Google Scholar] [CrossRef]
  13. Kim, J.; Hong, J.; Park, H. Prospects of deep learning for medical imaging. Precis. Futur. Med. 2018, 2, 37–52. [Google Scholar] [CrossRef]
  14. Shen, D.; Wu, G.; Suk, H.-I. Deep Learning in Medical Image Analysis. Annu. Rev. Biomed. Eng. 2017, 19, 221–248. [Google Scholar] [CrossRef] [PubMed] [Green Version]
  15. Chan, H.-P.; Samala, R.K.; Hadjiiski, L.M.; Zhou, C. Deep Learning in Medical Image Analysis. In Deep Learning in Medical Image Analysis; Lee, G., Fujita, H., Eds.; Springer: Berlin/Heidelberg, Germany, 2020. [Google Scholar]
  16. Aziz, M.; Fatima, R.; Dong, C.; Lee-Smith, W.; Nawras, A. The impact of deep convolutional neural network-based artificial intelligence on colonoscopy outcomes: A systematic review with meta-analysis. J. Gastroenterol. Hepatol. 2020, 1–8. [Google Scholar] [CrossRef]
  17. Sánchez-Peralta, L.F.; Bote-Curiel, L.; Picón, A.; Sánchez-Margallo, F.M.; Pagador, J.B. Deep learning to find colorectal polyps in colonoscopy: A systematic literature review. Artif. Intell. Med. 2020, 108. [Google Scholar] [CrossRef] [PubMed]
  18. Nogueira-Rodríguez, A.; Domínguez-Carbajales, R.; López-Fernández, H.; Iglesias, Á.; Cubiella, J.; Fdez-Riverola, F.; Reboiro-Jato, M.; Glez-Peña, D. Deep Neural Networks approaches for detecting and classifying colorectal polyps. Neurocomputing 2020. [Google Scholar] [CrossRef]
  19. Min, J.K.; Kwak, M.S.; Cha, J.M. Overview of deep learning in gastrointestinal endoscopy. Gut Liver 2019, 13, 388–393. [Google Scholar] [CrossRef] [Green Version]
  20. Borgli, H.; Thambawita, V.; Smedsrud, P.; Hicks, S.; Jha, D.; Eskeland, S.; Randel, K.R.; Pogorelov, K.; Lux, M.; Dang-Nguyen, D.-T.; et al. HyperKvasir: A Comprehensive Multi-Class Image and Video Dataset for Gastrointestinal Endoscopy. Sci. Data 2020, 7. [Google Scholar] [CrossRef]
  21. Bernal, J.; Histace, A.; Masana, M.; Angermann, Q.; Sánchez-Montes, C.; de Miguel, C.R.; Hammami, M.; García-Rodríguez, A.; Córdova, H.; Romain, O. GTCreator: A flexible annotation tool for image-based datasets. Int. J. Comput. Assist. Radiol. Surg. 2019, 14, 191–201. [Google Scholar] [CrossRef]
  22. Tajbakhsh, N.; Jeyaseelan, L.; Li, Q.; Chiang, J.N.; Wu, Z.; Ding, X. Embracing Imperfect Datasets: A Review of Deep Learning Solutions for Medical Image Segmentation. Med. Image Anal. 2020, 63, 101693. [Google Scholar] [CrossRef] [Green Version]
  23. Vázquez, D.; Bernal, J.; Sánchez, F.J.; Fernández-Esparrach, G.; López, A.M.; Romero, A.; Drozdzal, M.; Courville, A. A Benchmark for Endoluminal Scene Segmentation of Colonoscopy Images. J. Healthc. Eng. 2017. [Google Scholar] [CrossRef]
  24. Jha, D.; Smedsrud, P.H.; Riegler, M.A.; Halvorsen, P.; de Lange, T.; Johansen, D.; Johansen, H.D. Kvasir-SEG: A Segmented Polyp Dataset. In Proceedings of the International Conference on Multimedia Modeling (MMM); Springer: Cham, Switzerland, 2020. [Google Scholar]
  25. Angermann, Q.; Bernal, J.; Sánchez-Montes, C.; Hammami, M.; Fernández-Esparrach, G.; Dray, X.; Romain, O.; Sánchez, F.J.; Histace, A. Towards Real-Time Polyp Detection in Colonoscopy Videos: Adapting Still Frame-Based Methodologies for Video Sequences Analysis. In Computer Assisted and Robotic Endoscopy and Clinical Image-Based Procedures; Springer: Cham, Switzerland, 2017; pp. 29–41. ISBN 978-3-319-67542-8. [Google Scholar]
  26. Participants in the Paris Workshop The Paris endoscopic classification of superficial neoplastic lesions: Esophagus, stomach, and colon. Gastrointest. Endosc. 2003, 58, S3–S43. [CrossRef]
  27. Endoscopic Classification Review Group Update on the Paris Classification of Superficial Neoplastic Lesions in the Digestive Tract. Endoscopy 2005, 37, 570–578. [CrossRef] [PubMed]
  28. Mesejo, P.; Pizarro, D.; Abergel, A.; Rouquette, O.; Beorchia, S.; Poincloux, L.; Bartoli, A. Computer-Aided Classification of Gastrointestinal Lesions in Regular Colonoscopy. IEEE Trans. Med. Imaging 2016, 35, 2051–2063. [Google Scholar] [CrossRef] [PubMed]
  29. Hattori, S.; Iwatate, M.; Sano, W.; Hasuike, N.; Kosaka, H.; Ikumoto, T.; Kotaka, M.; Ichiyanagi, A.; Ebisutani, C.; Hisano, Y.; et al. Narrow-band imaging observation of colorectal lesions using NICE classification to avoid discarding significant lesions. World J. Gastrointest. Endosc. 2014, 6, 600. [Google Scholar] [CrossRef]
  30. Long, J.; Shelhamer, E.; Darrell, T. Fully convolutional networks for semantic segmentation. In Proceedings of the IEEE Computer Society Conference on Computer Vision and Pattern Recognition, Boston, MA, USA, 7–12 June 2015; pp. 3431–3440. [Google Scholar]
  31. Huang, G.; Liu, Z.; van der Maaten, L.; Weinberger, K.Q. Densely Connected Convolutional Networks. arXiv 2018. [Google Scholar] [CrossRef] [Green Version]
  32. Ronneberger, O.; Fischer, P.; Brox, T. U-Net: Convolutional Networks for Biomedical Image Segmentation. In Medical Image Computing and Computer-Assisted Intervention−MICCAI 2015. Lecture Notes in Computer Science; Navab, N., Hornegger, J., Wells, W.M., Frangi, A.F., Eds.; Springer: Berlin/Heidelberg, Germany, 2015; Volume 9351, pp. 234–241. ISBN 9783319245737. [Google Scholar]
  33. Chaurasia, A.; Culurciello, E. LinkNet: Exploiting encoder representations for efficient semantic segmentation. 2017 IEEE Vis. Commun. Image Process. VCIP 2018, 1–4. [Google Scholar] [CrossRef] [Green Version]
  34. Sánchez-Peralta, L.F.; Picón, A.; Antequera-Barroso, J.A.; Ortega-Morán, J.F.; Sánchez-Margallo, F.M.; Pagador, J.B. Eigenloss: Combined PCA-Based Loss Function for Polyp Segmentation. Mathematics 2020, 8, 1316. [Google Scholar] [CrossRef]
  35. Yakubovskiy, P. Segmentation Models. Available online: https://github.com/qubvel/segmentation_models (accessed on 24 November 2020).
  36. Chollet, F. Keras. Available online: https://github.com/keras-team/keras (accessed on 24 November 2020).
  37. Abadi, M.; Agarwal, A.; Barham, P.; Brevdo, E.; Chen, Z.; Citro, C.; Corrado, G.S.; Davis, A.; Dean, J.; Devin, M.; et al. TensorFlow: Large-Scale Machine Learning on Heterogeneous Distributed Systems. CoRR 2015. [Google Scholar] [CrossRef] [Green Version]
  38. Abaza, A.; Harrison, M.A.; Bourlai, T. Quality metrics for practical face recognition. In Proceedings of the Proceedings of the 21st International Conference on Pattern Recognition (ICPR2012), Tsukuba, Japan, 11–15 November 2012; pp. 3103–3107. [Google Scholar]
  39. Tripathi, A.K.; Mukhopadhyay, S.; Dhara, A.K. Performance metrics for image contrast. In Proceedings of the 2011 International Conference on Image Information Processing, Shimla, India, 3–5 November 2011; pp. 1–4. [Google Scholar]
  40. Thambawita, V.; Jha, D.; Hammer, H.L.; Johansen, H.D.; Johansen, D.; Halvorsen, P.; Riegler, M.A. An Extensive Study on Cross-Dataset Bias and Evaluation Metrics Interpretation for Machine Learning Applied to Gastrointestinal Tract Abnormality Classification. ACM Trans. Comput. Healthc. 2020, 1, 1–29. [Google Scholar] [CrossRef]
  41. Lee, J.Y.; Jeong, J.; Song, E.M.; Ha, C.; Lee, H.J.; Koo, J.E.; Yang, D.H.; Kim, N.; Byeon, J.S. Real-time detection of colon polyps during colonoscopy using deep learning: Systematic validation with four independent datasets. Sci. Rep. 2020, 10, 1–9. [Google Scholar] [CrossRef]
  42. Sánchez-Peralta, L.F.; Sánchez-Margallo, F.M.; Bote Chacón, J.; Soria Gálvez, F.; López-Saratxaga, C.; Picón Ruiz, A.; Pagador, J.B. Is it necessary to improve the colorectal polyps databases for detection CAD systems based on deep learning? Br. J. Surg. 2018, 105, 5–14. [Google Scholar]
  43. Joskowicz, L.; Cohen, D.; Caplan, N.; Sosna, J. Inter-observer variability of manual contour delineation of structures in CT. Eur. Radiol. 2019, 29, 1391–1399. [Google Scholar] [CrossRef] [PubMed]
  44. Chlebus, G.; Meine, H.; Thoduka, S.; Abolmaali, N.; Van Ginneken, B.; Hahn, H.K.; Schenk, A. Reducing inter-observer variability and interaction time of MR liver volumetry by combining automatic CNN-based liver segmentation and manual corrections. PLoS ONE 2019, 14, e0217228. [Google Scholar] [CrossRef] [PubMed]
  45. Wickstrøm, K.; Kampffmeyer, M.; Jenssen, R. Uncertainty and Interpretability in Convolutional Neural Networks for Semantic Segmentation of Colorectal Polyps. Med. Image Anal. 2020, 60. [Google Scholar] [CrossRef] [PubMed]
  46. Nagendran, M.; Chen, Y.; Lovejoy, C.A.; Gordon, A.C.; Komorowski, M.; Harvey, H.; Topol, E.J.; Ioannidis, J.P.A.; Collins, G.S.; Maruthappu, M. Artificial intelligence versus clinicians: Systematic review of design, reporting standards, and claims of deep learning studies in medical imaging. BMJ 2020, 368, 1–12. [Google Scholar] [CrossRef] [PubMed] [Green Version]
Figure 1. Annotation protocol for the PICCOLO dataset generation.
Applsci 10 08501 g001
Figure 2. Examples of images and masks from the PICCOLO dataset. First two rows correspond to white light images, while last two rows are NBI images. First column corresponds to the polyp frame, second column corresponds to the binary mask for the polyp area, and third column corresponds to the binary mask for the void area.
Applsci 10 08501 g002
Figure 3. Models considered in this work are obtained by combining one backbone for the encoder (A,B) with one encoder-decoder architecture (C,D). Image reproduced from [34].
Applsci 10 08501 g003
Figure 4. Jaccard index reported on the test set of the PICCOLO dataset for the four models. Each series represents the model trained with the corresponding dataset (a) U-Net + VGG16; (b) U-Net + Densenet121; (c) LinkNet + VGG16; (d) LinkNet + Densenet121.
Applsci 10 08501 g004aApplsci 10 08501 g004b
Table 1. Lesions and frames in the PICCOLO dataset according to clinical metadata.
CategoryItems# Lesions# WL Frames# NBI Frames
Paris ClassificationProtruded lesions: 0-Ip10191193
Protruded lesions: 0-Ips7193107
Protruded lesions: 0-Is16387253
Flat elevated lesions: 0-IIa29928436
Flat elevated lesions:0-IIa/c48391
Flat lesions: 0-IIb28521
N/A8264201
NICE classificationType 117404284
Type 2501454782
Type 38264201
N/A1935
DiagnosisAdenocarcinoma8264201
Adenoma501454782
Hyperplasia17404284
N/A1935
Histological stratificationHigh grade dysplasia12409168
Hyperplasia13312225
Invasive adenocarcinoma8264201
Low grade dysplasia11316
No dysplasia411124657
N/A1935
Table 2. Frames in each of the sets according to clinical metadata.
CategoryItemsTrain SetValidation SetTest Set
Image typeWL1382558192
NBI821340141
Paris ClassificationProtruded lesions: 0-Ip2748129
Protruded lesions: 0-Ips2454114
Protruded lesions: 0-Is43317631
Flat elevated lesions: 0-IIa105226349
Flat elevated lesions:0-IIa/c2712225
Flat lesions: 0-IIb-4858
N/A172166127
NICE classificationType 1435139114
Type 2155259292
Type 3172166127
N/A44--
DiagnosisAdenocarcinoma172166127
Adenoma155259292
Hyperplasia435139114
N/A44--
Histological stratificationHigh grade dysplasia360217-
Hyperplasia34213956
Invasive adenocarcinoma172166127
Low grade dysplasia--29
No dysplasia1285375121
N/A44--
Table 3. Characterization of the datasets. Results are reported as mean ± standard deviation. Minimum and maximum values are indicated between brackets. The void area refers to the black area in the images (Figure 2), while the remaining area is considered as valid area.
CVC-EndoSceneStillKvasir-SEGPICCOLO
Void area (%)23.73 ± 5.57
(27.83 − 14.62)
15.23 ± 4.82
(28.44 − 6.16)
34.14 ± 0.33
(34.33 − 33.20)
Polyp area relative to the valid area (%)12.50 ± 11.49
(66.15 − 0.75)
17.36 ± 15.65
(83.66 − 0.61)
20.45 ± 20.68
(86.11 − 0.00)
Mean value of brightness channel in HSV0.560 ± 0.006
(1.000 − 0.000)
0.622 ± 0.003
(1.000 − 0.000)
0.532 ± 0.078
(1.000 − 0.000)
Histogram flatness measure0.858 ± 0.121
(0.959 − 0.000)
0.419 ± 0.443
(0.962 − 0.000)
0.855 ± 0.215
(0.970 − 0.000)
Histogram spread0.252 ± 0.088
(0.520 − 0.076)
0.218 ± 0.070
(0.432 − 0.075)
0.214 ± 0.086
(0.452 − 0.066)
Table 4. Jaccard index for each experiment. Best value per train/validation set and test set is indicated in bold.
Dataset for Training/Validation SetNetworkDataset for Test Set
CVC-EndoSceneStillKvasir-SEGPICCOLOAll
CVC-EndoSceneStillU-Net + VGG1656.80 ± 36.0946.29 ± 29.3632.82 ± 34.8142.69 ± 35.13
U-Net + Densenet12167.31 ± 34.4756.12 ± 34.2938.76 ± 39.0550.88 ± 38.51
LinkNet + VGG1662.77 ± 33.8151.13 ± 27.6730.55 ± 33.5744.51 ± 34.86
LinkNet + Densenet12172.16 ± 30.9356.69 ± 33.6839.52 ± 37.9052.63 ± 37.53
Kvasir-SEGU-Net + VGG1632.44 ± 38.7964.23 ± 29.7828.51 ± 35.1239.50 ± 37.98
U-Net + Densenet12171.82 ± 29.8774.13 ± 23.4044.78 ± 38.7359.87 ± 35.72
LinkNet + VGG1658.62 ± 36.1872.53 ± 23.9240.43 ± 36.4154.04 ± 35.99
LinkNet + Densenet12169.10 ± 32.5374.52 ± 22.8144.92 ± 37.3759.35 ± 35.33
PICCOLOU-Net + VGG1647.76 ± 36.4652.64 ± 30.4158.74 ± 36.0654.24 ± 34.93
U-Net + Densenet12162.41 ± 34.7865.33 ± 30.6664.01 ± 36.2363.97 ± 34.35
LinkNet + VGG1654.58 ± 35.6358.99 ± 30.4054.46 ± 38.8855.76 ± 35.87
LinkNet + Densenet12164.18 ± 33.0459.61 ± 33.8060.14 ± 38.3161.02 ± 35.79
Publisher’s Note: MDPI stays neutral with regard to jurisdictional claims in published maps and institutional affiliations.

