Experimental Study on the Flexural Behavior of over Reinforced Concrete Beams Bolted with Compression Steel Plate: Part I


1
Department of Civil Engineering, Faculty of Engineering, University of Malaya, Kuala Lumpur 50603, Malaysia
2
Department of Civil Engineering, Faculty of Engineering, Al-Mustansiriyah University, P.O. Box 46049 Baghdad, Iraq
3
Department of Building Surveying, Faculty of Built Environment, University of Malaya, Kuala Lumpur 50603, Malaysia
4
Center for Building, Construction & Tropical Architecture (BuCTA), Faculty of Built Environment, University of Malaya, Kuala Lumpur 50603, Malaysia
*
Authors to whom correspondence should be addressed.
Appl. Sci. 2020, 10(3), 822; https://doi.org/10.3390/app10030822
Submission received: 16 December 2019
/
Revised: 7 January 2020
/
Accepted: 15 January 2020
/
Published: 23 January 2020
(This article belongs to the Special Issue Homogenization Methods in Materials and Structures)
Abstract
:Featured Application
A bolt-compression steel plate (BCSP)-system is usually used for effective method to improve flexural behavior of over-reinforced concrete beams. Using steel plate in compression zone increase flexural capacity of RC beam. The BCSP beam can behave as ductile structural member.
Abstract
The purpose of this paper is to investigate the flexural behavior of over-reinforced concrete beam enhancement by bolted-compression steel plate (BCSP) with normal reinforced concrete beams under laboratory experimental condition. Three beams developed with steel plates were tested until they failed in compression compared with one beam without a steel plate. The thicknesses of the steel plates used were 6 mm, 10 mm, and 15 mm. The beams were simply supported and loaded monotonically with two-point loads. Load-deflection behaviors of the beams were observed, analyzed, and evaluated in terms of spall-off concrete loading, peak loading, displacement at mid-span, flexural stiffness (service and post-peak), and energy dissipation. The outcome of the experiment shows that the use of a steel plate can improve the failure modes of the beams and also increases the peak load and flexural stiffness. The steel development beams dissipated much higher energies with an increase in plate thicknesses than the conventional beam.
1. Introduction
In the development of civil engineering, the increase in critical sections is essential for the improvement and strengthening of the critical section. One of the most significant aspects is the over-reinforced section in the structure. However, due to various reasons, improvement is essential in over-reinforced members to prevent brittle failure and undue aging. With this improvement, the beams possess higher ductility and stiffness, including high energy absorption to carry extra loads [1,2].
Notably, the most conventional techniques for the design of flexural beam in the brittle failure of concrete are not permitted by several international codes of practice [3,4] due to the low ductility of the members. According to ACI 318–02 and AS3600 [3,4], the reinforcement ratio of the flexural reinforced concrete beams is classified into three categories, which may be balanced, under-reinforced, and over-reinforced. Therefore, the development of the over-RC beams can be obtained by replacing the steel bars in compression with quality materials, which exhibit better performance. The section of the replacement material will depend on the method of the section development. Moreover, several methods were used in the past with various degrees of success. The methods included helical reinforcement [5,6,7,8], short stirrups with/without steel fiber [9], hybrid system, hybrid reinforced concrete beams. These beams consisted of two or three layers of diverse concrete strength levels. This range of strength could be seen from the top section made of high strength concrete (HSC), with a bottom layer, which was made of normal strength concrete (NSC) [10], and an external bonding with a steel plate in the side of the RC beam [11,12]. The steel plate bonding in compression was the current method.
Overall, these methods were used to avoid brittle behavior and crushing failure. The use of helical reinforcements in the critical zone at the mid-span of the beam was one of the most important methods to develop the over-reinforced beam [13,14]. However, the studies conducted on the confinement of columns have recently been the basis of the development of the confined compression zone in beams [15,16]. Accordingly, further investigation on the behavior of confined normal strength concrete (NSC), high strength concrete (HSC), and pre-stressed beams are required [6,7,16,17,18]. Elbasha and Hadi [5] observed a linear increase in the spalling-off loads and decrease in ultimate load as the helical pitch increased. However, the decrease in helical pitch was due to the increase in displacement. They also reported that the failure yields and deflections were reduced with the increase in compressive strength of the concrete. This was followed by a significant decrease in the ductility index as the concrete compressive strength increased. Overall, it was indicated that the increase in the ratio of longitudinal reinforcements would increase the displacement ductility index, allowing the occurrence of a higher ultimate in the beam [8]. Several other findings were also developed on the installation of short stirrups as confinements [19]. Specifically, Jeffery and Hadi reported that helical reinforcements had higher effectiveness compared to short stirrups to improve the flexural capacity and displacement ductility index of the confined concrete [6]. Further studies on the hybrid system involved the use of different steel bars types, including normal reinforcement and Fiber Reinforced Polymer FRP bars, as recorded by Qin et al. (2017) [20]. It was found in their study that high strength concrete and ultra-high-strength concrete were reinforced with glass fiber reinforced polymer (GFRP). It was also found that the highly reinforced beams exhibited a higher level of ductility compared to the under-reinforced beams. Following that, ultra-high-strength concrete beams recorded higher energy absorption potentials compared to the high-strength beams with the same amount of reinforcement [20]. Importantly, the main objective of the implementation of various techniques is to improve flexural capacity and stiffness for the prevention of brittle failure of the over-reinforced beams.
Additionally, the use of external strengthening by bolted/glued steel plates system, which is a low-cost system with high stiffness, has been proven to be an effective technique for the improvement of the reinforced concrete structures. The system is glued to the beams and attached to the compression/tension zones of the beam to increase its flexural capacity, ductility, and stiffness [21,22,23]. According to Oehlers and Moran (1990), RC beams that are strengthened with tension-face plates may undergo brittle failure as a result of the disconnection between steel plates and concrete surfaces. Therefore, overcoming premature failure is key in the design of beams with externally glued steel [24]. Oehlers et al., (1998), also highlighted that the use of web bonded steel plates could prevent premature failure of reinforced concrete members with flexural strengthening [25]. Based on Siu and Su’s (2011), study on the flexural performance of bolted steel plates BSP beams, it was found that omitting the partial interaction between the beams and the steel plates would lead to up to 30% of overestimation of the enhancement [11,26]. However, various techniques and materials to strengthen structural has received significant attention among researchers in the recent decades.
To date, a few studies have investigated the behavior of concrete beams that are over-reinforced using the bolts compression steel plates (BCSP) system. Therefore, this study aims to investigate the effects of bolts compression steel plates (BCSP) on the behavior of over-RC beams. It attempts to change the behavior failure from brittle to ductile. Furthermore, achieving an inelastic mechanism with appropriate deformation capacity will reduce the crushing by the BCSP-system. This was followed by the improvement in strength, strain, and energy absorption (EA) for the over-reinforced section. In this research, simply supported beams and steel plates of different thicknesses were used in the development sections.
2. Experimental Work
2.1. Beam Specimens
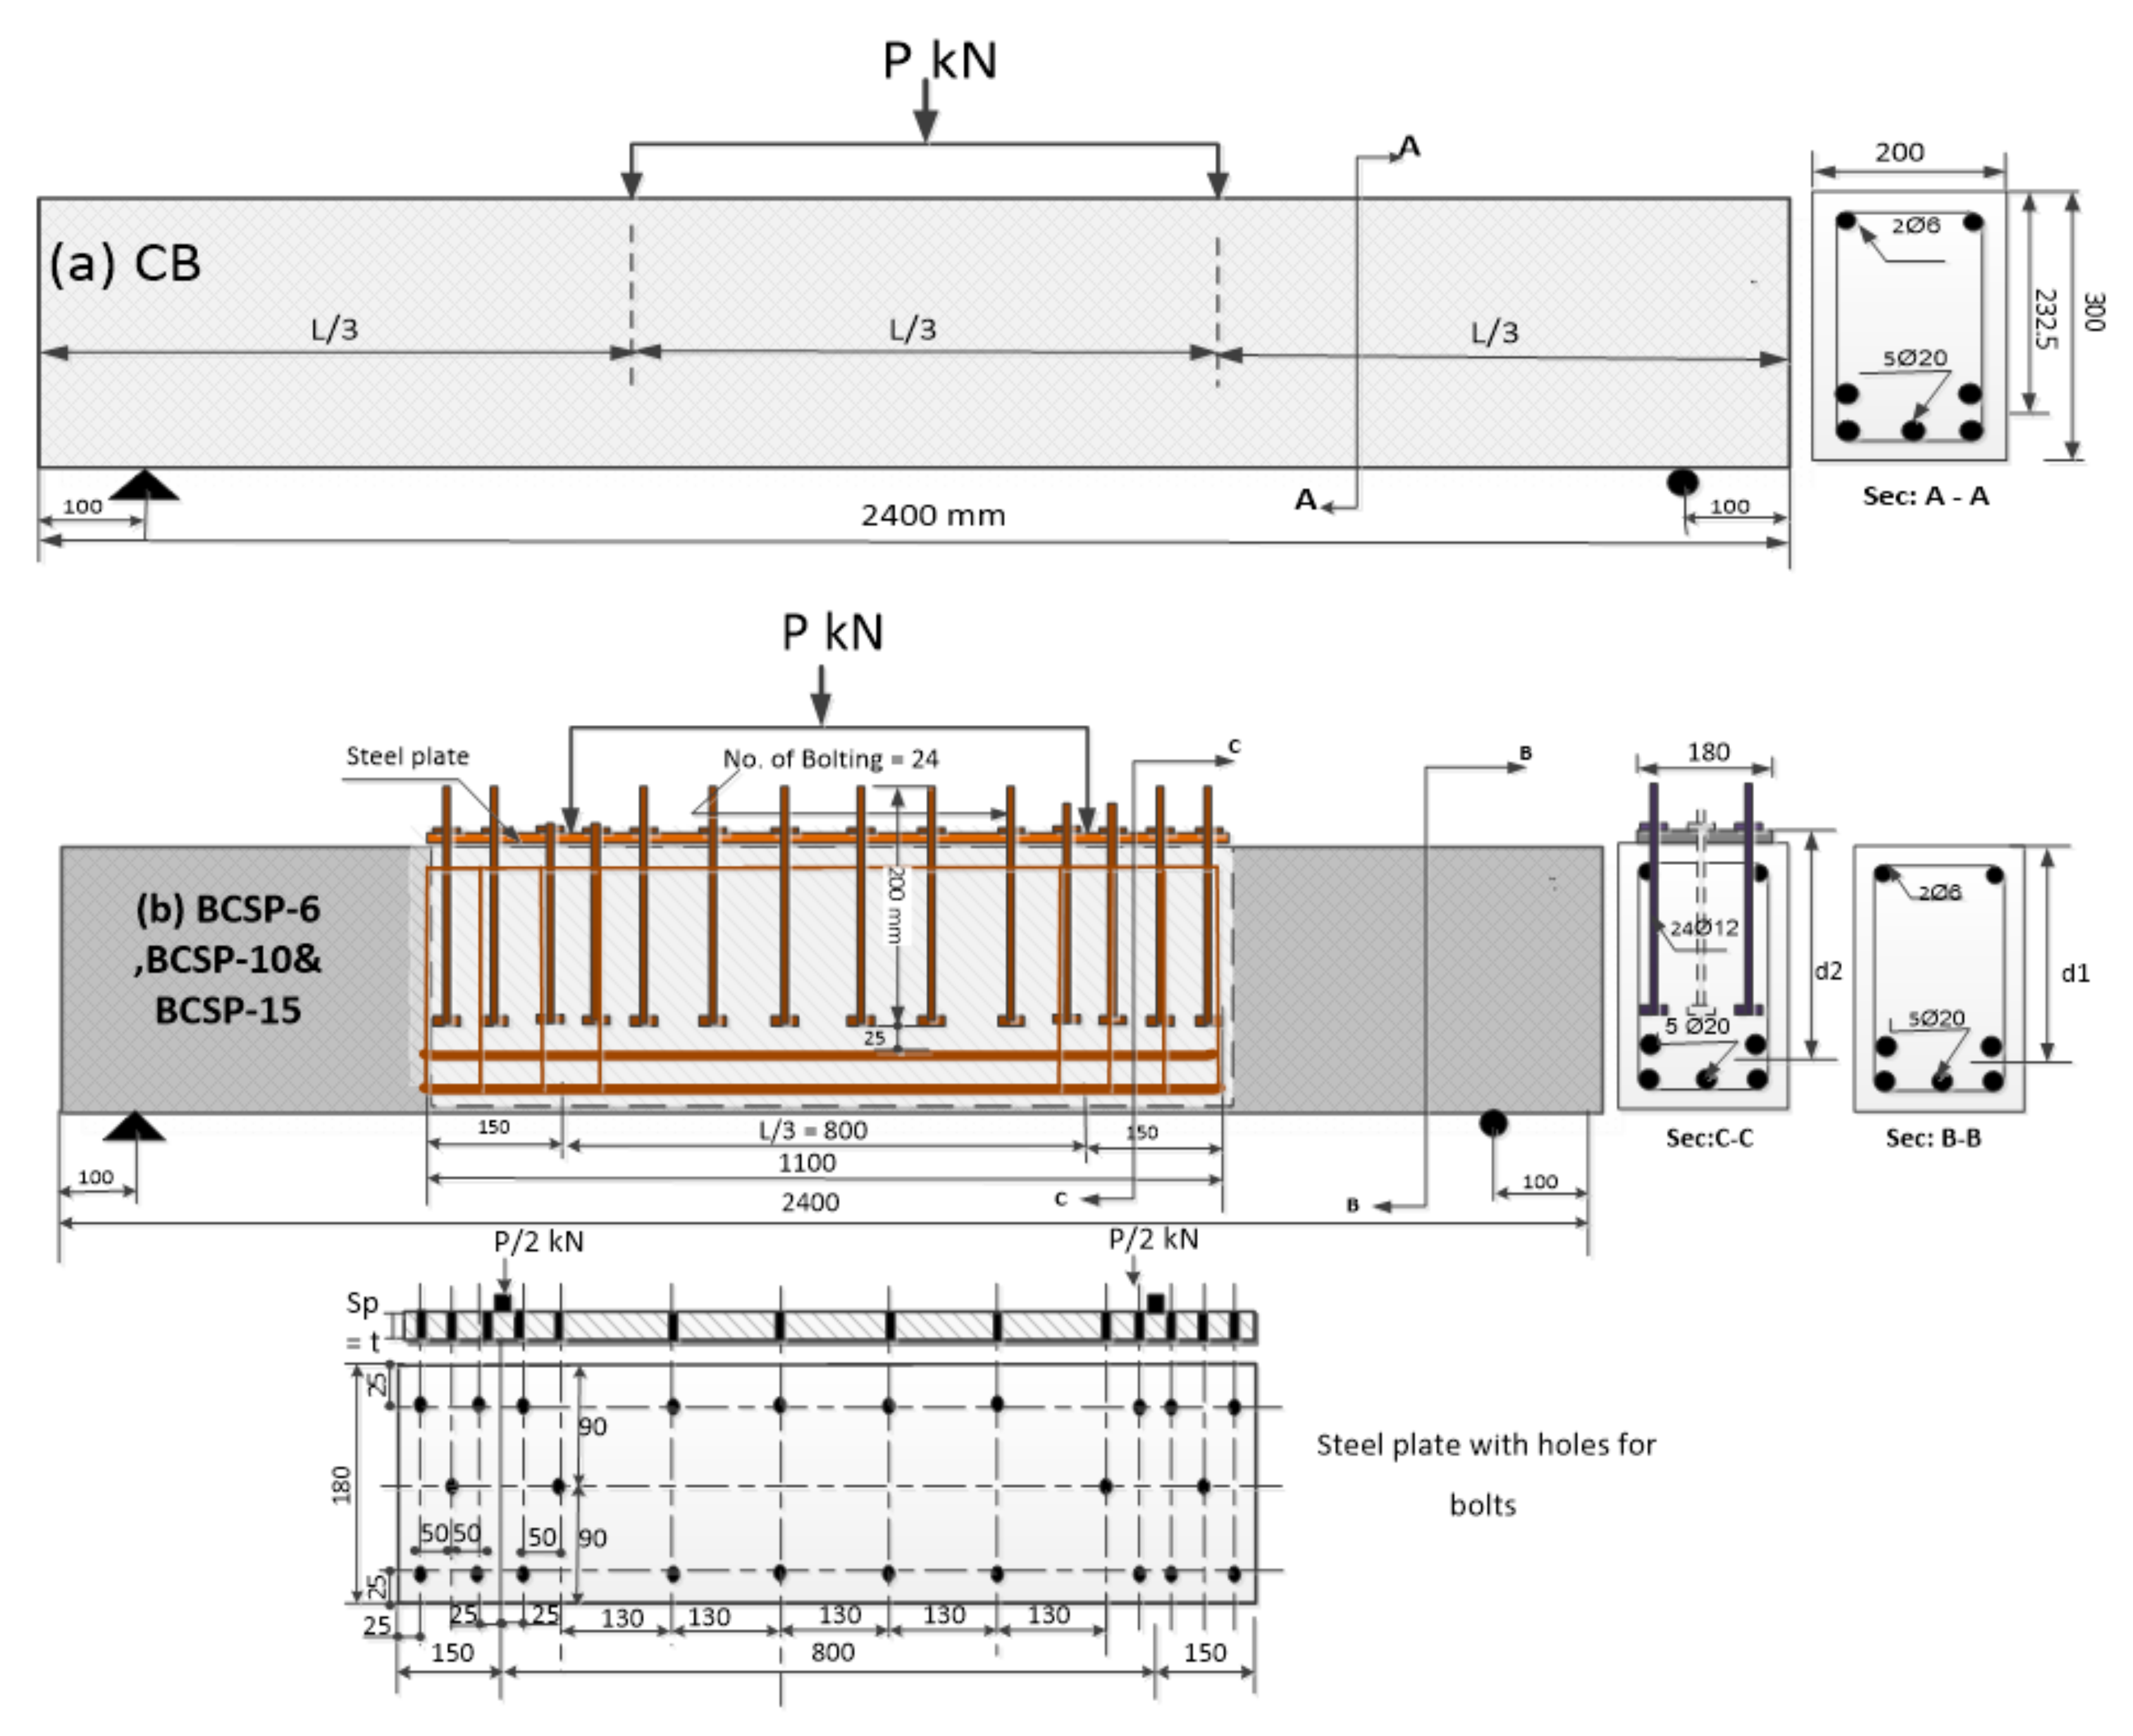
Four full-scale specimens were tested experimentally using pure static bending loads. In achieving this study’s objective, over-reinforced beams of simply supported were fabricated. Then, the beams were tested under two-point loading. The length, width, and depth of the beams were 2400 mm, 200 mm, and 300 mm respectively, with the thickness of the concrete cover amounting to 20 mm. The corresponding details are displayed in Table 1 and Figure 1. The specimens were then over-reinforced by 5Ø20 tension bars with 460 MPa yield strength, which represented 3.27% of steel percentage. Adequate shear reinforcement was provided as a precaution against premature shear failure. The shear reinforcement comprised a transverse reinforcement of 17Ø6 and 275 MPa yield strength. This yield strength was according to the stirrups spaced at 50 mm center-to-center in the point-of-load application. However, no stirrup was provided in the middle zone between the point-of-load applications to avoid any confinement of the concrete due to the stirrups. The properties of steel reinforcement have been adopted in a previous study [27]. Meanwhile, the steel plates used for beam development consisted of 180 mm width and 1100 mm length, with the adopted thicknesses amounting to 6 mm, 10 mm, and 15 mm. The steel plates comprised of 243, 255, and 237 MPa yield strengths [28,29]. The details of all the beams are presented in Table 1, Figure 2 and Figure 3. The average concrete compressive strength obtained from compression tests amounted to 36.08 MPa on the 28th day. The maximum aggregate size of 10 mm was used in the concrete mix. Following that, the cast of ten 100 mm × 100 mm concrete cubes and 200 mm × 100 mm concrete cylinders for compressive, tensile, and flexural testing was performed according to British standard specifications [30,31]. The concrete mix proportions are listed in Table 2.
A beam specimen without a steel plate was prepared and used as a control beam (CB) to demonstrate the structural performance of an over-reinforced beam without a development. Meanwhile, the BCSP beams used in this study were divided into three series, namely the BCSP-6, BCSP-10, and BCSP-15 beams developed by the steel plate of 6 mm, 10 mm, and 15 mm thicknesses. To develop a bond between the steel plate and the concrete, 24 bolts with 200 mm length and 12 mm diameter were used [32]. The steel plates were 1100 mm long and 180 mm wide. Additionally, holes of 12.5 mm clearance were added to the plates to enable tolerances during the bolting. Corresponding details are presented in Table 1. Each of the beams was cast using a steel formwork. However, as shown in Figure 4 and Figure 5b, the BCSP beams of bolting-compression plates were provided by placing two pieces of wood under the plates during concrete casting. As shown in Figure 5a. The beams were then cured for 28 days before the external plates were fixed to cast-in sockets with the bolts. Afterward, the bolts were cast to the beam in order to prevent any slip within the clearance hole of plates and avoid buckling of the steel plates.
2.2. Testing Setup
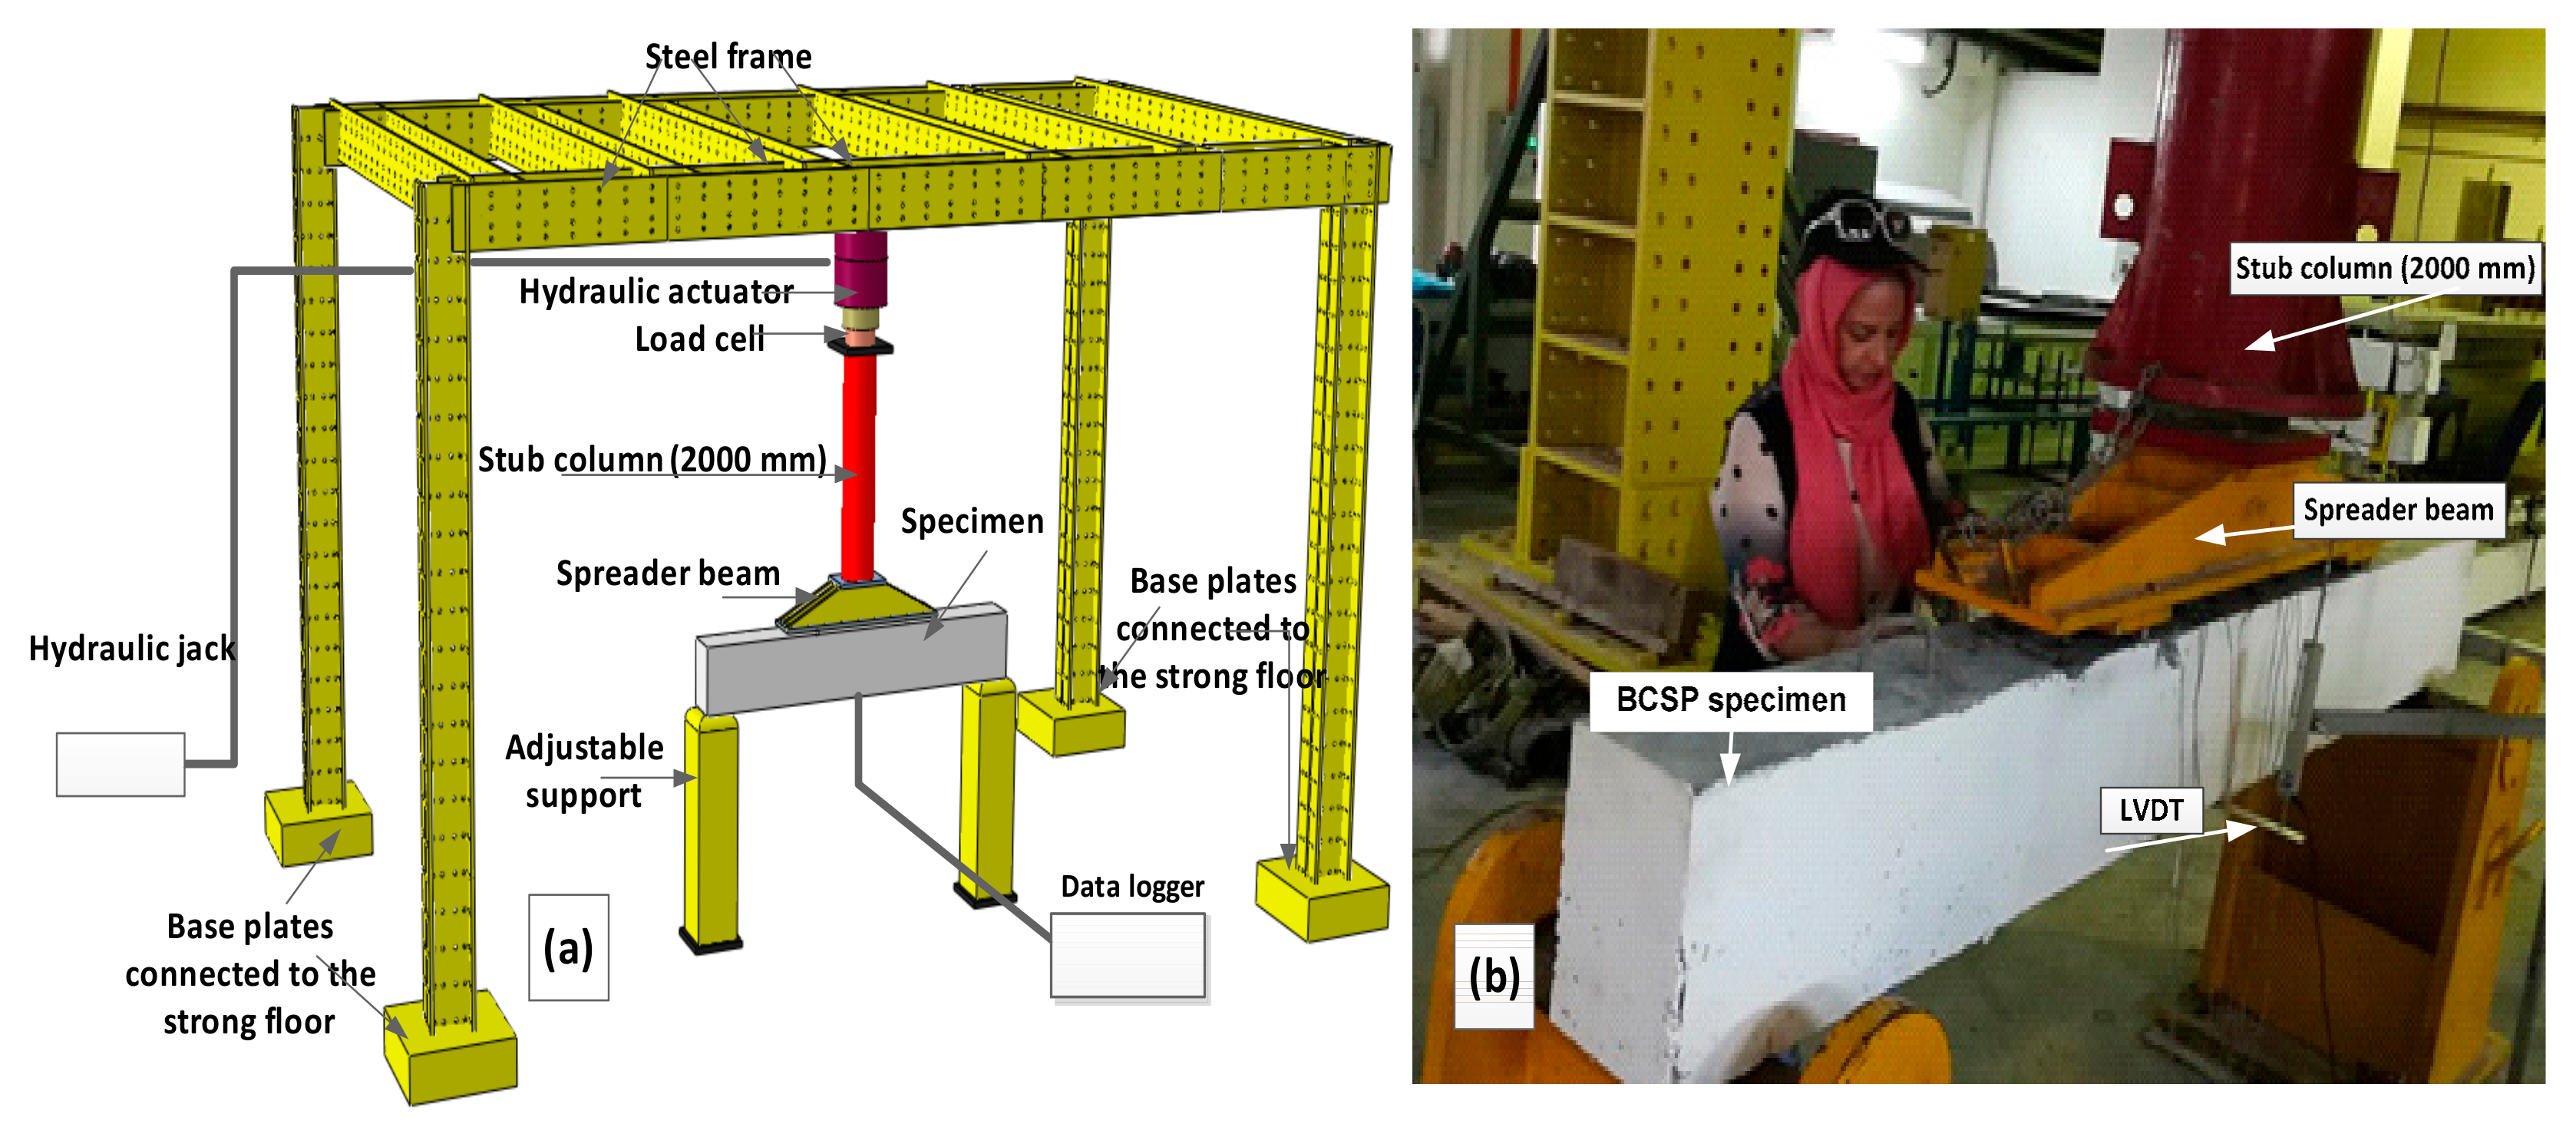
Furthermore, all the over-reinforced simply supported beams were tested under static loads applied over a span of 800 mm. A constant shear span with an effective depth (a/d) ratio of 2.7 was adopted in all the tests. Following that, an MST universal testing machine of 4000 kN capacity hydraulic jack with 50 mm stork length was used to apply the static load. The load was then transferred from the actuator to the spreader beam through a stub column of 2000 mm. Figure 6a,b present a schematic view of the experimental specimen for the test-setup and equipment used in the study. Moreover, a linear variable displacement transducer LVDT was used to measure the mid-span displacement of the beams at a rate of 2 mm/min until peak flexural failure took place. The initial cracks were observed during the experiment, followed by the visual monitoring of the propagation of the cracks. The crack pattern was carefully marked and the loads were recorded accordingly. Two electrical resistance strain gauges were attached at the top of the beams, directly underneath the position of the load cell, to measure the concrete strain; the same position was also used to measure the strain of the steel plate. Two strain gauges were attached at the middle of the beam span in the longitudinal direction of the tensile bars on the bottom to measure tensile strain. All the experimental data including strains, load and displacement at mid-span for over-RC beams were recorded by a data logger, as shown in Figure 6a,b.
3. Results and Discussion
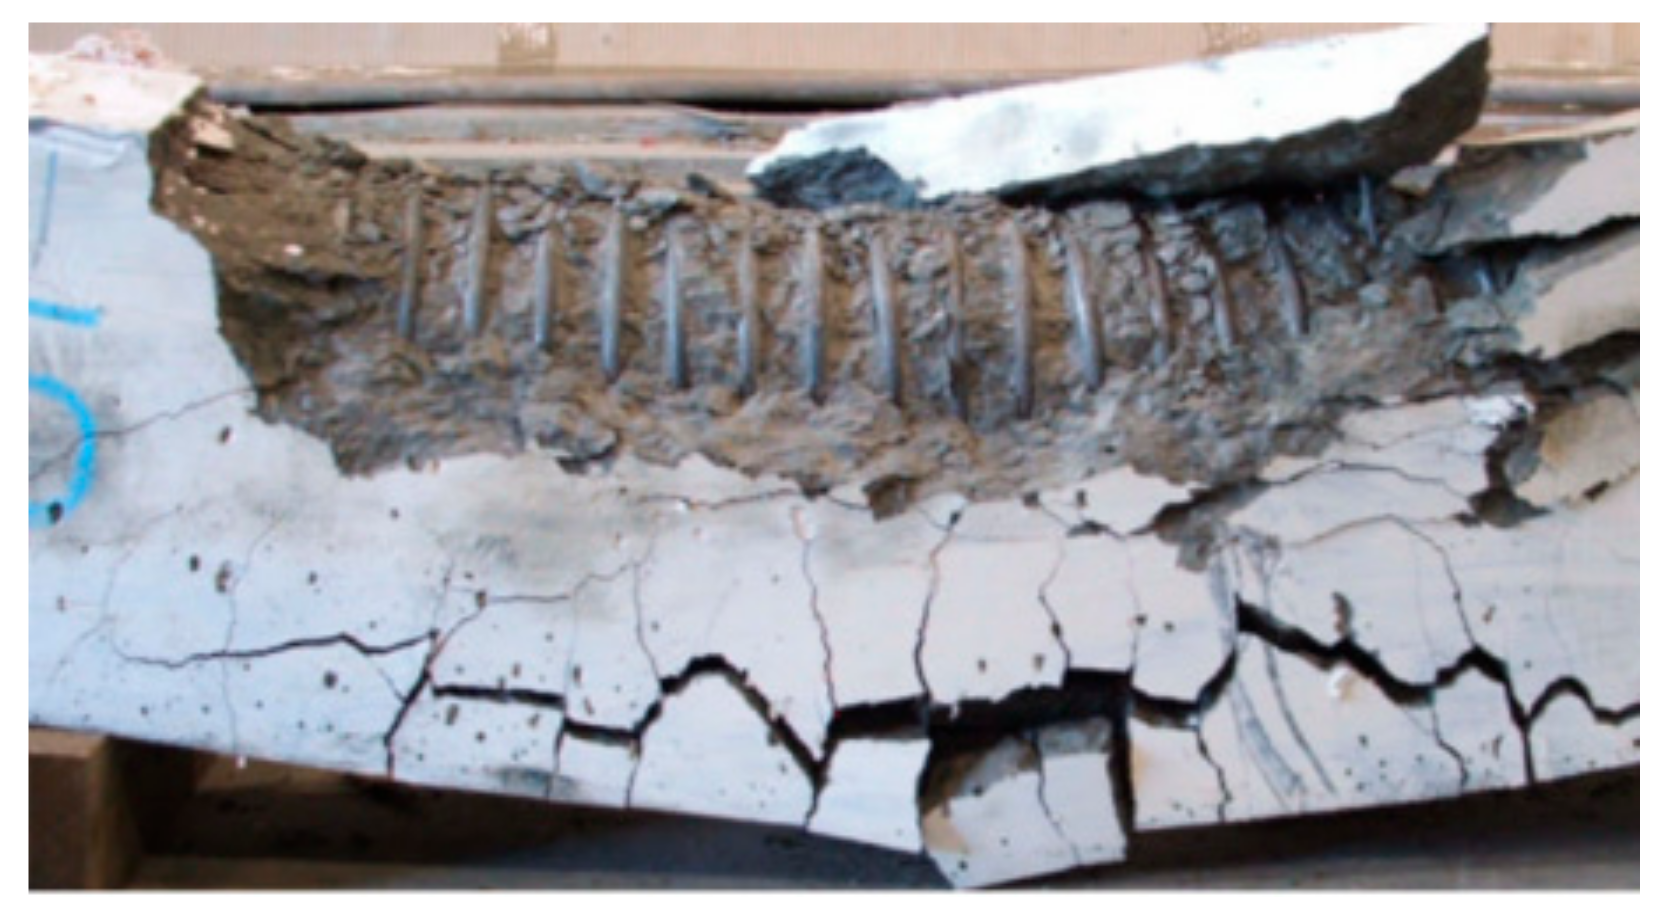
3.1. Failure Modes and Crack Patterns
Based on Figure 7a–d and Figure 8, similar crack patterns and failure modes were observed for all the over-reinforced beams. With the increase in the applied load, the flexural cracks were initiated and gradually extended from the mid-span of the beam. Afterward, new vertical cracks started to propagate towards the support regions. The existing flexural cracks at web shear were increased through further load into flexure-shear cracks. It was observed that the cracks widened under the load points after the formation of the flexure-shear cracks. As time passed, the cracks widened more significantly below the loading points. As a result, the maximum spalling of the concrete cover took place in the compression zone at the critical region of the bending moment.
The vertical crack was initially formed in the CB beam at a load of 71.5 kN, resulting in the formation of flexure-shear crack at a load of 220 kN. A typical brittle failure was observed in this beam, which could be seen from the crashing of the compressive zone at peak load. At the peak load, there was a remarkable drop in the CB beam’s load-bearing capacity, which was defined as peak 1. The load at peak 1 ranged from 356 to 375.5 kN. This peak load was regarded as the failure load of the CB beam due to the spalling and crushing of the concrete cover, as shown in Table 3 and Table 4. Moreover, it could be seen in Figure 7a and Figure 8a that the load was considered as the carrying capacity of the CB beam (PPeak) from a design point of view, due to the crushing and spalling of the concrete cover.
In the case of the specimen, the BCSP-6 beam was developed with the thickness of the steel plate as 6 mm and 24 bolts-compression arrangement. Slow propagation of flexure and flexure-shear cracks was also observed. Additional cracks were found on the concrete cover beyond the peak 1 loading. As for this beam, the observed peak 1 loading amounted to 521 kN. After the crushing of the concrete cover at the peak 1 loading, the beam was able to sustain additional loading, which was identified as the reserve capacity or a pseudo ductility of the beam. Although a slower rate of crack formation was present, higher crushing strength of the concrete cover was observed. The loading was stained by the beam until horizontal cracks were formed in the compression zone at another loading, which was denoted as peak 2. Although the reserve capacity of the beam was retained, a slight decrease in load occurred at this point until total failure occurred at peak 3, as shown in Table 3 and Table 4, Figure 7b and Figure 8b. As the peak 2 loading amounted to 560.1 kN, whereas peak 3 loading amounted to 652.3 kN. Meanwhile, the load at peak 2 ranged from 560.1 to 644.2 kN, while the load at peak 3 ranged from 633.14 to 601.3 kN.
The BCSP-10 beam was developed with a 10 mm thickness of the steel plate. Peak 1 was observed in this beam when the spalling of the concrete cover occurred. This was followed by observation on the horizontal cracks at the compression zone underneath the loading points. The peak 1 loading for this beam was 635 kN. Additionally, the beam was able to carry additional loads and exhibit reserve capacity (pseudo ductility). Notably, there was a remarkable increase in the load-bearing capacity of the beam at this stage until the observation of peak 2 at 837.6 kN load. The peak loading ranged from 801.25 to 794.7 kN. The concrete on the top of the surface was not damaged even at the point of failure of the beam. Subsequently, its failure took place in a flexural mode with a slight horizontal cracking, as shown in Table 3 and Table 4, Figure 7c and Figure 8c.
The last specimen, the BCSP-15 beam, was developed using 15 mm thickness of steel plate. As a result, the beam remained stiff despite the widening of the cracks. The peak 1 loading for this beam was observed as 935.3 kN. The beam sustained the additional load, exhibiting the reserved capacity or pseudo ductility properties. Other than that, a stabilized and continuous load-bearing capacity was evident at the B stage of loading into phase C due to the 935.3 kN increase in displacement. Phase D led to the decline in the loading capacity into the phase F. Despite the failure of the beam, there was no damage at the top of the concrete. Subsequently, the beam failure took place in the flexural mode without horizontal cracking, as shown in Table 3 and Table 4, Figure 7d and Figure 8d.
The procedures for the failures of the BCSP-6 and BCSP-10 beams were similar in terms of the concrete crushing at the loading points. Furthermore, the failure mode of these beams had been developed through a bolting steel plate. Moreover, the failures of the BCSP-6, BCSP-10, and BCSP-15 beams occurred with a yield of steel plate. However, no buckling was involved. As the cross-section was unaltered, a high load capacity could be maintained in the beams after the peak load for the BCSP-10 and BCSP-15 beams.
Therefore, three types of failure modes were present in the over-reinforced beams, namely (1) the crushing of concrete cover at compression mid-span, (2) initial spalling of concrete cover and crushing underneath the loading point, and (3) the flexural failure. Additionally, an extension of the shear cracks was present, including an increase in the crack width within the span. The flexural cracks were formed at an approximate average spacing, which ranged from 80 to 120 mm. The stress-strain diagrams were used to compute the analytical load capacities (Panaly) based on the RC specifications of the ACI-code [33]. This computation was also performed on the analytical load capacities based on the results of the material test, as shown in Table 4.
3.2. Concrete and Steel Strains
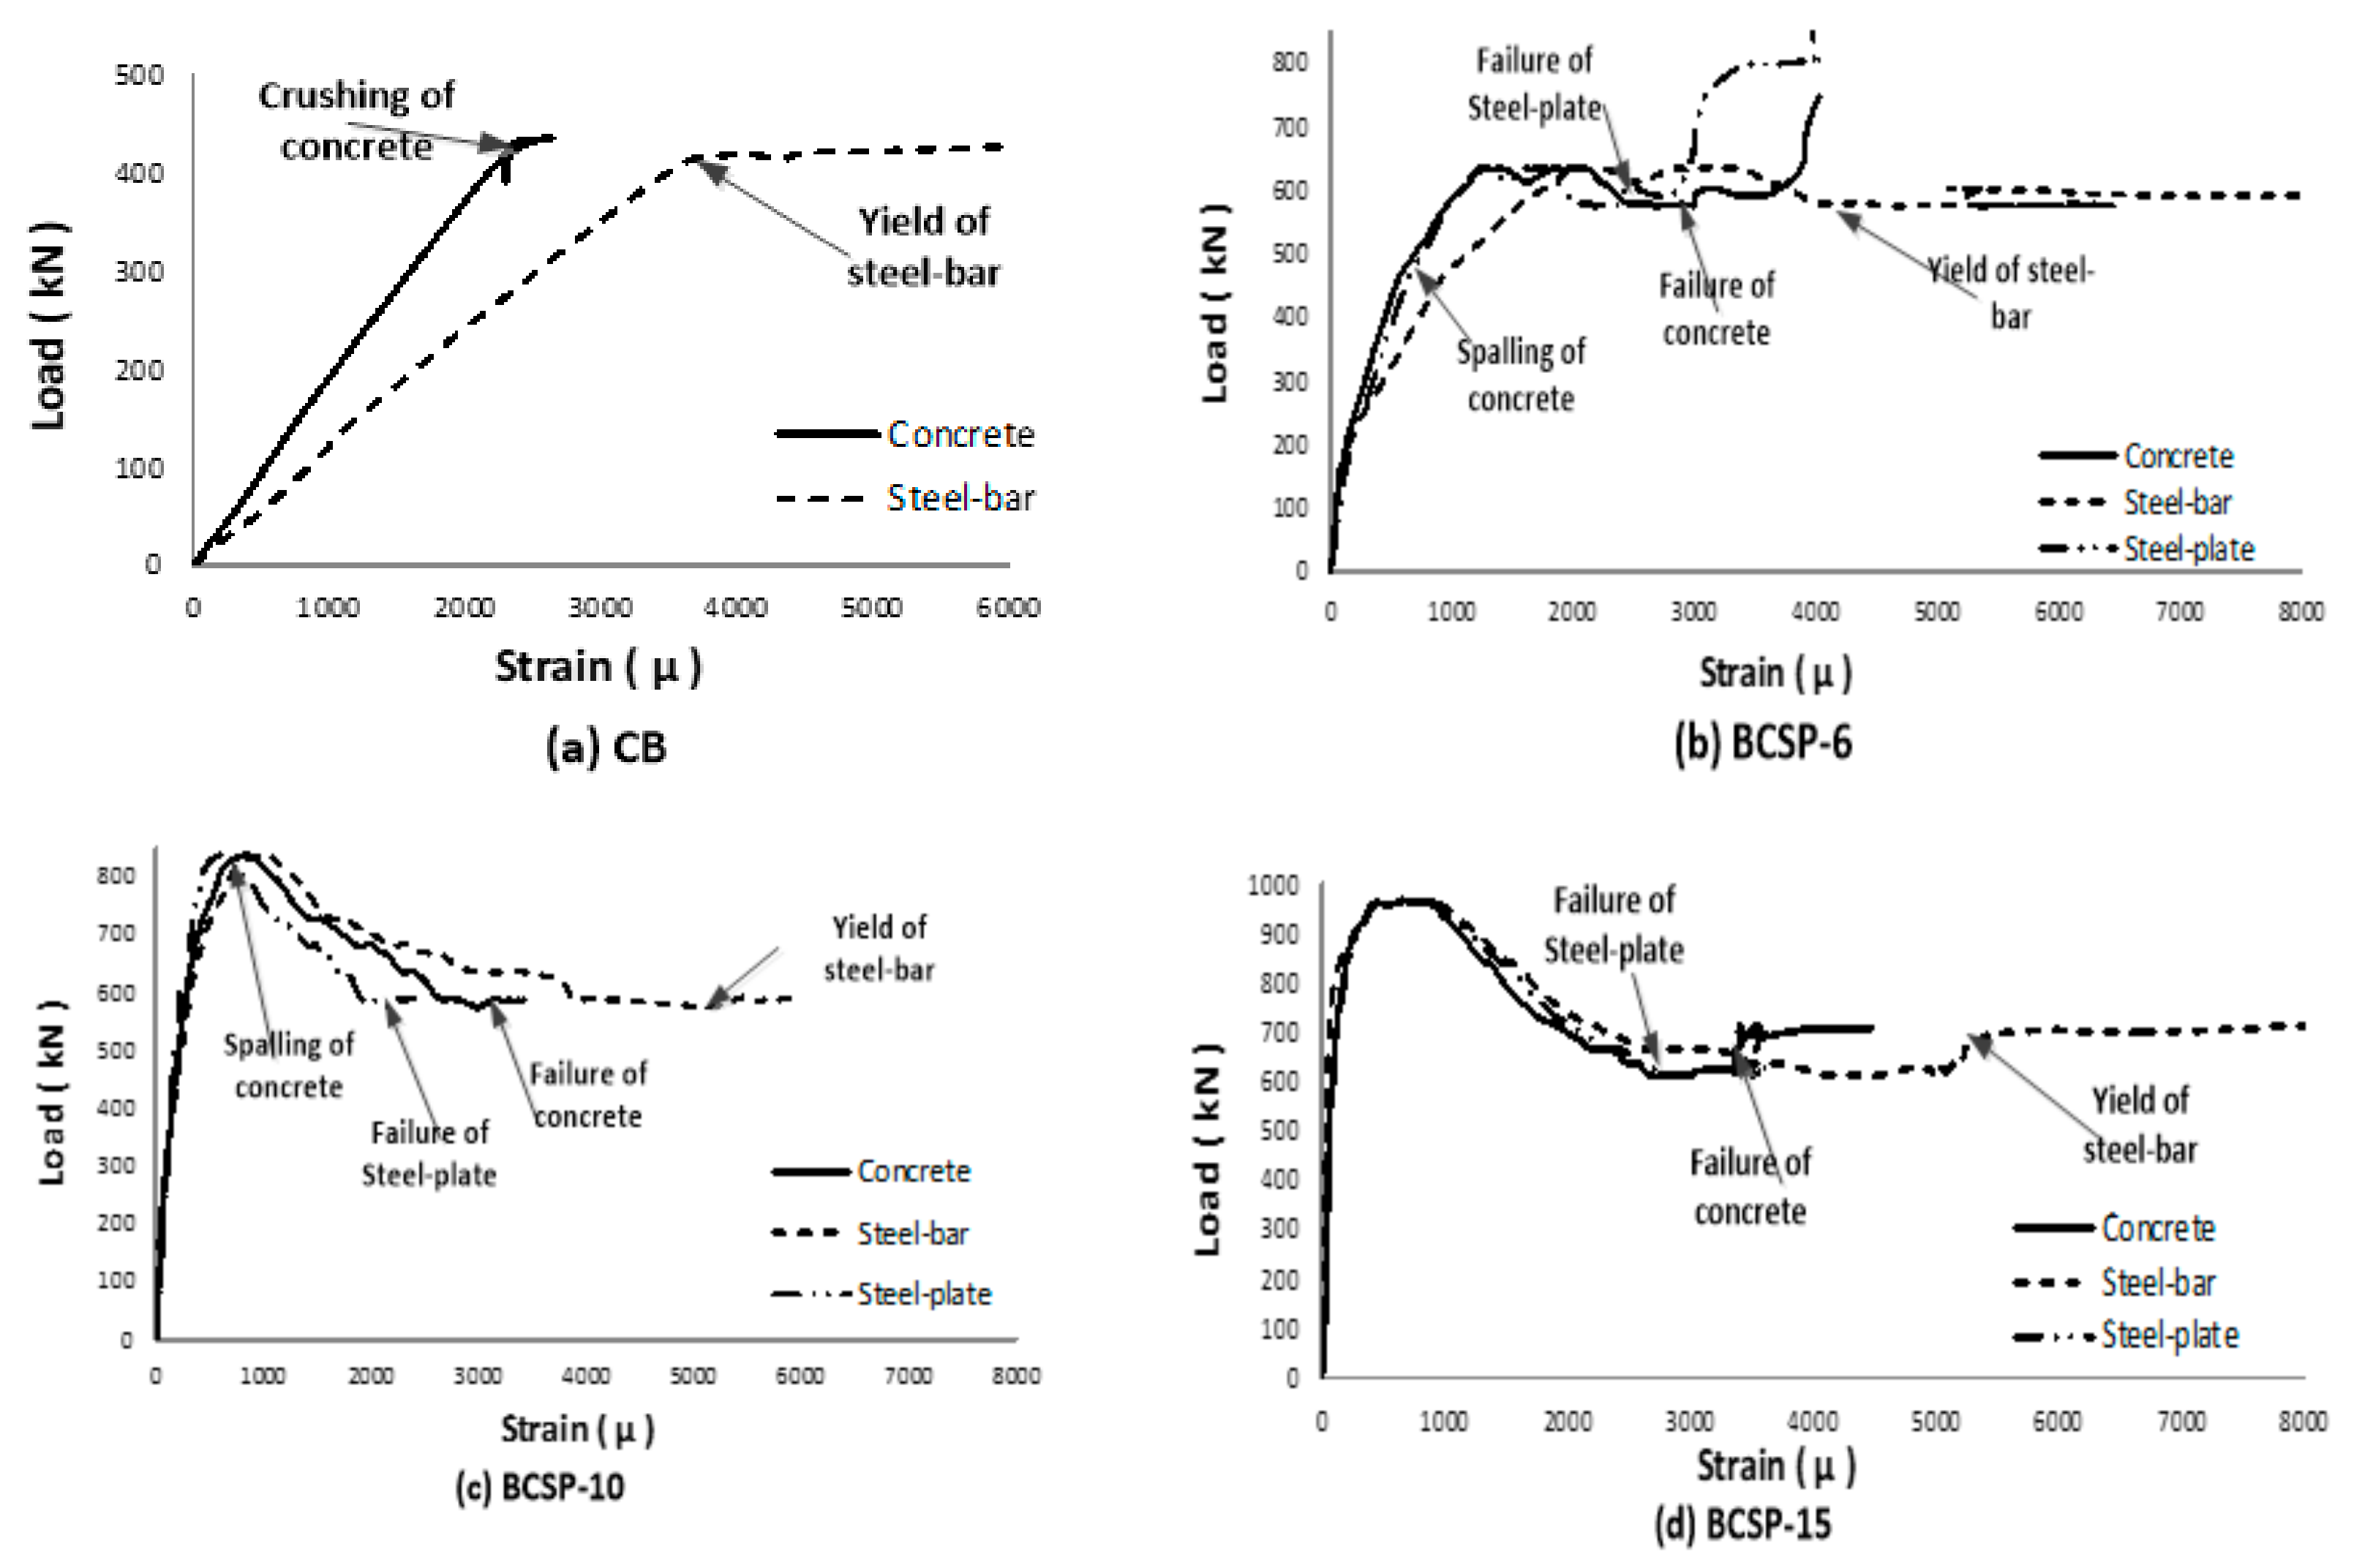
The placing of the strain gauges is such that the concrete strains are on the top surfaces of the beams in the longitudinal direction whereas the steel plate and longitudinal reinforcement strains are in the bottom rebar. The strain progress through the loading of each beam is showed in Figure 9. The load-strain behavior for concrete (ɛc.avg) for the CB beams is shown in Figure 9a. The average concrete strain was found to be 0.0026 based on the linear regression analysis of the loading data up to spalling (crushing of concrete cover). A full failure of the cross-section was observed for the CB beam, quickly after the spalling load. The failure was very brittle in nature.
Linear regression was not fitted for determining average concrete strain for the steel plate for the BCSP-6, BCSP-10, and BCSP-15 beams. As shown in Figure 9b–d, concrete stain at failure was found to be 0.003, 0.0035, and 0.0038 respectively. These values are quite consistent with the assumed maximum compressive strain values of 0.003 and 0.0035 according to ACI and CSA [3,34], respectively. For these beams, the tension reinforcement strains from the tests at the spalling load exhibited elastic behavior without failure until the peak load was reached. After the crushing of the beams, the tension reinforcement yielded as shown in Figure 9. At higher strains on steel bars of the BCSP beams, they withstood more loading. This means that the beams can carry higher loads at the same strain of steel bar without failure. At much higher applied loads, yielding of the steel-plates occurred and was localized under the flexural loading area. The steel plate exhibited plastic strain until the point of peak loading and yielding of the steel plates was initiated before the crushing of the concrete progressed as shown in Figure 9.
3.3. Responses of the Beams to Flexural Loads
Various responses were present in the over-reinforced beams towards the applied loads. To describe the individual responses of the beams, regardless of the presence or absence of steel plates, the characteristics of the beam bending were considered. Furthermore, the loading phases were divided into five phases, as illustrated in Figure 10.
The peak load present in the horizontal cracking in the compression zone was indicated as a spalling load by Pspall. Meanwhile, the center point deflection of the spalling load was identified as Δspall. The second maximum loading, which was obtained after the spalling load was the peak load, (Ppeak), with the center point deflection being denoted as Δpeak. This peak was identified as a result of the deformation-controlled testing system.
Five phases of response were identified as the beams were tested, which were represented in the response curve by the areas ranging from 0 to F. The phase 0-A took place before the initial crack was formed on the concrete. As the initial crack was observed, the cracked section responded to the loading in a linear manner, as shown in the second phase A–B. Phase B–C was the non-linear phase before the compressive capacities of the beams was achieved. In this phase, the spalling of the concrete started at point B. Following this phase, the CB beam exhibited highly brittle characteristics, leading to failure of compression shown in phase C–F in the response curve. During the fourth phase, another peak was observed in the beams with the development of steel plates in section C–D due to the redistribution of the internal stresses. Following this peak, the beams with the development of steel plates exhibited a significantly ductile characteristic due to the increased stiffness and strength mobilized by the steel plates. This phase was denoted as D–F.
Figure 10 presents the load-displacement curves for the center points of the four over-reinforced beams. The maximum capacity of the CB beam was the spalling load. Therefore, the beam in which capacity exceeded this load exhibited highly brittle characteristics. The responses of the beams indicated the influence of the confinement configurations by system development on the behavior of the beams during and after the spalling of the concrete cover. However, the introduction of confinement into the compression zone resulted in an increase in elastic bending stiffness. The BCSP-6 beam experienced a significant capacity increase from Pspall to Ppeak, indicating a combination of higher compressive strength and increased ductility. Beyond the peak load, the significantly high load was sustained in the beam. Furthermore, the BCSP-10 and BCSP-15 beams exhibited an increase in section stiffness. A remarkable decrease in load was then observed after the first peak as a result of the spalling o the concrete cover under the two-point loading. However, the only failure in flexure was observed in the BCSP-15 beam, with no horizontal cracks in the compression zone or at the point loads. However, through the increased thickness of the steel plate, it was ensured that the beams’ cross-section was maintained with reduced flexural cracks through the redistribution of the internal stresses. Figure 11 illustrates the loads and displacement curves for each over-RC beams with the spalling loads and the obtained displacements. The sections of the curve after the peak load indicated the ductile characteristic of the beams.
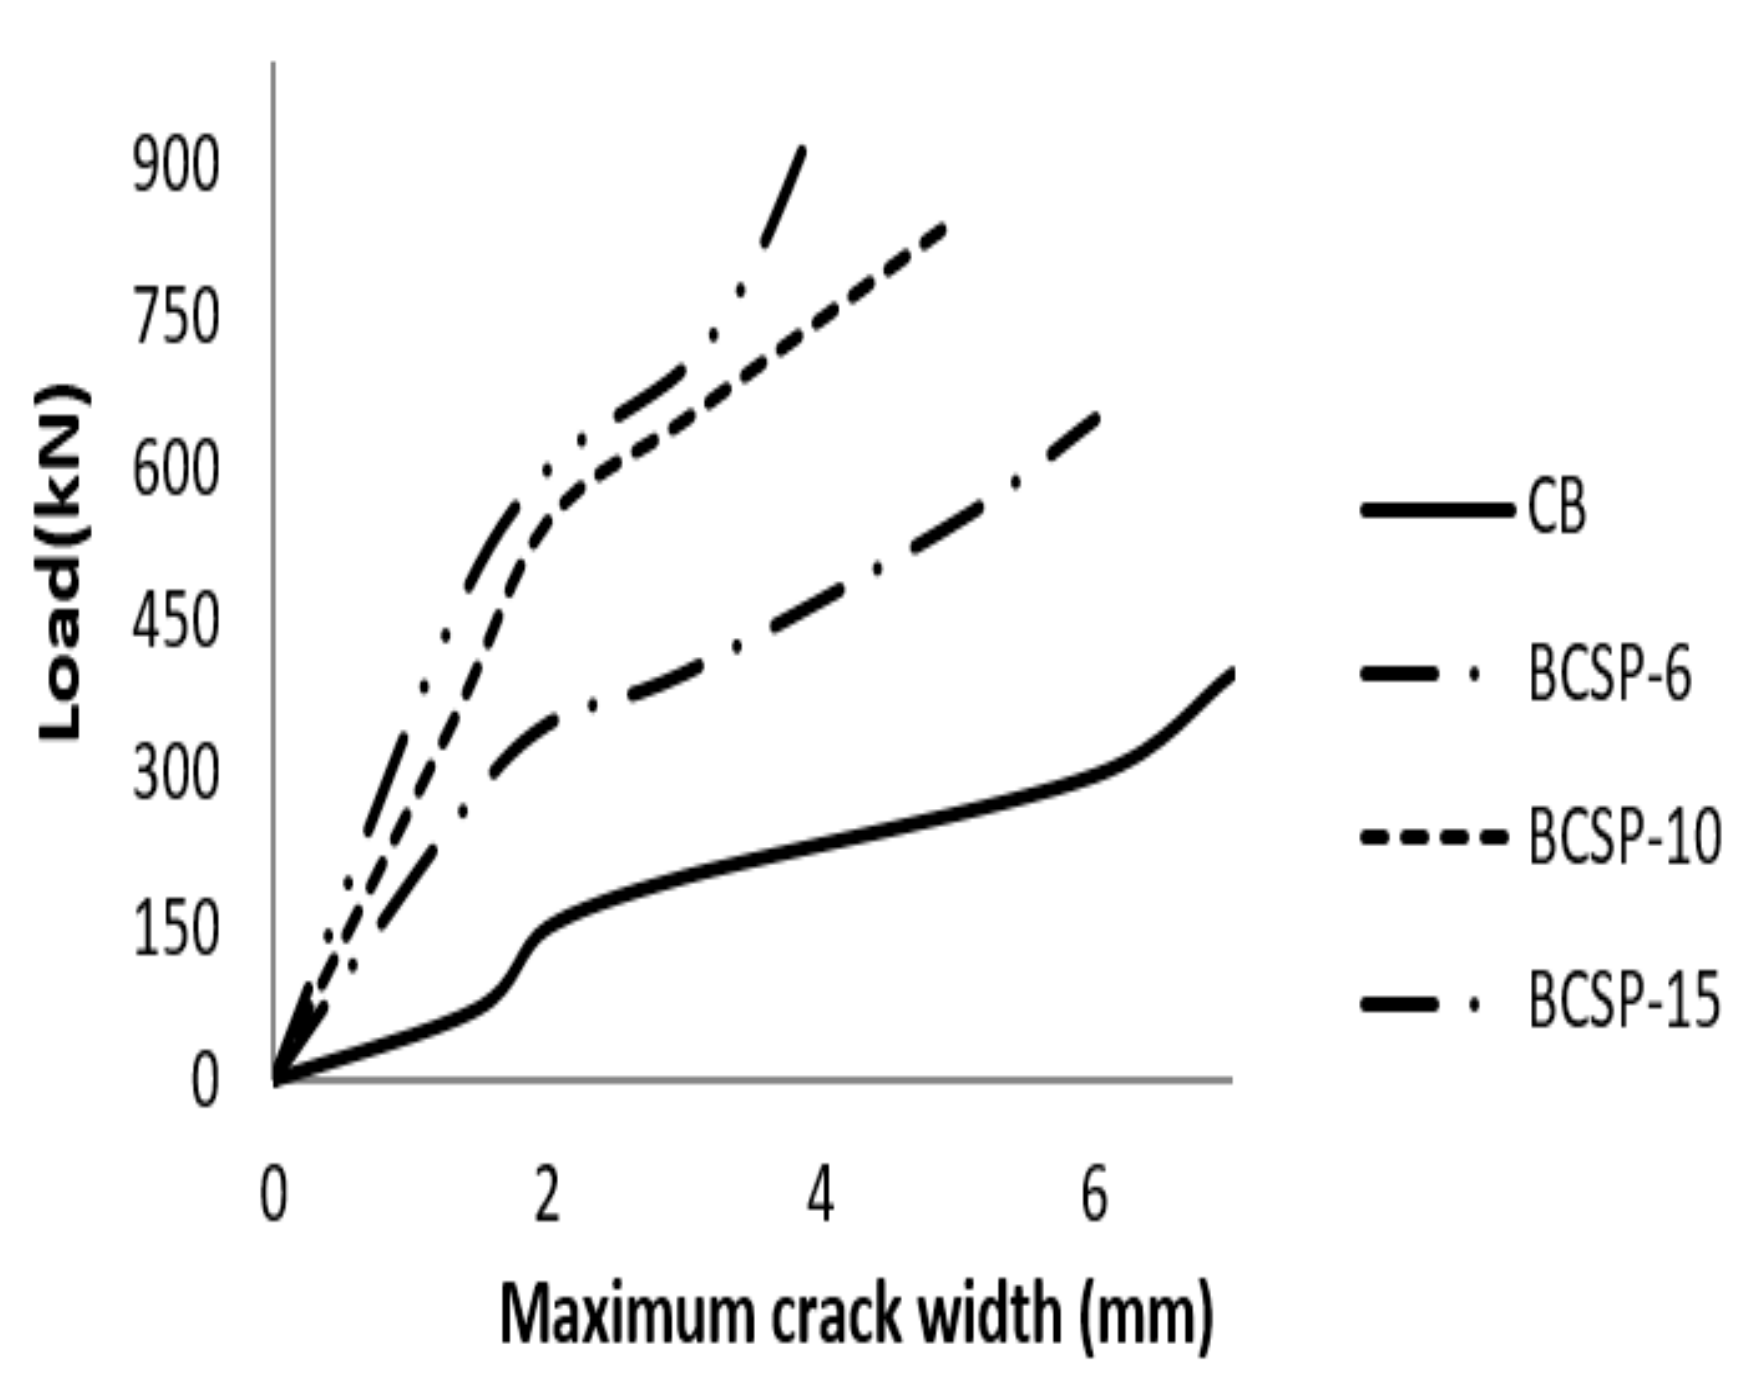
3.4. Crack Width
Vernier Caliper readings were used to measure the width of the cracks during the pre-crack loading stages for all over-reinforced beams until the occurrence of failure, as seen in Figure 11. The development of cracks at each stage was measured and marked on the beams to observe the growth, sequence, and pattern of cracking. As a result, three types of crack were identified, namely flexure, flexural-shear, and horizontal cracks (spalling of cover concrete). Specifically, flexural failure was taken into account in this study to identify the flexural cracks in the beams specimens. Furthermore, the type of loading and mode of failures of the beam specimens are listed in Table 3 and Table 4. Meanwhile, the crack widths for all the over-reinforced beams are shown in Figure 7 and Figure 8.
It was observed that the loads were initially increased up to 30%. Although the ultimate load of the CB beam possessed an elastic characteristic, 45% of the ultimate loads in the BCSP-6, BCSP-10, and BCSP-15 beams were dominated by this characteristic. This was followed by the appearance of flexural-shear cracks, which initially occurred at the mid-span of the beam sections. They gradually extended to the point-of-load application and finally to the supports. Then, the existing diagonal cracks widened and extended further with the increase in the loadings. Furthermore, the flexural cracks were observed at the point of load application. The applied load was approximately half of the ultimate load for the CB beams; however, it amounted to approximately 65% for the BCSP beams. For all the beams, the flexural cracks reached the mid-depth of the beam sections. At approximately 80%–90% of the ultimate load, the horizontal cracks appeared at the point-of-load application and widened significantly until the beam failure took place. Figure 11 illustrates the maximum width of the flexural cracks of all the beams with the corresponding loads. To be specific, the applied loads amounted to approximately 90% of the ultimate load. It was indicated from the figure that the imposed load, which corresponded to the first flexural cracks, decreased with as the thickness of steel plate to the effective stiffness ratio increased.
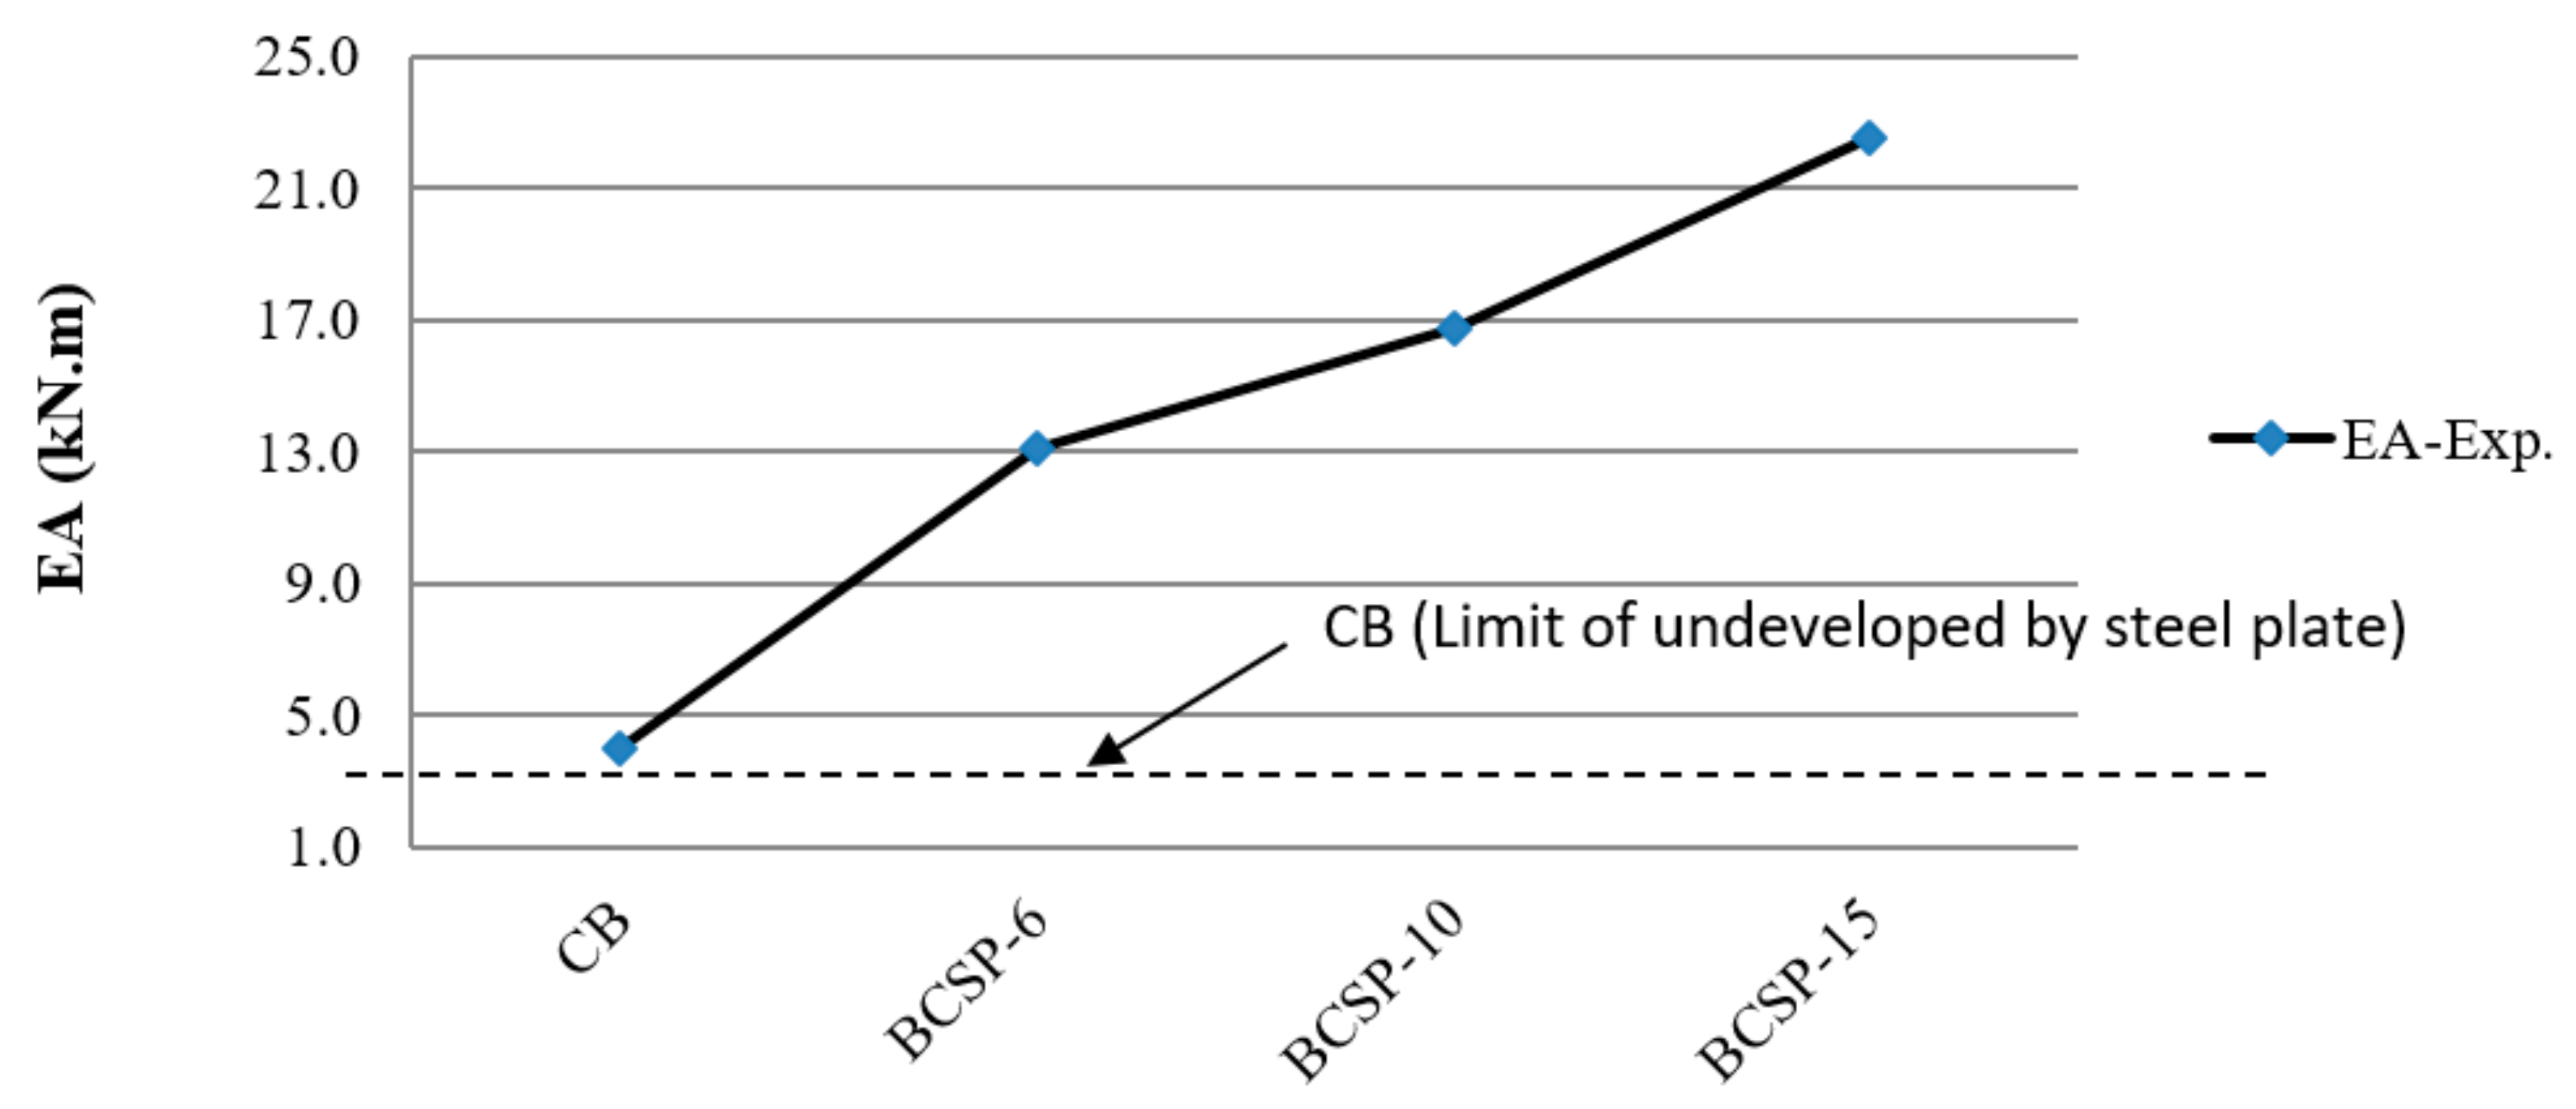
3.5. Energy Absorption
In this section, the energy absorption EA capacities were estimated by calculating the areas under the curves of load versus midspan displacement, as shown in Figure 12 [35,36]. Compared to the CB beam, higher EA capacity and stiffness values were observed in the bolted steel plate over-reinforced beams specimens. The values of the EA capacities for the over-reinforced beams are presented in Table 5. Based on Figure 13, it was found that the CB beam possessed the lowest energy absorption capacity compared to the over-reinforced beams. Additionally, the EA for the CB beam amounted to approximately 4.03 kN m. The highest value of EA of 22.5 kN m was recorded for the BCSP-15 specimens, which were developed with a bolted steel plate with 15 mm thickness. As shown in Figure 13 and Table 5, this value was then increased further by 247.5%, 317.5%, and 462.5% for the BCSP beams compared to the CB beam.
3.6. Ductility
The ductility of the material is indicated through the energy absorbed by a material until a complete failure takes place. In fact, material ductility is a crucial factor in the design of structures [11,37,38]. To quantify the ductility of a reinforced concrete structure, the ratio of curvature of the concrete from the crushing to the yielding of the reinforcement is usually reported as the ductility index [10,18,39,40,41,42].
As over-reinforced beams were used in this study, the use of the yielding of reinforcements to find the ductility index was more challenging. Alternatively, ductility indices were evaluated at 90% of the spalling load based on the behaviors of the over-RC beams at the spalling load, peak load, and post-peak response. This phenomenon is different from the seismic design methodology explained in Euro-code 8 [43], where a post-peak value of 85% of the maximum bending value was used to define the local sectional ductility index.
The definition of ductility presented in this study was based on the load-deflection curve under compressive loading. Therefore, the displacement ductility ratios were defined as µ1 = Δpeak/Δspall and µ2 = Δ0.9, spall/Δspall, while the center point deflection at 90% of the spalling load was defined as µ 0.9, spall. Table 6 and Table 7 illustrate the BCSP-15 beam, where the calculation of the ductility was based on the yield load.
Essentially, increasing the thickness of steel plates led to higher ultimate deflection and ductility. A ductility of 10%, 19.1%, and 17% was achieved in the BCSP-6, BCS-10, and BCSP-15 beams respectively, which was higher than the ductility of the CB-beam according to the spalling load (µ1). However, the ductility of the BCSP-15 beam was based on the yield load. Meanwhile, the ductility index (µ2) for the BCSP-6 and BCSP-10 beams amounted to 2.7 and 2.9 respectively due to the increase in the thickness of the steel plate in the compression zone. As a result, the beam stiffness increased which restricted the crack propagation and improved the ductility. An improvement in the BCSP-15 ductility index (µ2) by 2.2 was observed. For this reason, the toughness of the compression zones of the BCSP-15 beam posed a minor influence on structural ductility. However, the capacity strength significantly increased due to the inverse relationship between flexural capacity and ductility, as shown in Table 6 and Table 7.
3.7. Flexural Stiffness
3.7.1. Service Stiffness
To calculate the flexural stiffness of every specimen, the slope between the two points corresponded to pre-crack loading (30% of peak loading), spalling load, and yield load (80%–85% of peak loading) on the ascending segment of the load-deflection curve. Normally, the stiffness measured from the slope of the pre-crack loading to the yield load segment of the load-deflection curve was defined as the service stiffness. The service load level for a reinforced concrete beam normally corresponded to 60% until 70% of the ultimate load of the beam based on the load and material factors stipulated in the reinforced concrete design codes [44].
In this study, the permanent deformation of steel bars was not used to identify the stiffness as the beams were over-reinforced. Furthermore, stiffness was defined based on the response of the beams at the spalling load, yield load, and pre-crack loading. The stiffness ratios were defined as K0.3Ppeak = P0.3Ppeak/Δ0.3Ppeak, Ksec = (Pspall − P0.3Ppeak)/(Δspall − Δ0.3Ppeak), and Kspall = pspall/Δspall, where K0.3Ppeak, secant stiffness (Ksec), and Spall stiffness (Kspall) were present. Due to the presence of yield in the BCSP-15 beam, it was dependent on Ksec = (Pyield − P0.3Ppeak)/(Δyield − Δ0.3Ppeak). Meanwhile, Kyield = Pyield/Δyield was determined based on the load of the displacement data obtained during the test.
Of the peak load 30% and 80%–85% were considered as the realistic representations of the service stiffness for the tested beam specimens. Table 8 and Figure 14 illustrate the service stiffness of the CB beam compared to the service stiffness of the development beams. It was observed that the service stiffness (K0.3peak) of the BCSP-6 beam increased up to a ratio of 73.7%. As shown in Table 9, 86% of the increase in stiffness was observed from the BCSP-10 beam, while the stiffness of the BCSP-15 beam amounted to 122.7% in comparison with the CB beam. This increase was possibly the result of the increased thickness of the steel plate, with the absence of buckling steel plate and the slip between the compression steel plate and beam. Furthermore, no bolting slip was present between the steel plate and the beam. These factors contributed to a significant increase in beam stiffness. Therefore, the presence of a steel plate in the compression zone and a higher thickness of the steel plate could lead to higher beam stiffness.
3.7.2. Post-Peak Stiffness
In order to calculate the post-peak stiffness of the beams, the slope of the curves between the points of the spalling load (80%–85% of peak loading) and the peak load on the descending side of the load–deflection curve was obtained. The loaded beams beyond this section possessed in-elastic characteristics. The stiffness ratios were defined as KPpeak = PPpeak/ΔPpeak and Ksec = (Pspall − PPpeak)/(Δspall − ΔPpeak), and Kspall = pspall/Δspall, where KPpeak, secant stiffness (Ksec2), and spall stiffness (Kspall) were determined based on the load to the displacement data obtained during the test.
The post-peak stiffness values were calculated for all the beams, with the values being presented in Table 8 and Table 9 and Figure 14. Obtained for the BCSP-6 beam, it was lower than the service stiffness, indicating a weaker load resisting capability at this loading phase. Generally, the post-peak stiffness for the beams comprised an increase in steel plate thickness, with the exception of the BCSP-15 beam, which recorded a post-peak stiffness of 60.34 kN/mm. With this amount, 11.1% of reduction from the value for the BCSP-10 beam was recorded. Based on the simultaneous evaluation of the toughness and post-peak slope diagrams, the factor of higher flexural toughness values of the BCSP-10 beam was indicated. The lower post-peak slope of the specimens and their higher maximum defections were found to be the main factors of the high flexural toughness.
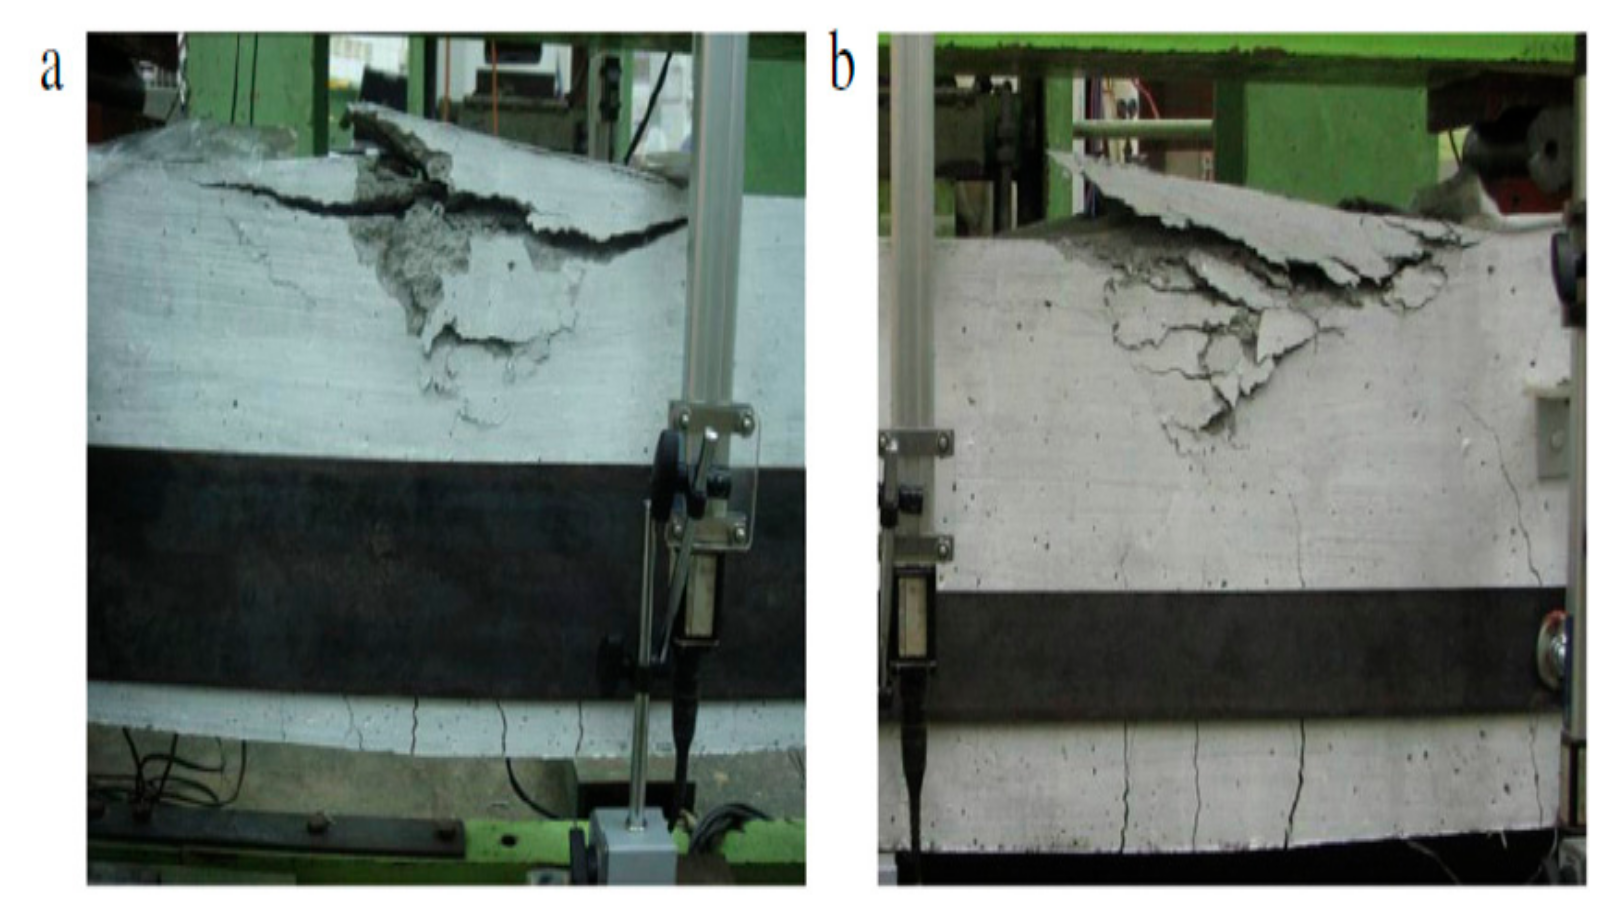
3.8. Comparison with the Previous Studies
In this section, the behavior model of over-reinforced beams presented in this study was compared with the results from previous studies. The steel plates in this study were placed in the compression zone of RC beams. This arrangement was then compared with the use of helical reinforcements, rectangular or square short stirrups, and side-steel plates for RC beam development. The strength, stiffness, ductility, flexural cracking, and mode failure of the beams were compared, followed by the development of several inferences.
The single or double helical reinforcement was found to be a satisfactory method to develop the over-reinforced beam section [7]. This finding was proven through the fact that the experimental flexural strengths of all the beams, which are developed with helical reinforcement, are higher than the strength of the calculated ultimate flexural loads. Furthermore, the beams with helical confinements exhibited lesser deformation compared to the control beams without development. Similarly, the BCSP beams investigated in this study exhibited the same characteristic in terms of flexural strength and deflection. Moreover, as the BCSP-system possessed a different curve of load-deflection, the system exhibited more ductile characteristics compared to the conventional system. Besides being dependent on the helical pitch, the helical system’s diameters were the main parameters influencing the effectiveness of helical confinement of concrete. The BCSP-system was influenced by the thickness and length of steel plates.
The helical reinforcements were found to be more efficient in improving the strength and ductility of confined concrete compared to short stirrups [6]. Comparatively, the bolts-compression steel plate was found to be more effective than helical. It also possessed short ties to enhance the strength, stiffness, and EA of the beams.
Therefore, it could be concluded that crushing failure (spalling cover) is present in all methods of the development of over-flexural sections at compression with flexural cracking. Accordingly, the BCSP-system improved the mode failure and transitioned the behavior failure from brittle to ductile. It also avoided sudden failure in the compression zone. Overall, the development of mode failure was observed in this study using failure modes and crack patterns. The details of the flexural behavior are presented in Section 3.1. This failure was due to the strain gradient effect, which occurred in the effective thickness in the BCSP beams subjected to flexural stress. For this reason, the horizontal cracking was reduced to a lower level compared to the cracking in tension. However, the systems with the helical steel and side-steel plate experienced section improvement, which maintained the crushing failure, as seen in Figure 15, Figure 16 and Figure 17. These findings could be compared with the mode of failure of the BCSP beams presented in Figure 7.
4. Conclusions
A laboratory investigation was conducted on over-reinforced beams with a bolted compression steel plate arrangement using various thickness levels. Based on the results of the investigation, the following conclusions can be drawn.
- Bolting the steel plates at the compression zone resulted in a significant increase in the load-bearing capacity of the BCSP beams as the increase in steel plate thickness took place with the control beam. The peak load-capacity of the BCSP beams ranged from 73.7% to 149% of the CB beam. Notably, the BCSP beams sustained higher loads before the appearance of initial cracks. Therefore, the use of steel plates was found to be an effective crack control strategy, which is highly important in ensuring the serviceability of RC structures.
- It could be concluded that the EA of the BCSP beams increased due to the increase in steel plate thickness compared to the control beam. It was also observed that the increase in EA amounted to by 247.5%, 317.5%, and 462.5% for the beams with 6 mm, 10 mm, and 15 mm steel plate thicknesses respectively.
- There was also an increase in the beams with the steel plates compared to the CB beam. Meanwhile, the increase in the flexural service stiffness ranged from 73.7% to 122.7%. The steel plates exerted additional resistance against the compressive forces after the concrete cracked.
- The use of steel plates for the development of over-reinforced beams could contribute to an increase in stiffness of the BCSP beams. This increase was due to the control of the steel plates on the spalling of the concrete cover and the improvement in the failure modes of the BCSP beams.
- The improvement in the over-RC beams with steel plates led to the transition of the nature of failure from brittle to ductile. The beams sustained higher loads until the ultimate capacities were achieved with the reduction of crushing on the top of the concrete, which was one of CB beam weaknesses due to the sudden brittle failure.
- Bolting the steel plates to the concrete led to a confining effect on the concrete, leading to less severe horizontal cracks at the compression zone. Notably, due to a more significant confinement effect on the beams, higher steel plate thicknesses were developed, which failed at higher loads.
Author Contributions
Conceptualization, S.A.; methodology, S.A., P.S. and Z.I.; software, S.A.; validation, S.A., P.I. and Z.I.; formal analysis, S.A.; investigation, S.A.; resources, S.A.; data curation, S.A.; writing—original draft preparation, S.A.; writing—review and editing, S.A., P.S. and Z.I.; visualization, S.A., P.S. and Z.I.; supervision, Z.I. and P.S.; project administration, S.A.; funding acquisition, S.A. All authors have read and agreed to the published version of the manuscript.
Funding
This research received the funding no (Project No: GPF015A-2018) by the Faculty Research Grant of the University of Malaya (UM).
Acknowledgments
The authors are grateful to the University of Malaya (UM) for the financial support provided by the Faculty Research. The first author appreciates the Department of Civil Engineering, College of Engineering, Al-Mustansiriyah University, and the Ministry of Higher Education of Iraq for providing support for her studies.
Conflicts of Interest
The authors declare no conflict of interest.
Nomenclature
| As | Area of tensile longitudinal reinforcement, mm |
| Ap | Area of steel plate, mm |
| tp | Thickness of steel plate |
| Ec | Modulus of elasticity for concrete, GPa |
| Ep | Modulus of elasticity of steel plate, GPa |
| Es | Modulus of elasticity of tensile longitudinal reinforcement, GPa |
| fc’ | Concrete compressive strength, MPa |
| ƒy | Steel yielding strength, MPa |
| Pspall | Spall loading, kN |
| Ppeak | Peak loading, kN |
| ΔPpeak | Displacement at peak loading, mm |
| Δspall | Displacement at spall loading, mm |
| Δcr | Displacement at first loading, mm |
| KPspall | Stiffness at spall loading, kN.mm |
| KPpeak | Stiffness of peak loading, kN.mm |
| K0.3Ppeak | Stiffness of 0.3% peak loading, kN.mm |
| EA | Energy absorption, kN.mm |
| µ1 | Index ductility = ΔPeak/Δspall |
| µ2 | Index ductility = Δ0.9 spall/Δspall |
| SBSP | Strong-Bolt Strong-Plate |
| WBSP | Weak-Bolt Strong-Plate |
| RC | Reinforced concrete |
References
- Ahmed, M.; Farghal, O.; Nagah, A.; Haridy, A. Effect of confining method on the ductility of over-reinforced concrete beams. J. Eng. Sci. 2007, 35, 617–633. [Google Scholar]
- Alasadi, S.; Ibrahim, Z.; Shafigh, P.; Javanmardi, A.; Nouri, K. An experimental and numerical study on the flexural performance of over-reinforced concrete beam strengthening with bolted-compression steel plates: Part II. Appl. Sci. 2020, 10, 94. [Google Scholar] [CrossRef] [Green Version]
- Portland Cement Association. Notes on ACI 318-02: Building Code Requirements for Structural Concrete with Design Applications; Portland Cement Association: Skokie, IL, USA, 2002. [Google Scholar]
- AS3600. Australian Standard for Concrete Structures; Standards Association of Australia: Sydney, Australia, 2001.
- Hadi, M.N.; Schmidt, L.C. Use of helixes in reinforced concrete beams. Struct. J. 2002, 99, 191–198. [Google Scholar]
- Jeffry, R.; Hadi, M.N. The effect of confinement shapes on over-reinforced HSC beams. Proc. World Acad. Sci. Eng. Technol. 2008, 30, 286–293. [Google Scholar]
- Hadi, M.N.; Elbasha, N. Effects of tensile reinforcement ratio and compressive strength on the behaviour of over-reinforced helically confined HSC beams. Constr. Build. Mater. 2007, 21, 269–276. [Google Scholar] [CrossRef]
- Elbasha, N.M.; Hadi, M.N. Effect of helical pitch and tensile reinforcement ratio on the concrete cover spalling off load and ductility of HSC beams. In Proceedings of the Australian Structural Engineering Conference 2005, Sydney, Australia, 11–14 September 2005; p. 538. [Google Scholar]
- Øverli, J.A.; Jensen, T.M. Increasing ductility in heavily reinforced LWAC structures. Eng. Struct. 2014, 62, 11–22. [Google Scholar]
- Alasadi, S.S.; AlKafaji, J.M.; Kheder, G.F. Flexural Behavior of Hybrid Reinforced Concrete Beams; Al-Mustansiriyiah University Republic of Iraq; Ministry of Higher Education & Scientific Research: Baghdad, Iraq, 2006.
- Su, R.; Siu, W.; Smith, S.T. Effects of bolt–plate arrangements on steel plate strengthened reinforced concrete beams. Eng. Struct. 2010, 32, 1769–1778. [Google Scholar]
- Siu, W.; Su, R. Effects of plastic hinges on partial interaction behaviour of bolted side-plated beams. J. Constr. Steel Res. 2010, 66, 622–633. [Google Scholar]
- Base, G. Helical reinforcement in the compression zone of concrete beams. Constr. Eng. 1962, 456–460. [Google Scholar]
- Base, G. Effectiveness of helical binding in the compression zone of concrete beams. J. Proc. 1965, 62, 763–782. [Google Scholar]
- Li, J.; Hadi, M. Behaviour of externally confined high-strength concrete columns under eccentric loading. Compos. Struct. 2003, 62, 145–153. [Google Scholar] [CrossRef]
- Hadi, M.N. Behaviour of high strength axially loaded concrete columns confined with helices. Constr. Build. Mater. 2005, 19, 135–140. [Google Scholar] [CrossRef]
- Hadi, M.N. Helically reinforced HSC beams reinforced with high strength steel. Int. J. Mater. Prod. Technol. 2005, 23, 138–148. [Google Scholar] [CrossRef]
- Jeffry, R.; Hadi, M.N.S. Improving the Ductility of Over-Reinforced HSC Beams Using Different Helix Diameters. In Proceedings of the 20th Australasian Conference on the Mechanics of Structures and Materials, Toowoomba, Australia, 2–5 December 2008; Aravinthan, T., Karunasena, W., Wang, H., Eds.; CRC Press: London, UK; pp. 457–462. [Google Scholar]
- Delalibera, R.G.; Giongo, J.S. Theoretical and numerical analysis of reinforced concrete beams with confinement reinforcement. Rev. Ibracon De Estrut. E Mater. 2008, 1, 17–30. [Google Scholar] [CrossRef] [Green Version]
- Qin, R.; Zhou, A.; Lau, D. Effect of reinforcement ratio on the flexural performance of hybrid FRP reinforced concrete beams. Compos. Part B Eng. 2017, 108, 200–209. [Google Scholar] [CrossRef]
- Swamy, R.; Jones, R.; Charif, A. The effect of external plate reinforcement on the strengthening of structurally damaged RC beams. Struct. Eng. 1989, 67, 45–56. [Google Scholar]
- Swamy, R.; Gaul, R. Repair and Strengthening of Concrete Members with Adhesive Bonded Plates; American Concrete Institute: Farmington Hills, MI, USA, 1996. [Google Scholar]
- Jones, R.; Swamy, R.; Charif, A. Plate separation and anchorage of reinforced concrete beams strengthened by epoxy-bonded steel plates. Struct. Eng. 1988, 66, 85–94. [Google Scholar]
- Oehlers, D.J.; Moran, J.P. Premature failure of externally plated reinforced concrete beams. J. Struct. Eng. 1990, 116, 978–995. [Google Scholar] [CrossRef]
- Oehlers, D.; Ali, M.M.; Luo, W. Upgrading continuous reinforced concrete beams by gluing steel plates to their tension faces. J. Struct. Eng. 1998, 124, 224–232. [Google Scholar] [CrossRef]
- Siu, W.; Su, R. Analysis of side-plated reinforced concrete beams with partial interaction. Comput. Concr. 2011, 8, 71–96. [Google Scholar] [CrossRef]
- Tee, H.H.; Al-Sanjery, K.; Chiang, J.C.L. Behaviour of over-reinforced concrete beams with double helix and double square confinements related to ultimate bending and shear strength. J. Phys. Sci. 2018, 29, 77–98. [Google Scholar]
- Nie, J.-G.; Hu, H.-S.; Fan, J.-S.; Tao, M.-X.; Li, S.-Y.; Liu, F.-J. Experimental study on seismic behavior of high-strength concrete filled double-steel-plate composite walls. J. Constr. Steel Res. 2013, 88, 206–219. [Google Scholar] [CrossRef]
- Rassouli, B.; Shafaei, S.; Ayazi, A.; Farahbod, F. Experimental and numerical study on steel-concrete composite shear wall using light-weight concrete. J. Constr. Steel Res. 2016, 126, 117–128. [Google Scholar] [CrossRef]
- Bsi, B. 8110-1: 1997, Structural Use of Concrete, Code of Practice for Design and Construction, Part 1; British Standard Institution: London, UK, 1997. [Google Scholar]
- Concrete Centre. Structural Use of Concrete; BS8110; British Standard Institution: London, UK, 1986. [Google Scholar]
- Bickford, J. Handbook of Bolts and Bolted Joints; CRC Press: New York, NY, USA, 1998. [Google Scholar]
- American Concrete Institute. Building Code Requirements for Reinforced Concrete (ACI 318M-89) and Commentary-ACI 318RM-89; American Concrete Institute: Farmington Hills, MI, USA, 1990. [Google Scholar]
- CSA. Design and Construction of Building Structures with Fibre-Reinforced Polymers; CSA: Mississauga, ON, Canada, 2012. [Google Scholar]
- Al Zand, A.W.; Badaruzzaman, W.H.W.; Mutalib, A.A.; Hilo, S.J. The enhanced performance of CFST beams using different strengthening schemes involving unidirectional CFRP sheets: An experimental study. Eng. Struct. 2016, 128, 184–198. [Google Scholar] [CrossRef]
- Arivalagan, K.; Kandasamy, K. Energy absorption capacity of composite beams. J. Eng. Sci. Technol. Rev. 2009, 2, 145–150. [Google Scholar] [CrossRef]
- Pugnaire, F.; Valladares, F. Functional Plant Ecology; CRC Press: Boca Raton, FL, USA, 2007. [Google Scholar]
- Wang, H.; Belarbi, A. Ductility characteristics of fiber-reinforced-concrete beams reinforced with FRP rebars. Constr. Build. Mater. 2011, 25, 2391–2401. [Google Scholar] [CrossRef]
- Ho, J.; Lam, J.; Kwan, A. Flexural ductility and deformability of concrete beams incorporating high-performance materials. Struct. Des. Tall Spec. Build. 2012, 21, 114–132. [Google Scholar] [CrossRef]
- Duthinh, D.; Starnes, M. Strength and ductility of concrete beams reinforced with carbon fiber-reinforced polymer plates and steel. J. Compos. Constr. 2004, 8, 59–69. [Google Scholar] [CrossRef]
- Park, R. Ductility evaluation from laboratory and analytical testing. In Proceedings of the 9th world Conference on Earthquake Engineering, Tokyo-Kyoto, Japan, 2–9 August 1988; pp. 605–616. [Google Scholar]
- Aziz, A.H.; Kareem, S.S.; Ban Sahib, A. Experimental study for punching shear behavior in RC flat plate with hybrid high strength concrete. J. Eng. Dev. 2013, 17, 105–119. [Google Scholar]
- European Committee for Standardization. Final Draft of Euro Code 8: Design of Structures for Earthquake Resistance Part 1: General Rules, Seismic Actions and Rules for Buildings; European Committee for Standardization: Brussels, Belgium, 1988. [Google Scholar]
- Baran, E.; Arsava, T. Flexural strength design criteria for concrete beams reinforced with high-strength steel strands. Adv. Struct. Eng. 2012, 15, 1781–1792. [Google Scholar] [CrossRef]
Figure 1.
Detailing of all the over-reinforced beam specimens (a) control beam (CB) and (b) bolts compression steel plates the (BCSP-6), BCSP-10, and BCSP-15 beam (all dimensions in mm).
Figure 1.
Detailing of all the over-reinforced beam specimens (a) control beam (CB) and (b) bolts compression steel plates the (BCSP-6), BCSP-10, and BCSP-15 beam (all dimensions in mm).

Figure 2.
Details of the reinforcement for the over-reinforced specimens (all dimensions in mm).

Figure 3.
Mold with reinforcement and location of steel-plate.

Figure 4.
Casting the over-reinforced beam and after one day of the cast and location of bolts.
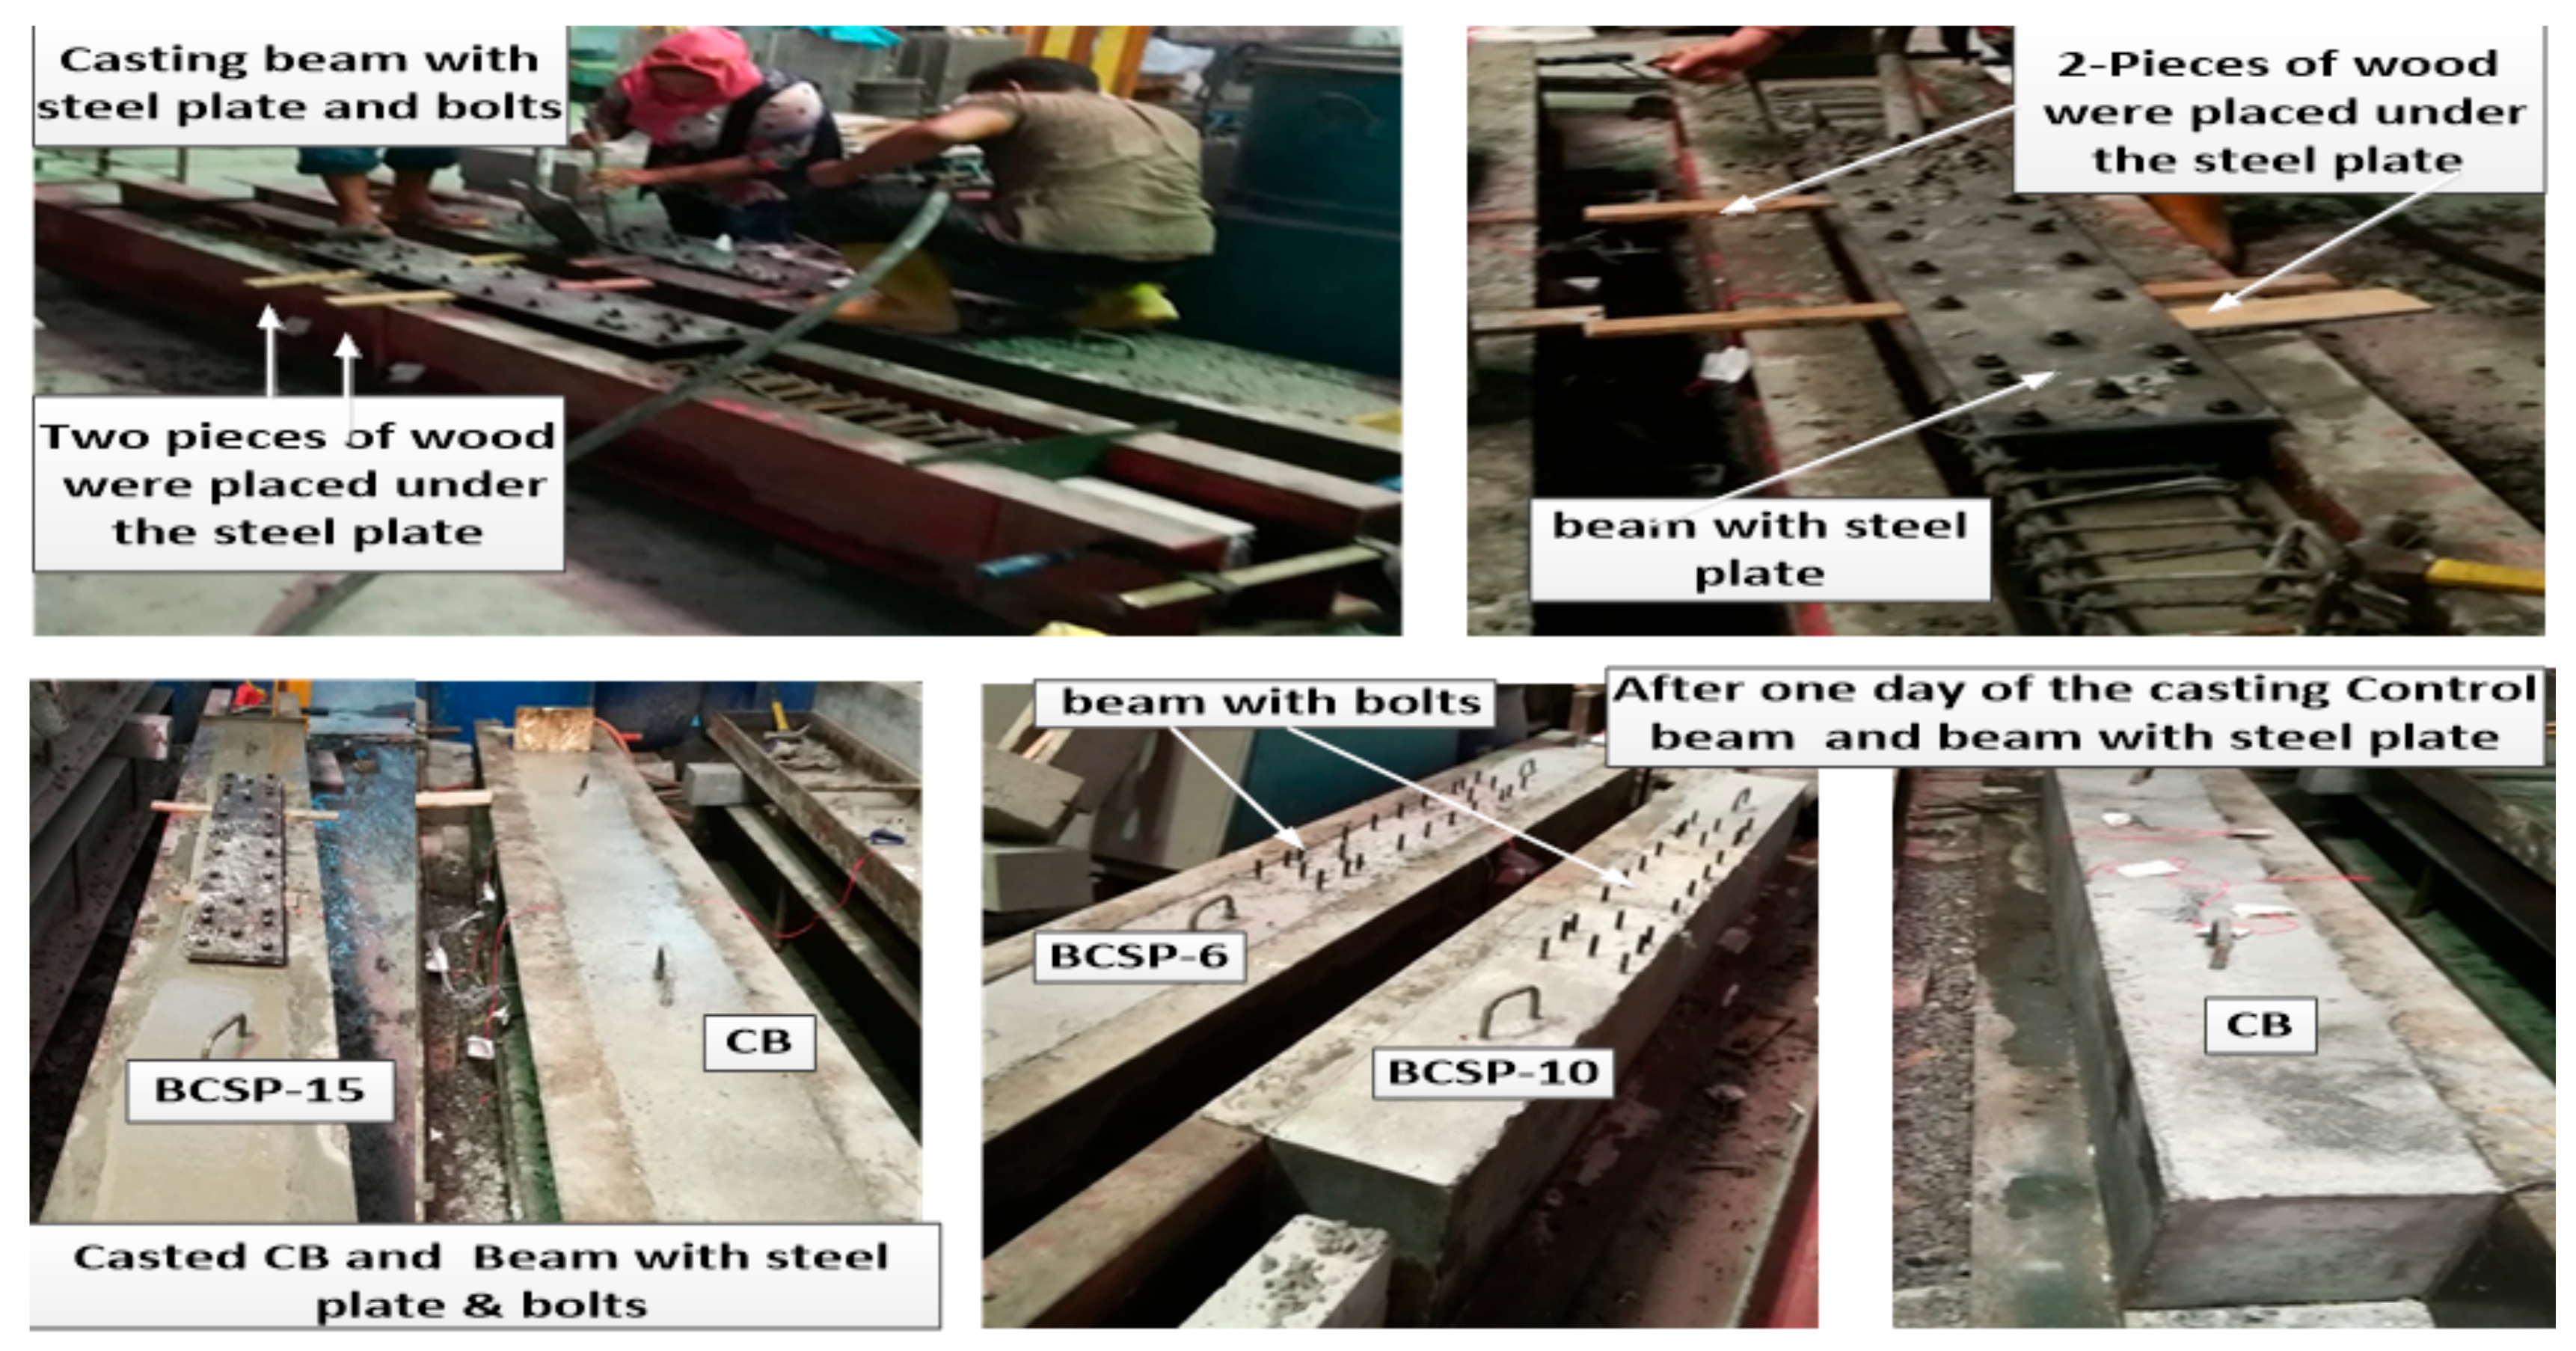
Figure 5.
View of (a) curing for all specimens and (b) all the over-reinforced beam specimens.

Figure 6.
(a) Schematic of the test-setup for over-reinforced beam specimens and (b) experimental for the BCSP beams test-setup.
Figure 6.
(a) Schematic of the test-setup for over-reinforced beam specimens and (b) experimental for the BCSP beams test-setup.

Figure 7.
Modes of failure and crack patterns of all the over-reinforced specimens.


Figure 8.
Modes of failure and crack patterns of all the CB, BCSP-6, BCSP-10, and BCSP-15 beam specimens at 80% peak load.
Figure 8.
Modes of failure and crack patterns of all the CB, BCSP-6, BCSP-10, and BCSP-15 beam specimens at 80% peak load.

Figure 9.
Load–strain relationships for all the over-reinforced beam specimens’ strains up until failure.
Figure 9.
Load–strain relationships for all the over-reinforced beam specimens’ strains up until failure.

Figure 10.
Location varies of load–displacement curves for all the over-reinforced beam specimens.

Figure 11.
Maximum width of flexural crack for all the over-reinforced beam specimens.

Figure 12.
Typical load-displacement curves for evaluating the energy absorbed (EA) for all the over-reinforced beam specimens.
Figure 12.
Typical load-displacement curves for evaluating the energy absorbed (EA) for all the over-reinforced beam specimens.

Figure 13.
Energy absorption (EA) capacity for all the over-reinforced beam specimens.

Figure 14.
Flexural stiffness (K0.3Ppeak, Kspall, Kyield, and KPpeak) of all the over-reinforced beam specimens.
Figure 14.
Flexural stiffness (K0.3Ppeak, Kspall, Kyield, and KPpeak) of all the over-reinforced beam specimens.

Figure 15.
Modes of failure and crack patterns of over-reinforced beams with helical reinforcements (beam 5) [7].
Figure 15.
Modes of failure and crack patterns of over-reinforced beams with helical reinforcements (beam 5) [7].

Figure 16.
Modes of failure and crack patterns of over-reinforced beams with stirrups (3B) and fiber + stirrups (4B) [9].
Figure 16.
Modes of failure and crack patterns of over-reinforced beams with stirrups (3B) and fiber + stirrups (4B) [9].

Figure 17.
Modes of failure and crack patterns of over-reinforced beams with a side-steel plate (a) SBSP and (b) SBWP [12].
Figure 17.
Modes of failure and crack patterns of over-reinforced beams with a side-steel plate (a) SBSP and (b) SBWP [12].


Table 1.
Detailing of the over-reinforced beam specimens.
| Specimen Designation | Reinforcement | Steel Plate (mm) | No. of Bolts | ρ% | ρb% | Shear Span Ratio (a/d) | Stirrup Spacing (mm) 6Ø (c/c) | ||
|---|---|---|---|---|---|---|---|---|---|
| Ten. | Com. | t | L | ||||||
| CB | 5Ø20 | 2Ø6 | - | - | - | 3.27 | 2.856 | 2.7 | 50 |
| BCSP-6 | 5Ø20 | 2Ø6 | 6 | 1100 | 24 | 3.27 | 2.856 | 2.7 | 50 |
| BCSP-10 | 5Ø20 | 2Ø6 | 10 | 1100 | 24 | 3.27 | 2.856 | 2.7 | 50 |
| BCSP-15 | 5Ø20 | 2Ø6 | 15 | 1100 | 24 | 3.27 | 2.856 | 2.7 | 50 |
Table 2.
Concrete mix proportions by weight (kg/m3).
| Cement (kg) | Fine Aggregate | Coarse Aggregate | Water (kg) | W/C (%) |
|---|---|---|---|---|
| 375 | 888 | 933 | 150 | 0.4 |
Table 3.
Measured values of the type loads of all the over-reinforced specimens.
| Specimens Designation | Pcr (kN) | Δ (mm) | Pcr of Web Shear (kN) | PSpall (kN) | PYieldl (kN) | Δspall (mm) | ΔYield (mm) | PPeak (kN) | Δpeak (mm) |
|---|---|---|---|---|---|---|---|---|---|
| CB | 71.5 | 1.87 | 220 | 356 | - | 8.33 | - | 375.5 | 10.8 |
| BCSP-6 | 247 | 3.48 | 322 | 521 | - | 8.2 | - | 652.3 | 11.7 |
| BCSP-10 | 362 | 3.73 | 722 | 635 | - | 6.9 | - | 837.6 | 12.5 |
| BCSP-15 | 460 | 3.99 | 833 | - | 935.3 | - | 10.2 | 935.3 | 15.5 |
Table 4.
Experimental and predicted nominal loads and the type of failures of the tested.
| Specimens Designation | PSpall (kN) | PYield (kN) | Panaly (kN) | Panaly/PSpall (%) | Panaly/PYield (%) | Failure Mode |
|---|---|---|---|---|---|---|
| CB | 356 | - | 354 | 0.98 | - | crushing, brittle failure |
| BCSP-6 | 521 | - | 514 | 0.98 | - | spalling under two loading point(compression-shear) and yield of steel plate |
| BCSP-10 | 635 | - | 637 | 1.00 | - | spalling under two loading point and yield of steel plate |
| BCSP-15 | - | 935.3 | 850 | - | 0.90 | flexural and yield of steel plate (No spalling of the concrete) |
Table 5.
Energy absorption and ultimate strength increase for results of the tested all the over-reinforced specimens.
Table 5.
Energy absorption and ultimate strength increase for results of the tested all the over-reinforced specimens.
| Specimens Designation | EA (kN.m) | Ppeak (kN) | Increase in EA (%) | Increase in Strength (%) |
|---|---|---|---|---|
| CB | 4.03 | 375 | - | - |
| BCSP-6 | 13.9 | 652.3 | 247.5 | 73.9 |
| BCSP-10 | 16.7 | 837.6 | 317.5 | 123.6 |
| BCSP-15 | 22.5 | 935.3 | 462.5 | 149.3 |
Table 6.
Test results of over-reinforced beams for index displacement ductility (µ1).
| Specimens Designation | PSpall (kN) | PYield (kN) | Peak (kN) | Ppeak/Pspall | Ppeak/PYield | Δspall (mm) | ΔYield (mm) | Δpeak (mm) | µ1 = Δpeak/Δspall | µ1 = Δpeak/ΔYield |
|---|---|---|---|---|---|---|---|---|---|---|
| CB | 356 | - | 375 | 1.0 | - | 8.33 | - | 10.8 | 1.3 | - |
| BCSP-6 | 521 | - | 652.3 | 1.01 | - | 8.2 | - | 11.7 | 1.43 | - |
| BCSP-10 | 635 | - | 837.6 | 1.1 | - | 6.9 | - | 12.53 | 1.81 | - |
| BCSP-15 | - | 935.3 | 935.3 | - | 1 | - | 10.2 | 15.5 | - | 1.52 |
Table 7.
Test results of over-reinforced beams for index displacement ductility (µ2).
| Specimens Designation | PSpall (kN) | PYieldl (kN) | Peak (kN) | ΔYield (mm) | Δpeak (mm) | Δ0.9spall (mm) | Δ0.9Yield (mm) | µ2 = Δ0.9, spall/Δspall | µ2 = Δ0.9, spall/ΔYield |
|---|---|---|---|---|---|---|---|---|---|
| CB | 356 | - | 375 | - | 14.94 | - | - | - | - |
| BCSP-6 | 521 | - | 652.3 | - | 16.4 | 22.1 | - | 2.7 | - |
| BCSP-10 | 635 | - | 837.6 | - | 11.93 | 19.2 | - | 2.9 | - |
| BCSP-15 | - | 935.3 | 935.3 | 10.2 | 15.5 | - | 22.1 | - | 2.2 |
Table 8.
Stiffness flexural for results of the tested all the over-reinforced specimens.
| Specimens Designation | K0.3Ppeak (kN/mm) | Kspall (kN/mm) | Kyield (kN/mm) | Kse1 (kN/mm) | KPpeak (kN/mm) | Kse2 (kN/mm) |
|---|---|---|---|---|---|---|
| CB | 45.0 | 42.73 | - | 41.8 | 34.7 | 7.7 |
| BCSP-6 | 78.2 | 63.53 | - | 57.1 | 55.75 | 37.51 |
| BCSP-10 | 83.7 | 92.02 | - | 98.4 | 67.01 | 36.18 |
| BCSP-15 | 100.2 | - | 91.7 | 88.6 | 60.34 | - |
Table 9.
Increased stiffness flexural for results of the test all the over-reinforced specimens.
| Specimens Designation | Increase in K0.3Ppeak (%) | Increase in Kspall (%) | Increase in Kyield (%) | Increase in KPpeak (%) |
|---|---|---|---|---|
| CB | - | - | - | - |
| BCSP-6 | 73.7 | 48.7 | - | 60.6 |
| BCSP-10 | 86 | 115.5 | - | 93.1 |
| BCSP-15 | 122.7 | - | 114.8 | 73.8 |
© 2020 by the authors. Licensee MDPI, Basel, Switzerland. This article is an open access article distributed under the terms and conditions of the Creative Commons Attribution (CC BY) license (http://creativecommons.org/licenses/by/4.0/).
Share and Cite
MDPI and ACS Style
Alasadi, S.; Shafigh, P.; Ibrahim, Z. Experimental Study on the Flexural Behavior of over Reinforced Concrete Beams Bolted with Compression Steel Plate: Part I. Appl. Sci. 2020, 10, 822. https://doi.org/10.3390/app10030822
AMA Style
Alasadi S, Shafigh P, Ibrahim Z. Experimental Study on the Flexural Behavior of over Reinforced Concrete Beams Bolted with Compression Steel Plate: Part I. Applied Sciences. 2020; 10(3):822. https://doi.org/10.3390/app10030822
Chicago/Turabian StyleAlasadi, Shatha, Payam Shafigh, and Zainah Ibrahim. 2020. "Experimental Study on the Flexural Behavior of over Reinforced Concrete Beams Bolted with Compression Steel Plate: Part I" Applied Sciences 10, no. 3: 822. https://doi.org/10.3390/app10030822
Note that from the first issue of 2016, this journal uses article numbers instead of page numbers. See further details here.