Article

Numerical Investigation of the Effects of Prosthetic Aortic Valve Design on Aortic Hemodynamic Characteristics

1
School of Energy and Power Engineering, Xi’an Jiaotong University, Xi’an 710049, China
2
School of Sciences, Xi’an University of Technology, Xi’an 710054, China
3
School of Mechanical Engineering, Xi’an Shiyou University, Xi’an 710065, China
4
School of Mechanical and Aerospace Engineering, Nanyang Technological University, Singapore 639798, Singapore
5
Department of Chemical and Materials Engineering, National University of Kaohsiung, No. 700, Kaohsiung University Rd., Nan-Tzu District, Kaohsiung 811, Taiwan
*
Authors to whom correspondence should be addressed.
Appl. Sci. 2020, 10(4), 1396; https://doi.org/10.3390/app10041396
Submission received: 26 December 2019 / Revised: 7 February 2020 / Accepted: 14 February 2020 / Published: 19 February 2020
(This article belongs to the Special Issue Intelligent System Innovation)

Abstract

:
The superior performance of single-point attached commissures (SPAC) molded valve design has been validated by several numerical, in vitro and in vivo animal studies. However, the impacts of the SPAC molded valve design on aortic hemodynamic environments are yet to be investigated. In this study, multiscale computational models were prepared by virtually implanting prosthetic aortic valves with SPAC tubular, SPAC molded and conventional designs into a patient-specific aorta, respectively. The impacts of the valve designs on efferent flow distribution, flow pattern and hemodynamic characteristics in the aorta were numerically investigated. The results showed that despite the overall flow phenomena being similar, the SPAC tubular valve exhibited a suboptimal performance in terms of higher spatially averaged wall shear stress (SAWSS) in ascending aorta (AAo), higher helix grade, stronger secondary flow mean secondary velocity in descending aorta, as well as more complex vortex distribution. The results from the current study extend the understanding of hemodynamic impacts of the valve designs, which would further benefit the optimization of the prosthetic aortic valve.

1. Introduction

Aortic valve diseases are estimated to affect more than 12 million people globally, and surgical aortic valve replacement (SAVR) is one of the primary management strategies among patients with severe conditions [1,2,3]. More than 200,000 SAVRs are performed annually worldwide [4].
The stentless bioprosthetic aortic valves have been widely used in SAVR, which are not only advanced in terms of being free of anticoagulation after implantation, but also exhibit superior hemodynamics performances comparable to the native aortic valve [5,6]. However, the implantation of stentless valves is technically more difficult [7]. Therefore, a stentless aortic valve prosthesis with an easy implantation technique is of great interest.
The single-point attached commissure (SPAC) implantation technique, which sutures the commissure to the aortic wall at the level of the sinotubular junction (STJ) at only three single points and the base of the valve to the aortic root, greatly improved the efficiency of clinical implantation procedures [8]. The early generation of the SPAC technique was incorporated with simple tubular leaflet geometric design [9]. Based on this, Goetz et al. developed a novel SPAC molded prosthetic valve design [10], which incorporated the molded leaflet design from Duran et al. [11]. The leaflet of the molded valve mimics the three-dimensional (3D) geometry of the native valve. Previous numerical, in vitro and in vivo animal studies have shown that the SPAC molded valve design has superior performance in terms of the structural dynamics, local hemodynamics and stress distribution [10,12,13].
In addition to the valve performance, the aortic valve design also affects aortic hemodynamic characteristics. As a major artery that distributes the oxygenated blood to the circulatory system, the hemodynamic environment in the aorta have been reported to play critical roles in the maintaining of its health as well as functionality [14]. One of the most representative characteristics of the physiological aortic flow is the helical flow, which has been observed in several in silico, in vitro and in vivo studies [14,15,16,17]. Among the healthy subjects, the presence of helical flow has been associated with optimized fluid transportation as well as the atheroprotective function of the arteries [14,18]. However, several studies demonstrated that pathological conditions of the aortic valve, including bicuspid valves, SAVR and transcatheter aortic valve replacement (TAVR), could result in aberrant helical flow, eccentric flow impingement and subsequently alter the wall shear stress (WSS) distribution in the aorta [17,19,20,21,22,23,24]. Such changes in local flow environments have been identified as the major risk factors of platelet activation, valvular thrombosis aortic wall remodeling, aortic dissection, and aortic dilation [25,26].
Despite the fact that the hemodynamic impacts of several mechanical and bioprosthetic valves on aortic flow have been reported, the influences of the SPAC valve designs on the flow in aorta are still unclear. In light of this, a series of computational fluid dynamics (CFD) simulations were conducted in this pilot study to elucidate the influence of the SPAC molded design on the aortic hemodynamic environments. The flow pattern, WSS distribution, flow helicity and vorticity were compared between SPAC tubular, SPAC molded and conventional valves.

2. Materials and Methods

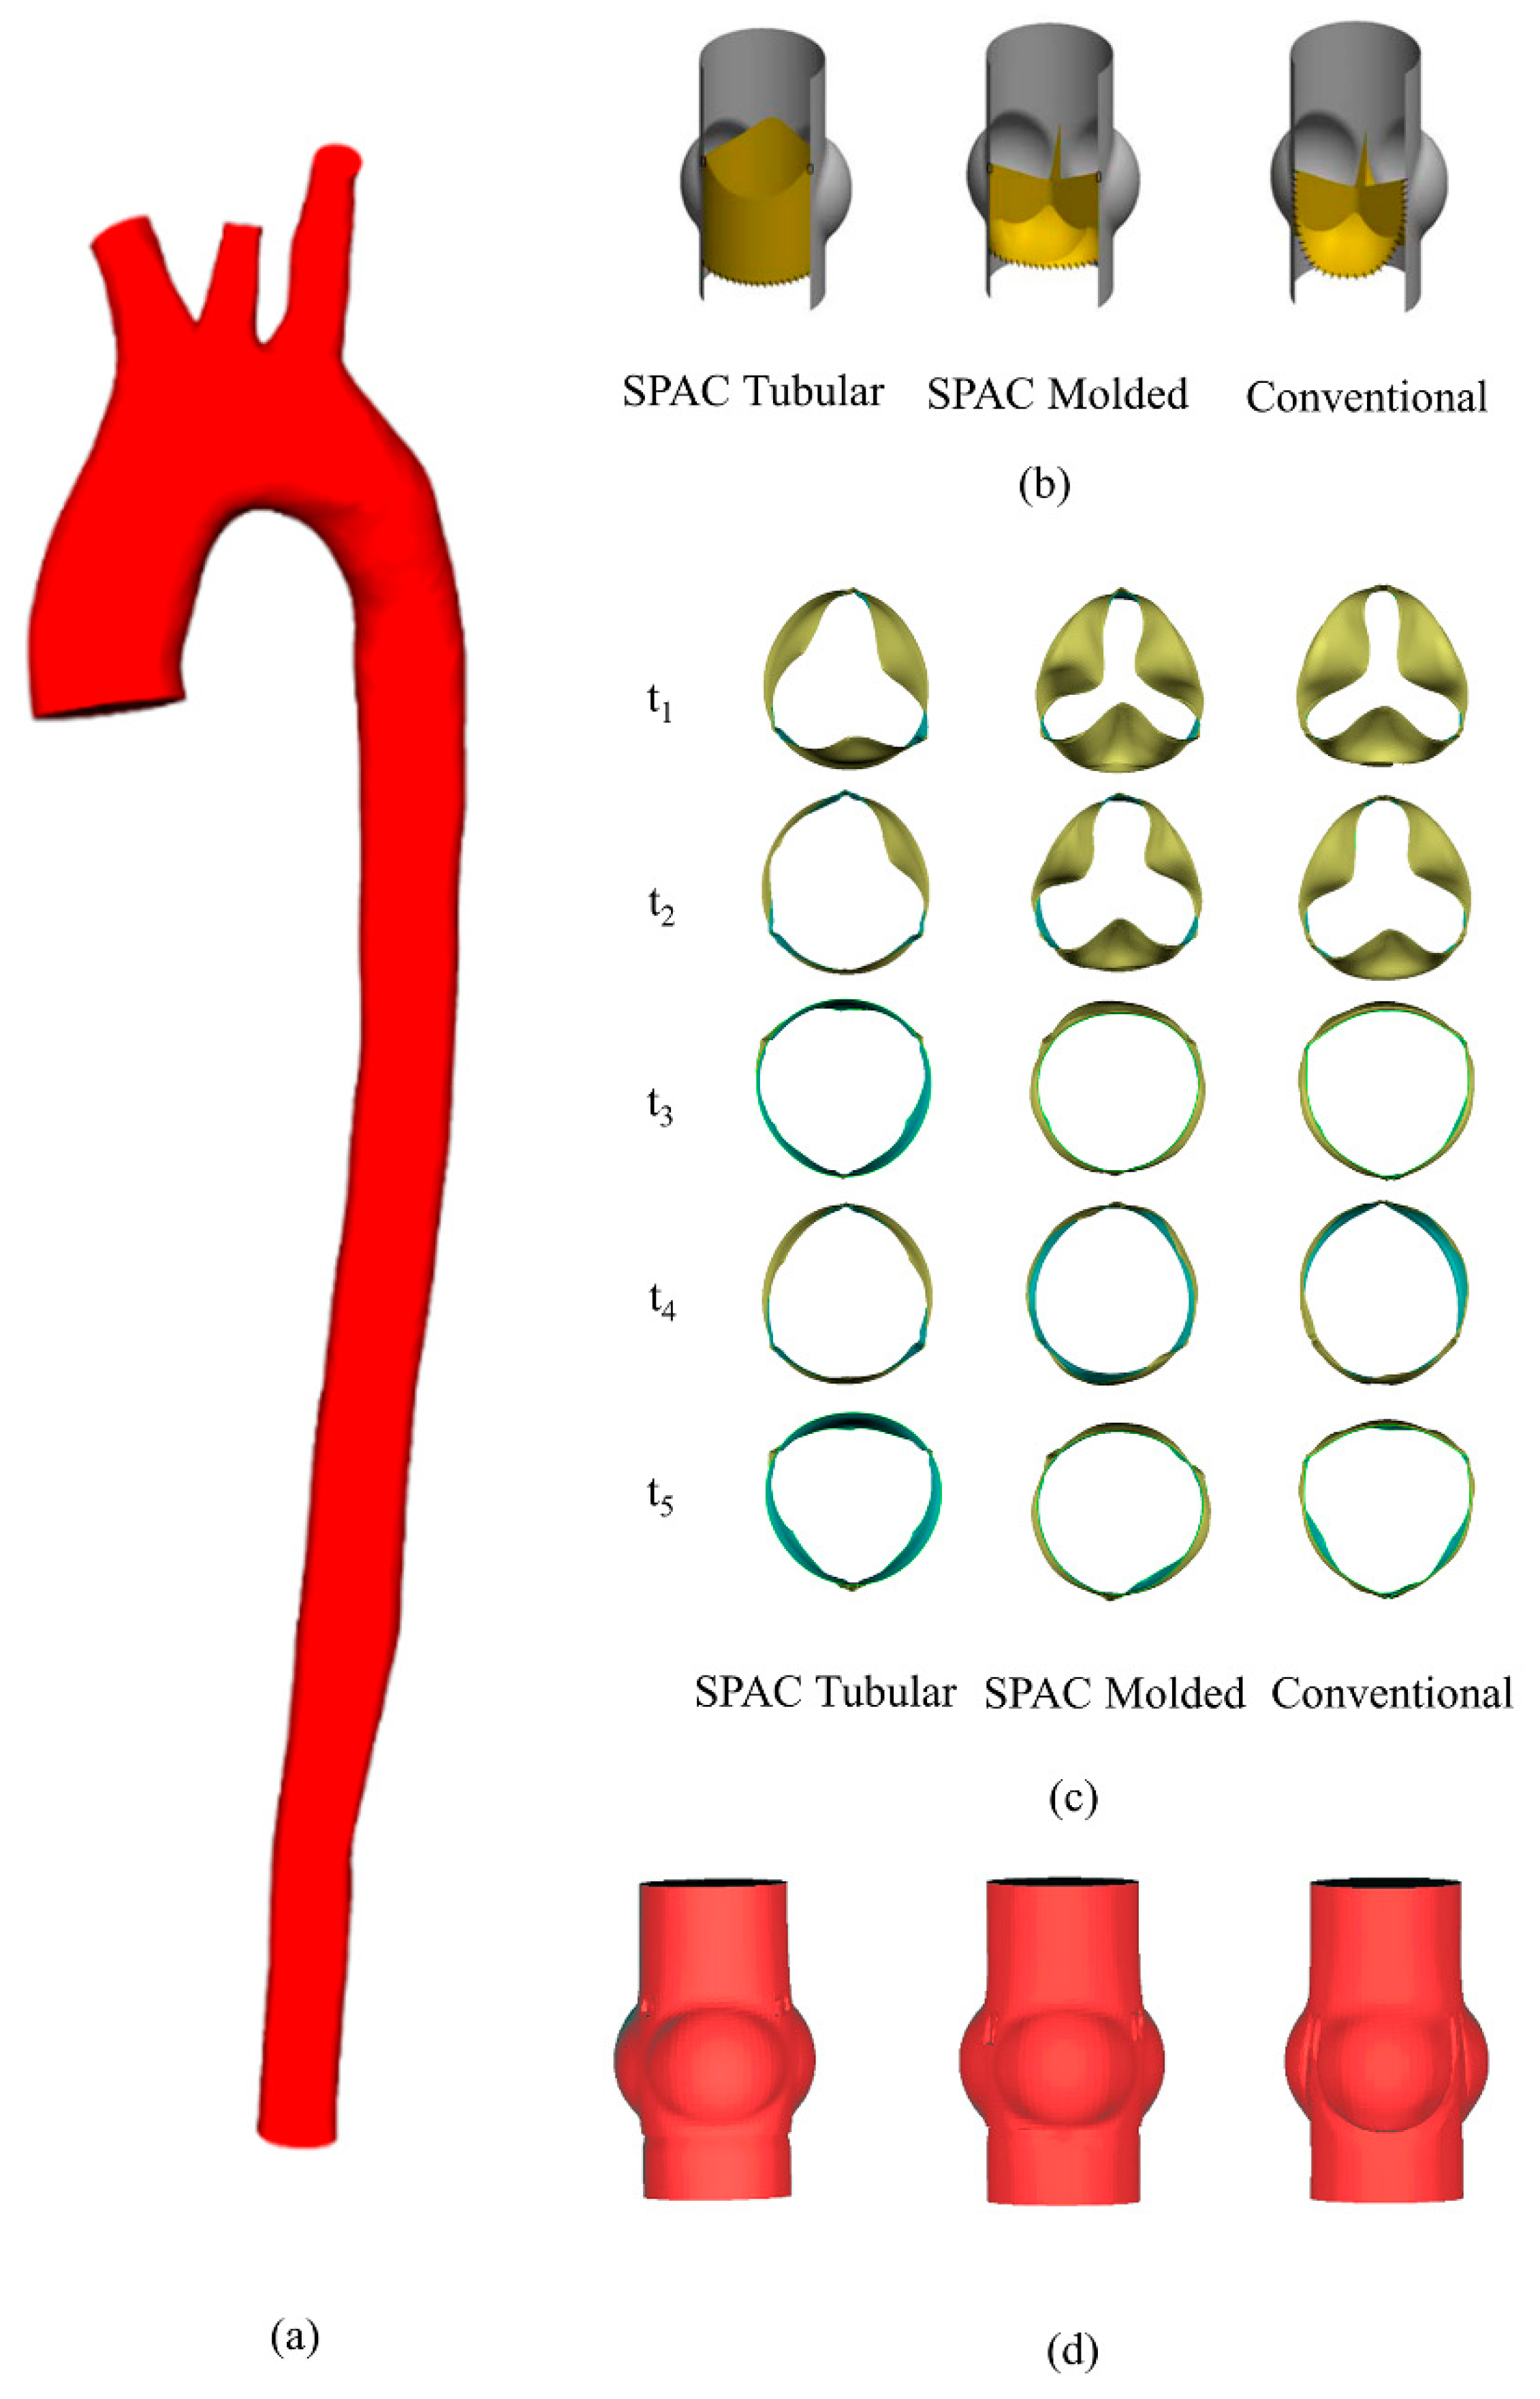
2.1. Geometric Modeling

2.1.1. Patient-Specific Aorta Model

A patient-specific aorta model was reconstructed from a chest multi-slice computed tomography (CT) image set by using MIMICS software (Materialise, Leuven, Belgium). The scanning was performed on a 16-detector CT with the following parameters: 0.5 mm slice thickness, 120 kV tube voltage and 400 mA tube current. The reconstructed three-dimensional (3D) aorta model included ascending aorta (AAo), aortic arch, descending aorta (DAo), abdominal aorta, brachiocephalic artery (BA), left common carotid artery (LCCA) and left subclavical artery (LSA) (Figure 1a). The diameter of the aorta at the proximal end, the top of the aortic arch and the distal end were 25 mm, 26.7 mm and 17 mm, respectively. The diameters of BA, LCCA and LSA at the distal ends were 13.2 mm, 7.5 mm and 8.7 mm, respectively.

2.1.2. Valve Geometry

Figure 1b illustrated the implant approaches as well as leaflet designs of the SPAC tubular prosthesis, SPAC molded prosthesis and conventional prosthesis. Among these, the leaflets of the SPAC tubular valve followed the geometry of a cylinder at the fully open configuration; the leaflets of conventional valve leaflet followed the design of Thubrikar et al. [27]; The SPAC molded valve shared similar geometric characteristics with the conventional valve, whereas the gaps between leaflets were merged for the feasibility of the SPAC technique.
The structural deformations of all the three valve designs were analyzed under time-varying physiological pressure loading over a full cardiac cycle by using non-linear finite element code ABAQUS (ABAQUS, Inc., Pawtucket, RI, USA) [12]. Compared with the SPAC molded valve and the conventional valve, the SPAC tubular valve exhibited a faster opening in the early acceleration stage of systole as well as a smaller maximum effective orifice area (EOA) at the acceleration peak. These morphological differences of valves within a cardiac cycle could result in altered local and downstream hemodynamic characteristics. Thus, the deformed leaflet configurations of the three valve designs at early acceleration (t1: 0.067 s and t2: 0.068 s), mid acceleration (t3: 0.085 s), acceleration peak (t4: 0.090 s) and mid-deceleration (t5: 0.218 s) were derived from finite element method (FEM) analyses (Figure 1c) and virtually implanted into the aortic root under the supervision of an experienced cardiac surgeon (Figure 1d), respectively. For the conventional valve, the scalloped leaflet attachment line was sutured to the aortic root. For both of the SPAC valves, only three single points were sutured to the aorta at the STJ level as well as suturing the valve base to the aorta annular level. After the virtual implantation, the aortic roots were connected to the aorta model by using SolidWorks software (Dassault Systems S.A., Paris, France). Finally, 15 models were prepared for the numerical simulation.

2.2. Numerical Methods

The open-source CFD package SimVascular (http://simvascular.github.io/) was used as the pre-processor and solver in this study. Blood was assumed as an incompressible Newtonian fluid. The density and dynamic viscosity of the blood were set to 1060 kg/m3 and 0.004 Pa·s, respectively. The arterial wall was assumed as the non-slip rigid wall. The 3D flow domain was governed by steady-state Navier–Stokes (N–S) equations (Equations (1) and (2)).
ρ ( V · V ) =   p + μ 2 V  
· V   =   0
The volumetric flow rates derived from the time-varying physiological profile (Figure 2) at the five time points were specified on the proximal end of the aortic root, which was mapped onto the inlet plane by using a plug velocity profile [28]. The specific flow rates at t1 to t5 were 32 mL/s, 36 mL/s, 204 mL/s, 350 mL/s and 154 mL/s, respectively.
At the outlets, the resistance of distal vascular systems was considered by coupling 0D lumped parameter models (LPMs) with the 3D aorta model at the efferent arteries. As illustrated in Figure 3, the R1, R2, R3, R4 represent the resistance of vascular systems distal to the BA, LCCA, LSA and descending aorta (DAo), respectively. The specific values of resistances were calculated according to Murry’s law [28]. The compliance components of the 0D models were neglected due to the simulations being conducted under steady flow.
In the coupling scheme, the 0D LPMs with resistance elements were coupled with the 3D model at the outlet boundaries, including the outlets of descending aorta (DAo), BA, LCCA and LSA. A “tight coupling” algorithm [29,30,31] was used to transfer the data at the coupling interfaces. At the beginning of the coupling, an initial pressure is applied as the initial condition. Afterward, the area-averaged flow rate at the coupling interface of the 3D CFD model is computed and sent to the LPM to calculate the corresponding cross-sectional static pressure for the next iteration until the convergence is reached for the current time step.
All the models were discretized by using unstructured 4-node tetrahedral elements with three layers of prism boundary layer. Mesh independence analyses were conducted on the conventional valve model at t4 with eight different element numbers (Table 1).
The comparison showed that the differences in flow rates at efferent ends as well as spatially averaged WSS (SAWSS) on ascending aorta were smaller than 2% between cases 7 and 8. Thus, the element number of 34.5 million was adopted in the discretization of all the models. The y+ < 2 was achieved by adjusting the initial thickness as well as the growth rate of the boundary layer at this mesh setting, which is capable of capturing the near-wall flow features.

2.3. Data Analysis

The simulation results were post-processed in ParaView software (Kitware, Inc., Clifton Park, NY, USA). The flow fields of the studied cases were visualized by using streamline, and the volumetric efferent flow rates at BA, LCCA, LSA and DAo were calculated. In addition, the following critical hemodynamic characteristics associated with aortic lesions were compared.
WSS: the WSS, a frictional force on the arterial wall exerted by the blood flow, was calculated from Equation (3):
τ w   =   μ ( u y ) y   =   0    
where τ w is the WSS, μ is the dynamic viscosity, u is the velocity and y is the distance to the wall.
Helix: the helix quantitatively describes the rotation degree of helical flow along the longitudinal axis of an arterial segment in a grading scale of 1 to 3, which represents rotation degree less than 180°, greater than 180° and greater than 360°, respectively [32].
Mean secondary velocity: the secondary flow strength in the ascending aorta, aortic arch and descending aorta (slice 1 to 5 in Figure 3) were quantitatively analyzed by using mean secondary velocity, which is defined as the ratio of the cross-sectional mean of the secondary velocities to the cross-sectional mean of the axial velocities at each slice [33].
Q-criterion: to compare the strength of vortex quantitatively, the Q-criterion was introduced [34]. It defines the vortex as the second invariant of the velocity gradient tensor in the flow field with a positive value, which is expressed as Equation (4):
Q   =   1 2 ( | | Ω | | 2 | | S | | 2 )  
where | | Ω | | 2 represents the vorticity magnitude, and | | S | | 2 denotes the strain-rate magnitude.

3. Results

3.1. The Impacts of Valve Designs on the Efferent Flow

Figure 4 shows the efferent flow rates of BA, LCCA, LSA and DAo at each time point. The maximum percentage difference in efferent flow rates among the three designs is less than 2%.

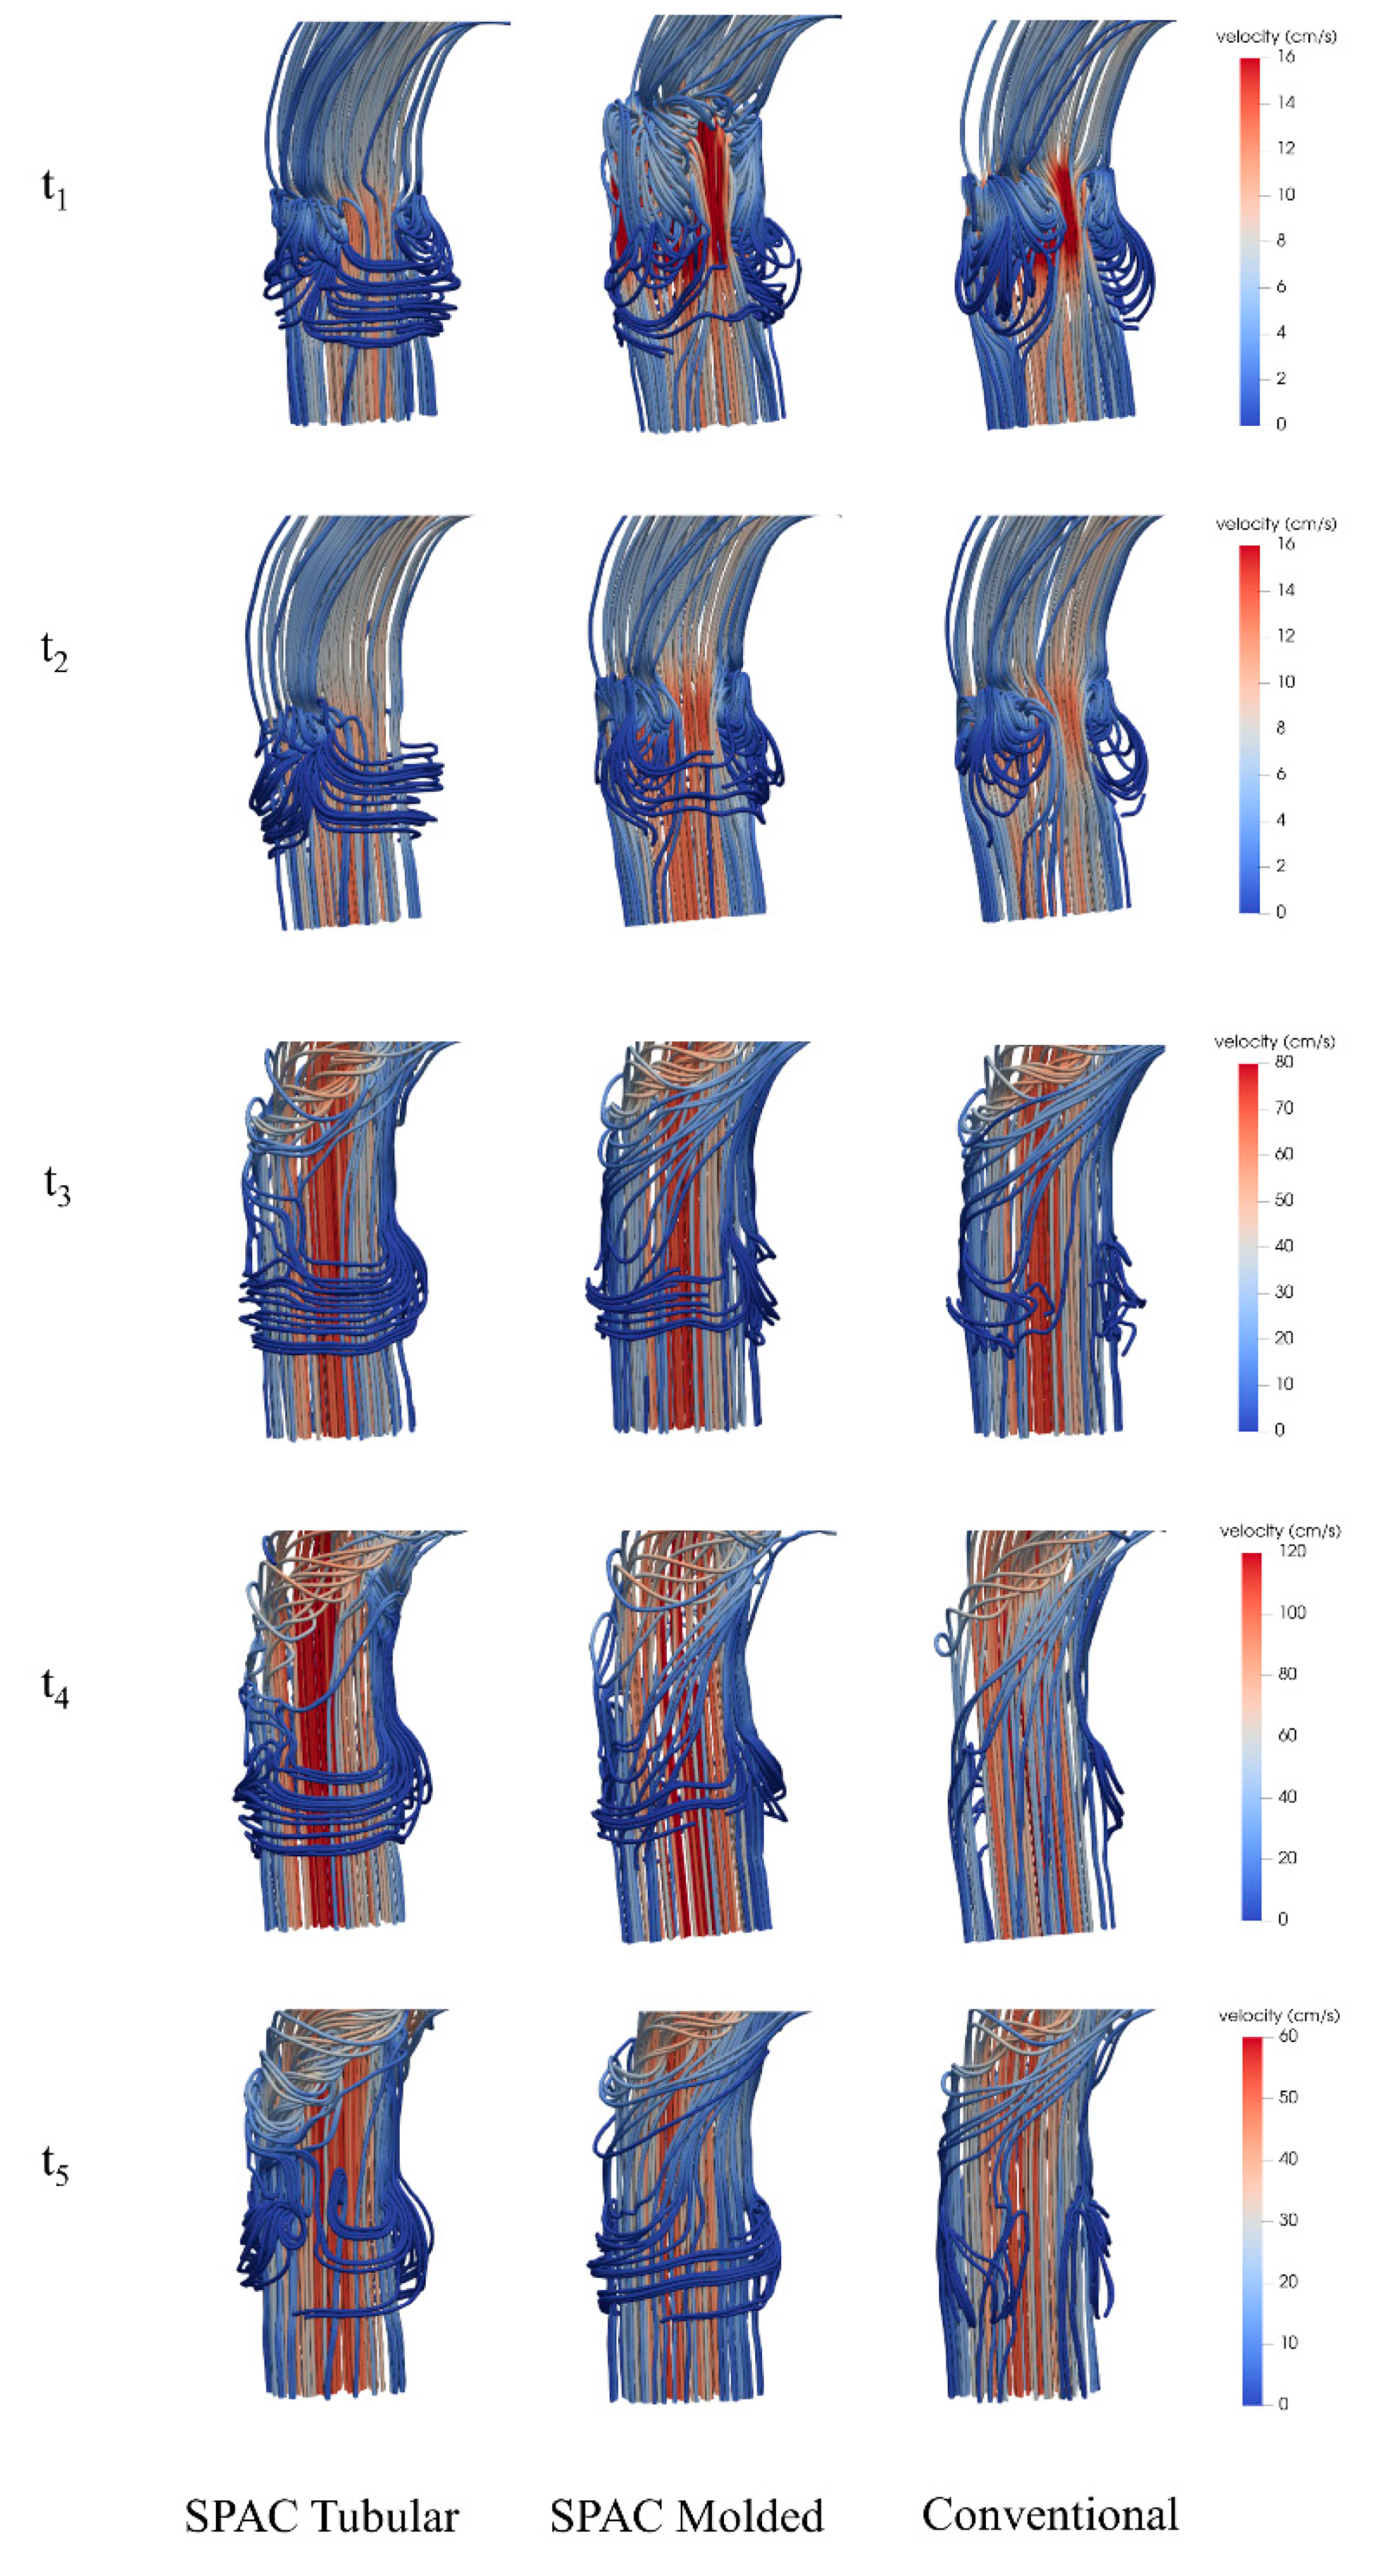
3.2. The Impacts of Valve Designs on the Flow Pattern

In the aorta, identical flow patterns were observed among the three models (Figure 5). During the early acceleration phase (t1 to t2), fairly organized flows dominated the entire aorta in all cases. With the increasing of flow velocity, obvious right-handed helical flows started to appear in the immediate vicinity of the valves at t3. The helix at the acceleration peak (t4) in the ascending aorta was 1.2, 1.4 and 1.2 for SPAC molded valve, SPAC tubular valve and conventional valve, respectively.
Figure 6 further illustrated the detailed streamline in the aortic root with different valve designs at the three time points. Due to the interconnected sinus of Valsalva, unique circumferential flows were observed in the aortic root of both SPAC valves.
The averaged jet velocity (Vmean) and maximum jet velocity (Vmax) in the plane that was 10 mm downstream of the commissure level (slice 1) of all cases are listed in Table 2. Because of the faster opening, the SPAC tubular valve exhibited a lower Vmean as well as Vmax than that of the other two designs at the early acceleration phase. On the contrary, the SPAC molded and conventional design showed lower Vmean and Vmax at acceleration peak (t4) compare with the SPAC tubular design, which is due to the larger maximum EOAs.
The velocity distributions in slice 1 at t1 to t5 were illustrated in Figure 7. None of the three cases showed an eccentric flow pattern.

3.3. The Impacts of Valve Designs on Hemodynamic Characteristics

3.3.1. Wall Shear Stress (WSS)

The WSS distributions on the entire aorta of each case are illustrated in Figure 8. All the cases showed similar WSS distribution patterns at corresponding time points.
The specific values of SAWSS and low WSS areas on the entire aorta are listed in Table 3. Increased SAWSS as well as decreased low WSS area were observed in all three cases during the acceleration phase. The low WSS areas (<0.4 Pa) [35] on the aorta with SPAC tubular and SPAC molded designs was 64.29% and 16.39% smaller than that with the conventional at acceleration peak (t4), respectively.
Table 4 further lists the SAWSS magnitudes of all the cases on different segments of the aorta at the acceleration peak (t4). On the AAo segment, the SAWSS of SPAC tubular valve case is 20.24% and 29.63% higher than that of the SPAC molded valve and conventional valve, respectively. In contrast, the percentage difference of SAWSS on the aortic arch and DAo are within 11% among the cases. The highest SAWSS was observed in the aortic arch segment in all the cases

3.3.2. Secondary Flow
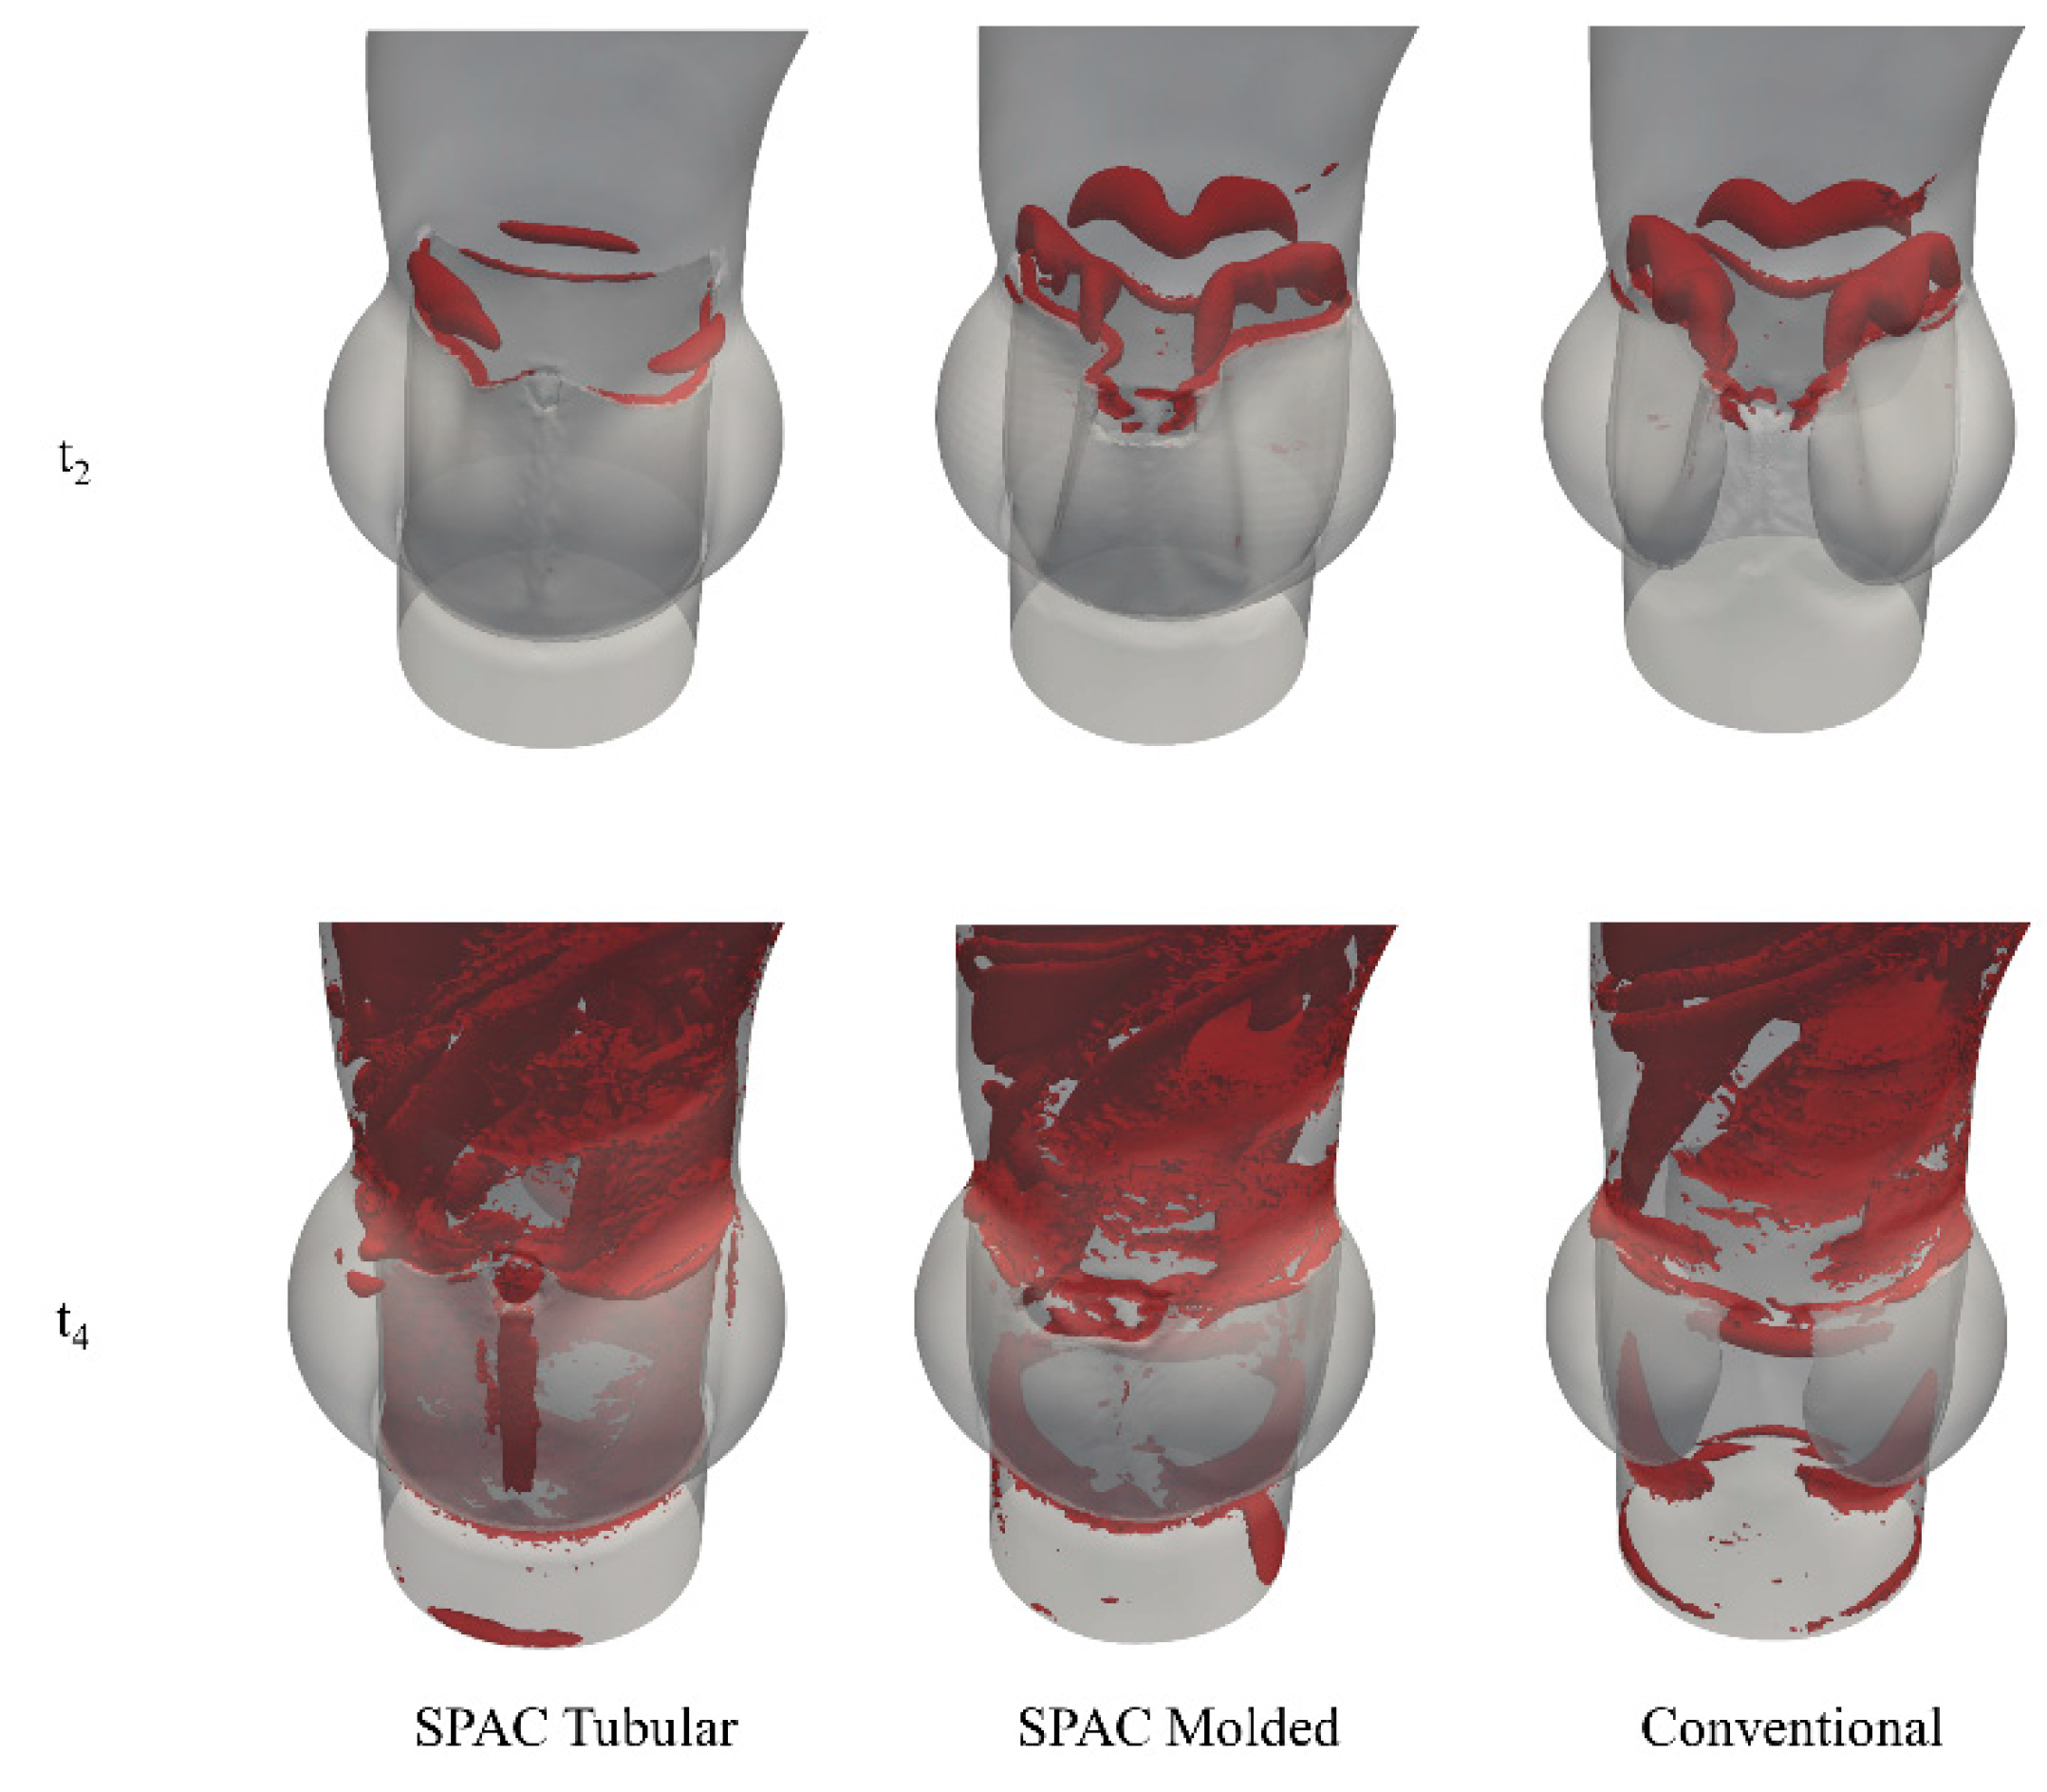
Figure 9 showed the velocity vector distributions of secondary flow in the ascending aorta (slice 1), aortic arch (slice 2) and descending aorta (slice 4) of all three cases at the acceleration peak (t4). The visualized results showed that different valve designs mainly affect the secondary flow distribution patterns in the ascending aorta (slice 1).
The maximum and averaged secondary flow velocity in slices 1, 3 and 5 of the SPAC tubular valve, SPAC molded valve, and conventional valve are listed in Table 5. Obvious quantitative differences of both metrics in aorta were observed between the SPAC tubular valve case and the rest two valve designs.
The relative differences of the metrics to the conventional case are listed in Table 6.
Figure 10 illustrates the strength of secondary flow in the aorta at the acceleration peak (t4). The secondary flow strength increased along the ascending aorta and the strongest secondary flow occurred near the aortic arch in all three cases.
The specific values of the mean secondary velocity of all cases as well as the relative differences to the conventional case at t4 are listed in Table 7. Although the mean secondary velocities in the aortic arch of both SPAC cases are around 10% higher than the conventional valve case, its magnitude in the AAo and DAo of the SPAC molded valve case is identical to that of the case of the conventional valve.

3.3.3. Q-Criterion

Figure 11 shows the vortex development processes in the ascending aorta by plotting the 3D isosurface of the Q-criterion. During the early systolic phase (t2), a ring-like vortex structure presented in the vicinity of the free edges and separated into the three small vortex regions near the STJ level of all three valves. Among these, the SPAC tubular valve showed a lower vortex strength. At the peak of systole acceleration (t4), the ring-like vortex structure broke up immediately downstream of the free edges and dominated the ascending aorta. Although no obvious distinctions were observed in the aortic arch and DAo among the cases, vortices with non-identifiable patterns appeared in the SPAC tubular valve.

4. Discussion

The introduction of the SPAC tubular valve into clinical practice has greatly eased technical requirements and simplified implantation procedures. On this basis, the SPAC molded valve resembling the native leaflet geometry was proposed by Goetz et al. [36]. Benefiting from a longer free edge and a larger EOA, the SPAC molded valve design has shown comparable structural dynamic behavior with the conventional approach, which is superior to its tubular counterpart [12]. Promising results from in vitro and in vivo animal trails further proved the feasibility and reliability of SPAC molded valve under physiological conditions [13,36]. In this study, the effects of the SPAC tubular valve, SPAC molded valve and conventional valve on the aortic flow were investigated by using 0D/3D coupled numerical models.

4.1. Modeling Simplifications

Constrained by the computational resource, capability of the numerical algorithm as well as the availability of data, several simplifications have been made in the current study.
First of all, only steady-state CFD analyses were performed in this study. In the numerical investigations of prosthetic aortic valves, the use of FEM, CFD and fluid–structure interaction (FSI) techniques have been reported. Among these, FSI simulations are advanced in providing the valvular hemodynamics characteristics and strain/stress on leaflets simultaneously, and have started to merge in recent years [37,38,39,40,41,42,43,44,45,46,47,48,49,50,51,52,53,54,55,56,57,58]. The most popular FSI algorithms for valvular simulations are arbitrary Lagrangian–Eulerian (ALE) [59], immersed boundary (IB) [60] and smoothed particle hydrodynamics (SPH) [61]. However, the extremely computation-intensive nature of the FSI method has constrained its application in dealing with large-scale models, which would take weeks to months to solve [62,63,64]. Compared with FSI simulation, the steady-state CFD simulation is advanced in providing a fast prediction of non-temporal flow characteristics with ease and has been widely used in the studies of valvular and aortic hemodynamics [65,66,67,68,69,70,71,72]. Despite the fact that the blood flow in the vascular system was pulsatile under physiological conditions, several numerical [73,74] and in vitro [75,76,77] studies have suggested that steady-state simulation can predict the non-temporal related flow characteristics at the corresponding point of the pulsatile flow profile. In addition, it has been reported that the WSS distribution patterns derived from the steady flow simulations are similar to the time-averaged WSS (TAWSS) from the unsteady analyses [67,78,79].
Secondly, the volumetric flow rates were imposed at the inlet and mapped onto the inlet plane by using an idealized parabolic velocity profile [28]. Morbiducci et al. concluded that the inlet boundary condition profile could drastically affect the helical flow pattern in the aorta and suggested imposing an in vivo velocity profile at the inlet to accurately predict the individual flow phenomena in patient-specific analyses [80]. This observation was further supported by the study of Youssefi et al. [81]. Nevertheless, the idealized inlet profiles, such as parabolic and plug, are still commonly used in the related studies [82,83,84] due to the limited availability of in vivo data. As the scope of this preliminary study is not to predict the patient-specific hemodynamics metrics, but to compare the impacts of valve structures on aortic flow, the use of the same idealized inlet flow profile among the cases at each time point could be a reasonable baseline.
Moreover, the laminar flow condition was assumed in this study due to the constriction of the solver. Although the laminar assumption has been widely used in the flow simulations in the aortic valve and aorta [42,52,80,85,86], its inaccurate estimation of flow parameters within the transitional and turbulent flow regime region should be noted in the individualized evaluations [87].

4.2. Helical Flow

Previous studies have demonstrated that the complex morphology and flow condition in the aorta lead to right-handed helical flow in AAo as well as left-handed helical flow in DAo among healthy subjects [14,16,32,88,89]. Morbiducci et al. further investigated the development of helical flow in the aorta during the systolic phase by using in vivo four-dimensional phase contrast magnetic resonance imaging (4D PC-MRI), and concluded that the helical flow pattern in the aorta could optimize the blood flow in the aorta by avoiding excessive energy dissipation and reducing flow instabilities [14,15]. In addition, the helical flow also affects the aortic mass transportation. Several studies on the low-density lipoprotein (LDL) transportation in the aorta reported that the helical flow environment would reduce the luminal surface LDL concentration in the aortic arch [90,91]. Meanwhile, enhanced oxygen transportation as well as suppressed activation of blood components have been associated with the helical flow in arteries [18,92,93]. Such phenomena indicate that the physiological helical flow plays an important role in protecting the aorta form atherogenesis and thrombosis [16]. However, abnormally high grades of helical flow could elevate the potential risk of aortic wall remodeling and lead to aortic dilation [94]. Clinical evidence showed that the aortic insufficient and eccentric jet caused by a non-physiological aortic valve structure are the major causes of high helix grade [19,88,89]. The result from this study showed that in all of the three cases, right-handed helical flows appeared in the ascending and aortic arch at the very early stage of the acceleration phase and dominated the entire aorta at the systolic peak. These flow patterns agree well with the previous clinical observations of aorta flow in healthy subjects. Even though the helix grades of all cases are within the normal range at the acceleration peak (1.1 ± 0.1 to 2.03 ± 0.67) [32,88], the SPAC tubular valve presents a 16.7% higher helix than that of the rest of the cases due to its smaller EOA. In addition to the higher helix grade, the smaller EOA of the SPAC molded valve also caused higher Vmean and Vmax in the ascending aorta at the systolic peak. Also noted is that highly disturbed inter-sinus flow existed in the both SPAC cases, which is not observed in the conventional valve. This phenomenon is mainly due to the non-isolated sinuses of the SPAC approaches, and the distal flow in the aorta was not affected by this localized disturbance.

4.3. Secondary Flow

Besides the helical flow, the secondary flow has been recognized as another essential aortic flow phenomenon caused by the curvature structure of aorta [95]. However, some recent studies have shown that the SAVR could affect the secondary flow strength due to the differed geometric characteristics of prosthetic valves [96,97]. In this study, we observed obvious secondary flow in the upper ascending aorta and aortic arch during the systolic phase in all the three cases investigated. Compared with the SPAC tubular and conventional valve, a lower mean secondary velocity in AAo as well as a higher mean secondary velocity in DAo was found in the case of the SPAC tubular valve. These phenomena are likely related to the higher jet velocity downstream of the SPAC tubular valve [97].

4.4. WSS Distribution

Regarding the WSS, the higher jet velocity induced by constrained EOA that would result in an increased WSS in the ascending aorta have been reported by studies that investigated the effect of valve geometry on aortic hemodynamics [23,97,98]. The results from the current study agree well with the previous observations. For the SPAC tubular valve case, the SAWSS in the AAo segment was 20.34% and 29.64% higher than that of the SPAC molded valve and conventional valve, respectively. Due to the existence of helical flow and secondary flow, the SAWSS magnitudes among the three cases gradually became consistent along the flow direction. In the distal aortic arch, the differences of SAWSS among three cases were less than 2%.

4.5. Vortex Distribution

The presence of the vortex ring in the opening phase of the aortic valve, which is caused by the shear layer shed of the fluid at the tip of leaflets, has been reported by several in vitro and numerical studies as well [99,100,101]. In the present study, the formation and dissipation of vortex rings were observed in all three valve designs during the opening stage. The vortex rings of all the valves were bending towards the flow direction with lobes near the commissures at the early stage of acceleration and separated into small-scale vortices at the acceleration peak, which agrees well with the results from FSI studies on prosthetic aortic valves [37,102]. The vortex distribution in the SPAC molded valve case is similar to that in the case with a conventional valve, and a more complex vortex structure within the valve section was observed in the SPAC tubular valve at the acceleration peak. This distinctive vortex pattern could be attributed to the smaller EOA of the SPAC tubular valve [12].

4.6. Limitations and Future Works

The current study has some inherent limitations. Firstly, despite the fact that the prediction of an accurate WSS level is not within the scope of this study, it should be noted that the rigid wall as well as laminar flow assumption may lead to an inaccurate estimation of WSS [103,104]. In addition, the steady-state simulation precluded the evaluation of time-dependent parameters such as time-averaged WSS (TAWSS), relative resident time (RRT) as well as oscillatory shear index (OSI), and is incapable of reflecting the vortex dynamics within the entire cardiac cycle. Moreover, the use of idealized flow profiles may not be able to reflect the helical flow patterns in physiological conditions. Thus, more comprehensive studies that include the FSI simulations with in vivo boundary conditions should be conducted in the next stage of the investigation.

5. Conclusions

The hemodynamic impacts of three prosthetic aortic valve designs were numerically investigated in this study. The preliminary results showed that the hemodynamic performance of the SPAC molded valve is similar to that of the conventional valve in terms of aortic flow characteristics. The findings from this study can expand the understanding of the influence of prosthetic aortic valve design on aortic hemodynamic characteristics and benefit the optimization of prosthetic valve design.

Author Contributions

Conceptualization, G.-Y.Z. and J.-H.Y.; methodology, G.-Y.Z. and H.H.; investigation, H.H. and G.-Y.Z.; resources, J.-H.Y.; writing—original draft preparation, G.-Y.Z. and H.H.; writing—review and editing, C.-F.Y. and X.-Q.S.; visualization, Y.-L.S. and H.H.; supervision, G.-Y.Z. and X.-Q.S.; project administration, G.-Y.Z. and X.-Q.S.; funding acquisition, G.-Y.Z. and X.-Q.S. All authors have read and agreed to the published version of the manuscript.

Funding

This research was funded by the National Natural Science Foundation of China (NSFC) (11802227, 11971379 and 11571275) and by the Natural Science Foundation of Shaanxi Province (2018JM1014).

Acknowledgments

The authors would like to acknowledge Alison Marsden and her team for developing the open-source source software SimVacsular.

Conflicts of Interest

The authors declare no conflict of interest. The funders had no role in the design of the study; in the collection, analyses, or interpretation of data; in the writing of the manuscript; or in the decision to publish the results.

References

  1. Timmis, A.; Townsend, N.; Gale, C.; Grobbee, R.; Maniadakis, N.; Flather, M.; Wilkins, E.; Wright, L.; Vos, R.; Bax, J.; et al. European Society of Cardiology: Cardiovascular Disease Statistics 2017. Eur. Heart J. 2018, 39, 508–579. [Google Scholar] [CrossRef] [Green Version]
  2. Søndergaard, L.; Saraste, A.; Christersson, C.; Vahanian, A. The year in cardiology 2017: Valvular heart disease. Eur. Heart J. 2018, 39, 650–657. [Google Scholar] [CrossRef]
  3. Climie, R.E.D.; Picone, D.S.; Blackwood, S.; Keel, S.E.; Qasem, A.; Rattigan, S.; Sharman, J.E. Pulsatile interaction between the macro-vasculature and micro-vasculature: Proof-of-concept among patients with type 2 diabetes. Eur. J. Appl. Physiol. 2018, 118, 2455–2463. [Google Scholar] [CrossRef] [PubMed]
  4. Rodriguez-Gabella, T.; Voisine, P.; Puri, R.; Pibarot, P.; Rodés-Cabau, J. Aortic Bioprosthetic Valve Durability. J. Am. Coll. Cardiol. 2017, 70, 1013–1028. [Google Scholar] [CrossRef] [PubMed]
  5. Choi, C.H.; Cheng, V.; Malaver, D.; Kon, N.; Kincaid, E.H.; Gandhi, S.K.; Applegate, R.J.; Zhao, D.X.M. A comparison of valve-in-valve transcatheter aortic valve replacement in failed stentless versus stented surgical bioprosthetic aortic valves. Catheter. Cardiovasc. Interv. 2019, 93, 1106–1115. [Google Scholar] [CrossRef]
  6. Capelli, C.; Corsini, C.; Biscarini, D.; Ruffini, F.; Migliavacca, F.; Kocher, A.; Laufer, G.; Taylor, A.M.; Schievano, S.; Andreas, M.; et al. Pledget-Armed Sutures Affect the Haemodynamic Performance of Biologic Aortic Valve Substitutes: A Preliminary Experimental and Computational Study. Cardiovasc. Eng. Technol. 2017, 8, 17–29. [Google Scholar] [CrossRef] [PubMed] [Green Version]
  7. O’Brien, M.F. The cryolife-O’Brien composite aortic stentless xenograft: Surgical technique of implantation. Ann. Thorac. Surg. 1995, 60, S410–S413. [Google Scholar] [CrossRef]
  8. Doss, M.; Martens, S.; Wood, J.P.; Miskovic, A.; Christodoulou, T.; Wimmer-Greinecker, G.; Moritz, A. Aortic Leaflet Replacement With the New 3F Stentless Aortic Bioprosthesis. Ann. Thorac. Surg. 2005, 79, 682–685. [Google Scholar] [CrossRef] [PubMed]
  9. Cox, J.L.; Ad, N.; Myers, K.; Gharib, M.; Quijano, R.C. Tubular heart valves: A new tissue prosthesis design—Preclinical evaluation of the 3F aortic bioprosthesis. J. Thorac. Cardiovasc. Surg. 2005, 130, 520–527. [Google Scholar] [CrossRef] [Green Version]
  10. Goetz, W.A.; Tan, T.E.; Lim, K.H.; Salgues, S.L.H.; Grousson, N.; Xiong, F.L.; Chua, Y.L.; Yeo, J.H.; Ee, T.; Hiang, K.; et al. Truly stentless molded autologous pericardial aortic valve prosthesis with single point attached commissures in a sheep model. Eur. J. Cardio Thorac. Surg. 2008, 33, 548–553. [Google Scholar] [CrossRef] [Green Version]
  11. Duran, C.M.G.; Gallo, R.; Kumar, N. Aortic Valve Replacement with Autologous Pericardium: Surgical Technique. J. Card. Surg. 1995, 10, 1–9. [Google Scholar] [CrossRef] [PubMed]
  12. Xiong, F.L.; Goetz, W.A.; Chong, C.K.; Chua, Y.L.; Pfeifer, S.; Wintermantel, E.; Yeo, J.H. Finite element investigation of stentless pericardial aortic valves: Relevance of leaflet geometry. Ann. Biomed. Eng. 2010, 38, 1908–1918. [Google Scholar] [CrossRef] [PubMed]
  13. Goetz, W.A.; Lim, K.H.; Ibled, R.; Grousson, N.; Salgues, S.L.H.; Yeo, J.H. Forces at single point attached commissures (SPAC) in pericardial aortic valve prosthesis. Eur. J. Cardiothorac. Surg. 2006, 29, 150–155. [Google Scholar] [CrossRef] [PubMed]
  14. Morbiducci, U.; Ponzini, R.; Rizzo, G.; Cadioli, M.; Esposito, A.; De Cobelli, F.; Del Maschio, A.; Montevecchi, F.M.; Redaelli, A. In Vivo Quantification of Helical Blood Flow in Human Aorta by Time-Resolved Three-Dimensional Cine Phase Contrast Magnetic Resonance Imaging. Ann. Biomed. Eng. 2009, 37, 516–531. [Google Scholar] [CrossRef]
  15. Morbiducci, U.; Ponzini, R.; Rizzo, G.; Cadioli, M.; Esposito, A.; Montevecchi, F.M.; Redaelli, A. Mechanistic insight into the physiological relevance of helical blood flow in the human aorta: An in vivo study. Biomech. Model. Mechanobiol. 2011, 10, 339–355. [Google Scholar] [CrossRef]
  16. Liu, X.; Sun, A.; Fan, Y.; Deng, X. Physiological Significance of Helical Flow in the Arterial System and its Potential Clinical Applications. Ann. Biomed. Eng. 2014, 43, 3–15. [Google Scholar] [CrossRef]
  17. Morbiducci, U.; Gallo, D.; Cristofanelli, S.; Ponzini, R.; Deriu, M.A.; Rizzo, G.; Steinman, D.A. A rational approach to defining principal axes of multidirectional wall shear stress in realistic vascular geometries, with application to the study of the influence of helical flow on wall shear stress directionality in aorta. J. Biomech. 2015, 48, 899–906. [Google Scholar] [CrossRef]
  18. De Nisco, G.; Kok, A.M.; Chiastra, C.; Gallo, D.; Hoogendoorn, A.; Migliavacca, F.; Wentzel, J.J.; Morbiducci, U. The Atheroprotective Nature of Helical Flow in Coronary Arteries. Ann. Biomed. Eng. 2019, 47, 425–438. [Google Scholar] [CrossRef]
  19. Barker, A.J.; Markl, M.; Bürk, J.; Lorenz, R.; Bock, J.; Bauer, S.; Schulz-Menger, J.; von Knobelsdorff-Brenkenhoff, F. Bicuspid Aortic Valve Is Associated With Altered Wall Shear Stress in the Ascending Aorta. Circ. Cardiovasc. Imaging 2012, 5, 457–466. [Google Scholar] [CrossRef] [Green Version]
  20. Barker, A.J.; Lanning, C.; Shandas, R. Quantification of Hemodynamic Wall Shear Stress in Patients with Bicuspid Aortic Valve Using Phase-Contrast MRI. Ann. Biomed. Eng. 2010, 38, 788–800. [Google Scholar] [CrossRef] [Green Version]
  21. Cheng, Z.; Kidher, E.; Jarral, O.A.; O’Regan, D.P.; Wood, N.B.; Athanasiou, T.; Xu, X.Y. Assessment of Hemodynamic Conditions in the Aorta Following Root Replacement with Composite Valve-Conduit Graft. Ann. Biomed. Eng. 2016, 44, 1392–1404. [Google Scholar] [CrossRef] [PubMed]
  22. Trauzeddel, R.F.; Löbe, U.; Barker, A.J.; Gelsinger, C.; Butter, C.; Markl, M.; Schulz-Menger, J.; von Knobelsdorff-Brenkenhoff, F. Blood flow characteristics in the ascending aorta after TAVI compared to surgical aortic valve replacement. Int. J. Cardiovasc. Imaging 2016, 32, 461–467. [Google Scholar] [CrossRef] [PubMed] [Green Version]
  23. Saikrishnan, N.; Mirabella, L.; Yoganathan, A.P. Bicuspid aortic valves are associated with increased wall and turbulence shear stress levels compared to trileaflet aortic valves. Biomech. Model. Mechanobiol. 2015, 14, 577–588. [Google Scholar] [CrossRef] [PubMed]
  24. Youssefi, P.; Gomez, A.; He, T.; Anderson, L.; Bunce, N.; Sharma, R.; Figueroa, C.A.; Jahangiri, M. Patient-specific computational fluid dynamics—Assessment of aortic hemodynamics in a spectrum of aortic valve pathologies. J. Thorac. Cardiovasc. Surg. 2017, 153, 8–20. [Google Scholar] [CrossRef] [PubMed] [Green Version]
  25. Hedayat, M.; Asgharzadeh, H.; Borazjani, I. Platelet activation of mechanical versus bioprosthetic heart valves during systole. J. Biomech. 2017, 56, 111–116. [Google Scholar] [CrossRef]
  26. Khalili, F.; Gamage, P.; Sandler, R.; Mansy, H. Adverse Hemodynamic Conditions Associated with Mechanical Heart Valve Leaflet Immobility. Bioengineering 2018, 5, 74. [Google Scholar] [CrossRef] [Green Version]
  27. Thubrikar, M. The Aortic Valve; Routledge: Abingdon-on-Thames, UK, 2018; ISBN 9780203737163. [Google Scholar]
  28. Updegrove, A.; Wilson, N.M.; Merkow, J.; Lan, H.; Marsden, A.L.; Shadden, S.C. SimVascular: An Open Source Pipeline for Cardiovascular Simulation. Ann. Biomed. Eng. 2017, 45, 525–541. [Google Scholar] [CrossRef]
  29. Ni, M.W.; Prather, R.O.; Rodriguez, G.; Quinn, R.; Divo, E.; Fogel, M.; Kassab, A.J.; DeCampli, W.M. Computational Investigation of a Self-Powered Fontan Circulation. Cardiovasc. Eng. Technol. 2018, 9, 202–216. [Google Scholar] [CrossRef]
  30. Ceballos, A.; Prather, R.; Divo, E.; Kassab, A.J.; DeCampli, W.M. Patient-Specific Multi-Scale Model Analysis of Hemodynamics Following the Hybrid Norwood Procedure for Hypoplastic Left Heart Syndrome: Effects of Reverse Blalock–Taussig Shunt Diameter. Cardiovasc. Eng. Technol. 2019, 10, 136–154. [Google Scholar] [CrossRef]
  31. Vignon-Clementel, I.I.E.; Alberto Figueroa, C.; Jansen, K.E.; Taylor, C.A. Outflow boundary conditions for three-dimensional finite element modeling of blood flow and pressure in arteries. Comput. Methods 2006, 195, 3776–3796. [Google Scholar] [CrossRef]
  32. Keller, E.J.; Malaisrie, S.C.; Kruse, J.; McCarthy, P.M.; Carr, J.C.; Markl, M.; Barker, A.J.; Collins, J.D. Reduction of aberrant aortic haemodynamics following aortic root replacement with a mechanical valved conduit†. Interact. Cardiovasc. Thorac. Surg. 2016, 23, 416–423. [Google Scholar] [CrossRef] [PubMed] [Green Version]
  33. Ravensbergen, J.; Krijger, J.K.B.; Hillen, B.; Hoogstraten, H.W. The influence of the angle of confluence on the flow in a vertebro-basilar junction model. J. Biomech. 1996, 29, 281–299. [Google Scholar] [CrossRef]
  34. Zhang, Z.; Che, X.; Nie, W.; Li, J.; Zheng, T.; Li, L.; Chen, Q.; Zheng, Z. Study of vortex in flow fields induced by surface dielectric barrier discharge actuator at low pressure based on Q criterion. Plasma Sci. Technol. 2018, 20, 14006. [Google Scholar] [CrossRef]
  35. Qin, W.D.; Zhang, F.; Qin, X.J.; Wang, J.; Meng, X.; Wang, H.; Guo, H.P.; Wu, Q.Z.; Wu, D.W.; Zhang, M.X. Notch1 inhibition reduces low shear stress-induced plaque formation. Int. J. Biochem. Cell Biol. 2016, 72, 63–72. [Google Scholar] [CrossRef]
  36. Goetz, W.A.; Tan, T.E.; Lim, K.H.; Xiong, F.L.; Salgues, S.L.H.; Grousson, N.; Chua, Y.L.; Yeo, J.H. Autologous pericardial pulmonary conduit with single point attached commissures in a sheep model. Eur. J. Cardio Thorac. Surg. 2008, 33, 48–52. [Google Scholar] [CrossRef] [Green Version]
  37. Gilmanov, A.; Stolarski, H.; Sotiropoulos, F. Flow–Structure Interaction Simulations of the Aortic Heart Valve at Physiologic Conditions: The Role of Tissue Constitutive Model. J. Biomech. Eng. 2018, 140, 1–9. [Google Scholar] [CrossRef] [Green Version]
  38. Luraghi, G.; Migliavacca, F.; Rodriguez Matas, J.F. Study on the Accuracy of Structural and FSI Heart Valves Simulations. Cardiovasc. Eng. Technol. 2018, 9, 723–738. [Google Scholar] [CrossRef]
  39. Mao, W.; Caballero, A.; McKay, R.; Primiano, C.; Sun, W. Fully-coupled fluid-structure interaction simulation of the aortic and mitral valves in a realistic 3D left ventricle model. PLoS ONE 2017, 12, 1–21. [Google Scholar] [CrossRef] [Green Version]
  40. Hsu, M.C.; Kamensky, D.; Xu, F.; Kiendl, J.; Wang, C.; Wu, M.C.H.; Mineroff, J.; Reali, A.; Bazilevs, Y.; Sacks, M.S. Dynamic and fluid? structure interaction simulations of bioprosthetic heart valves using parametric design with T-splines and Fung-type material models. Comput. Mech. 2015, 55, 1211–1225. [Google Scholar] [CrossRef] [Green Version]
  41. Morsi, Y.S.; Yang, W.W.; Wong, C.S.; Das, S. Transient fluid–structure coupling for simulation of a trileaflet heart valve using weak coupling. J. Artif. Organs 2007, 10, 96–103. [Google Scholar] [CrossRef]
  42. Luraghi, G.; Migliavacca, F.; García-González, A.; Chiastra, C.; Rossi, A.; Cao, D.; Stefanini, G.; Rodriguez Matas, J.F. On the Modeling of Patient-Specific Transcatheter Aortic Valve Replacement: A Fluid–Structure Interaction Approach. Cardiovasc. Eng. Technol. 2019, 10, 437–455. [Google Scholar] [CrossRef] [PubMed]
  43. Vy, P.; Auffret, V.; Badel, P.; Rochette, M.; Le Breton, H.; Haigron, P.; Avril, S. Review of patient-specific simulations of transcatheter aortic valve implantation. Int. J. Adv. Eng. Sci. Appl. Math. 2016, 8, 2–24. [Google Scholar] [CrossRef]
  44. Chen, Y.; Luo, H. A computational study of the three-dimensional fluid–structure interaction of aortic valve. J. Fluids Struct. 2018, 80, 332–349. [Google Scholar] [CrossRef]
  45. De Hart, J.; Peters, G.W.M.; Schreurs, P.J.G.; Baaijens, F.P.T. A three-dimensional computational analysis of fluid–structure interaction in the aortic valve. J. Biomech. 2003, 36, 103–112. [Google Scholar] [CrossRef]
  46. Nicosia, M.A.; Cochran, R.P.; Einstein, D.R.; Rutland, C.J.; Kunzelman, K.S. A coupled fluid-structure finite element model of the aortic valve and root. J. Heart Valve Dis. 2003, 12, 781–789. [Google Scholar] [PubMed]
  47. Le, T.B.; Sotiropoulos, F. Fluid–structure interaction of an aortic heart valve prosthesis driven by an animated anatomic left ventricle. J. Comput. Phys. 2013, 244, 41–62. [Google Scholar] [CrossRef] [PubMed] [Green Version]
  48. Spühler, J.H.; Jansson, J.; Jansson, N.; Hoffman, J. 3D Fluid-Structure Interaction Simulation of Aortic Valves Using a Unified Continuum ALE FEM Model. Front. Physiol. 2018, 9, 363. [Google Scholar] [CrossRef] [Green Version]
  49. Luraghi, G.; Wu, W.; De Gaetano, F.; Rodriguez Matas, J.F.; Moggridge, G.D.; Serrani, M.; Stasiak, J.; Costantino, M.L.; Migliavacca, F. Evaluation of an aortic valve prosthesis: Fluid-structure interaction or structural simulation? J. Biomech. 2017, 58, 45–51. [Google Scholar] [CrossRef] [Green Version]
  50. Chandran, K.B. Role of Computational Simulations in Heart Valve Dynamics and Design of Valvular Prostheses. Cardiovasc. Eng. Technol. 2010, 1, 18–38. [Google Scholar] [CrossRef] [Green Version]
  51. Votta, E.; Le, T.B.; Stevanella, M.; Fusini, L.; Caiani, E.G.; Redaelli, A.; Sotiropoulos, F. Toward patient-specific simulations of cardiac valves: State-of-the-art and future directions. J. Biomech. 2013, 46, 217–228. [Google Scholar] [CrossRef] [Green Version]
  52. Wu, W.; Pott, D.; Mazza, B.; Sironi, T.; Dordoni, E.; Chiastra, C.; Petrini, L.; Pennati, G.; Dubini, G.; Steinseifer, U.; et al. Fluid–Structure Interaction Model of a Percutaneous Aortic Valve: Comparison with an In Vitro Test and Feasibility Study in a Patient-Specific Case. Ann. Biomed. Eng. 2016, 44, 590–603. [Google Scholar] [CrossRef] [PubMed]
  53. Lavon, K.; Halevi, R.; Marom, G.; Ben Zekry, S.; Hamdan, A.; Joachim Schäfers, H.; Raanani, E.; Haj-Ali, R. Fluid–Structure Interaction Models of Bicuspid Aortic Valves: The Effects of Nonfused Cusp Angles. J. Biomech. Eng. 2018, 140, 031010. [Google Scholar] [CrossRef] [Green Version]
  54. Kamensky, D.M. Immersogeometric Fluid—Structure Interaction Analysis of Bioprosthetic Heart Valves. Doctoral Thesis, The University of Texas at Austin, Austin, TX, USA, 2016. [Google Scholar]
  55. Mao, W.; Li, K.; Sun, W. Fluid–Structure Interaction Study of Transcatheter Aortic Valve Dynamics Using Smoothed Particle Hydrodynamics. Cardiovasc. Eng. Technol. 2016, 7, 374–388. [Google Scholar] [CrossRef] [Green Version]
  56. Bahraseman, H.G.; Languri, E.M.; Yahyapourjalaly, N.; Espino, D.M. Fluid structure interaction modeling of aortic valve stenosis at different heart rates. Acta Bioeng. Biomech. 2016, 18, 11–20. [Google Scholar] [PubMed]
  57. Su, B.; Zhong, L.; Wang, X.-K.; Zhang, J.-M.; Tan, R.S.; Allen, J.C.; Tan, S.K.; Kim, S.; Leo, H.L. Numerical simulation of patient-specific left ventricular model with both mitral and aortic valves by FSI approach. Comput. Methods Programs Biomed. 2014, 113, 474–482. [Google Scholar] [CrossRef] [PubMed]
  58. Ghosh, R.P.; Marom, G.; Rotman, O.M.; Slepian, M.J.; Prabhakar, S.; Horner, M.; Bluestein, D. Comparative Fluid–Structure Interaction Analysis of Polymeric Transcatheter and Surgical Aortic Valves’ Hemodynamics and Structural Mechanics. J. Biomech. Eng. 2018, 140, 121002. [Google Scholar] [CrossRef]
  59. Hughes, T.J.R.; Liu, W.K.; Zimmermann, T.K. Lagrangian-Eulerian finite element formulation for incompressible viscous flows. Comput. Methods Appl. Mech. Eng. 1981, 29, 329–349. [Google Scholar] [CrossRef]
  60. Peskin, C.S. Flow patterns around heart valves: A numerical method. J. Comput. Phys. 1972, 10, 252–271. [Google Scholar] [CrossRef]
  61. Monaghan, J.J. Smoothed Particle Hydrodynamics and Its Diverse Applications. Annu. Rev. Fluid Mech. 2012, 44, 323–346. [Google Scholar] [CrossRef]
  62. Brown, A.G.; Shi, Y.; Marzo, A.; Staicu, C.; Valverde, I.; Beerbaum, P.; Lawford, P.V.; Hose, D.R. Accuracy vs. computational time: Translating aortic simulations to the clinic. J. Biomech. 2012, 45, 516–523. [Google Scholar] [CrossRef]
  63. Chen, H.Y.; Kassab, G.S. Computational Modeling in Biomechanics; Springer: Dordrecht, The Netherlands, 2010; pp. 207–220. [Google Scholar]
  64. Borazjani, I. Fluid–structure interaction, immersed boundary-finite element method simulations of bio-prosthetic heart valves. Comput. Methods Appl. Mech. Eng. 2013, 257, 103–116. [Google Scholar] [CrossRef]
  65. Hoeijmakers, M.J.M.M.; Silva Soto, D.A.; Waechter-Stehle, I.; Kasztelnik, M.; Weese, J.; Hose, D.R.; de Vosse, F.N. van Estimation of valvular resistance of segmented aortic valves using computational fluid dynamics. J. Biomech. 2019, 94, 49–58. [Google Scholar] [CrossRef] [PubMed]
  66. Vu, H.-H.; Hsu, C.-H. Quasi-Steady Flow Dynamics Study of Human Aortic Valve with Numerical Techniques. J. Mech. 2012, 28, 637–646. [Google Scholar] [CrossRef]
  67. Vincent, P.E.; Plata, A.M.; Hunt, A.A.E.; Weinberg, P.D.; Sherwin, S.J. Blood flow in the rabbit aortic arch and descending thoracic aorta. J. R. Soc. Interface 2011, 8, 1708–1719. [Google Scholar] [CrossRef] [PubMed] [Green Version]
  68. De Nisco, G.; Zhang, P.; Gallo, D.; Liu, X.; Deng, X.; Ponzini, R.; Rizzo, G.; Morbiducci, U. On the Impact of Modeling Assumptions in Subject-Specific Hemodynamic Simulations of Low-Density Lipoproteins Transport in Aorta. In Proceedings of the GNB2016, Naples, Italy, 20–22 June 2016. [Google Scholar]
  69. Ge, L.; Leo, H.-L.; Sotiropoulos, F.; Yoganathan, A.P. Flow in a mechanical bileaflet heart valve at laminar and near-peak systole flow rates: CFD simulations and experiments. J. Biomech. Eng. 2005, 127, 782–797. [Google Scholar] [CrossRef] [PubMed]
  70. Smadi, O.; Fenech, M.; Hassan, I.; Kadem, L. Flow through a defective mechanical heart valve: A steady flow analysis. Med. Eng. Phys. 2009, 31, 295–305. [Google Scholar] [CrossRef]
  71. Caballero, A.D.; Laín, S. A Review on Computational Fluid Dynamics Modelling in Human Thoracic Aorta. Cardiovasc. Eng. Technol. 2013, 4, 103–130. [Google Scholar] [CrossRef]
  72. Bruening, J.; Hellmeier, F.; Yevtushenko, P.; Kelm, M.; Nordmeyer, S.; Sündermann, S.H.; Kuehne, T.; Goubergrits, L. Impact of patient-specific LVOT inflow profiles on aortic valve prosthesis and ascending aorta hemodynamics. J. Comput. Sci. 2018, 24, 91–100. [Google Scholar] [CrossRef]
  73. Ku, D.N.; Giddens, D.P.; Zarins, C.K.; Glagov, S. Pulsatile flow and atherosclerosis in the human carotid bifurcation. Positive correlation between plaque location and low oscillating shear stress. Arter. Thromb. Vasc. Biol. 1985, 5, 293–302. [Google Scholar] [CrossRef] [Green Version]
  74. Hillen, B.; Drinkenburg, A.; Hoogstraten, H. Analysis of flow and vascular resistance in a model of the circle of Willis. J. Biomech. 1988, 21, 807–814. [Google Scholar] [CrossRef]
  75. Kobayashi, N.; Karino, T. Flow patterns and velocity distributions in the human vertebrobasilar arterial system. Laboratory investigation. J. Neurosurg. 2010, 113, 810–819. [Google Scholar] [CrossRef]
  76. Chen, L. Hemodynamics in the Cerebral Circulation: Numerical Studies and Experimetal Investigation. Doctoral Thesis, Nanyang Technological University, Singapore, 2005. [Google Scholar]
  77. Fahy, P.; McCarthy, P.; Sultan, S.; Hynes, N.; Delassus, P.; Morris, L. An experimental investigation of the hemodynamic variations due to aplastic vessels within three-dimensional phantom models of the circle of Willis. Ann. Biomed. Eng. 2014, 42, 123–138. [Google Scholar] [CrossRef]
  78. Caballero, A.D.; Laín, S. Numerical simulation of non-Newtonian blood flow dynamics in human thoracic aorta. Comput. Methods Biomech. Biomed. Eng. 2015, 18, 1200–1216. [Google Scholar] [CrossRef] [PubMed]
  79. Benim, A.C.; Nahavandi, A.; Assmann, A.; Schubert, D.; Feindt, P.; Suh, S.H. Simulation of blood flow in human aorta with emphasis on outlet boundary conditions. Appl. Math. Model. 2011, 35, 3175–3188. [Google Scholar] [CrossRef]
  80. Morbiducci, U.; Ponzini, R.; Gallo, D.; Bignardi, C.; Rizzo, G. Inflow boundary conditions for image-based computational hemodynamics: Impact of idealized versus measured velocity profiles in the human aorta. J. Biomech. 2013, 46, 102–109. [Google Scholar] [CrossRef] [PubMed]
  81. Youssefi, P.; Gomez, A.; Arthurs, C.; Sharma, R.; Jahangiri, M.; Alberto Figueroa, C. Impact of Patient-Specific Inflow Velocity Profile on Hemodynamics of the Thoracic Aorta. J. Biomech. Eng. 2018, 140. [Google Scholar] [CrossRef] [PubMed]
  82. Gallo, D.; De Santis, G.; Negri, F.; Tresoldi, D.; Ponzini, R.; Massai, D.; Deriu, M.A.; Segers, P.; Verhegghe, B.; Rizzo, G.; et al. On the Use of In Vivo Measured Flow Rates as Boundary Conditions for Image-Based Hemodynamic Models of the Human Aorta: Implications for Indicators of Abnormal Flow. Ann. Biomed. Eng. 2011, 40, 729–741. [Google Scholar] [CrossRef] [PubMed]
  83. Mohammadi, H.; Cartier, R.; Mongrain, R. The impact of the aortic valve impairment on the distant coronary arteries hemodynamics: A fluid–structure interaction study. Med. Biol. Eng. Comput. 2017, 55, 1859–1872. [Google Scholar] [CrossRef]
  84. Singh, S.D.; Xu, X.Y.; Wood, N.B.; Pepper, J.R.; Izgi, C.; Treasure, T.; Mohiaddin, R.H. Aortic flow patterns before and after personalised external aortic root support implantation in Marfan patients. J. Biomech. 2016, 49, 100–111. [Google Scholar] [CrossRef] [Green Version]
  85. Pirola, S.; Jarral, O.A.; O’Regan, D.P.; Asimakopoulos, G.; Anderson, J.R.; Pepper, J.R.; Athanasiou, T.; Xu, X.Y. Computational study of aortic hemodynamics for patients with an abnormal aortic valve: The importance of secondary flow at the ascending aorta inlet. APL Bioeng. 2018, 2, 026101. [Google Scholar] [CrossRef]
  86. Stijnen, J.M.A.; de Hart, J.; Bovendeerd, P.H.M.; van de Vosse, F.N. Evaluation of a fictitious domain method for predicting dynamic response of mechanical heart valves. J. Fluids Struct. 2004, 19, 835–850. [Google Scholar] [CrossRef]
  87. Wei, Z.A.; Sonntag, S.J.; Toma, M.; Singh-Gryzbon, S.; Sun, W. Computational Fluid Dynamics Assessment Associated with Transcatheter Heart Valve Prostheses: A Position Paper of the ISO Working Group. Cardiovasc. Eng. Technol. 2018, 9, 289–299. [Google Scholar] [CrossRef]
  88. Markl, M.; Draney, M.T.; Miller, D.C.; Levin, J.M.; Williamson, E.E.; Pelc, N.J.; Liang, D.H.; Herfkens, R.J. Time-resolved three-dimensional magnetic resonance velocity mapping of aortic flow in healthy volunteers and patients after valve-sparing aortic root replacement. J. Thorac. Cardiovasc. Surg. 2005, 130, 456–463. [Google Scholar] [CrossRef] [Green Version]
  89. Hope, T.A.; Markl, M.; Wigström, L.; Alley, M.T.; Miller, D.C.; Herfkens, R.J. Comparison of flow patterns in ascending aortic aneurysms and volunteers using four-dimensional magnetic resonance velocity mapping. J. Magn. Reson. Imaging 2007, 26, 1471–1479. [Google Scholar] [CrossRef] [PubMed]
  90. Liu, X.; Fan, Y.; Deng, X.; Zhan, F. Effect of non-Newtonian and pulsatile blood flow on mass transport in the human aorta. J. Biomech. 2011, 44, 1123–1131. [Google Scholar] [CrossRef] [PubMed]
  91. Liu, X.; Pu, F.; Fan, Y.; Deng, X.; Li, D.; Li, S. A numerical study on the flow of blood and the transport of LDL in the human aorta: The physiological significance of the helical flow in the aortic arch. Am. J. Physiol. Circ. Physiol. 2009, 297, H163–H170. [Google Scholar] [CrossRef] [PubMed]
  92. Liu, X.; Fan, Y.; Deng, X. Effect of spiral flow on the transport of oxygen in the aorta: A numerical study. Ann. Biomed. Eng. 2010, 38, 917–926. [Google Scholar] [CrossRef]
  93. Zhan, F.; Fan, Y.-B.; Deng, X.-Y. Effect of swirling flow on platelet concentration distribution in small-caliber artificial grafts and end-to-end anastomoses. Acta Mech. Sin. 2011, 27, 833–839. [Google Scholar] [CrossRef]
  94. Clough, R.E.; Waltham, M.; Giese, D.; Taylor, P.R.; Schaeffter, T. A new imaging method for assessment of aortic dissection using four-dimensional phase contrast magnetic resonance imaging. J. Vasc. Surg. 2012, 55, 914–923. [Google Scholar] [CrossRef] [Green Version]
  95. Kilner, P.J.; Yang, G.Z.; Mohiaddin, R.H.; Firmin, D.N.; Longmore, D.B. Helical and retrograde secondary flow patterns in the aortic arch studied by three-directional magnetic resonance velocity mapping. Circulation 1993, 88, 2235–2247. [Google Scholar] [CrossRef] [Green Version]
  96. Oechtering, T.H.; Sieren, M.M.; Hunold, P.; Hennemuth, A.; Huellebrand, M.; Scharfschwerdt, M.; Richardt, D.; Sievers, H.-H.; Barkhausen, J.; Frydrychowicz, A. Time-resolved 3-dimensional magnetic resonance phase contrast imaging (4D Flow MRI) reveals altered blood flow patterns in the ascending aorta of patients with valve-sparing aortic root replacement. J. Thorac. Cardiovasc. Surg. 2019. [Google Scholar] [CrossRef] [PubMed]
  97. Hellmeier, F.; Nordmeyer, S.; Yevtushenko, P.; Bruening, J.; Berger, F.; Kuehne, T.; Goubergrits, L.; Kelm, M. Hemodynamic Evaluation of a Biological and Mechanical Aortic Valve Prosthesis Using Patient-Specific MRI-Based CFD. Artif. Organs 2018, 42, 49–57. [Google Scholar] [CrossRef] [PubMed]
  98. Vergara, C.; Viscardi, F.; Antiga, L.; Luciani, G.B. Influence of Bicuspid Valve Geometry on Ascending Aortic Fluid Dynamics: A Parametric Study. Artif. Organs 2012, 36, 368–378. [Google Scholar] [CrossRef] [PubMed]
  99. Sotiropoulos, F.; Le, T.B.; Gilmanov, A. Fluid Mechanics of Heart Valves and Their Replacements. Annu. Rev. Fluid Mech. 2016, 48, 259–283. [Google Scholar] [CrossRef]
  100. Toninato, R.; Salmon, J.; Susin, F.M.; Ducci, A.; Burriesci, G. Physiological vortices in the sinuses of Valsalva: An in vitro approach for bio-prosthetic valves. J. Biomech. 2016, 49, 2635–2643. [Google Scholar] [CrossRef]
  101. D’Antonio, G.C.; Weidner, B.V.; Rowe, S.A.; Pierrakos, O. Evaluating the Performance of Prosthetic Heart Valves: Transvalvular Pressure Drop vs. In Vortex Ring Formation Number. In Proceedings of the 2015 Systems and Information Engineering Design Symposium, Charlottesville, VA, USA, 24–24 April 2015; pp. 41–44. [Google Scholar]
  102. Gilmanov, A.; Sotiropoulos, F. Comparative hemodynamics in an aorta with bicuspid and trileaflet valves. Theor. Comput. Fluid Dyn. 2016, 30, 67–85. [Google Scholar] [CrossRef]
  103. Torii, R.; Oshima, M.; Kobayashi, T.; Takagi, K.; Tezduyar, T.E. Influence of wall thickness on fluid—Structure interaction computations of cerebral aneurysms. Int. J. Numer. Methods Biomed. Eng. 2010, 26, 336–347. [Google Scholar] [CrossRef]
  104. Zhu, G.-Y.; Wei, Y.; Su, Y.-L.; Yuan, Q.; Yang, C.-F. Impacts of Internal Carotid Artery Revascularization on Flow in Anterior Communicating Artery Aneurysm: A Preliminary Multiscale Numerical Investigation. Appl. Sci. 2019, 9, 4143. [Google Scholar] [CrossRef] [Green Version]
Figure 1. (a) The reconstructed 3D patient-specific aorta model; (b) schematic representation of different leaflet designs and implant approaches; (c) the deformed geometric configurations of three valves at five different time points; (d) the diagram of aortic roots with virtually implanted valve.
Applsci 10 01396 g001
Figure 2. The volumetric flow rates at the selected times points.
Applsci 10 01396 g002
Figure 3. Zero-dimensional (0D) lumped parameter models with the 3D aorta model at the efferent arteries.
Applsci 10 01396 g003
Figure 4. The efferent flow rates of three cases at (a) abdominal aorta, brachiocephalic artery (BA), (b) left common carotid artery (LCCA), (c) left subclavical artery (LSA) and (d) aortic arch, descending aorta (DAo).
Applsci 10 01396 g004
Figure 5. The streamline distribution in the entire aorta at different time points.
Applsci 10 01396 g005
Figure 6. The streamline distribution in aortic root at different time points.
Applsci 10 01396 g006
Figure 7. In-plane velocity distribution in slice 1 at the acceleration peak.
Applsci 10 01396 g007
Figure 8. The distributions of wall shear stress (WSS) in three valve models at different time points.
Applsci 10 01396 g008
Figure 9. The secondary flow velocity vector distributions of all three cases at t4.
Applsci 10 01396 g009
Figure 10. The mean secondary velocity of all three cases on five slices at t4.
Applsci 10 01396 g010
Figure 11. Comparison of Q-criterion isosurface during the acceleration phase of systole.
Applsci 10 01396 g011
Table 1. Element numbers for mesh independence analyses.
CaseElement Number (Million)
10.93
22.19
34.30
46.42
510.21
617.63
734.47
840.21
Table 2. The averaged jet velocity (Vmean) and maximum jet velocity (Vmax) of all cases in the systolic phase.
Time PointVmean (cm/s)Vmax (cm/s)
SPAC TubularSPAC MoldedConventionalSPAC TubularSPAC MoldedConventional
t16.426.816.9212.8622.2320.34
t26.547.016.8912.1416.0312.54
t337.9336.8837.0177.8376.4875.49
t463.2560.1558.59139.56135.53131.13
t528.9027.8327.6558.9856.5454.14
SPAC: single-point attached commissure.
Table 3. The specific values of spatially averaged wall shear stress (SAWSS) and low WSS areas of all cases.
Time PointSAWSS (Pa)Low WSS Areas (cm2)
SPAC TubularSPAC MoldedConventionalSPAC TubularSPAC MoldedConventional
t10.180.190.19102.57101.08100.8
t20.200.200.25100.31100.1198.35
t30.520.500.5048.9068.4961.49
t45.034.824.740.851.992.38
t50.350.340.3165.2284.1273.81
Table 4. The SAWSS magnitudes in different segments of aorta.
SegmentSAWSS (Pa)
SPAC TubularSPAC MoldedConventional
AAo3.552.952.74
Aortic arch7.036.676.37
DAo5.495.445.53
AAo: ascending aorta; DAo: descending aorta.
Table 5. The maximum and averaged secondary flow velocity of all designs at t4.
SliceAveraged Secondary Flow Velocity (cm/s)Maximum Secondary Flow Velocity (cm/s)
SPAC TubularSPAC MoldedConventionalSPAC TubularSPAC MoldedConventional
15.344.094.1839.1316.0815.21
330.5628.6926.9375.5478.8687.16
514.6217.3017.2937.4642.5250.91
Table 6. The percentage differences of maximum and averaged secondary flow velocity of all designs at t4.
SlicePercentage Difference in Averaged Secondary Flow Velocity (%)Percentage Difference in Maximum Secondary Flow Velocity (%)
SPAC TubularSPAC MoldedConventionalSPAC TubularSPAC MoldedConventional
127.75−0.210157.260.570
313.480.650−13.33−0.950
5−15.440.010−26.42−1.650
Table 7. The mean secondary velocity of all cases on five slices at t4.
SliceMean Secondary VelocityPercentage Change (%)
SPAC TubularSPAC MoldedConventionalSPAC TubularSPAC Molded
slice 10.080.070.0714.290.00
slice 20.550.630.6515.383.08
slice 30.700.710.649.3710.94
slice 40.600.360.3762.162.70
slice 50.270.320.3112.903.23

