Article

Sudden Variation Effect of Aerodynamic Loads and Safety Analysis of Running Trains When Entering Tunnel Under Crosswind

School of Civil Engineering, Central South University, Changsha 410075, China
*
Author to whom correspondence should be addressed.
Appl. Sci. 2020, 10(4), 1445; https://doi.org/10.3390/app10041445
Submission received: 24 January 2020 / Revised: 15 February 2020 / Accepted: 17 February 2020 / Published: 20 February 2020
(This article belongs to the Special Issue Interactions between Railway Subsystems)

Abstract

:

Featured Application

The results of this paper can provide further theoretical basis for the traffic safety command of high-speed trains in different infrastructure scenarios.

Abstract

Sudden variation of aerodynamic loads is a potential source of safety accidents of high-speed trains (HSTs). As a follow-up investigation on the aerodynamic response of a HST that enters a tunnel under crosswind environment, this paper focuses on the transient response of a HST’s safety indices based on the train–track coupling interaction model. Firstly, a wind–train–track coupling dynamic model is proposed by introducing transient aerodynamic loads into the vehicle–track system. Secondly, the temporal evolution of safety coefficients indicates that the train’s safety risk increases during tunnel entry with crosswind. Results show that the derailment coefficients and wheel load reduction rate during tunnel entry are not only larger than those in open air, but also those inside the tunnel are due to the sudden disappearance of wind excitation at the tunnel entrance. In addition, the characteristic wind curve, which is the wind velocity against the train speed, is presented for application based on the current specification of the safety criteria threshold. The investigation will be useful in assessing the safety risk of a running train subjected to other aerodynamic attacks, such as the coupling effect of an infrastructure scenario and crosswind in a windy area.

1. Introduction

The flow field around a vehicle usually varies transiently when vehicles move from one infrastructure scenario to another, depending on the infrastructure scenarios, such as flat grounds [1,2,3,4], embankments [1,5,6], and viaducts [7,8,9], thereby resulting in the transient variation of aerodynamic force on a vehicle and even a serious overturn accident. For example, an overturn accident occurred in China’s Lanzhou–Xinjiang Railway in 2007, which might be attributed to the transient variation of aerodynamic force when the train was entering wind barriers from open air [10,11,12,13,14]. The transient variation effect is likely to be serious when vehicles are driven into the tunnel from a crosswind environment because the tunnel has more considerable space closure than other infrastructure scenarios. In addition, entering/exiting a tunnel is becoming a common operation environment of a high-speed trains (HSTs), especially in China where an increasing number of cut-and-cover tunnels are designed as a windshield facility of a windy area (Figure 1).
Yang et al. [12] investigated the temporal evolution of the flow structure and conducted aerodynamic behavior using a numerical simulation method to study the transient characteristics and main factors of the aerodynamic loads that act on trains during tunnel entry with crosswind. The results showed that the transient variation of aerodynamic forces on trains was significant and varied differently for the leading, middle, and tail carriages. Although only a quantitative analysis, the train movement presents a complex dynamic response, including the lateral swing, the snake-like, and pitching movements when a HST enters a tunnel in a crosswind environment. The transient variation of the aerodynamic load is usually a crucial source of a vehicle’s safety risk associated with crosswind [7,15,16,17,18]. The flow characteristics around a HST when exiting from the tunnel under crosswind has been researched by Krajnovic [19]. The results show that the maximum yawing and rolling moments may occur when about one third of the train body is out of the tunnel. To date, although considerable attention has been given on various dynamic responses of vehicle aerodynamics, limited attention has been devoted to focusing on the transient aerodynamic response and the corresponding traffic safety of a running train induced by wind effect in a tunnel entrance [15,16,20,21,22,23,24].
As a follow-up work of a previous study [12,25], the present work focuses on the transient aerodynamic response and the corresponding traffic safety of a running HST during tunnel entry with crosswind. Therefore, a full multi-body system (MBS) with 31 independent degrees of freedom (DOFs) of the vehicle is adopted to discuss the wheel–track dynamic response induced by the sudden extinction of wind effect on the train at the tunnel entrance. Thus, safety coefficients, such as the wheel load reduction rate (WRR) and derailment coefficient (DC) are obtained. Finally, the characteristic wind curve (CWC), which shows the wind velocity against the train speed, is also presented for application based on the safety criteria.
This paper is organized into six sections. Section 2 presents the wind–train–track coupling dynamic system. Section 3 proposes the approach applied to simulate the transient flow field and calculate the aerodynamic loads when HSTs enter a tunnel under crosswind. Section 4 provides the numerical demonstration and the verification. Section 5 presents the temporal evolution of aerodynamic loads and safety coefficients. Finally, Section 6 presents some conclusions and some suggestions for future work.

2. Wind–Train–Track Coupling Dynamic Model

The framework of wind–vehicle interaction is divided into three main classes, that is, three simple mass models with no representation of vehicle suspension (see European standard [26]), five mass models with suspension stiffness modelled [9,27], and a full MBS based on train–track coupling interaction [28,29]. This study adopts the MBS method, which establishes the dynamic equilibrium equation of train and track subsystem components, where the wheel–rail interaction is simulated through their geometric and mechanical compatibility. The wind data or aerodynamic loads are subsequently inputted into a sort of vehicle–track system model.

2.1. Modelling of Train

A train usually comprises a series of carriages (e.g., 8 or 16 carriages are widely used in China). Typical carriages consist of a carriage body, suspension systems, bogies, pivots, wheelsets, and other components [30]. In the present study, the carriage was modelled as seven rigid bodies, i.e., one carriage body, two bogies, and four wheelsets (see Figure 2). The whole carriage model had 31 independent DOFs. The response vector of a carriage is expressed as follows. The values of the main parameters in Equations (1)–(23) are given in Table 1 [8,10].
The matrix equation of the train motion subsystem can be expressed as:
M v X ¨ v + C v X ˙ v + K v X v = F v
where Mv, Cv, and Kv are the mass, damping, and stiffness matrices, respectively; X ¨ v , X ˙ v , and X v are the acceleration, velocity, and displacement vector, respectively; F v is the vector of forces on the train and can be expressed as:
F v = [ F v c F v b 1 F v b 2 F v w 1 F v w 2 F v w 3 F v w 4 ] T
where F v c is the vector of forces on the car body; F v b 1 and F v b 2 are the vector of forces on the first and second bogies, respectively; F v w 1 , F v w 2 , F v w 3 , and F v w 4 are the vector of forces on the four wheelsets.
F v c = [ F w y m c g F w z M w x M w y M w z ] T
F v b 1 = F v b 2 = [ 0 m b g 0 0 0 ] T
F v w j = [ F y j i r r m w g + F z j i r r M x j i r r M z j i r r ] T ( j = 1 , 2 , 3 , 4 )
where F w y , F w z , M w x , M w y , and M w z are the excitations of aerodynamic loads, namely the side forces, lift forces, rolling, pitching, and yawing moments on the car body, respectively (details are shown in Section 3.2); m c g , m b g , and m w g are the gravity on the car body, bogies, and wheelsets, respectively; F y i r r , F z i r r , M x i r r , and M z i r r are the forces and moments induced by the track irregularity excitation (Section 2.2); j represents the serial number of the wheelset.
The displacement vector X v of the train is expressed as:
X v = [ X v c X v b 1 X v b 2 X v w 1 X v w 2 X v w 3 X v w 4 ] T
where, X v b 1 , X v b 2 , X v w 1 , X v w 2 , X v w 3 , and X v w 4 are the displacement vector of the car body, the first and second bogies, and the four wheelsets, respectively.
X v c = [ Y c Z c ϕ c β c ψ c ] T
X v b 1 = X v b 2 = [ Y b Z b ϕ b β b ψ b ] T
X v w 1 = X v w 2 = X v w 3 = X v w 4 = [ Y w Z w ϕ w ψ w ] T
where Y and Z are the overall translation displacement in the transverse and vertical directions, respectively; ϕ , β , and ψ are the rolling displacements around three directions (i.e., x, y and z), respectively.
The quality matrix M v of the train is expressed as:
M v = d i a g [ M 1 M 2 M 3 M 4 M 5 M 6 M 7 ]
where M1M7 are the sub-matrices of the car body, the first and second bogies, and four wheelsets, respectively.
M 1 = d i a g [ m c m c J x c J y c J z c ]
M i = d i a g [ m b m b J x b J y b J z b ] ( i = 2 , 3 )
M i = d i a g [ m w m w J x w J z w ] ( i = 4 , 5 , 6 , 7 )
where m denotes the quality and Jx, Jy, and Jz are the moments of inertia around three directions, respectively.
The stiffness matrix K v of the train is expressed as follows:
K v = [ K 11 K 21 K 22 K 31 0 K 33 symmetry 0 K 42 0 K 44 0 K 52 K 63 0 K 55 0 0 K 73 0 0 K 66 0 0 0 0 0 0 K 77 ]
where
K 11 = [ 4 k t y 0 4 k t z symmetry 4 k t y H c b 0 4 k t y H c b 2 + 4 k t z d s k 2 0 0 0 4 k t x H c b 2 + 4 k t z d s k 2 0 0 0 0 4 k t x d s k 2 + 4 k t y H c b 2 ]
K 21 = [ 2 k t y 0 2 k t y H c b 0 0 0 2 k t z 0 2 k t z l c 0 2 k t y H b t 0 2 k t y H c b H b t 2 k t z d s k 2 0 0 0 0 0 2 k t x H c b H b t 0 0 0 0 0 2 k t x d s k 2 ]
K 22 = K 33 = [ 4 k p y + 2 k t y 0 4 k p z + 2 k t z symmetry 2 k t y H b t 4 k p y H t w 0 k ˜ 33 0 0 0 4 k p z l t 2 + 2 k t x H b t 2 0 0 0 0 k ˜ 55 ]
where
k ˜ 33 = 4 k p y H t w 2 + 4 k p z d w k 2 + 2 k t y H b t 2 + 2 k t z d s k 2
k ˜ 55 = 4 k p x d w k 2 + 4 k p y l t 2 + 2 k t x d s k 2
K 31 = [ 2 k t y 0 2 k t y H c b 0 0 0 2 k t z 0 2 k t z l c 0 2 k t y H b t 0 2 k t y H c b H b t 2 k t z d s k 2 0 0 0 0 0 2 k t x H c b H b t 0 0 0 0 0 2 k t x d s k 2 ]
K 42 = K 63 = [ 2 k p y 0 2 k p y H t w 0 2 k p y l t 0 2 k p z 0 2 k p z l t 0 0 0 2 k p z d w k 2 0 0 0 0 0 0 2 k p x d w k 2 ]
K 52 = K 73 = [ 2 k p y 0 2 k p y H t w 0 2 k p y l t 0 2 k p z 0 2 k p z l t 0 0 0 2 k p z d w k 2 0 0 0 0 0 0 2 k p x d w k 2 ]
K 44 = K 55 = K 66 = K 77 = [ 2 k p y 0 0 0 0 2 k p z 0 0 0 0 2 k p z d w k 2 0 0 0 0 2 k p x d w k 2 ]
where H c b , H b t , and H t w are the distance between the gravity center of the carriage body and the upper suspension, upper suspension and the bogie, and bogie and the wheelsets, respectively; l t and l c are the half width of the wheelbase and length of carriage, respectively; d w k and d s k are the half lateral width of the upper and lower suspensions, respectively; and k p x , k p y , k p z , and k t x , and k t y and k t z are the elasticity coefficients of the upper and lower suspensions in the three directions, respectively.
The corresponding damp matrix C v is identical with K v in terms of arrangement, except for different magnitudes.

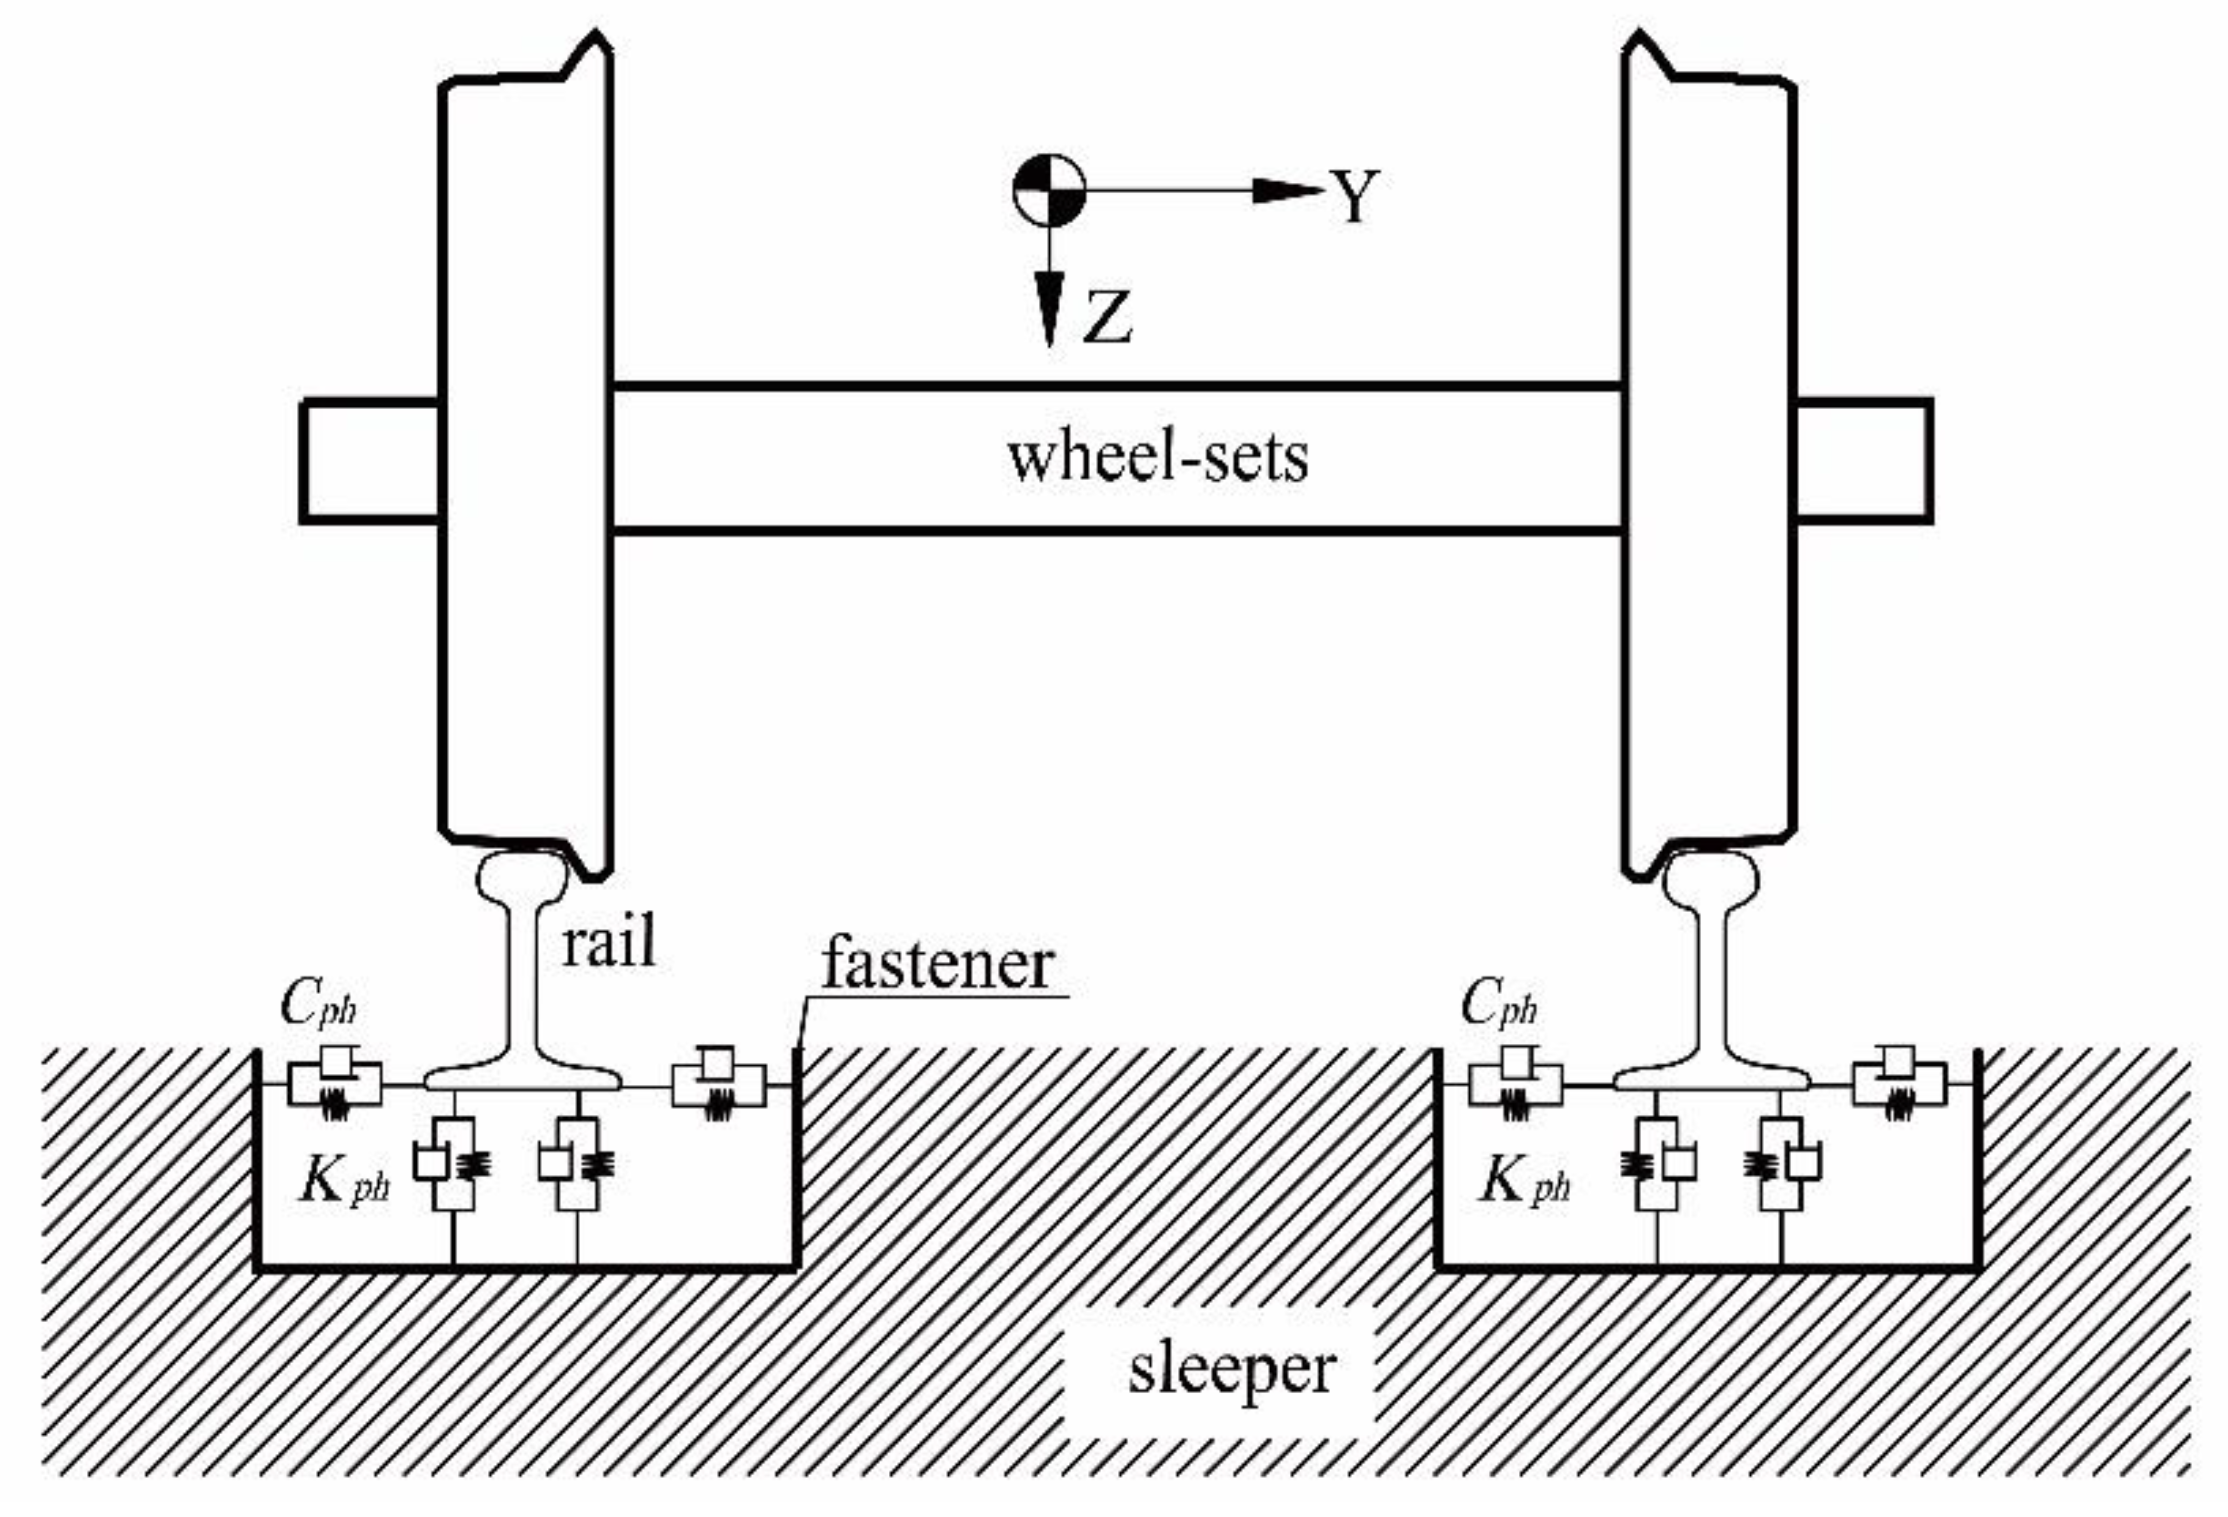
2.2. Modelling of Track

The ballastless track is widely used in high-speed railway (HSR). The rail is fixed in the sleeper via a fastener, which is simulated using springs and damps (see Figure 3). The sleeper is assumed to be fully restrained. The matrix equation of the rail is identical with Equation (1) in form [31].
Figure 4 shows the schematic diagram of track irregularity. The power spectrum density (PSD) is widely used to describe track irregularities and is expressed as follows [31,32]:
{ S v ( Ω ) = A v Ω c 2 ( Ω 2 + Ω r 2 ) ( Ω 2 + Ω c 2 ) S a ( Ω ) = A a Ω c 2 ( Ω 2 + Ω r 2 ) ( Ω 2 + Ω c 2 ) S c ( Ω ) = A v b 2 Ω c 2 Ω 2 ( Ω 2 + Ω r 2 ) ( Ω 2 + Ω c 2 ) ( Ω 2 + Ω s 2 ) S g ( Ω ) = A g Ω c 2 Ω 2 ( Ω 2 + Ω r 2 ) ( Ω 2 + Ω c 2 ) ( Ω 2 + Ω s 2 )
where S v ( Ω ) , S a ( Ω ) , S c ( Ω ) , and S g ( Ω ) are the power spectrum densities (PSDs) of vertical, directional, lateral, and gauge irregularities, respectively; Ω is the space frequency of the track irregularity; A v and A a are the roughness constants; A g is calculated by the reference value of the roughness constants; and Ω c , Ω r , and Ω s are the cut-off frequencies. The German low-interference track spectrum is used as the track irregularity specimen in this simulation, where A v = 4.032 × 10⁻⁷, A a = 2.119 × 10⁻⁷, A g = 5.32 × 10⁻⁷, Ω c = 0.8246, Ω r = 0.0206, and Ω s = 0.438.
The wheel-rail contact model, which is solved by the three dimensional (3D) space trace method, is expressed by Deng et al. [8,10].

3. Simulation of Aerodynamic Loads

3.1. Governing Equations for Fluids

According to the engineering background of the present study, the air flow that involves the train, tunnel, and crosswind are solved by a three-dimensional, compressible, RNG k-ε turbulence model, which has been widely used in similar studies [12,13,33,34,35]. The governing equations are as follows:
ρ t + x i ( ρ u i ) = 0
t ( ρ u i ) + x j ( ρ u i u j ) = p x i + ρ g δ i 3 + x j [ μ ( u i x j + u j x i ) 2 3 δ i j u l x l ] + x j ( ρ u i u j ¯ )
where ρ represents the air density; p represents the aerodynamic pressure; u′ and u are the pulsating and average velocities, respectively; μ represents the air dynamic (molecular) viscosity; the subscripts i, j = 1, 2, 3 represent the x, y, and z directions, respectively; g represents the gravitational acceleration; and δ is the Kronecker delta.

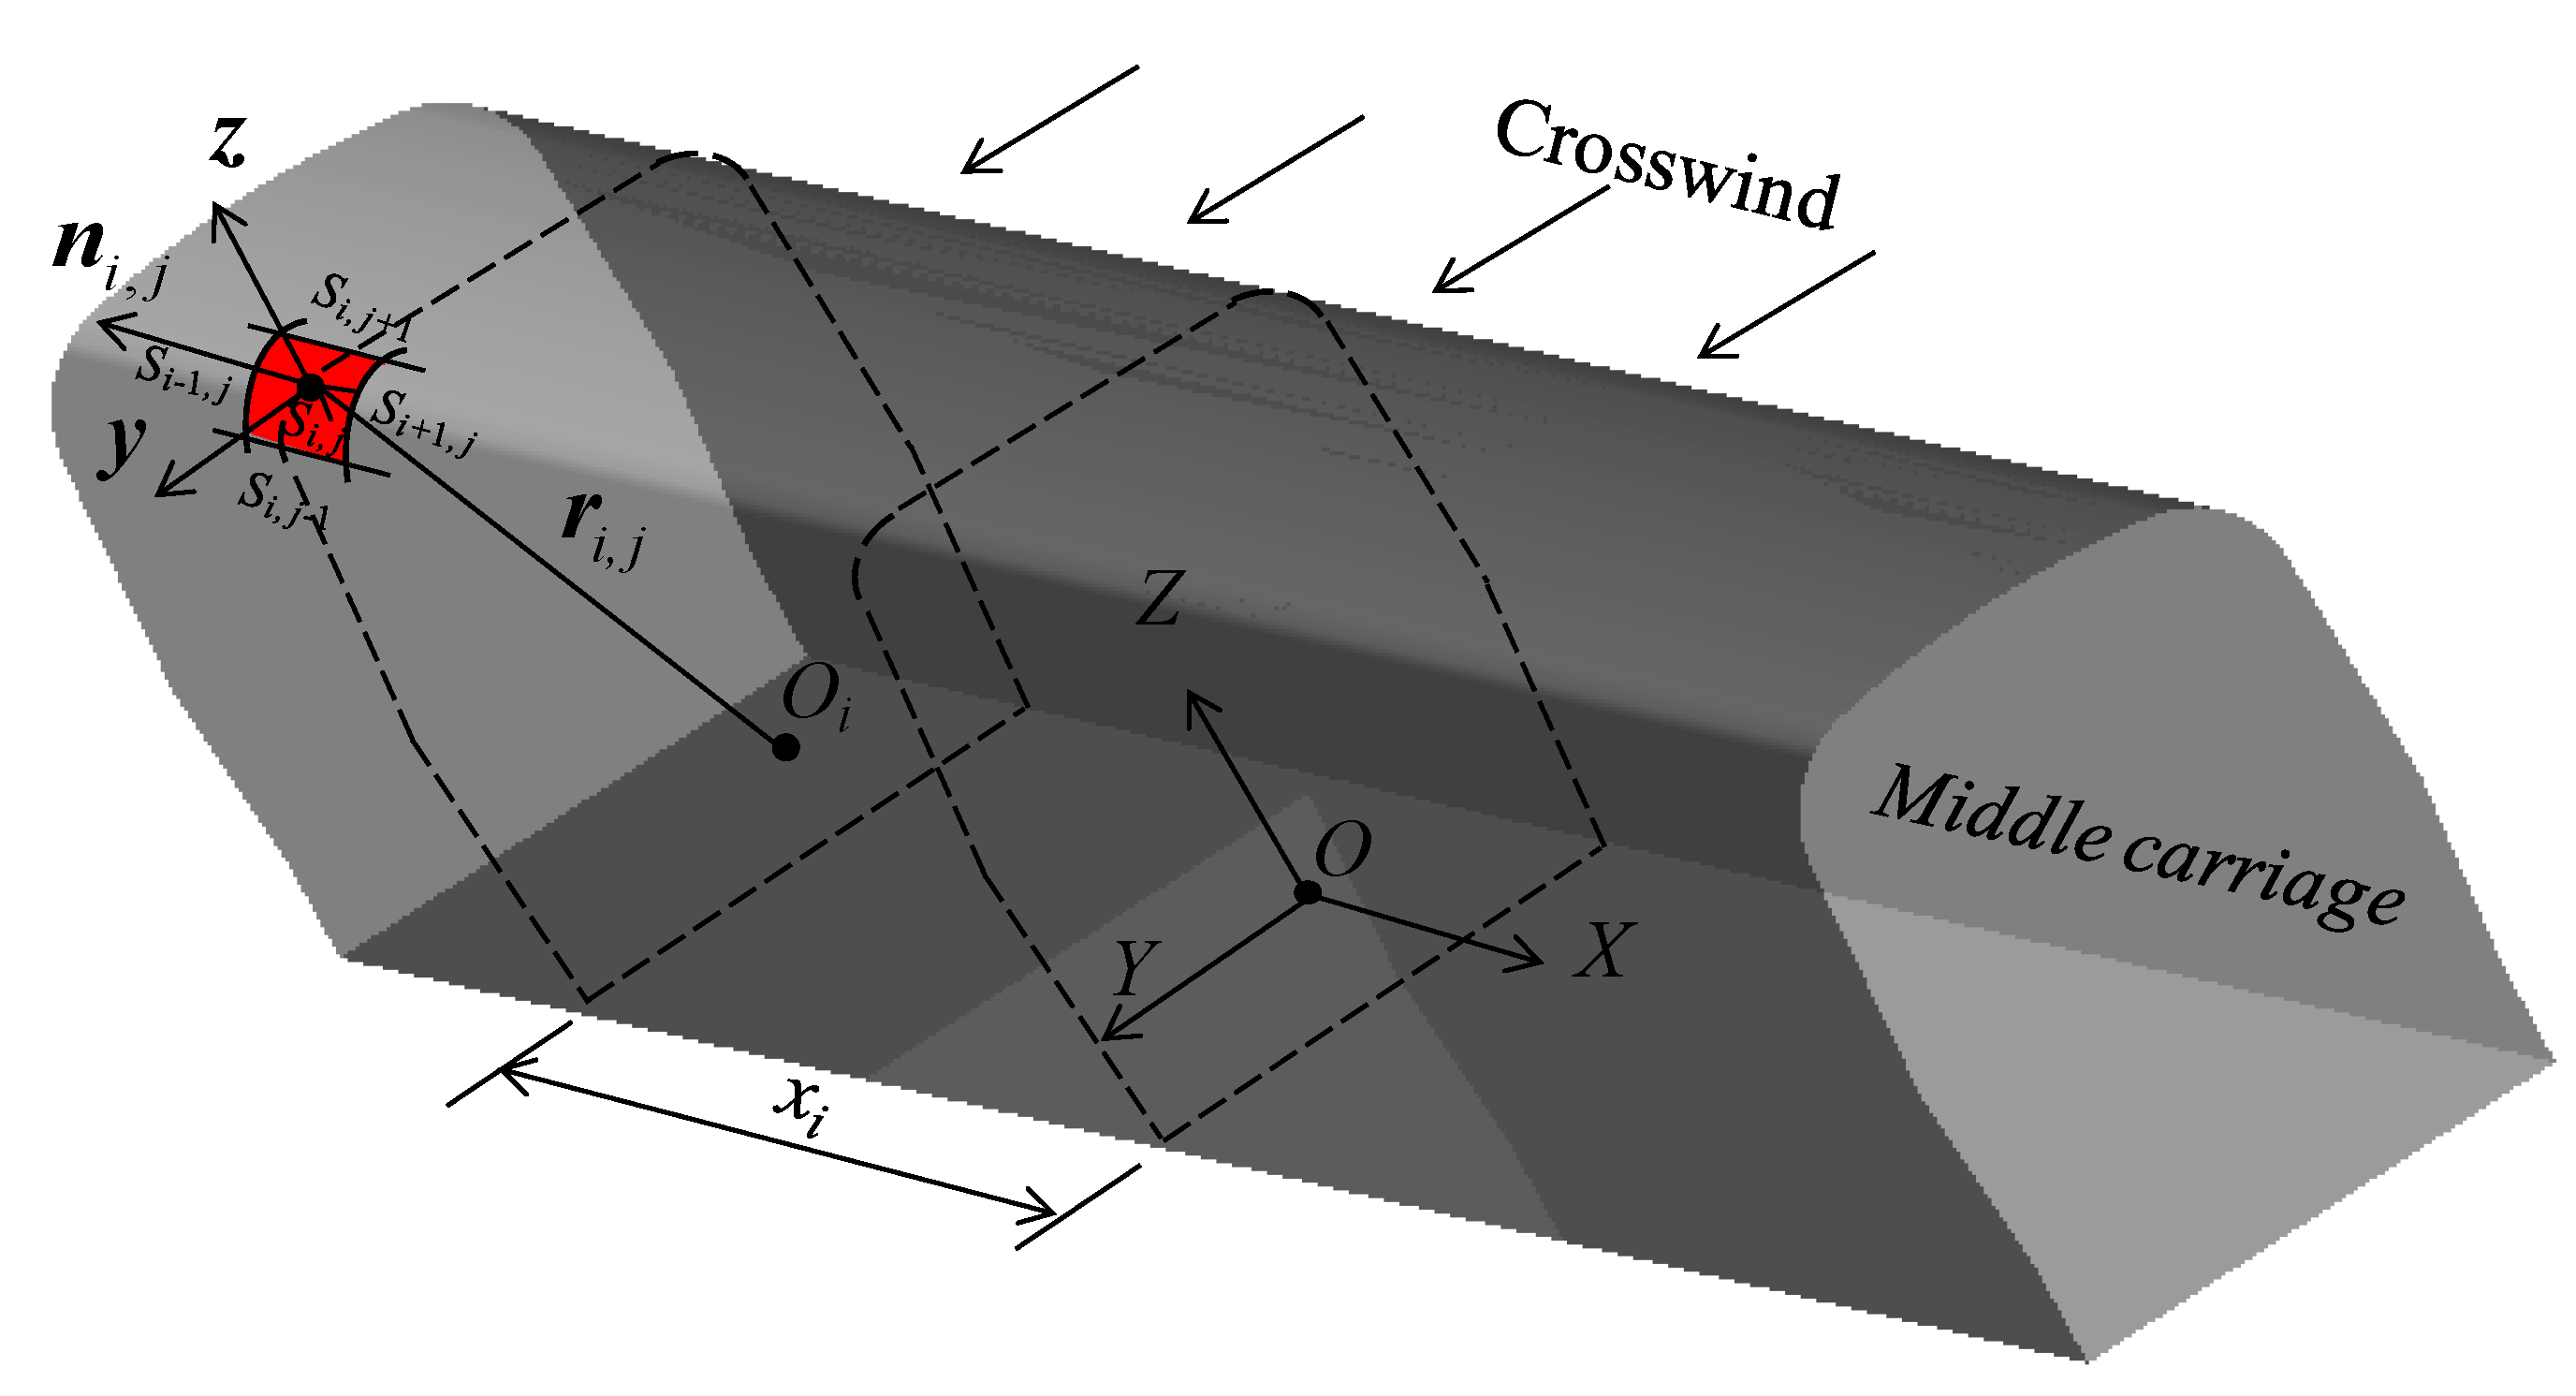
3.2. Aerodynamic Loads

The aerodynamic forces and moments (i.e., side and lift forces and rolling, pitching, and yawing moments) are defined in Equation (27). Here, the center of the moment is the barycenter of the carriage body, as shown in Figure 5 (take the middle carriage as an example).
F w y = i = 1 n ( j = 1 k ( p i , j S i , j ( n i , j y ) ) ) F w z = i = 1 n ( j = 1 k ( p i , j S i , j ( n i , j z ) ) ) M w x = i = 1 n ( j = 1 k ( p i , j S i , j ( r i , j × n i , j ) ) ) M w y = i = 1 n ( j = 1 k ( p i , j S i , j ( n i , j z ) x i ) ) M w z = i = 1 n ( j = 1 k ( p i , j S i , j ( n i , j y ) x i ) )
where the k is the number of calculation faces along the circumferential direction; n is the segments number along the X-axis; y and z represent the unit vectors along the Y- and Z-axes, respectively; n i , j represents the unit normal vector of the surface (ith, jth); S i , j represents the area of the surface (ith, jth); p i , j represents the transient average pressure acting on the surface (ith, jth); x i represents the projection length of the line between the carriage barycentre and the surface (ith, jth) centre on the X-axis; and r i , j represents the moment arm vector on the ith cross section.

4. Numerical Demonstration

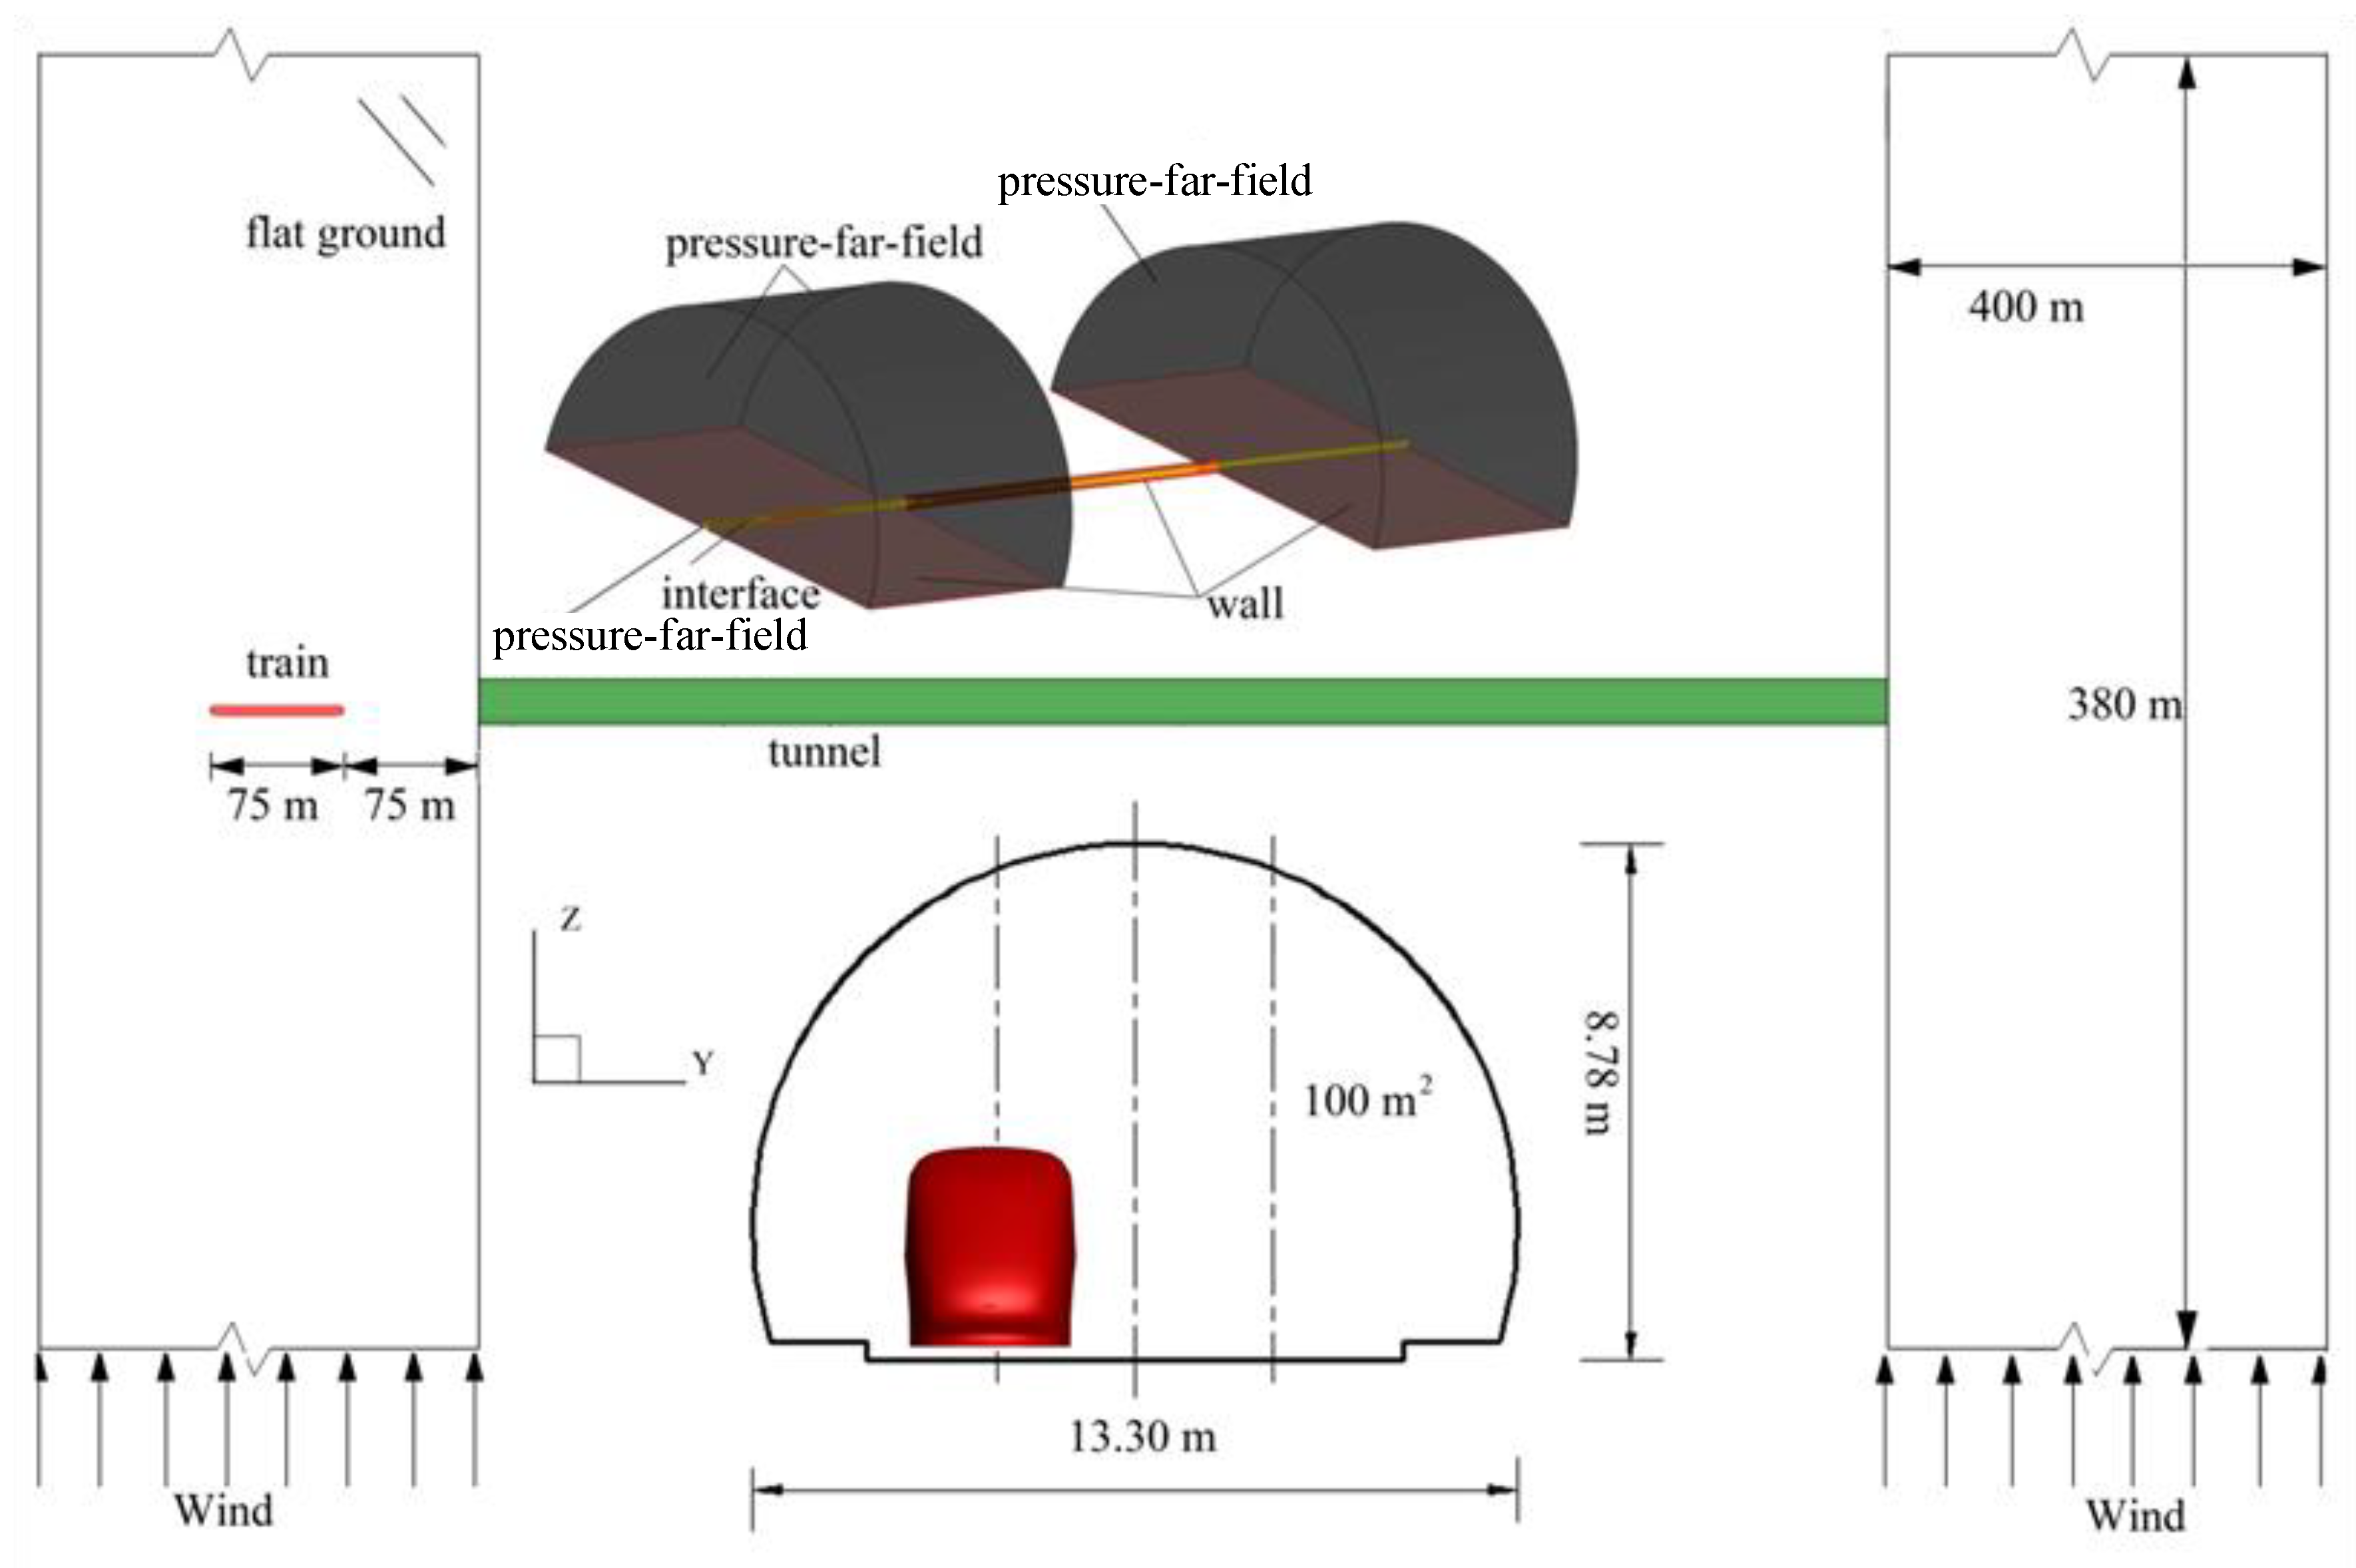
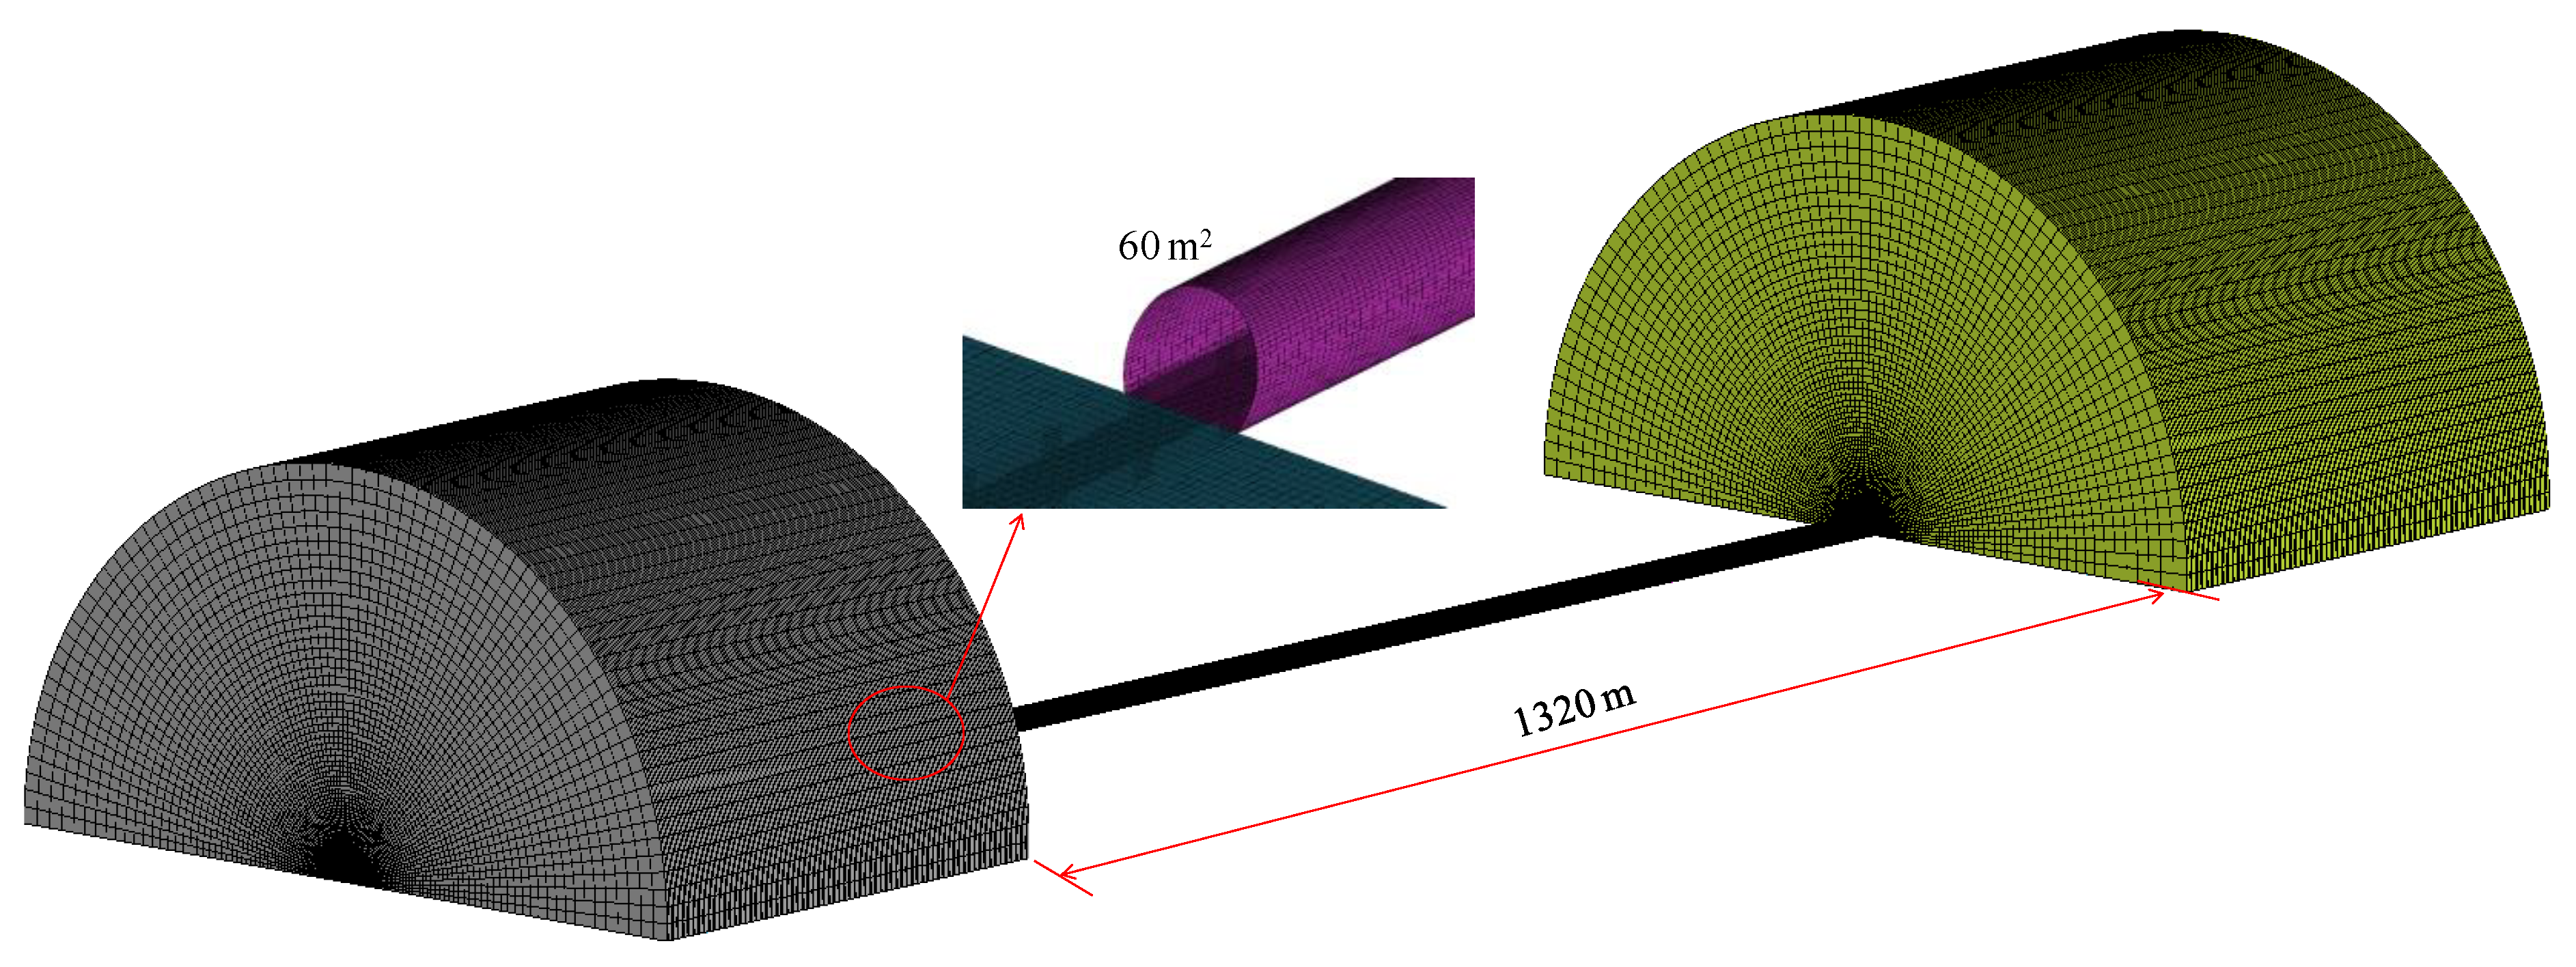
4.1. Scenario Prototype

The total clear area of the prototype tunnel was 100 m2, which is used in more than 90% the operating HSR in China to date and accommodates two rails that run in opposite directions. The length of the tunnel and flat ground was 1005 m and 400 m, respectively. The train was modelled on the basis of the China Railway High-speed 3 (CRH3) prototype, designed at a maximum speed of 350 km/h. The train length was 76 m, which consisted of three continuous carriages. The width and height of the train was 3.075 m and 3.89 m, respectively. The train speed was defined by the profile function in Fluent.
For boundary conditions, the atmospheric boundaries outside the tunnel (including entrance and exit) were applied by a pressure-far-field. Crosswinds were set at the pressure-far-field boundaries. The crosswind velocity direction was perpendicular to the running direction of the HST. A non-slip wall was applied to the flat ground, train, tunnel surfaces, and two ends of the tunnel (see Figure 6).
The whole computational zone was divided into static and dynamic regions by structural hexahedral grids (see Figure 7). The relative motion between the train and flat ground was realized by the Layering dynamic mesh method [8,10,12,13]. Data transmission between the static and dynamic regions was implemented by an interface. Through the grid sensitivity analysis described in Section 4.3.3, it was finally determined that the total number of model grid cells was 9.5 million and the number of boundary layers on the train surface was 8.

4.2. Solving Process

The safety analysis in this study followed the methodologies of the Comité Européen de Normalisation (CEN) code [26]. The train’s aerodynamic loads were obtained on the basis of Computational Fluid Dynamics (CFD) analysis, in which the pressure-based solver is adopted in a segregated manner to solve the unsteady flow in the process of train running. See References [12,13] for the specific solution process. The five aerodynamic loads calculated by Equation (27) were substituted into Equation (3). The loading position of the aerodynamic loads was at point O, as shown in Figure 5. In the segregated algorithm, the individual governing equations for the solution variables were solved one after another. Based on the fact that the Courant number in this study was less than or equal to 5, the physical time-step size of the CFD solution was determined to be 1 × 10⁻³ s. In fact, the present time-step size value was smaller than that used in some similar studies [12,33].
A self-developed program called the wind–train–rail structure (WTRSDYNA) was used to perform a case study [8,10,31]. The time-step size of the program solution was determined to be 2 × 10⁻⁴ s. The dynamic responses (i.e., acceleration, velocity, and displacement of train and wheel), wheel–rail contact force, safety coefficients (i.e., DC and WRR), and other dynamic responses of carriages were all obtained from WTRSDYNA. Figure 8 shows the outline of the WTRSDYNA coupling solution.

4.3. Verification

4.3.1. Verification of Calculation Scheme

The partition scheme of the calculation face may have affected the calculation results of aerodynamic loads, e.g., the number of calculation faces along the circumferential direction and the number of segments along the longitudinal direction. The more the number of calculation faces, the higher the accuracy of calculation and the lower the efficiency of calculation. The maximum pitching moment and side force of the head carriage when the train was running on flat ground under crosswind were taken as the target indicators.
Firstly, three schemes for dividing the segments along the longitudinal direction were set up for comparison, as shown in Figure 9a. The number of the circumferential calculation faces remained constant (k = 24). It is shown from Figure 9a that the target indicator of the scheme with 20 longitudinal segments was in good agreement with that of the scheme with 30 longitudinal segments. A scheme with 20 longitudinal segments (n = 20) was sufficient. Four schemes for dividing the circumferential calculation faces were then set up for comparison, as shown in Figure 9b. The circumferential calculation faces were subdivided into 6, 12, 24, and 48 pieces, respectively (i.e., k = 6, 12, 24, and 48, respectively). The number of the longitudinal segments remained constant (n = 20). It is shown from Figure 9b that the target indicator converged when the number of circumferential calculation faces increased to 24. The scheme with k = 24 and n = 20 was appropriate.

4.3.2. Verification of Boundary Condition

To check the influence of boundary conditions at the tunnel exit on the calculation results in present study, the atmospheric boundary at the tunnel exit was set as three conditions, i.e., the pressure-far-field boundary (crosswind velocity = 25 m/s), the pressure-far-field boundary (no crosswind), and the pressure-outlet boundary. The time-history data of the side force of the head carriage during the train entering tunnel was taken as the target indicator. The atmospheric boundary conditions at the tunnel entrance remained unchanged ([pressure-far-field boundary with 25 m/s crosswind) and the train speed was maintained at 250 km/h in three cases. It is shown from Figure 10 that the target indicator was basically not affected by the atmospheric boundary conditions at the exit.

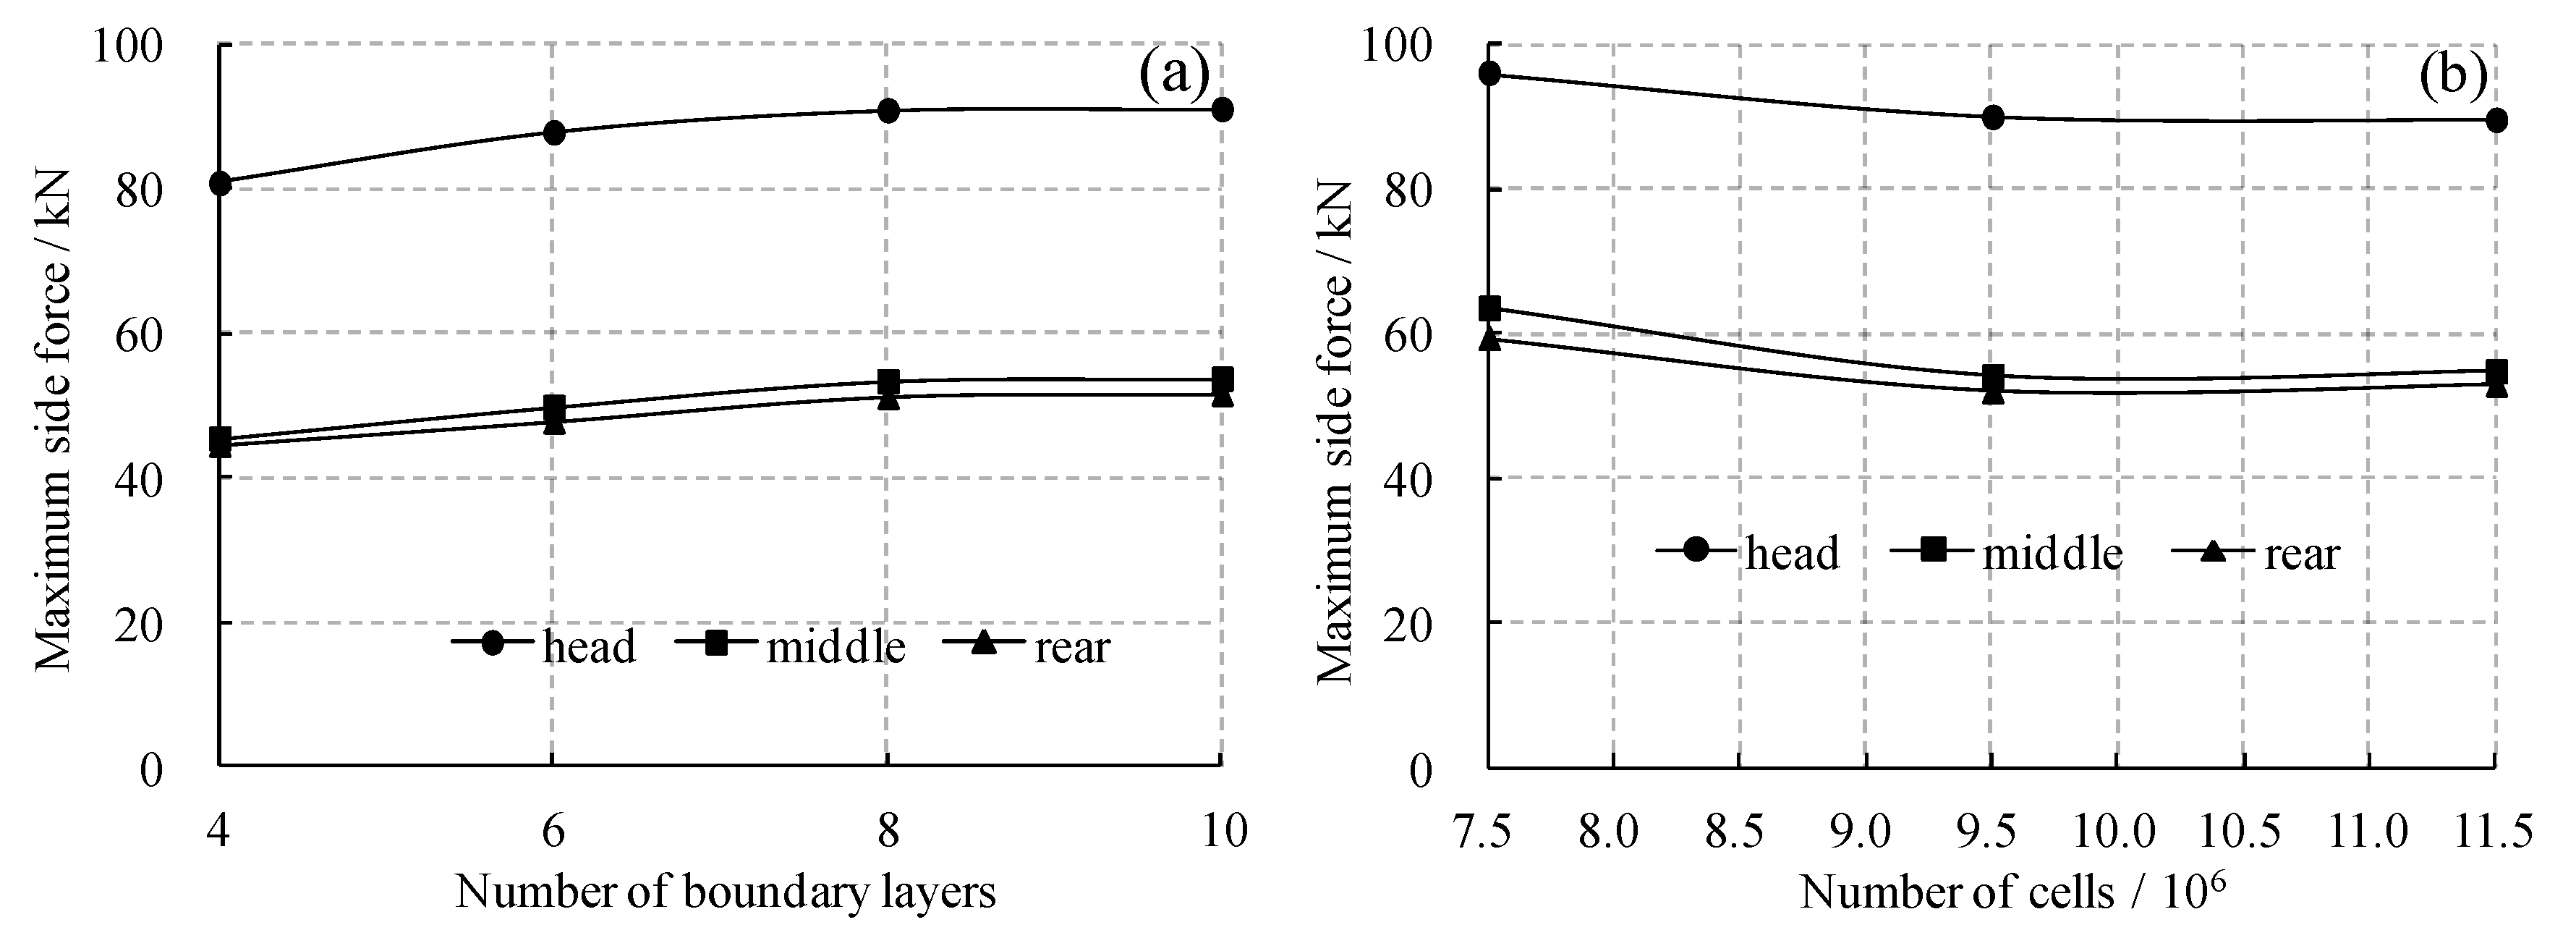
4.3.3. Analysis of Mesh Sensitivity

In this section, the mesh sensitivity of the present model is checked from two aspects, i.e., the number of boundary layers and grid elements. The target indicators are the maximum side force of the head, middle, and rear carriages during the train running on flat ground under crosswind. First, the calculation results of four models with different numbers of boundary layers are compared, as shown in Figure 11a. In each case, the height of the first layer and the entire boundary layer remained constant (see Figure 7). The crosswind velocity and the train speed remained at 25 m/s and 250 km/h, respectively. It can be seen from Figure 11a that the target indicators remained constant when the number of boundary layers increased to 8. The number of grid elements of the whole model wad then set to 7.5, 9.5, and 11.5 million, as shown in Figure 11b. The number of boundary layers for each model remained at 8. As indicated in Figure 11b, the target indicators tended to stabilize when the number of cells increased to 9.5 × 10⁶. Therefore, it can be considered that the scheme of grid size adopted in the present study is reasonable.

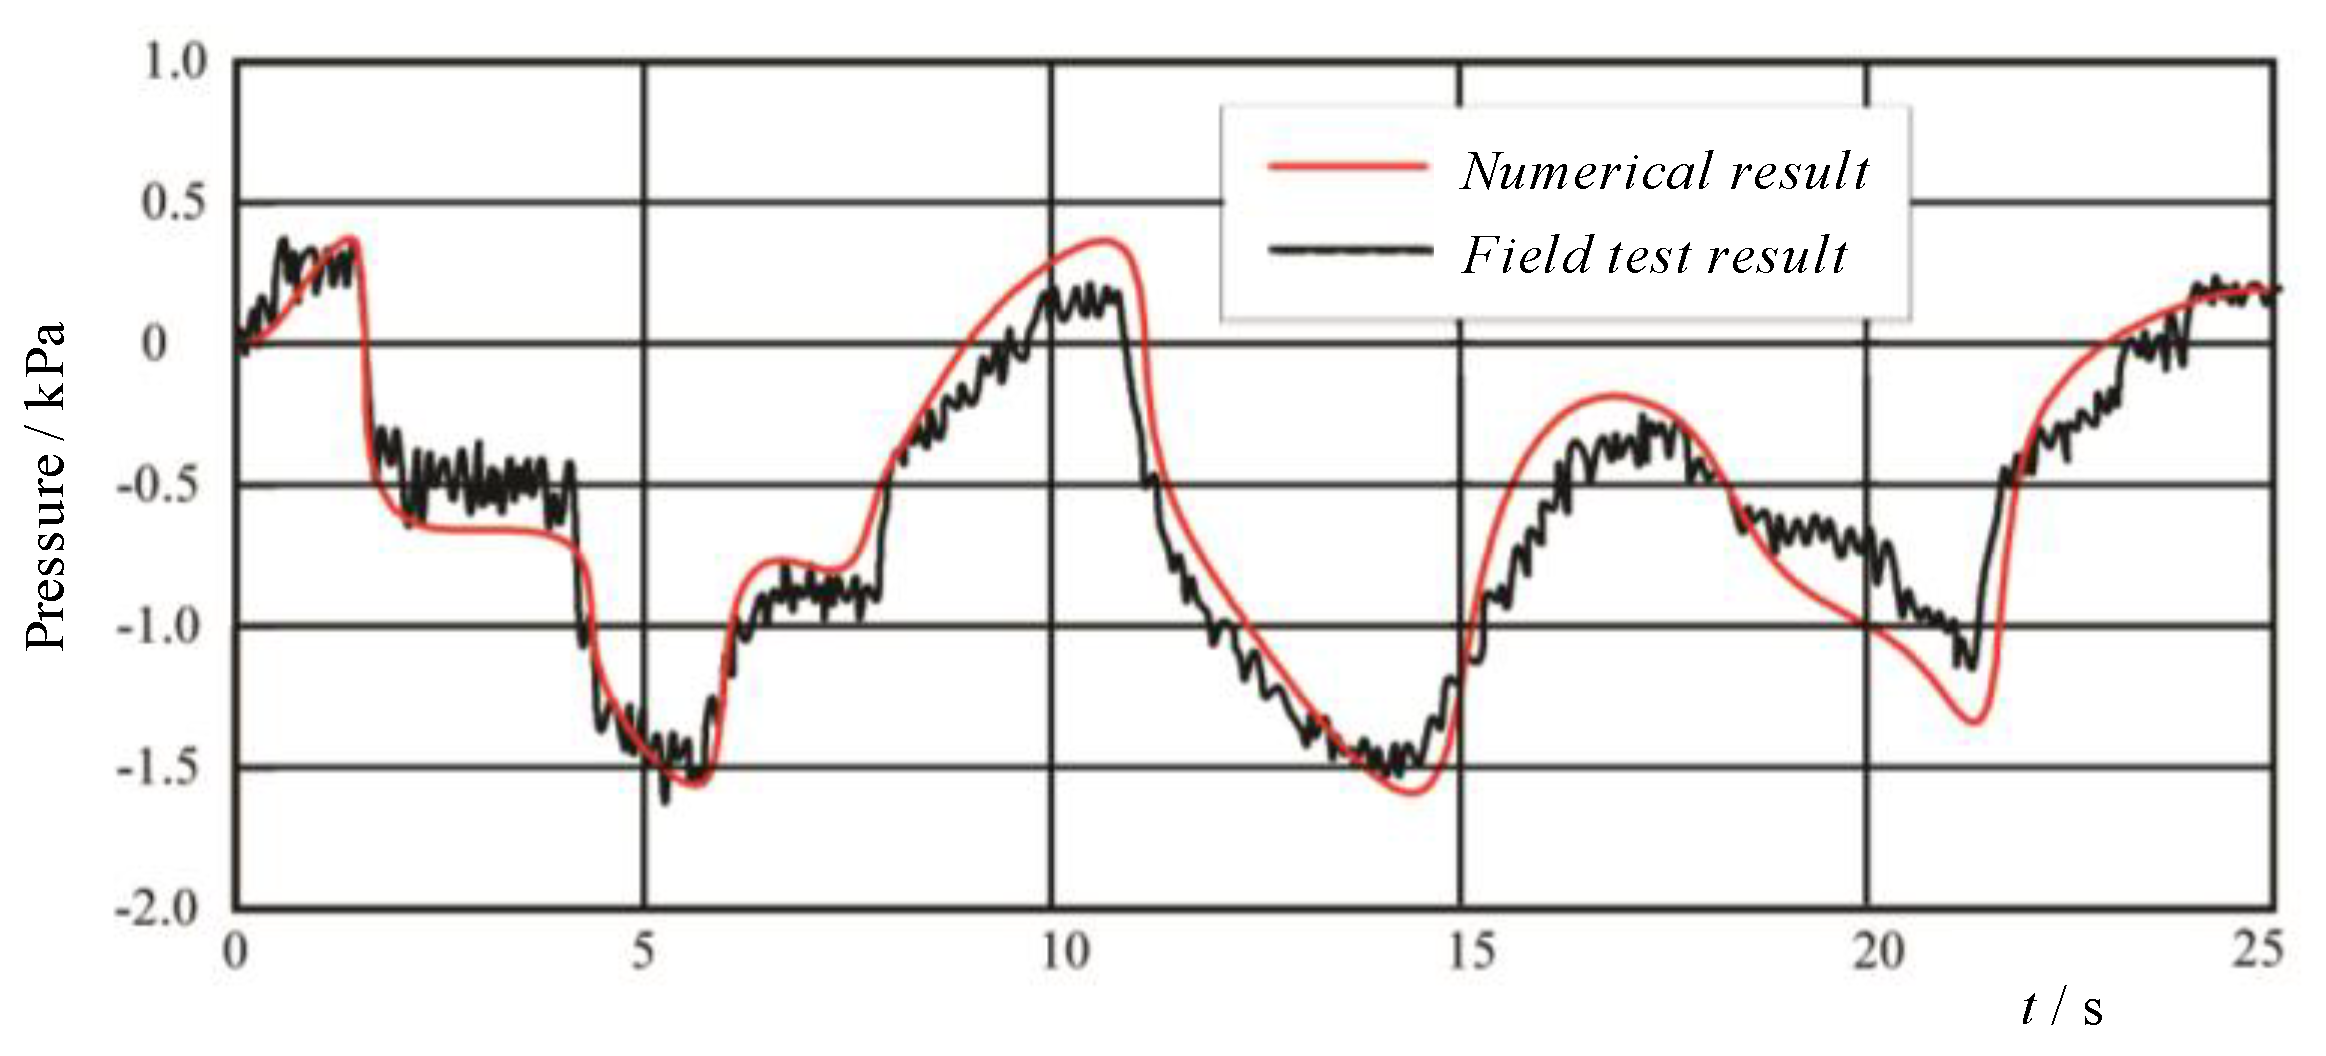
4.3.4. Verification of Aerodynamic Pressure

The transient pressure calculated by the present numerical algorithm was compared with that obtained by the corresponding field test [36,37] to verify the accuracy of the adopted algorithm in this simulation. The length and clearance area of the test tunnel were 1320 m and 60 m2, respectively. A ground–tunnel–ground numerical model with the same tunnel was established to ensure the validity of the verification (Figure 12). The geometric shapes of the train (CRH3) and tunnel in the numerical model were consistent with the field test prototypes. The train speed in this test was approximately 200 km/h, and wind velocity (Vw) was ignored. The monitoring point was located on the outside of the front side window on the head carriage. Figure 13 shows the comparison of the time-history data between the numerical simulation and field test. The waveform shows a remarkable correlation between the two, except for minimal asynchronous time.

5. Aerodynamic Loads and Safety Analysis

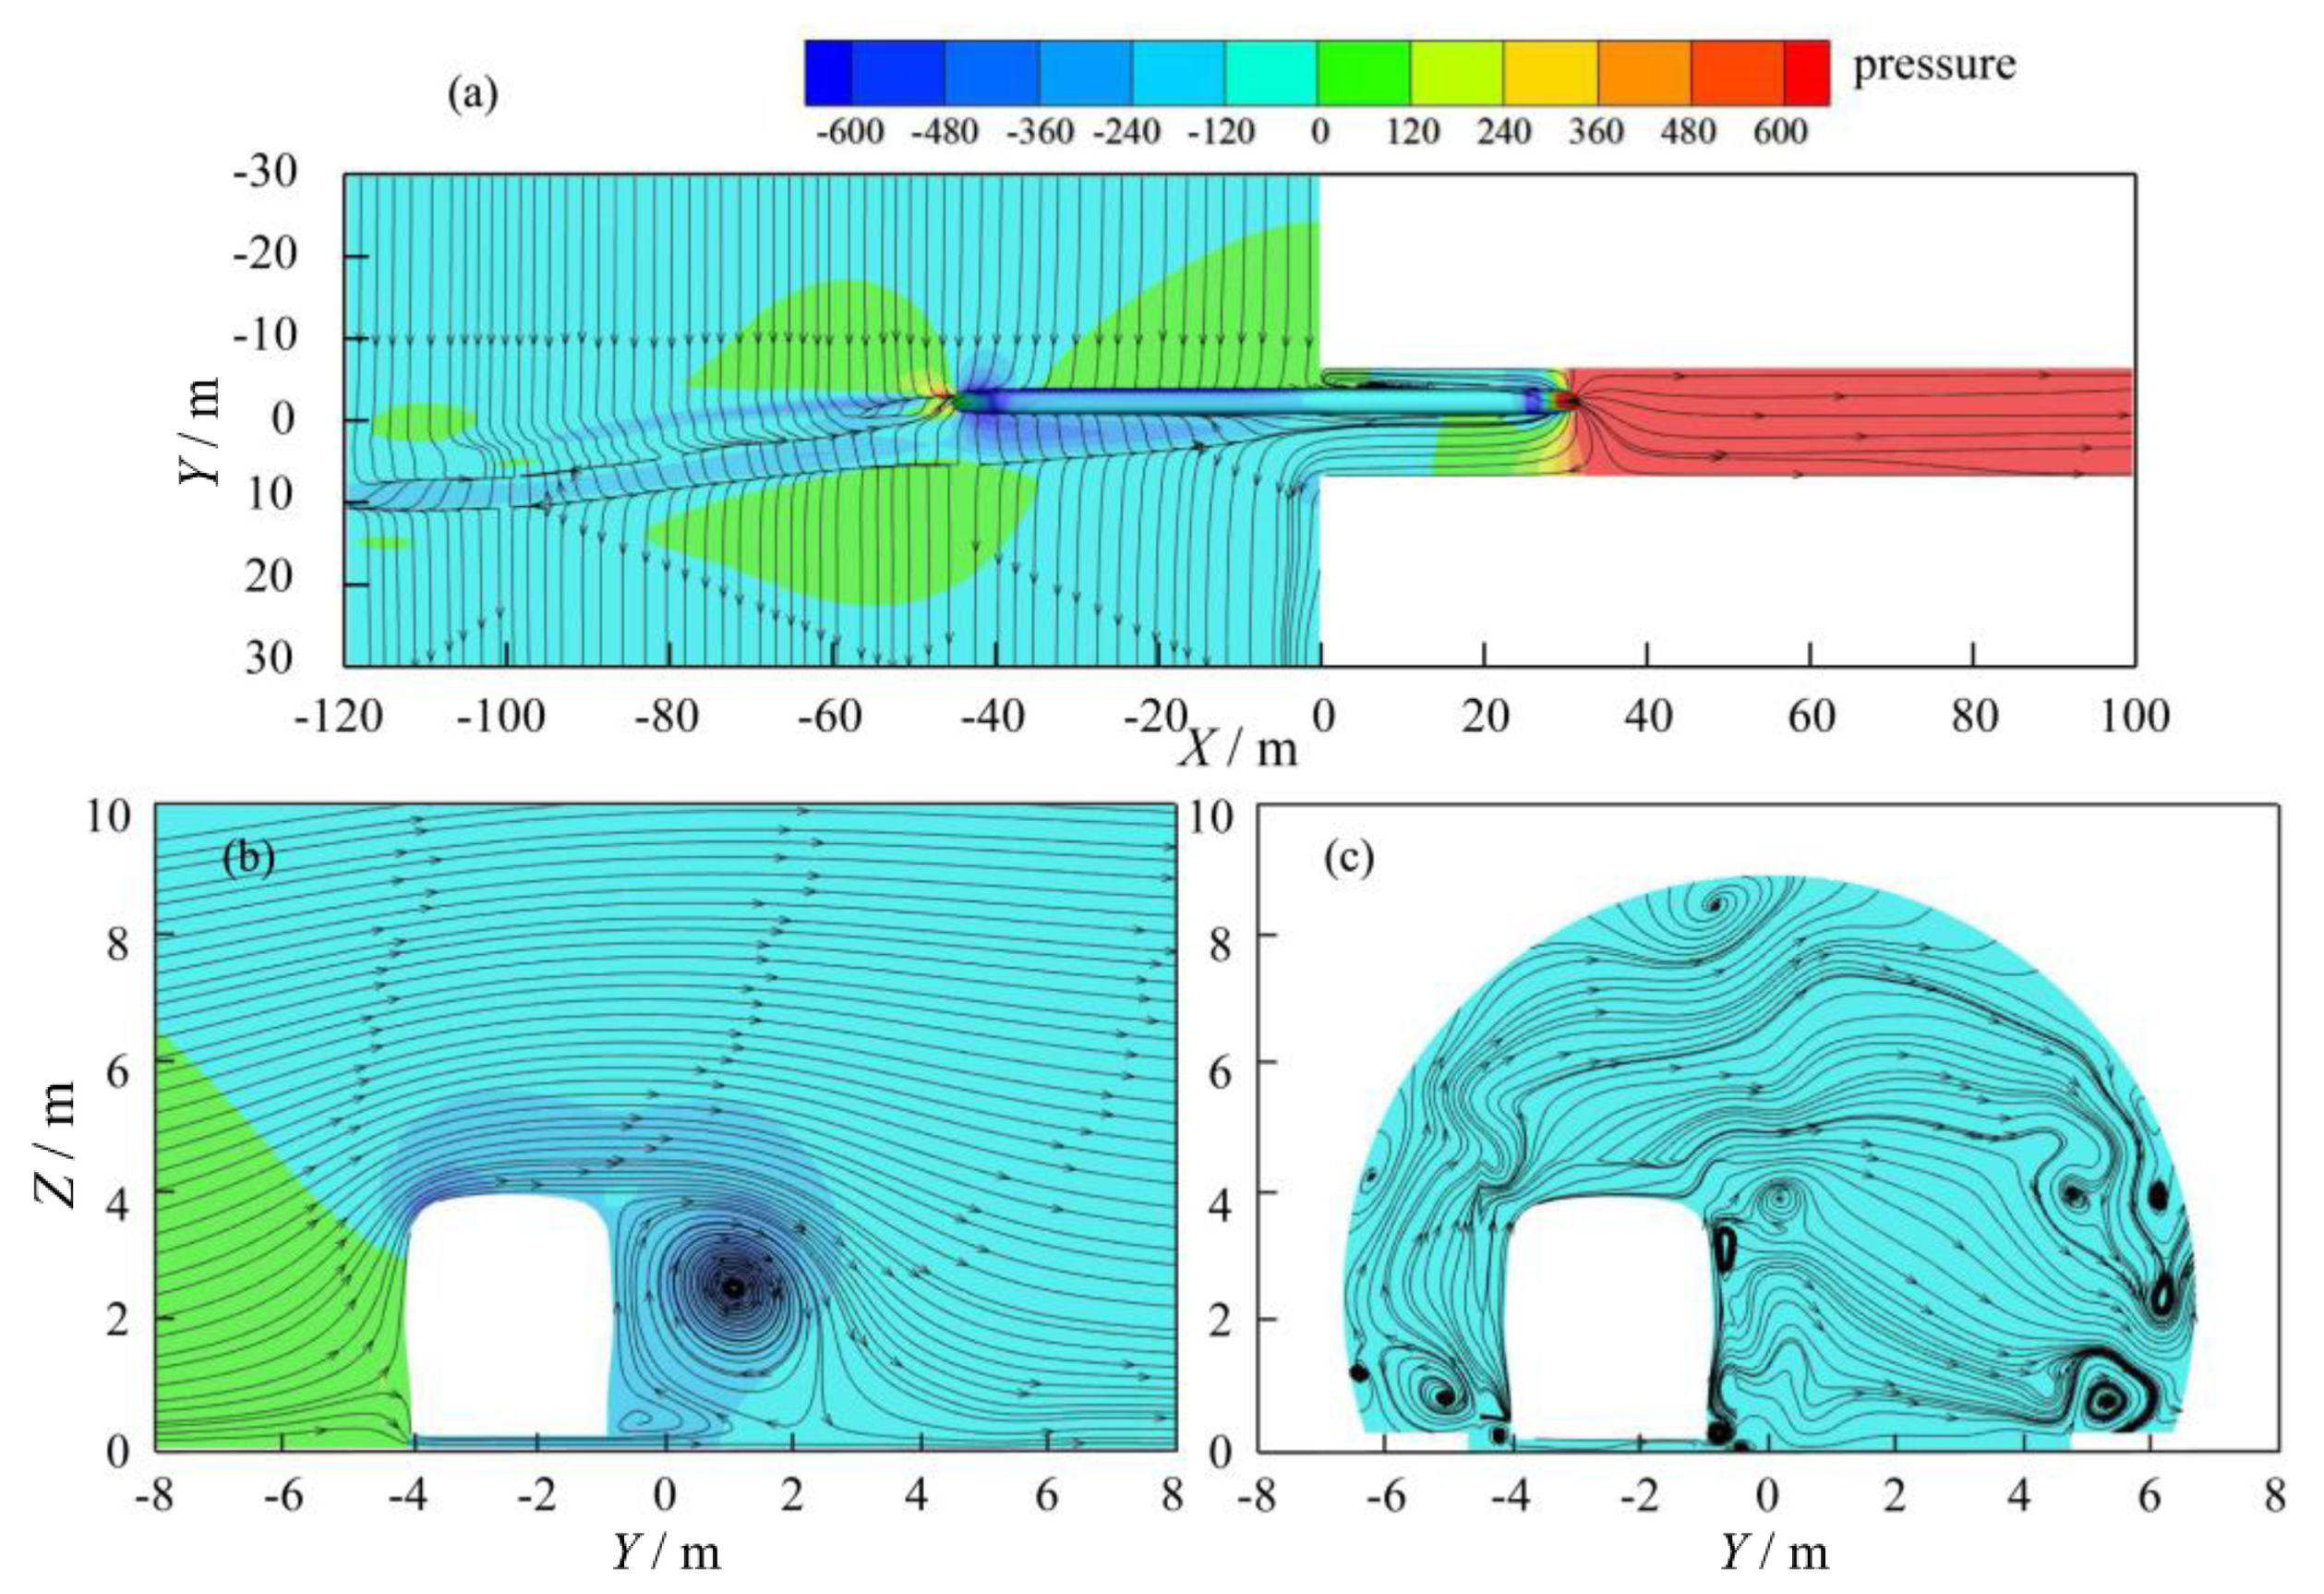
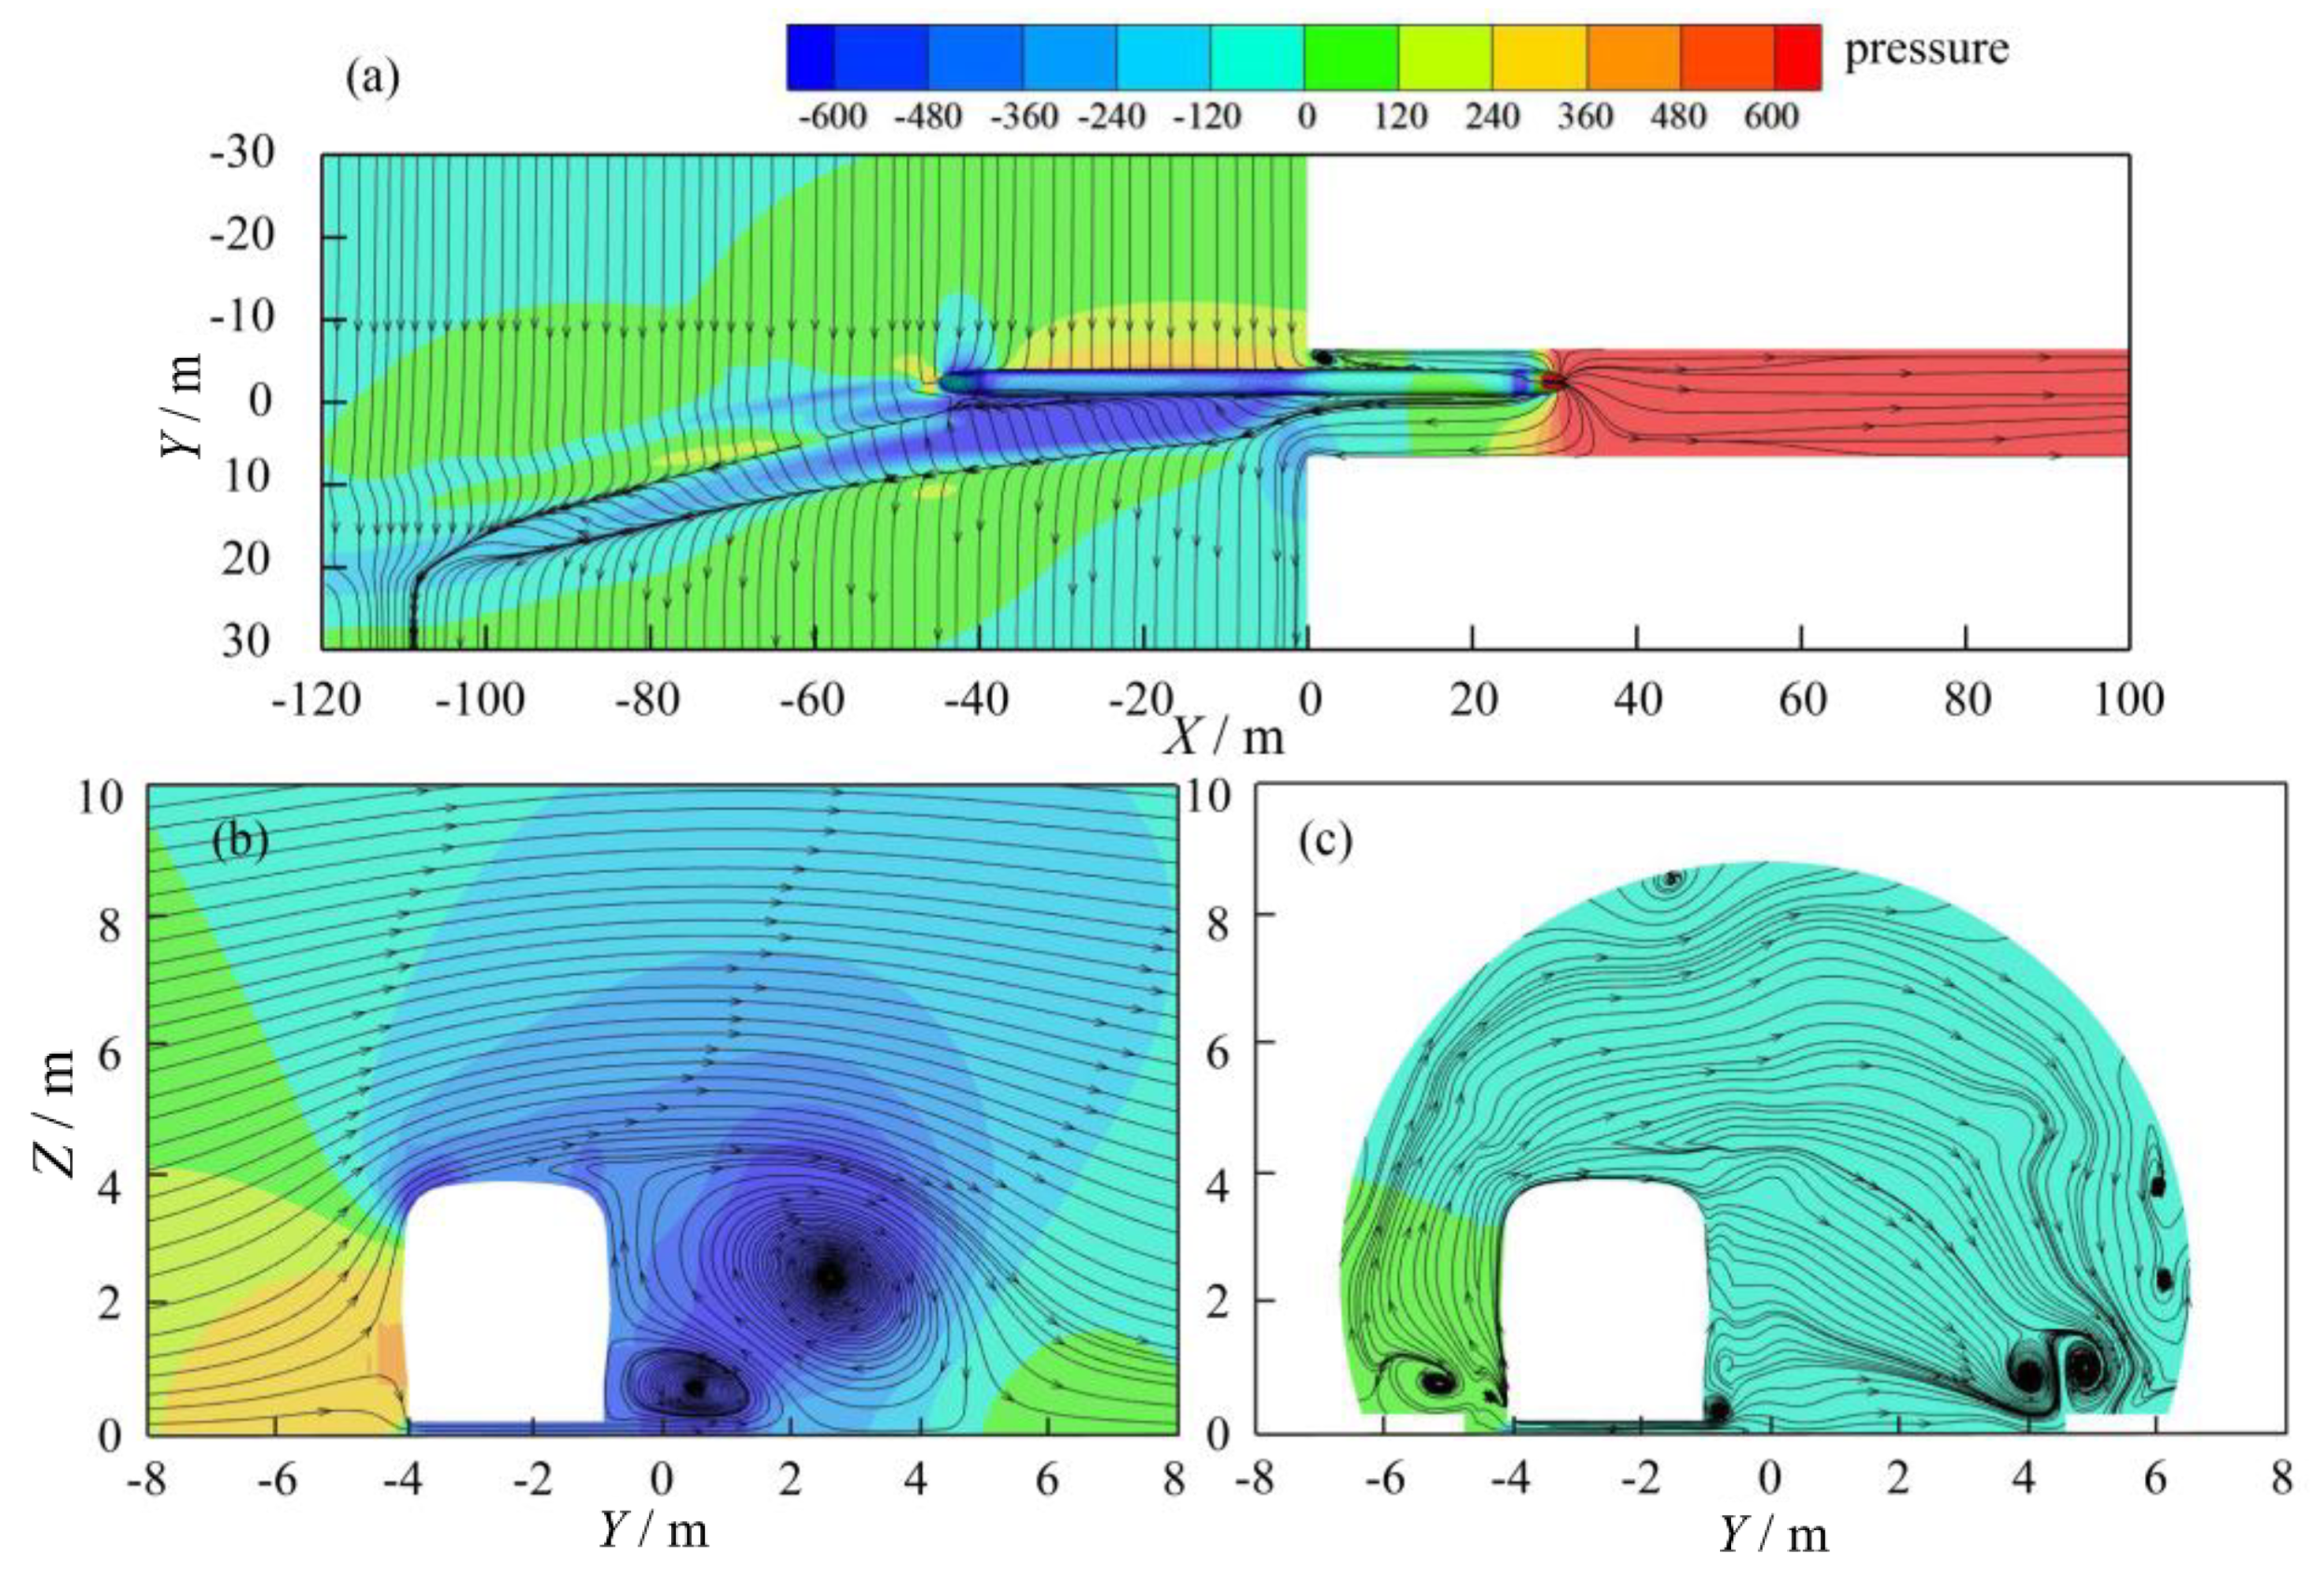
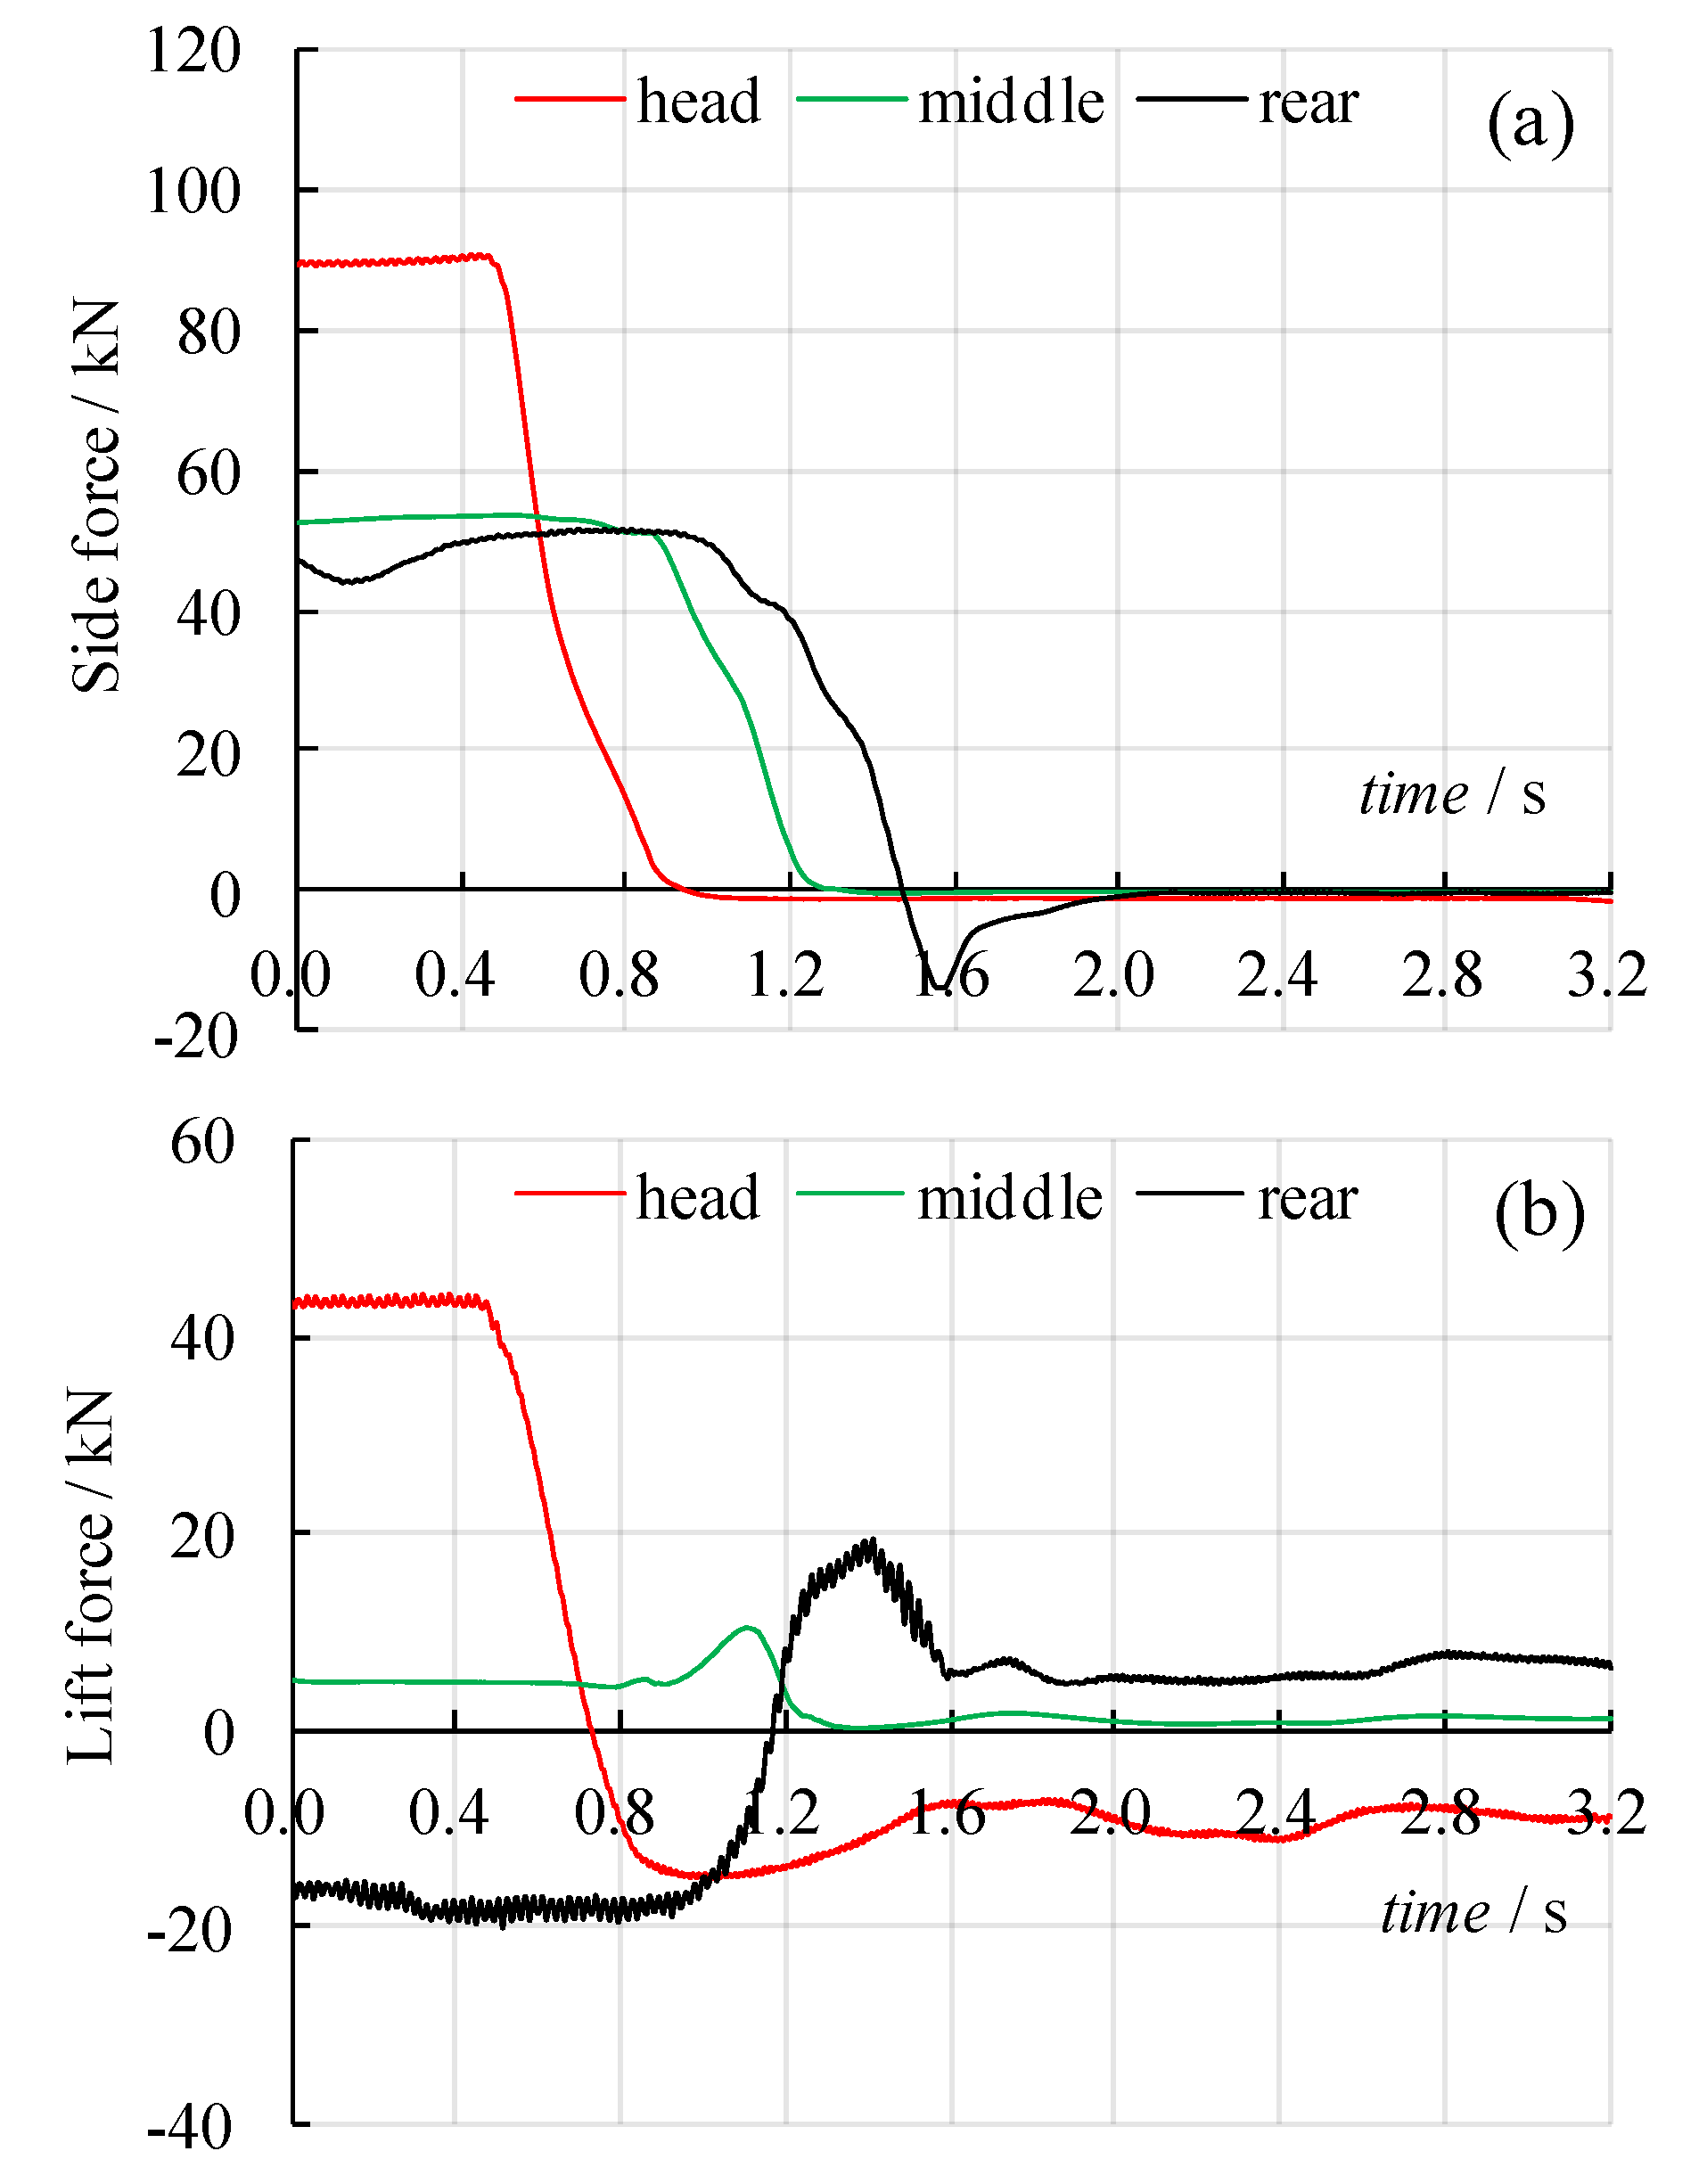
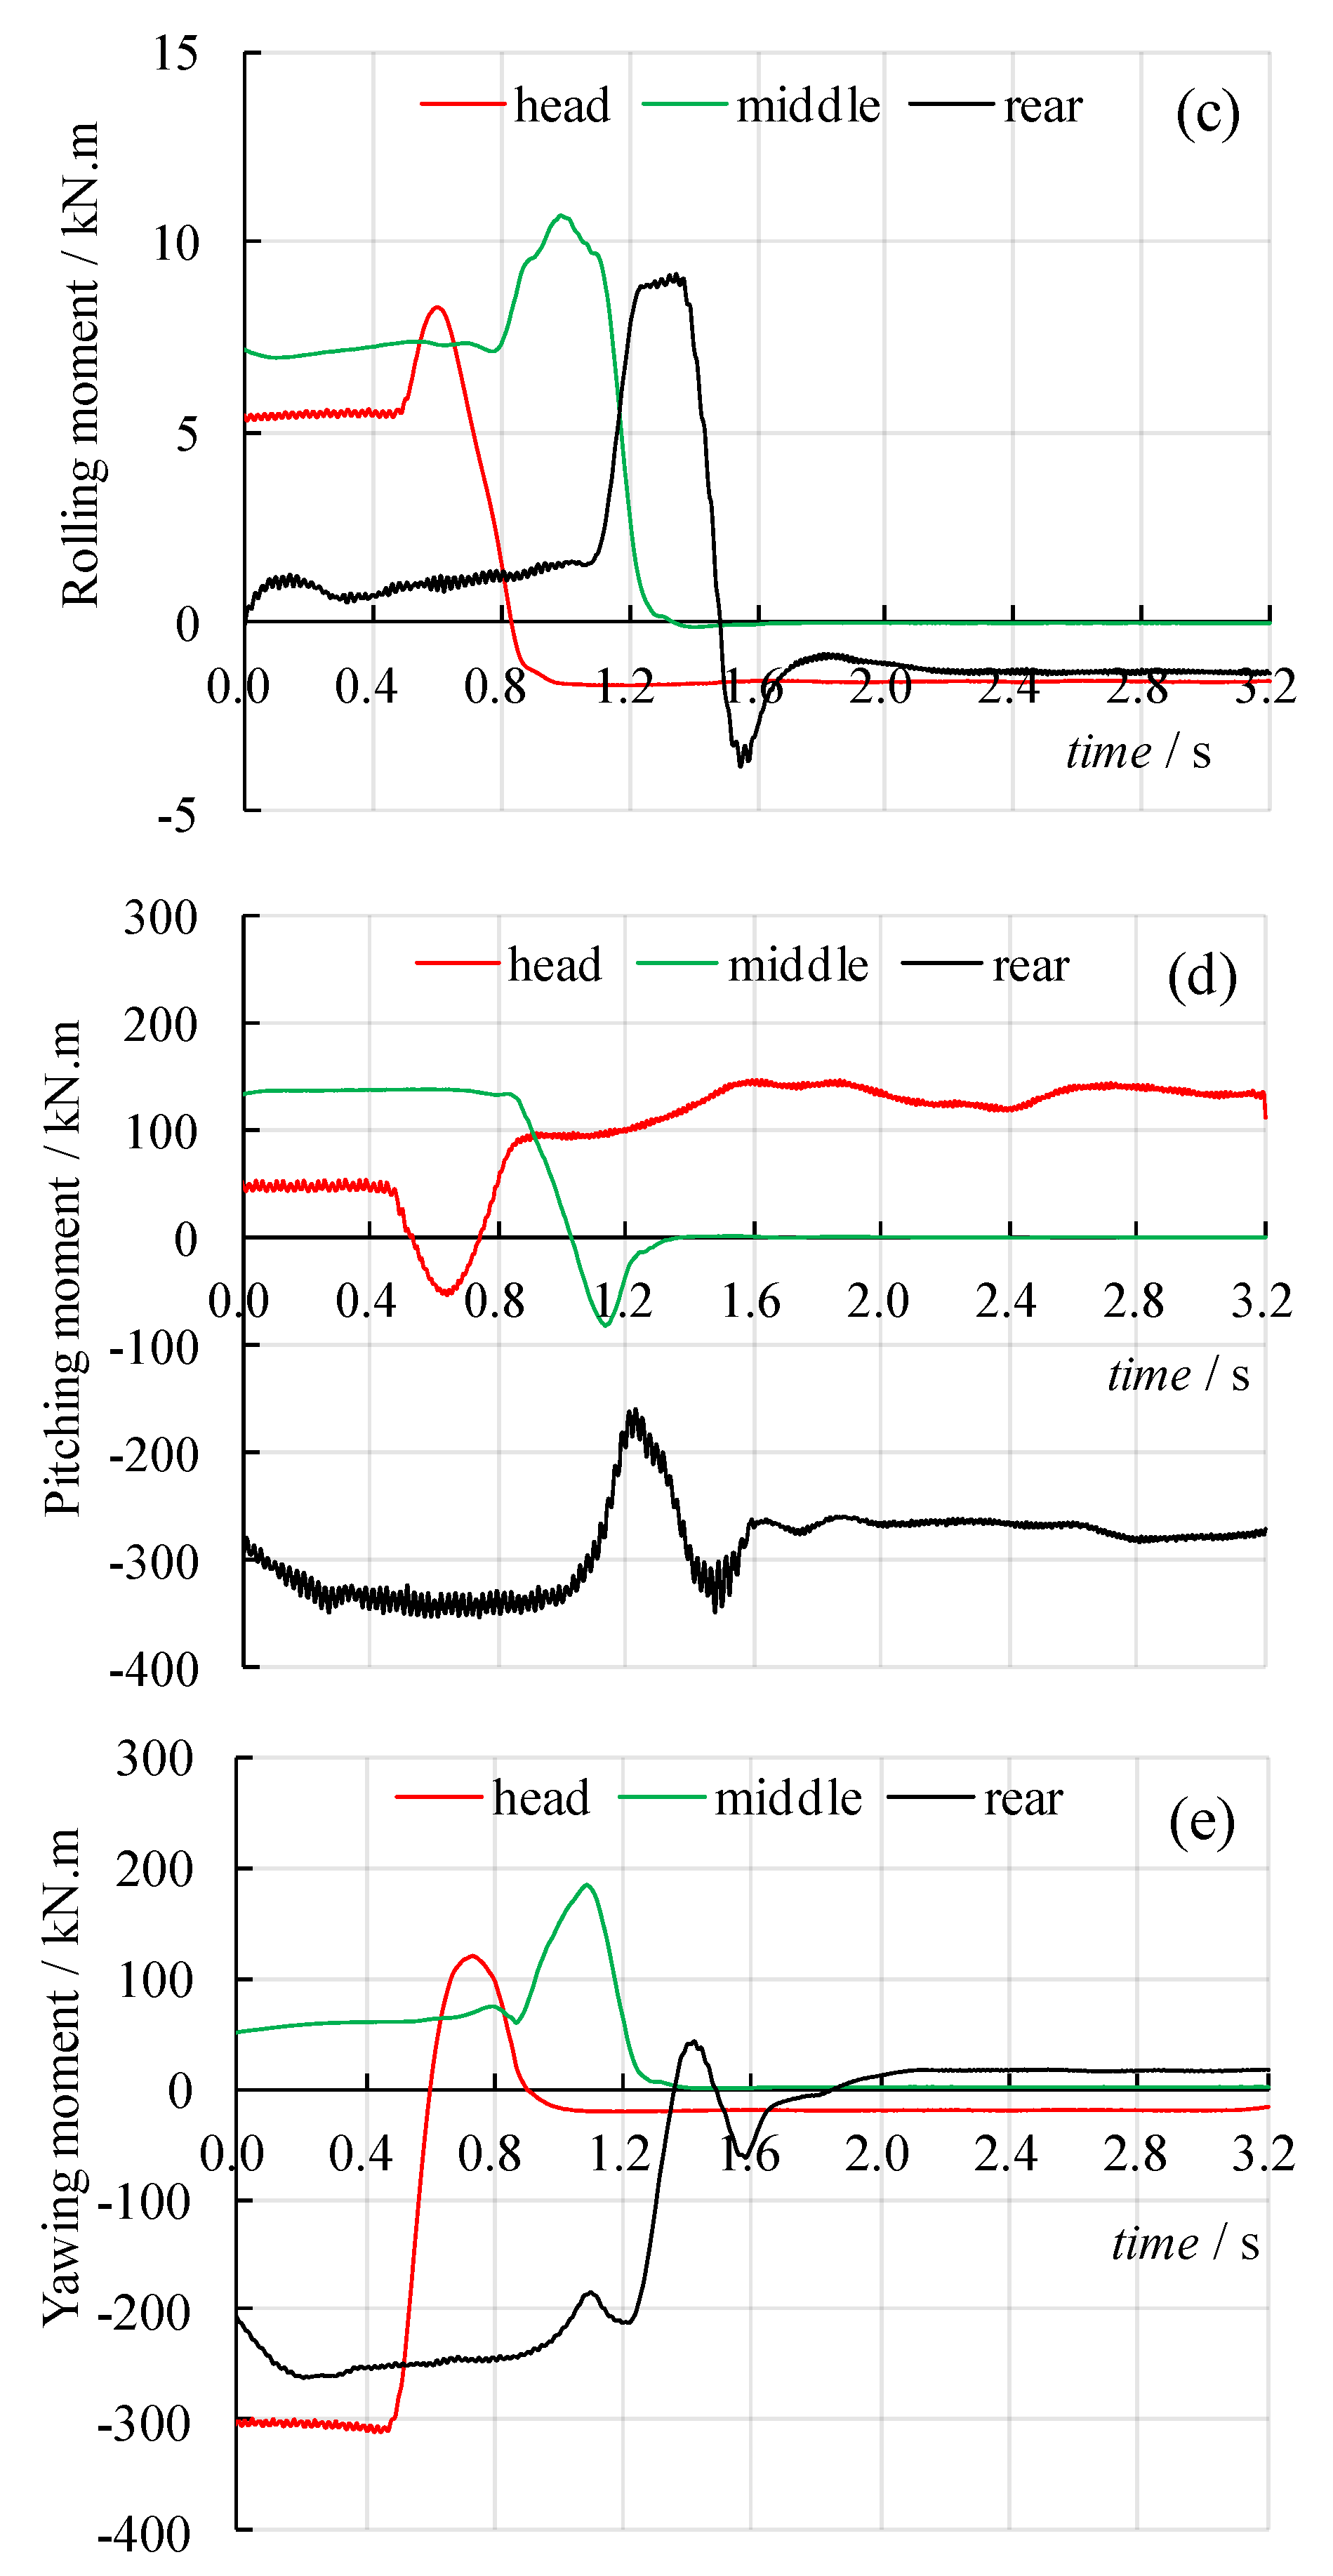
5.1. Flow Structure and Aerodynamic Loads

Figure 14 shows the variations of the pressure and flow structure around the train when approximately half of the middle carriage reached the tunnel entrance for a train speed of 250 km/h and a crosswind speed of 15 m/s, and those at 25 m/s are shown in Figure 15.
Figure 14 shows that in open air, the flow structure showed remarkable asymmetry where crosswind was applied to the train. A series of vortexes considerably originated from the tunnel entrance and stretched to the train tail along the leeward side. The vortexes originated from the tip of the head carriage and stretched far away behind the tip of the rear carriage when the train ran completely outside the tunnel. The vortexes gradually retreated from the entrance as the train went on. In open air, the pressure on the train showed the positive values at the windward side and negative values at the leeward side because of crosswind. Relatively, inside the tunnel, the vortex around the carriage rapidly disappeared, and pressure in both sides of the train showed a basic symmetry. Sudden variations along the longitudinal of flow structures around the train at the tunnel entrance were discovered. During these instances, such a difference of the flow fields between inside and outside the tunnel entrance can explain the sudden variation of aerodynamic forces and moments on the train.
According to Figure 15, the difference of flow fields between the leeward and windward sides of the train outside the tunnel became considerable as the wind speed increased. Figure 15b shows that the two larger vortexes in the leeward side and the pressure difference on both sides of the train increased outside the tunnel. Nevertheless, compared with Figure 14c, there was no substantial change in the flow structure and pressure around the train inside the tunnel (see Figure 15c). Thus, the sudden variation of the aerodynamic forces and moments under condition of higher crosswind velocity may be remarkable.
Figure 16a–e show the time-histories of the five aerodynamic loads (i.e., side, lift forces, and rolling and pitching and yawing moments, respectively) during the train entering the tunnel under conditions of train speed = 250 km/h and crosswind velocity = 25 m/s. The red, green, and black lines represent the head, middle, and rear carriages, respectively.
Figure 16 shows that the five aerodynamic loads of the three carriages all characterized a sudden variation when entering tunnel. For example, the side force, regardless of the head, middle, and rear carriages, showed a dramatic decrease (see Figure 16a). For the lift force, except for the head carriage, both the middle and rear carriages showed an upward shock (see Figure 16b). This phenomenon may be attributed to the jet flow, which was exhausted outside the entrance along the hoop space between the train body and the tunnel. The hoop space, which was larger in the train top side than the bottom, was asymmetrical in the vertical direction, thereby causing the aerodynamic pressure on the bottom of the train to be larger than that on the top. Such a phenomenon mainly occurred in open air approximately 20 m away from the tunnel entrance. Therefore, the impact caused by the jet flow did not affect the side and lift forces of the head carriage.
For the aerodynamic moments, the variation characteristic of the rolling moment was similar to that of the yawing moment. Once the corresponding carriages entered the tunnel, they all had a positive peak (see Figure 16c,e). The reason for the overshoot of the yawing moment was the pressure difference on both sides of the train changes, significantly along the longitudinal side, as that part of the carriage was shielded from the crosswind by the tunnel, while the overshoot of the rolling moment may have also attributed to the jet flow. The double-track tunnel adopted in the simulation caused the center of the train not to coincide with that of the tunnel. The aerodynamic impact pressure caused by jet flow in the near-wall side was larger than that in the tunnel center side. In addition, the flow structure of jet flow presented a laminar flow on the tunnel wall side and a turbulent flow on the tunnel center side. The pitching moment of the head and middle carriages presented a downward pulse successively when entering the tunnel (see Figure 16e). While in the corresponding process, the pitching moment of the rear carriage appeared as upward and downward pulses successively in the time interval of about 0.3 s.
To sum up, except for the side and lift forces of the head carriage, the remaining aerodynamic loads all showed upward or downward impulses when entering the tunnel, which may have been a key factor threatening the safety of the train traffic. However, the variation amplitudes of aerodynamic side force, lift force, and the yawing moment of the head carriage were greater than those of the middle and rear carriages. The safety risks of the three carriages still need further discussion in the next section.

5.2. Safety Analysis

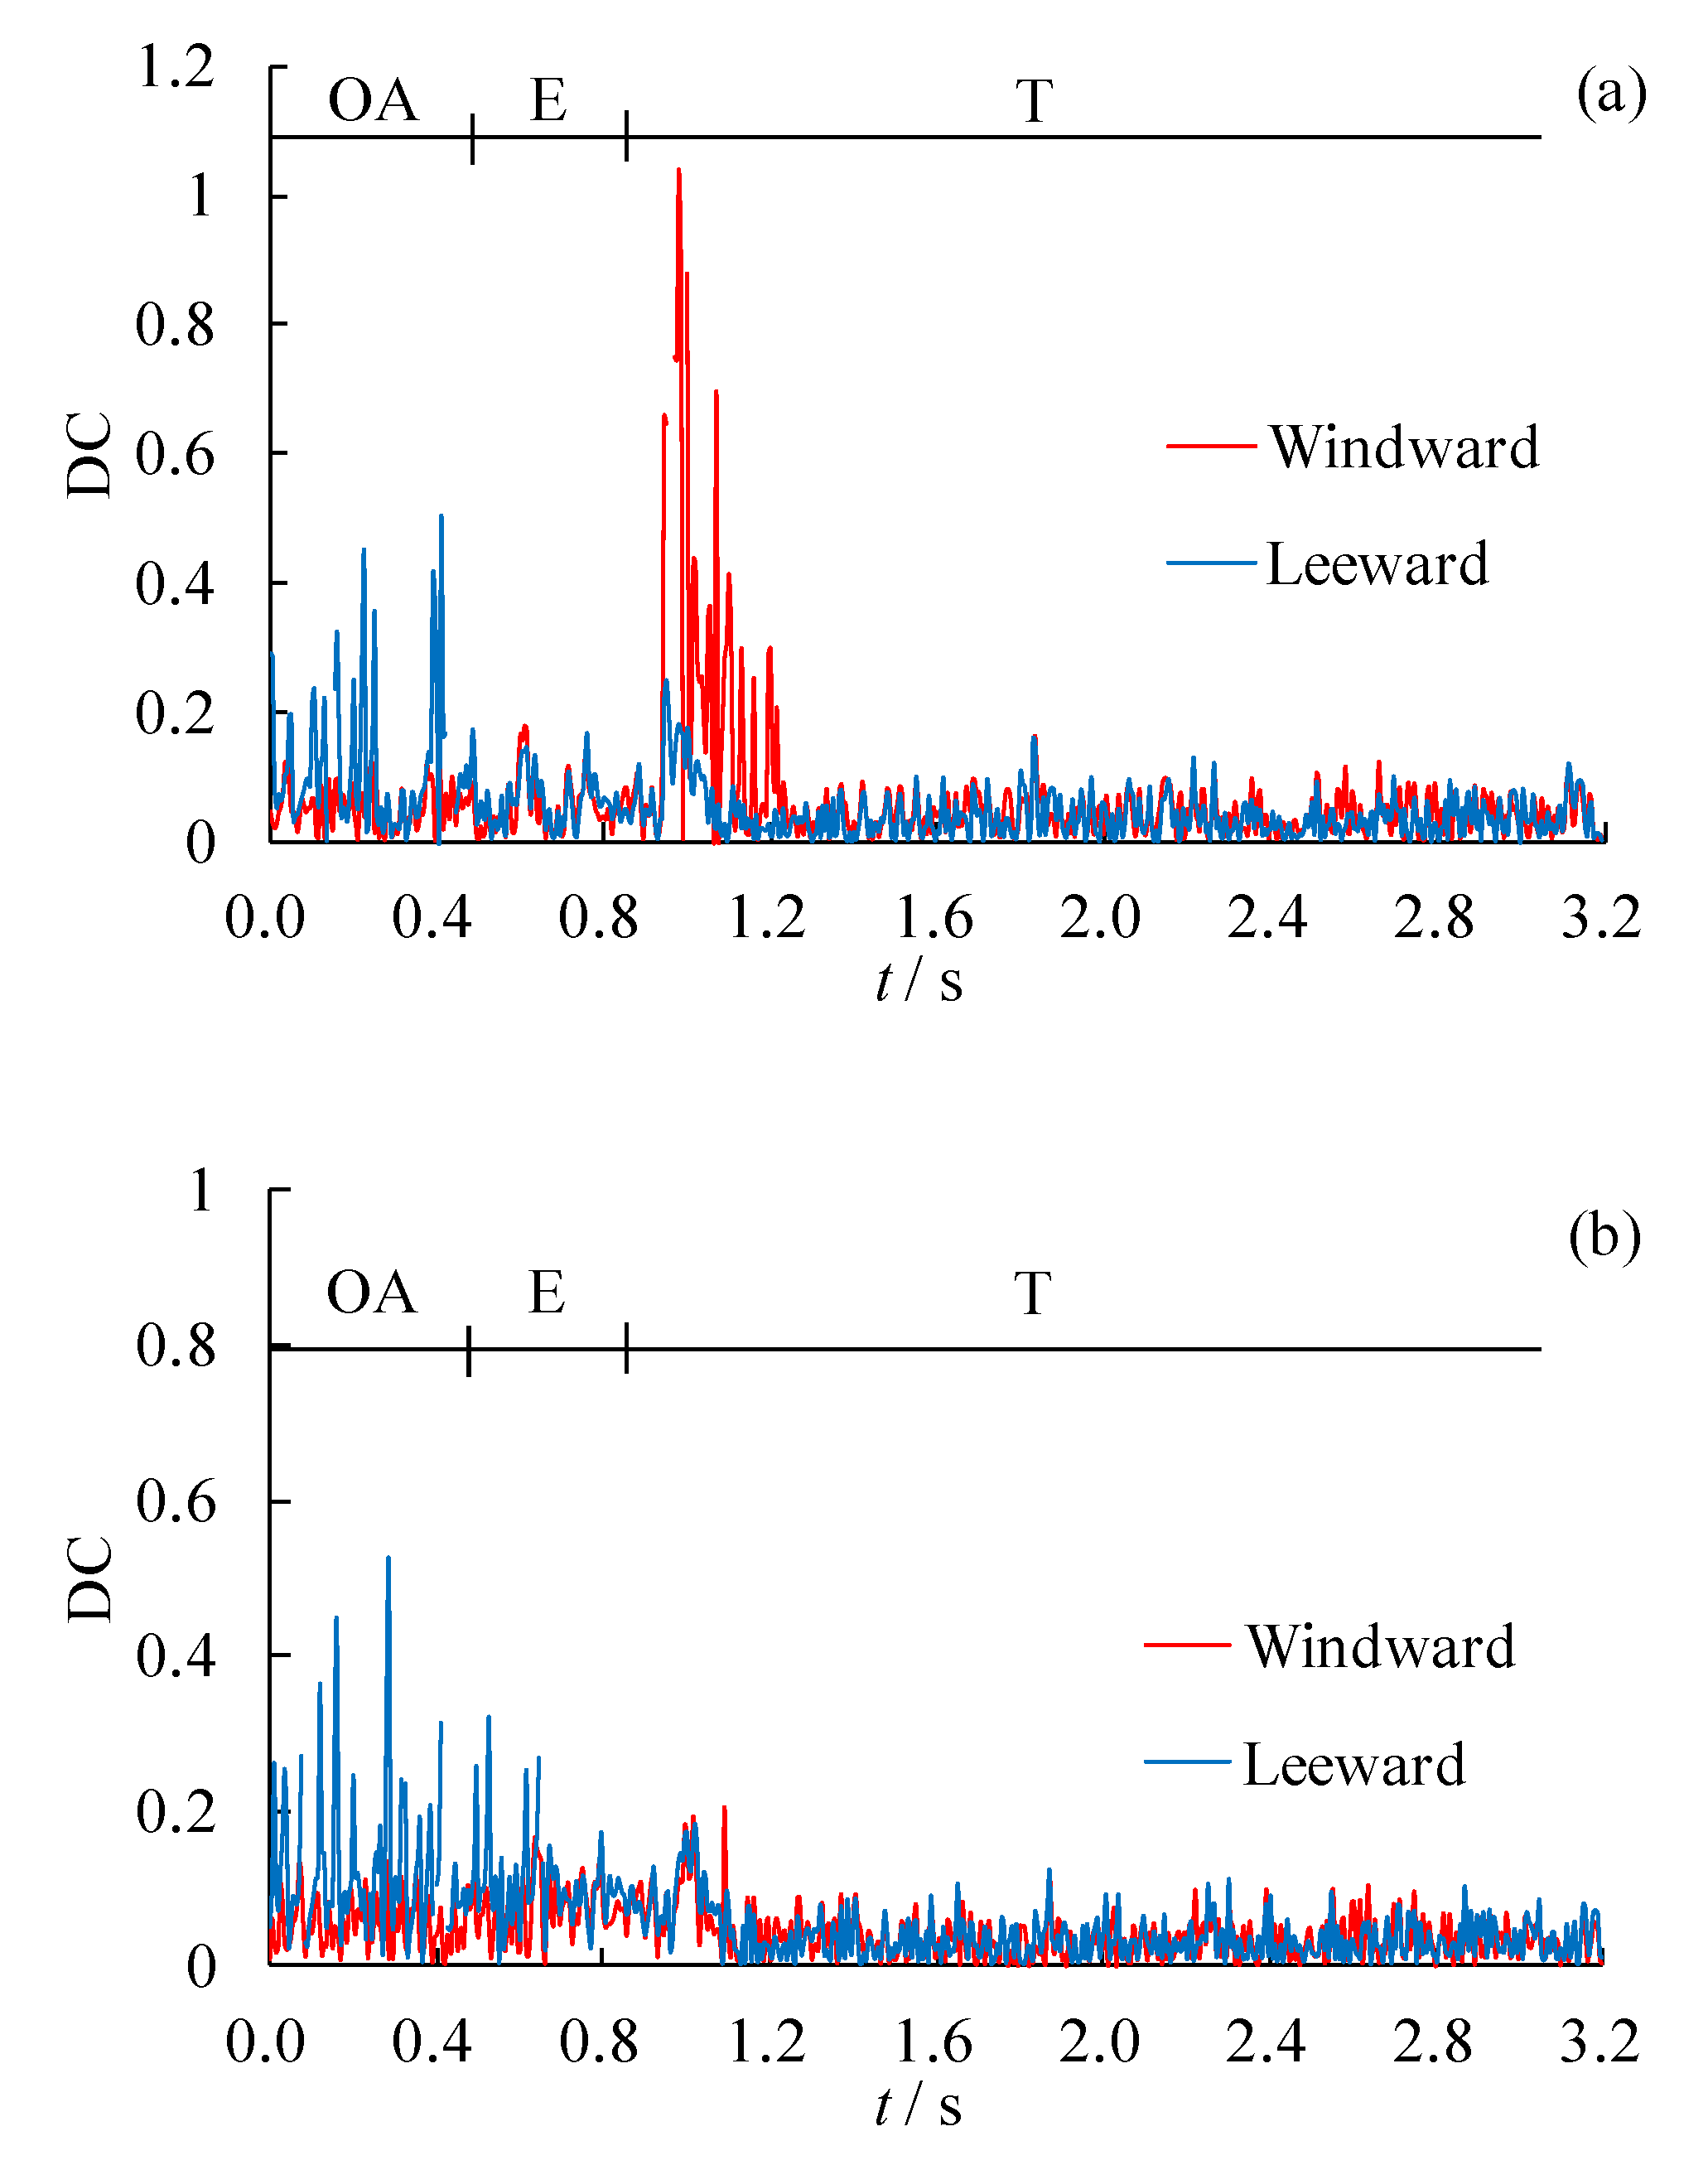
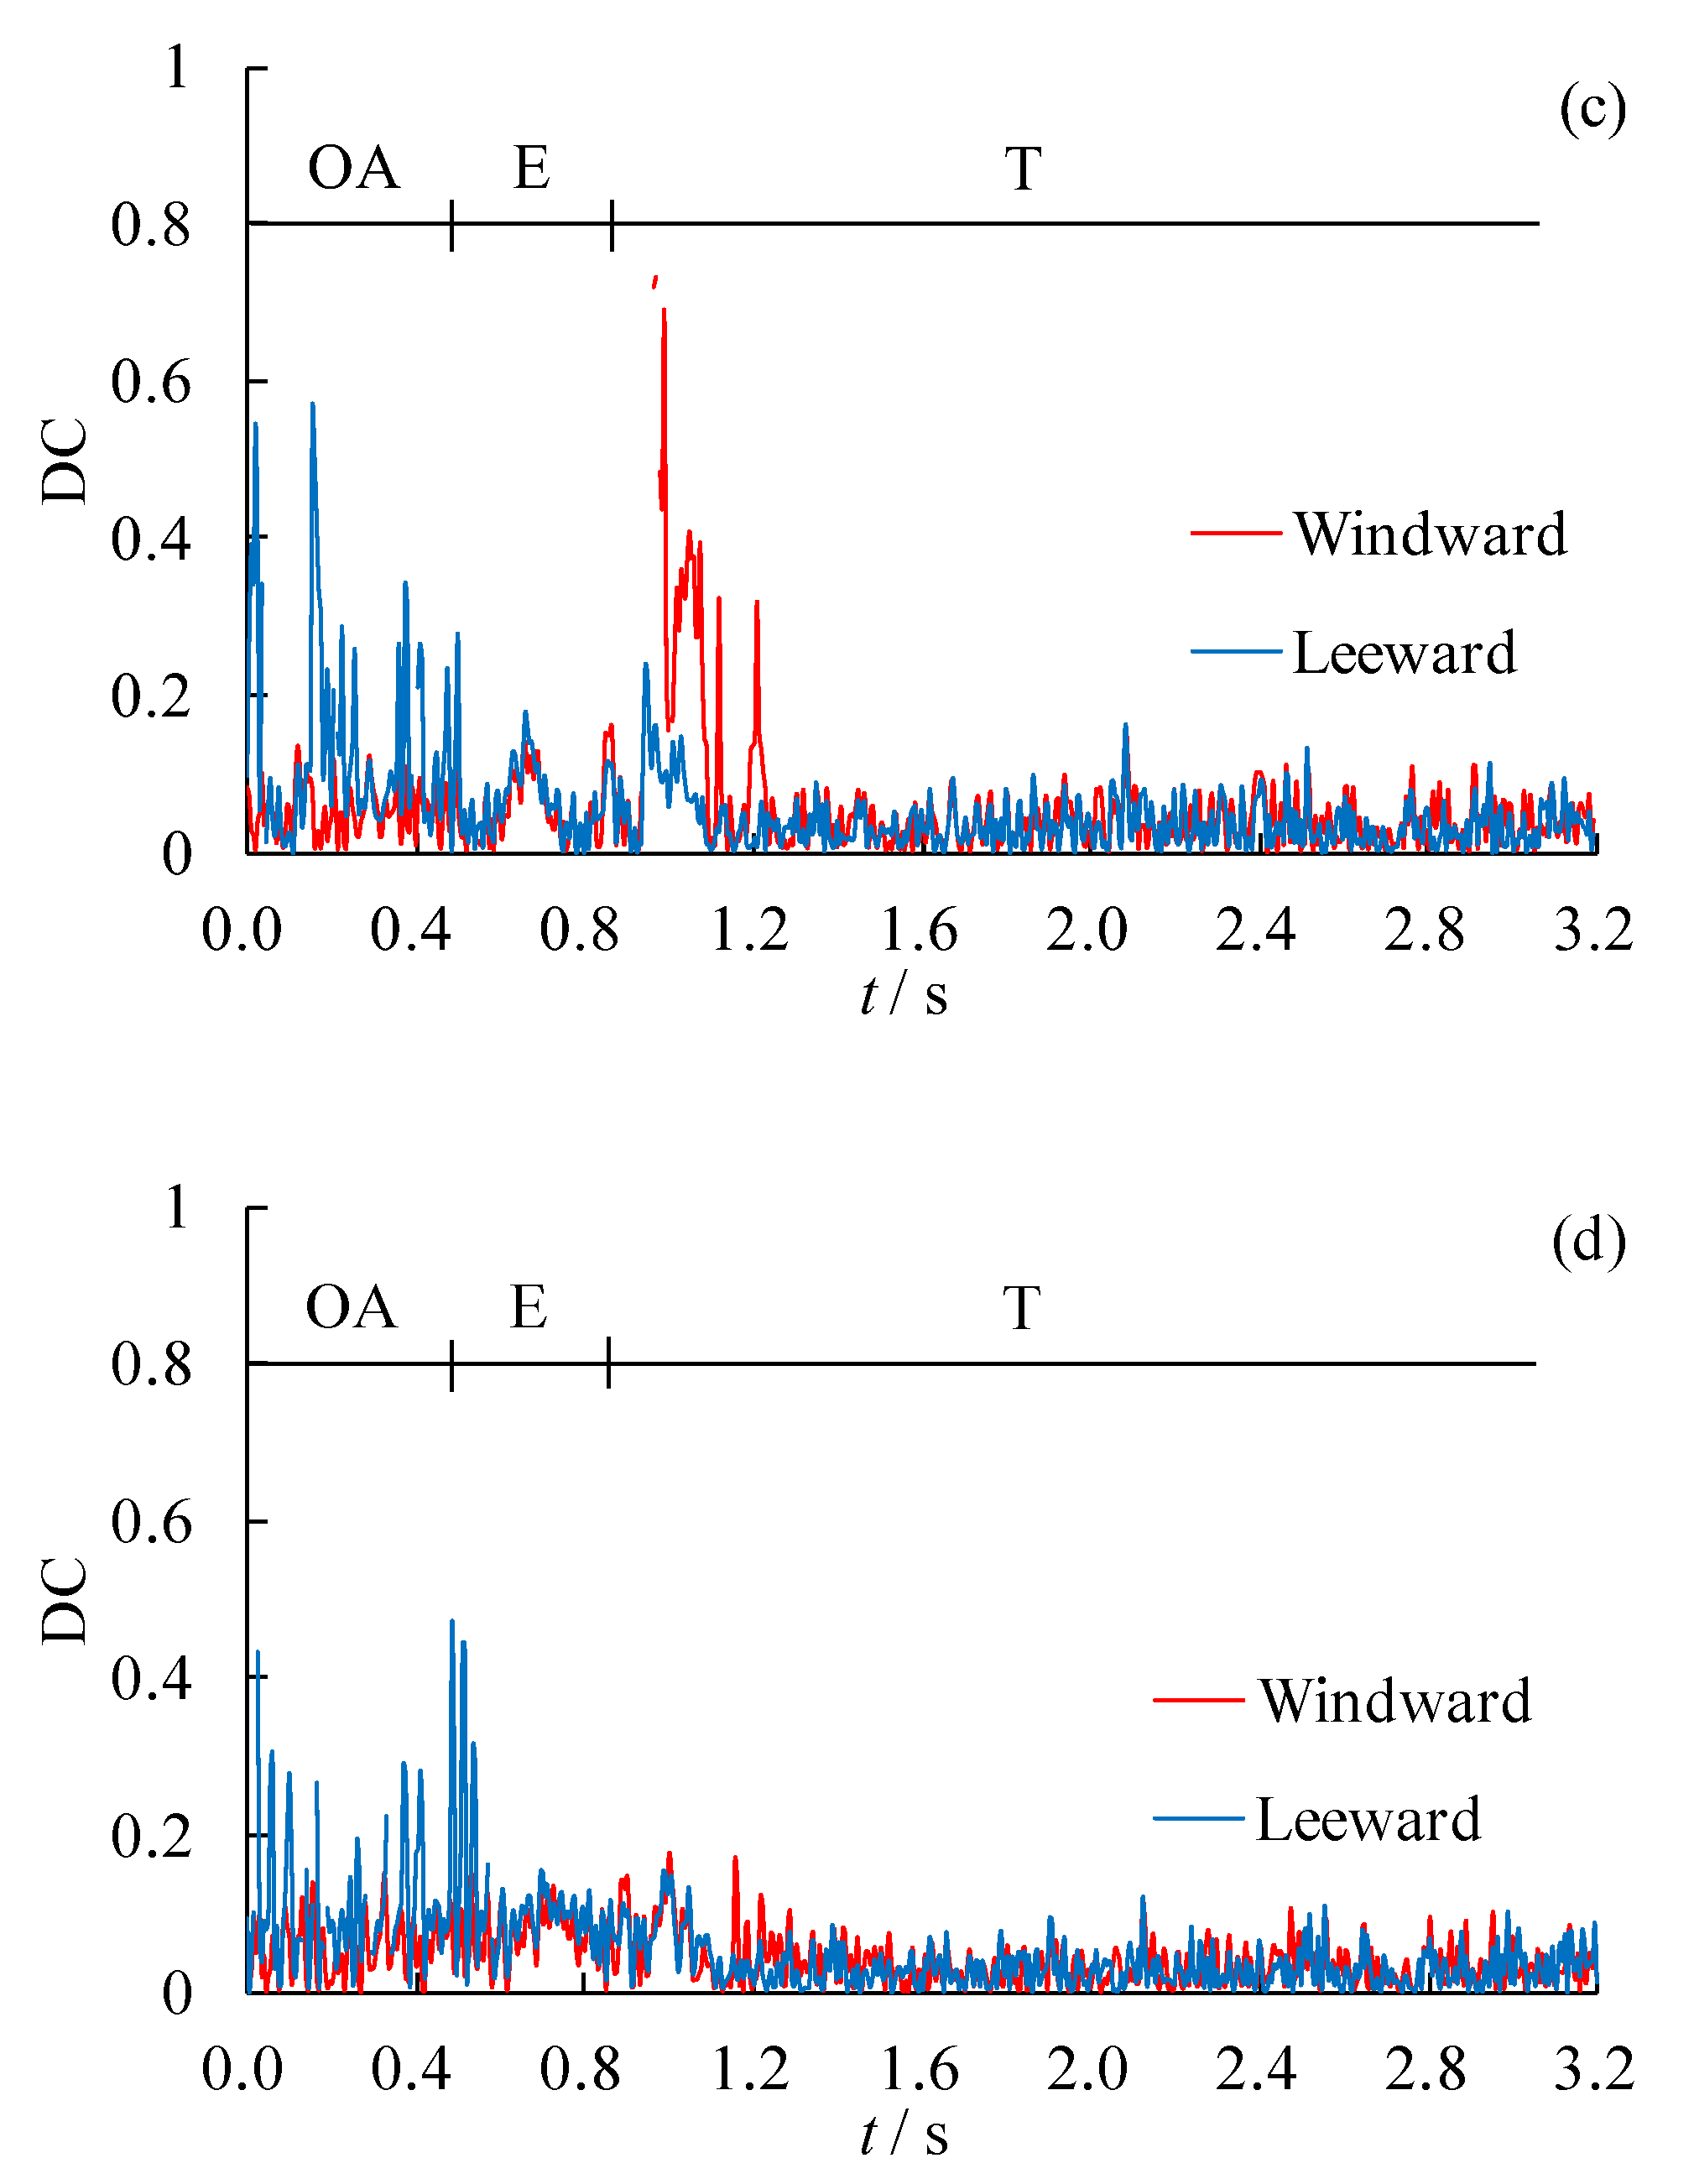
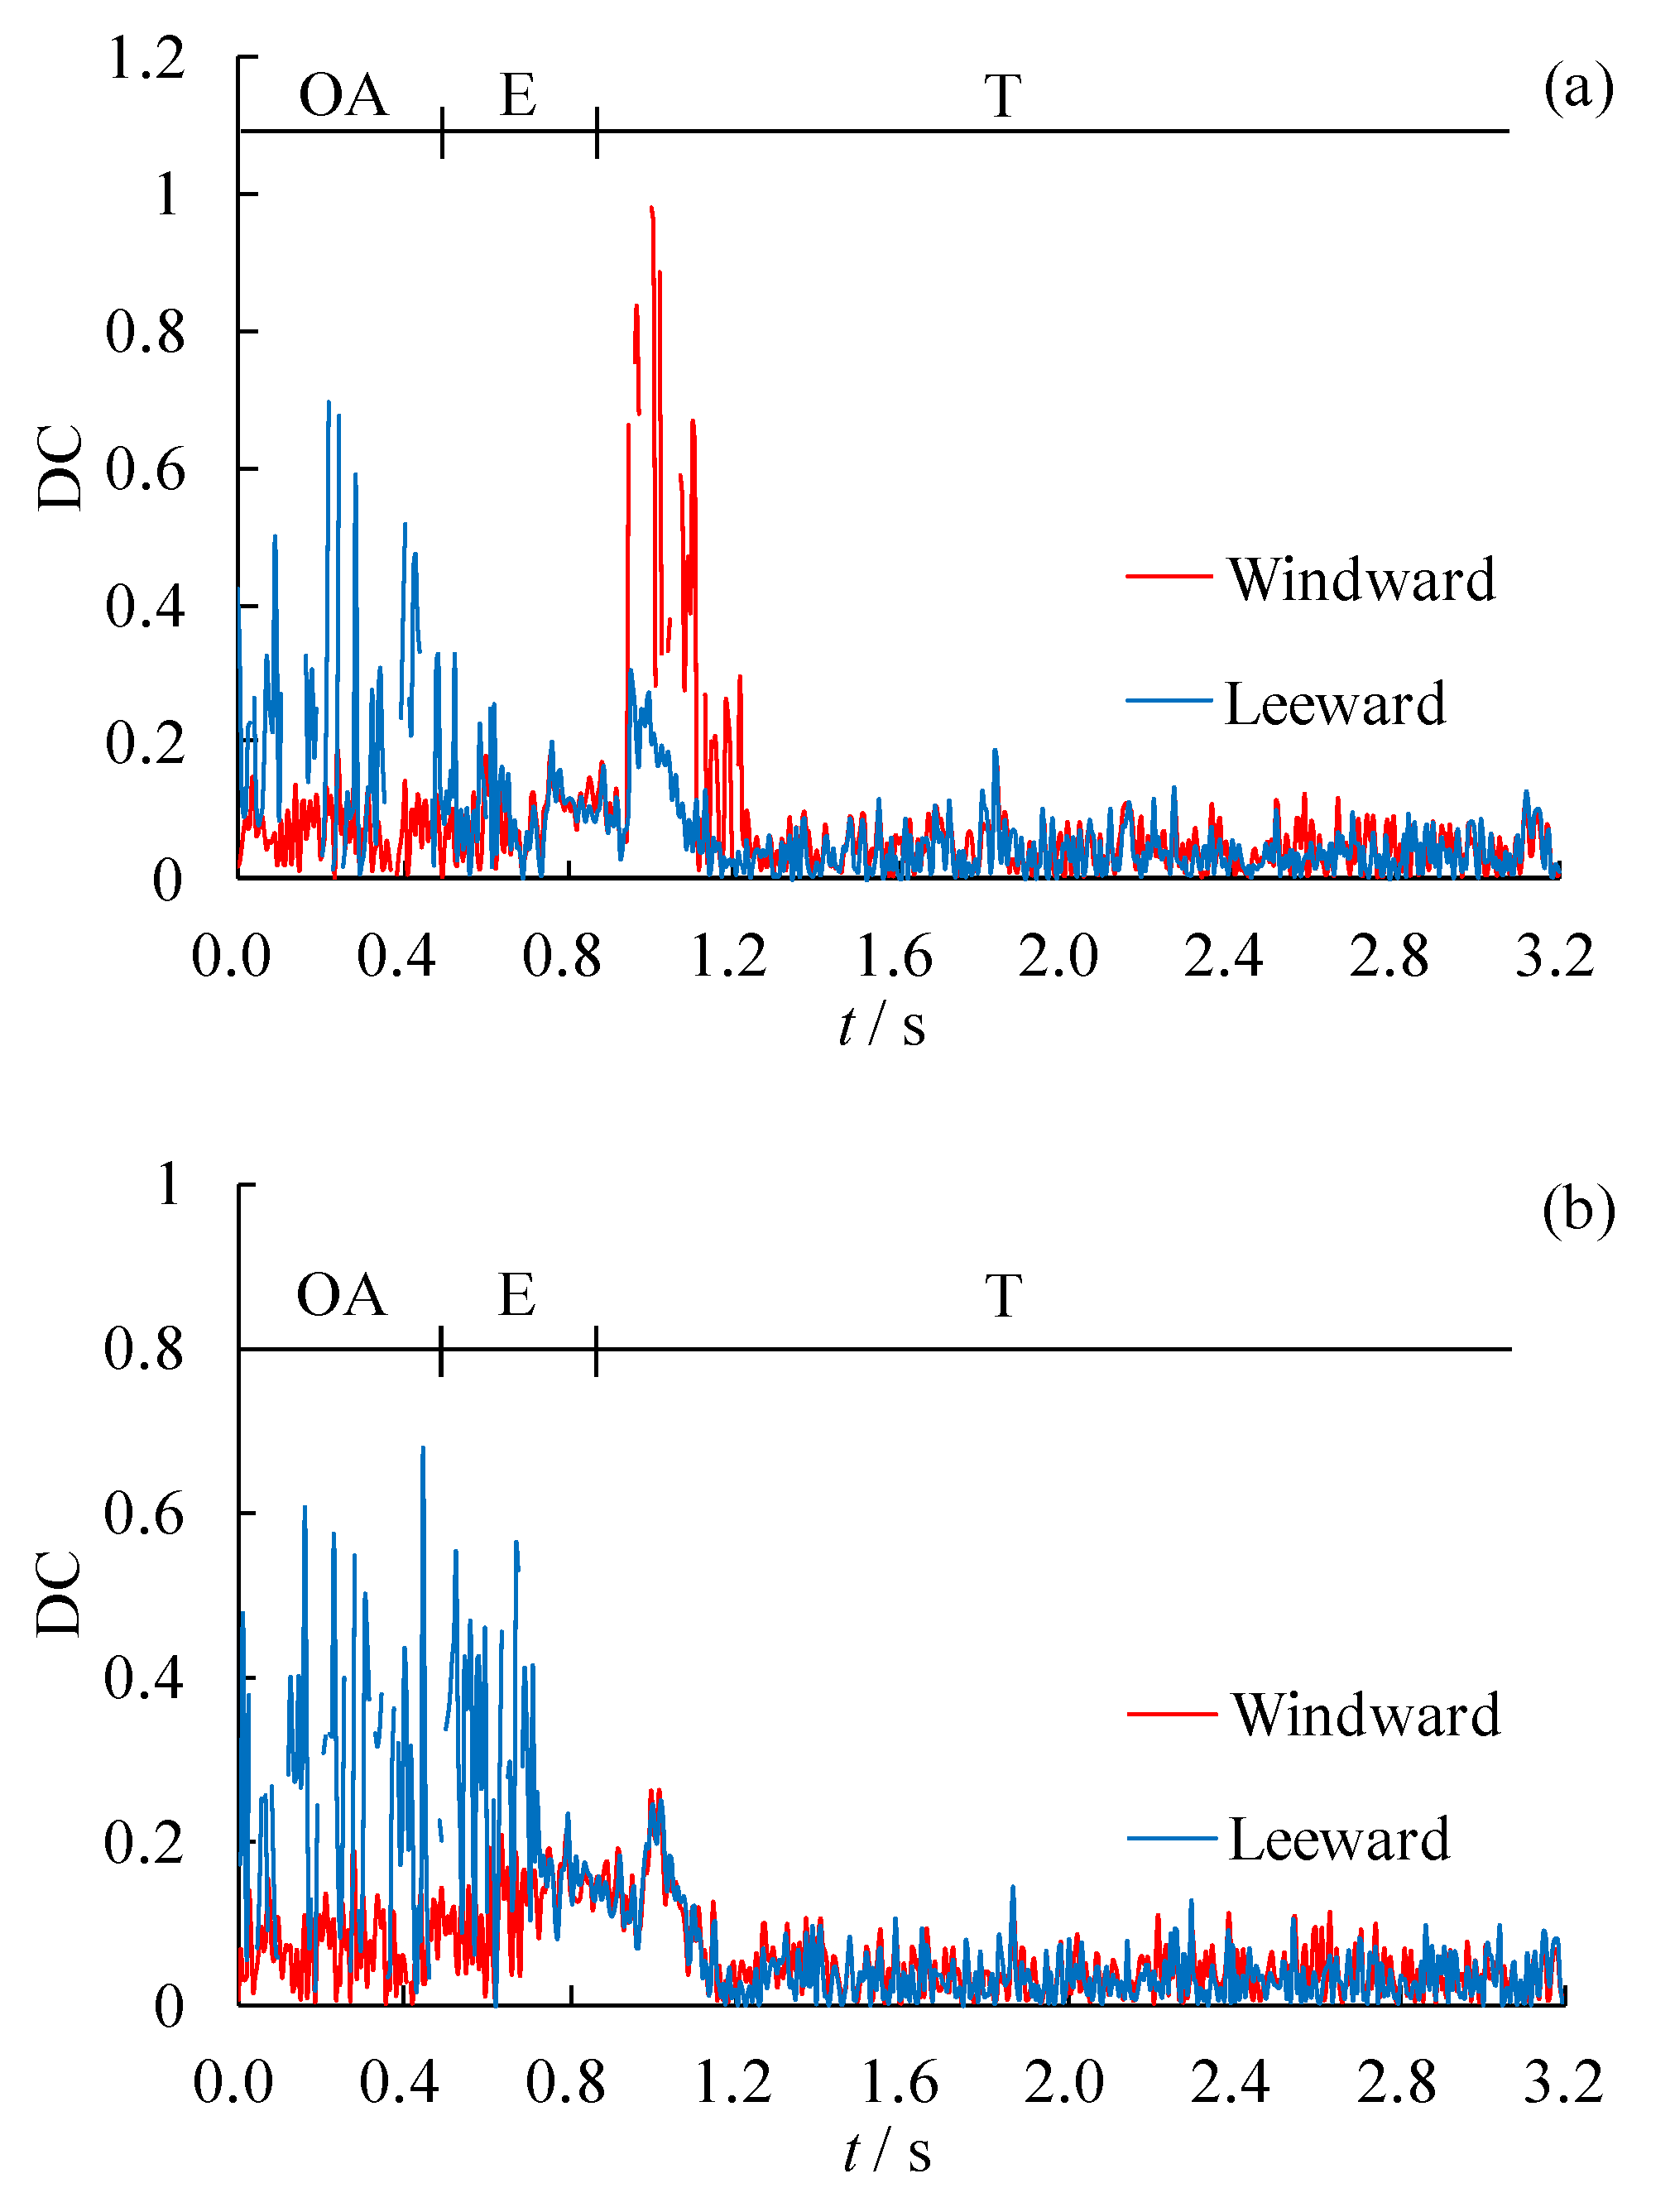
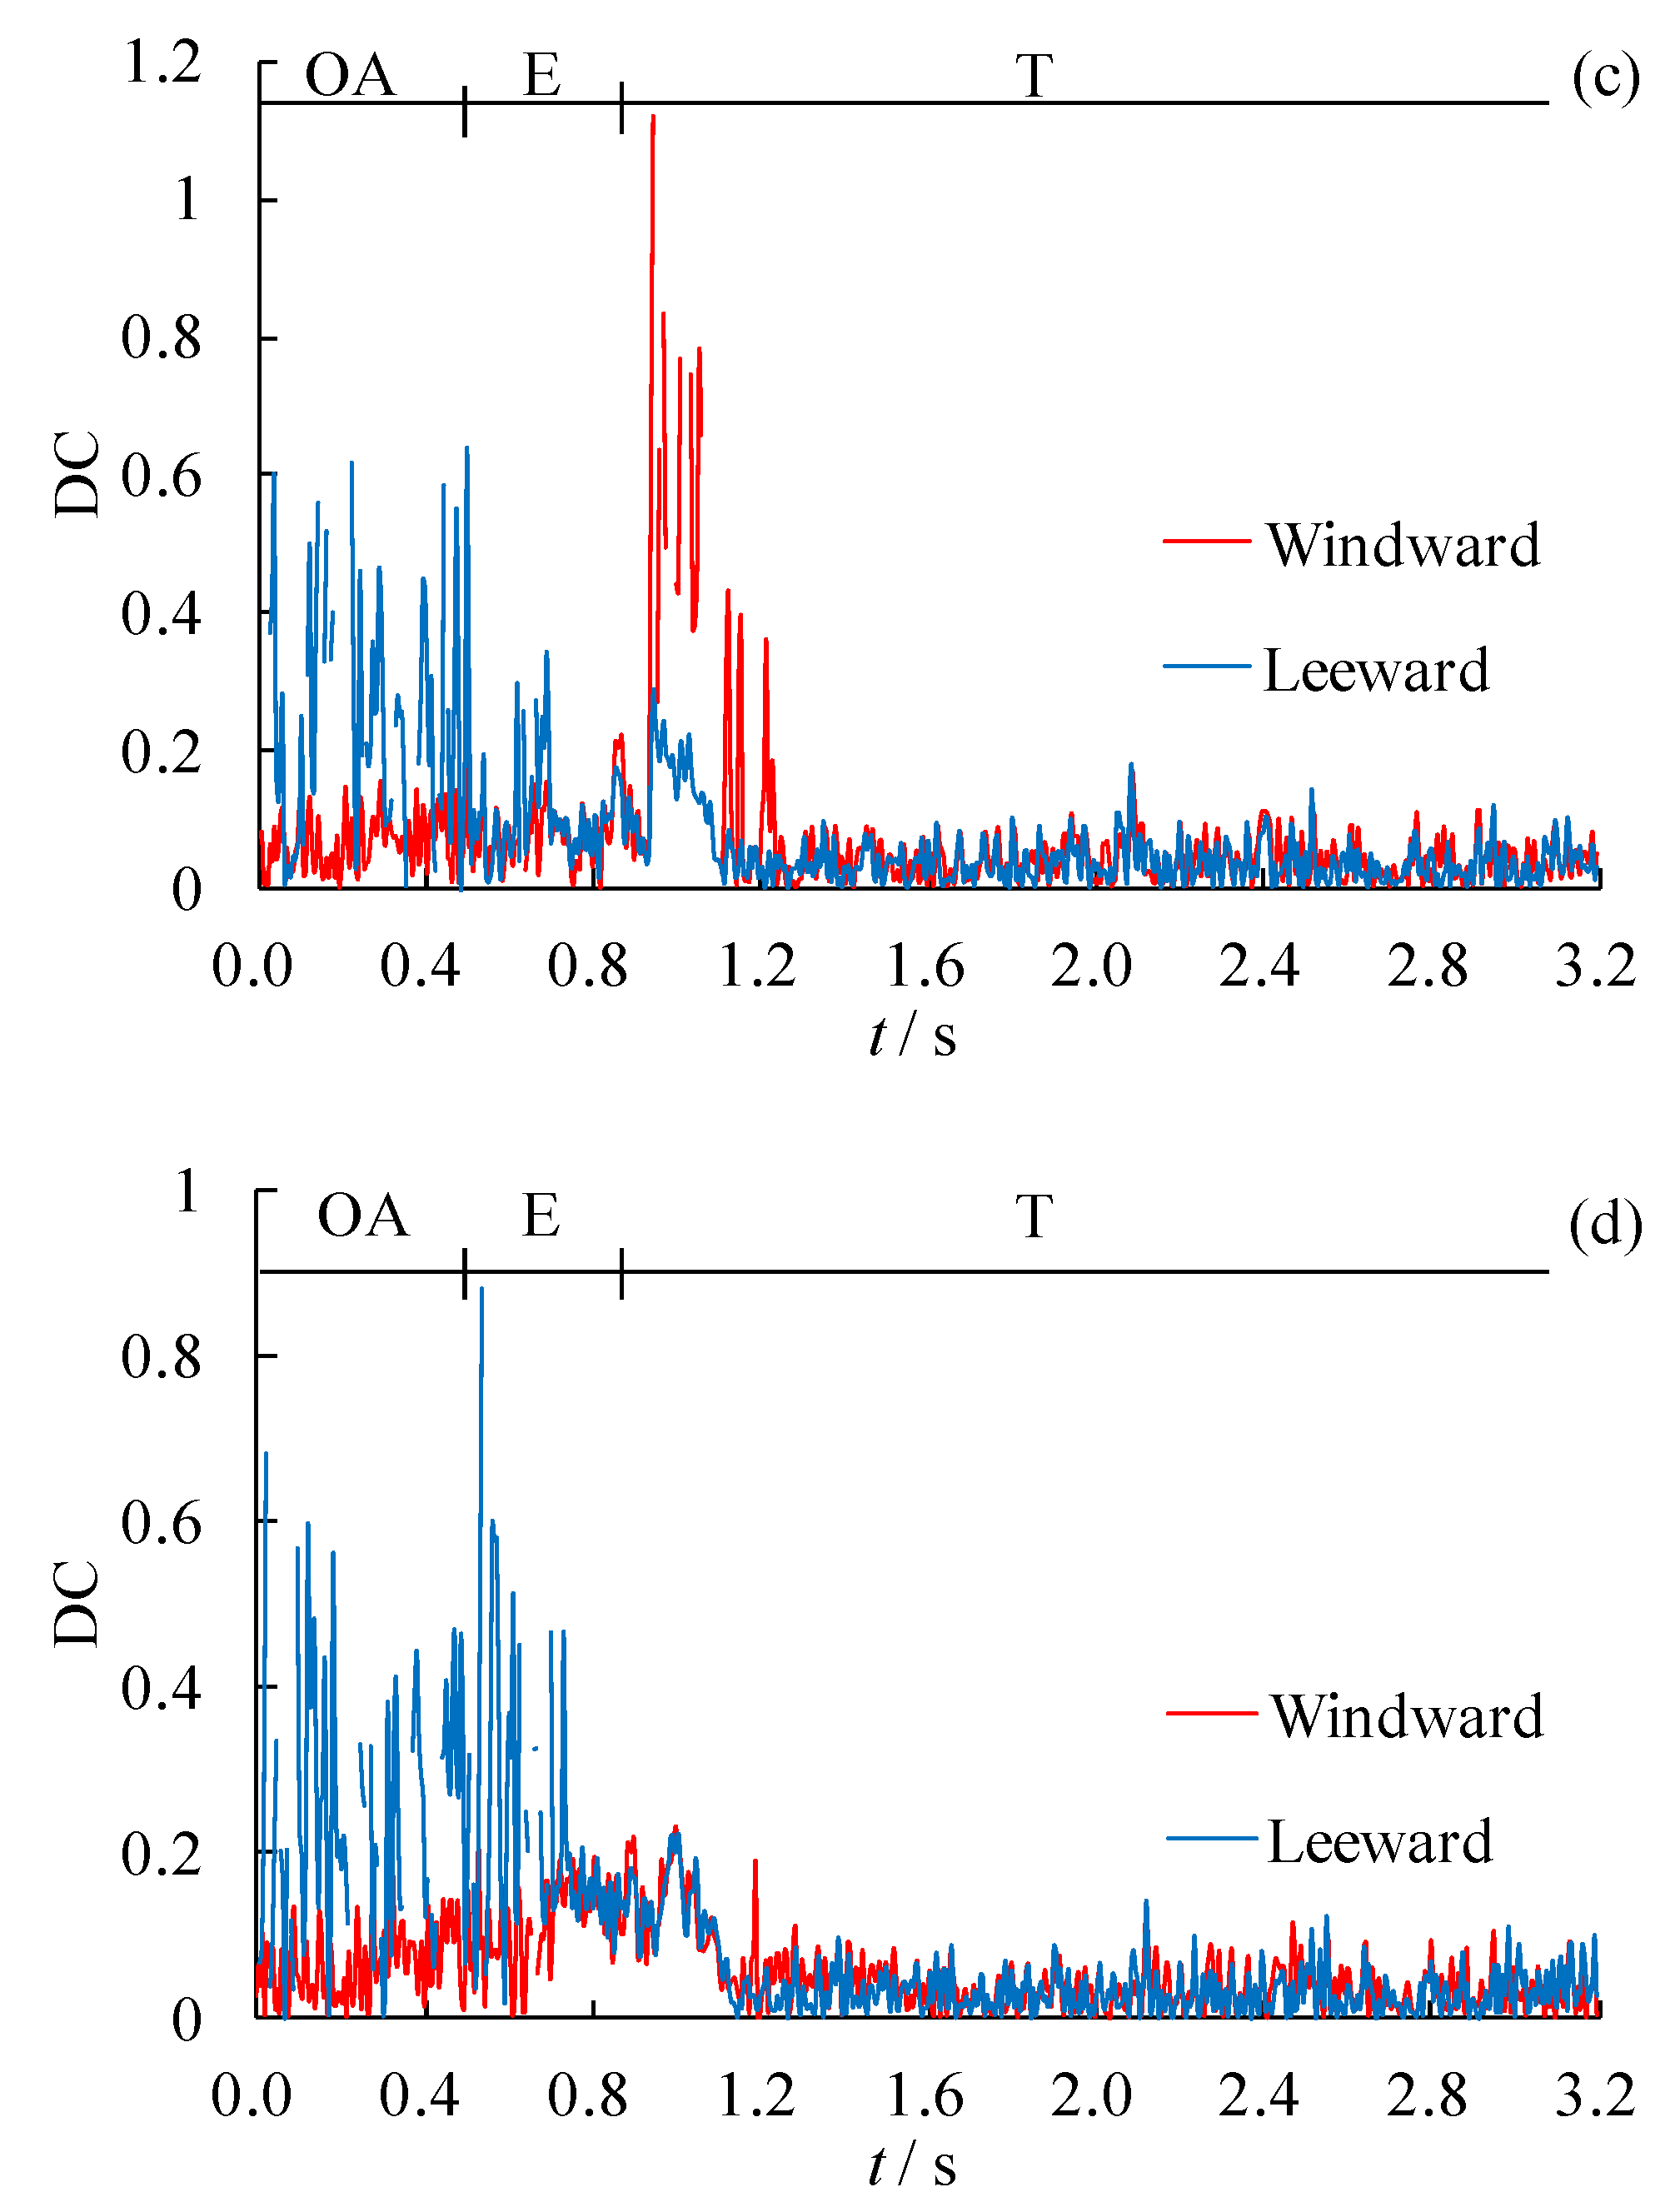
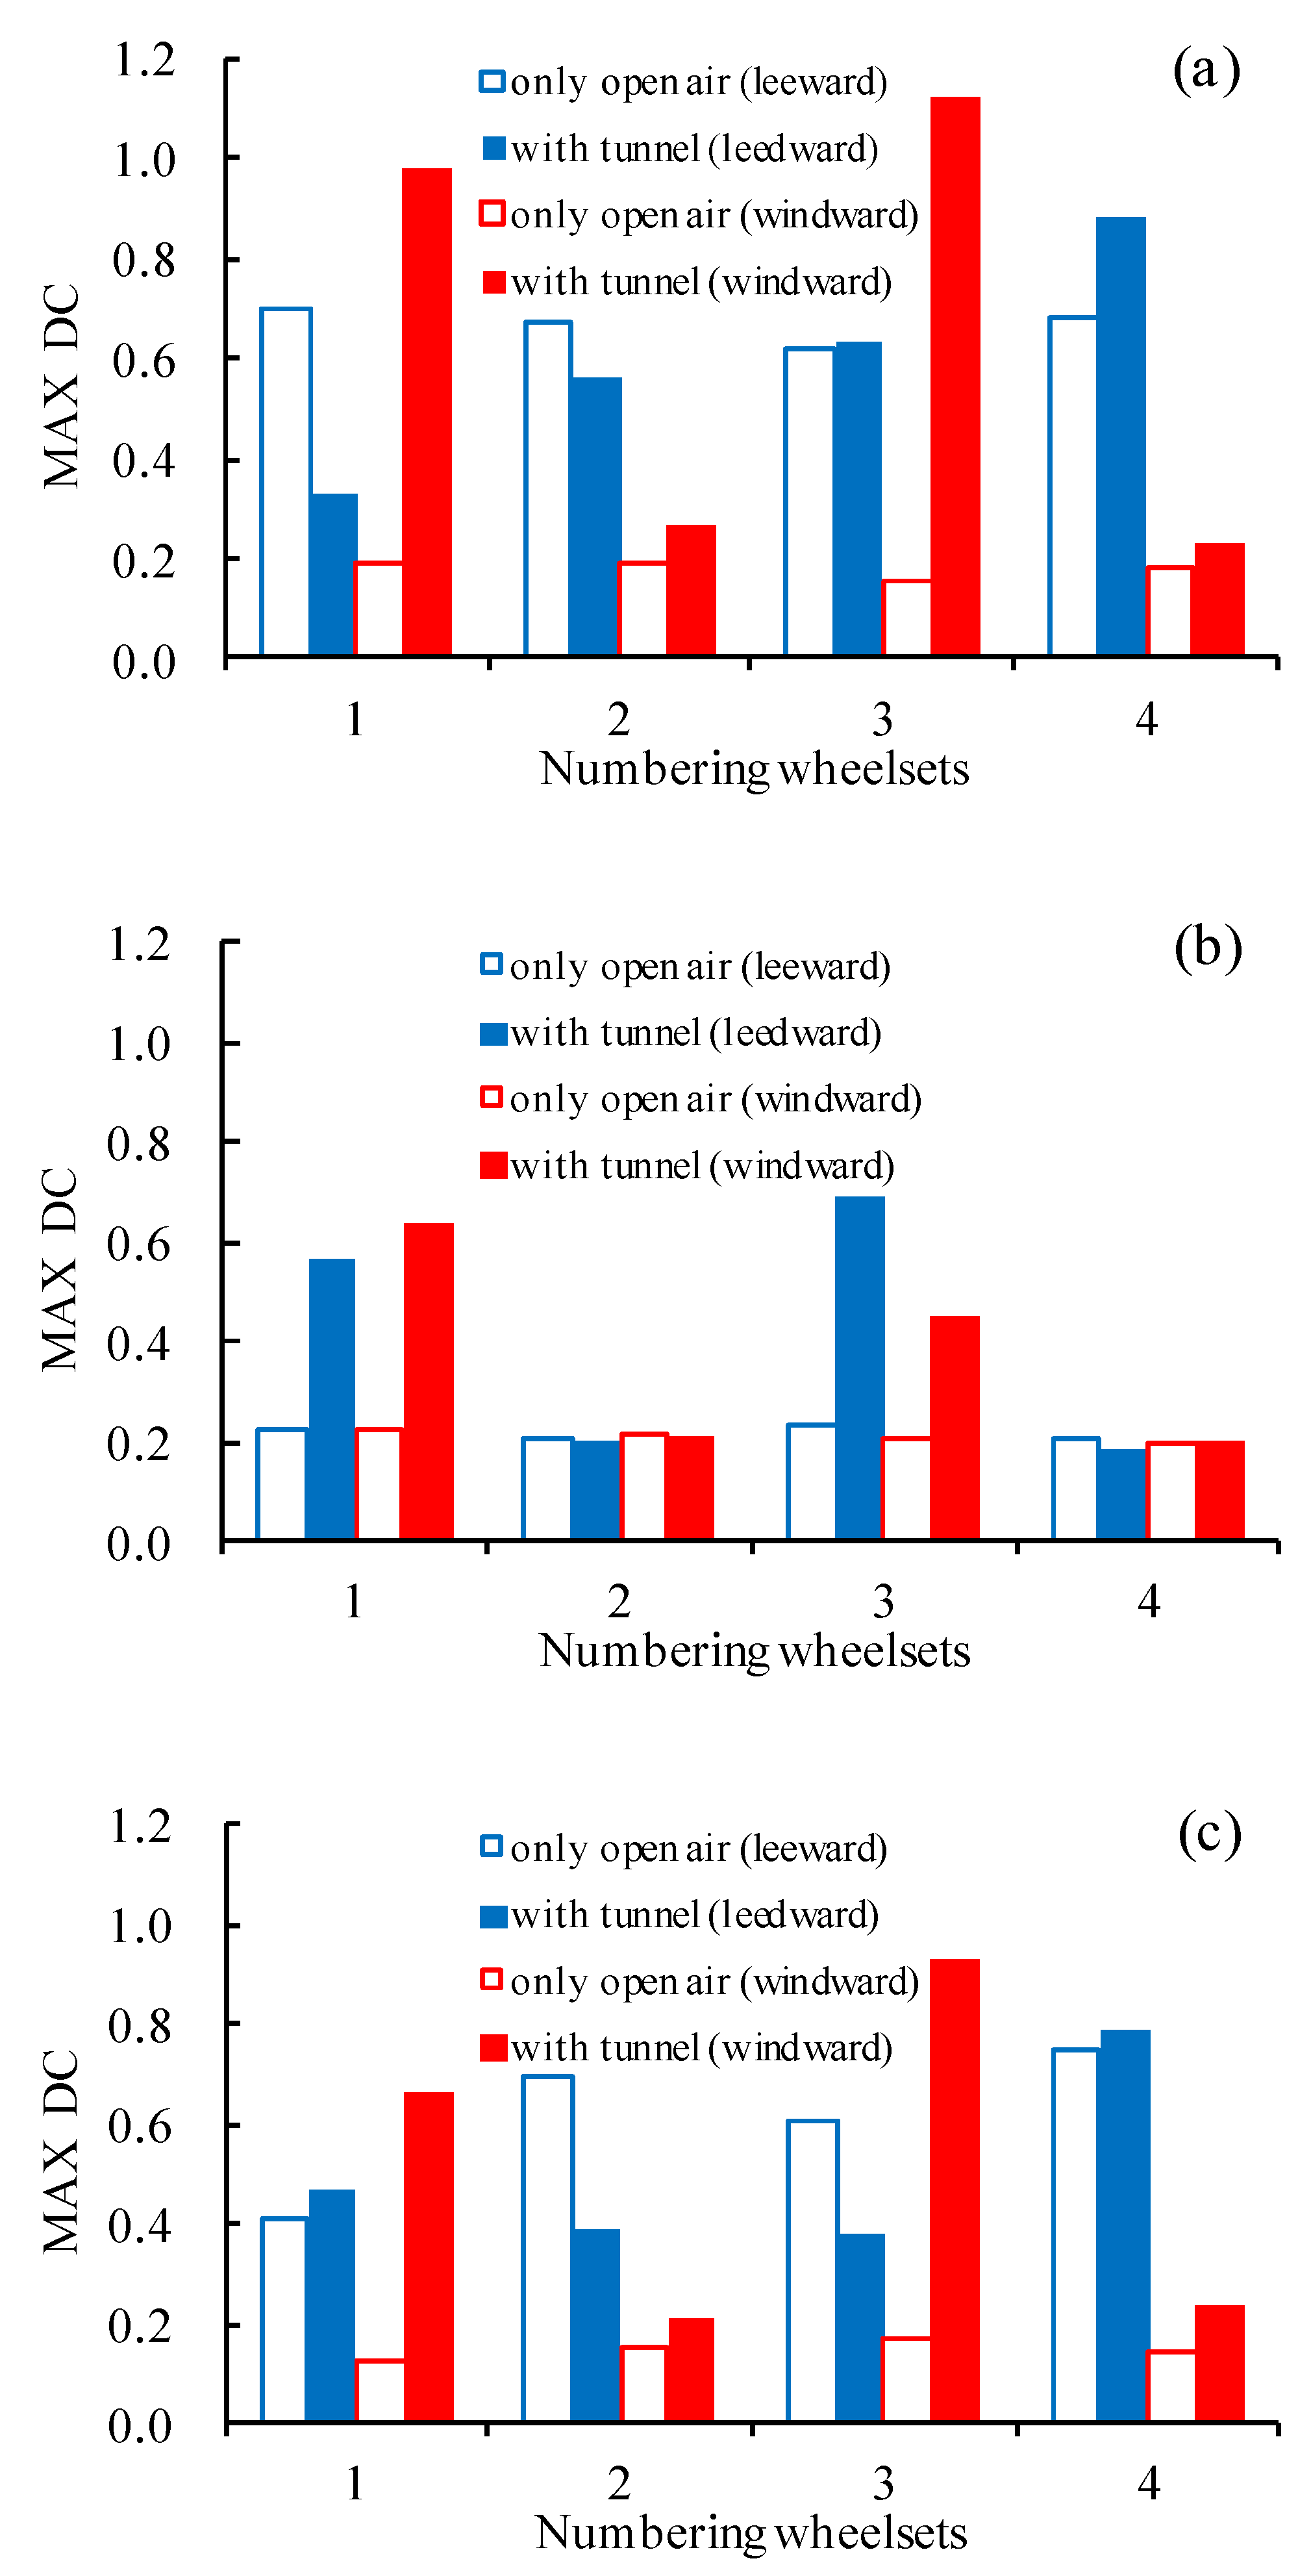
5.2.1. Derailment Coefficient

The rollover accident occurred when the side contact force exceeded the vertical contact force to a certain extent. The rollover accident was discerned with DCs, which is defined as follows [38]:
DC = Q / P
where Q and P are the side and vertical contact forces, respectively.
Figure 17 demonstrates the evolution of DCs with respect to the time of the head carriage wheelsets during the train entering tunnel under conditions of train speed = 250 km/h and crosswind velocity = 15 m/s. The value of DCs was removed when the value of the vertical contact force was zero. In this moment, the wheel tread was detached from the rail top and the DCs were meaningless. Section 5.2.3 discusses the safety assessment of the sudden separation of the wheel and rail.
Figure 17a shows that the global maximum of the DCs is likely to happen when the train arrives at the tunnel entrance. When the time was less than approximately 0.5 s, the entire carriage ran in the open air, the train withstood the side force from the crosswind, and the rail in the leeward side was pressed by the edge of the wheel. This phenomenon is the reason why the DCs on the leeward side were larger and easier to fluctuate than those on the other side. Therefore, the maximum DC on the leeward and windward sides was 0.56 and 0.15, respectively. When the carriage had completely entered the tunnel, the side force in the windward suddenly revoked at this moment (approximately 1.1 s), thereby causing the sudden reverse rotation of the carriage around the longitudinal axis. The vertical contact force of the wheel in the windward side suddenly increased, thereby shocking the DCs in the windward side upwards. The shielding effects of the aerodynamic loads induced by the tunnel was intensely sudden, such that the global maximum of the DCs was presented (e.g., approximately 1.04 for the first wheelset, nearly 2 times than the maximum DCs in the open air). Finally, the DCs at both sides decreased to less than 0.2 when the carriage entered the tunnel (after 1.1 s).
Notably, the sudden variation of the DCs due to the shielding effect of the tunnel in the lateral direction mainly occurred in the first and third wheels of windward side when the train was entering the tunnel (Figure 17a,c). Furthermore, the DC of the second and fourth wheels in the windward side remained relatively stable (Figure 17b,d), respectively). The coupling effect of the aerodynamic loads shielded in the first wheel was probably larger than those of the others, and the suspension system of the train automatically adjusted the influence of aerodynamic unloading. For example, the safety risk of the third wheel in the windward side increased with the wind speed. Figure 18 presents the evolution of DCs with respect to the time of the head carriage wheelsets under the conditions of train speed = 250 km/h and crosswind velocity = 25 m/s. It can be seen that the position where the maximum DC occurred shifted from the first wheel to the third wheel. This phenomenon may have been caused by the pitching movement of the leading carriage. The pitching moment increased with the wind speed in open air. When the pitching moment of the carriage increased, the contact between the wheel tread of the rear bogie and rail top became closer. Thus, the position where the maximum DC occurred moved backward as the wind speed increased.
Figure 19 presents the comparison of all wheels’ maximum DC values amongst the head, middle, and rear carriages during the two processes (i.e., only in open air and entering tunnel) under conditions of train speed = 250 km/h and crosswind velocity = 25 m/s to discuss the influence of the aerodynamic variation on the train running safety.
It can be seen from Figure 19 that the maximum DC value of the rear carriage characterized similarly to that of the head carriage. At the third wheel in the windward side of rear carriage, the DC was approximately 0.17 and 0.93 when this carriage ran in open air and in the process of entry, respectively. The DC of the third wheel for the windward side of rear carriage was larger than the others when entering the tunnel. The global maximum of DCs was slightly less than that of the head carriage. The reason for this phenomenon may have been that the aerodynamic loads of the rear carriage were slightly lower than those of the head carriage (Figure 16). No significant difference of DCs was observed amongst the four wheelsets of the middle carriage when running in the crosswind environment completely. The maximum DC (0.69) of the middle carriage when it entered the tunnel was the minimum among the three carriages (Figure 19b).
Therefore, entering the tunnel from the crosswind environment was more dangerous for the running train than running in crosswind completely, especially to the first and third wheels of the head and rear carriages in the windward side. The safety risk was more likely to happen in the third wheel in the windward side as the wind speed increased.

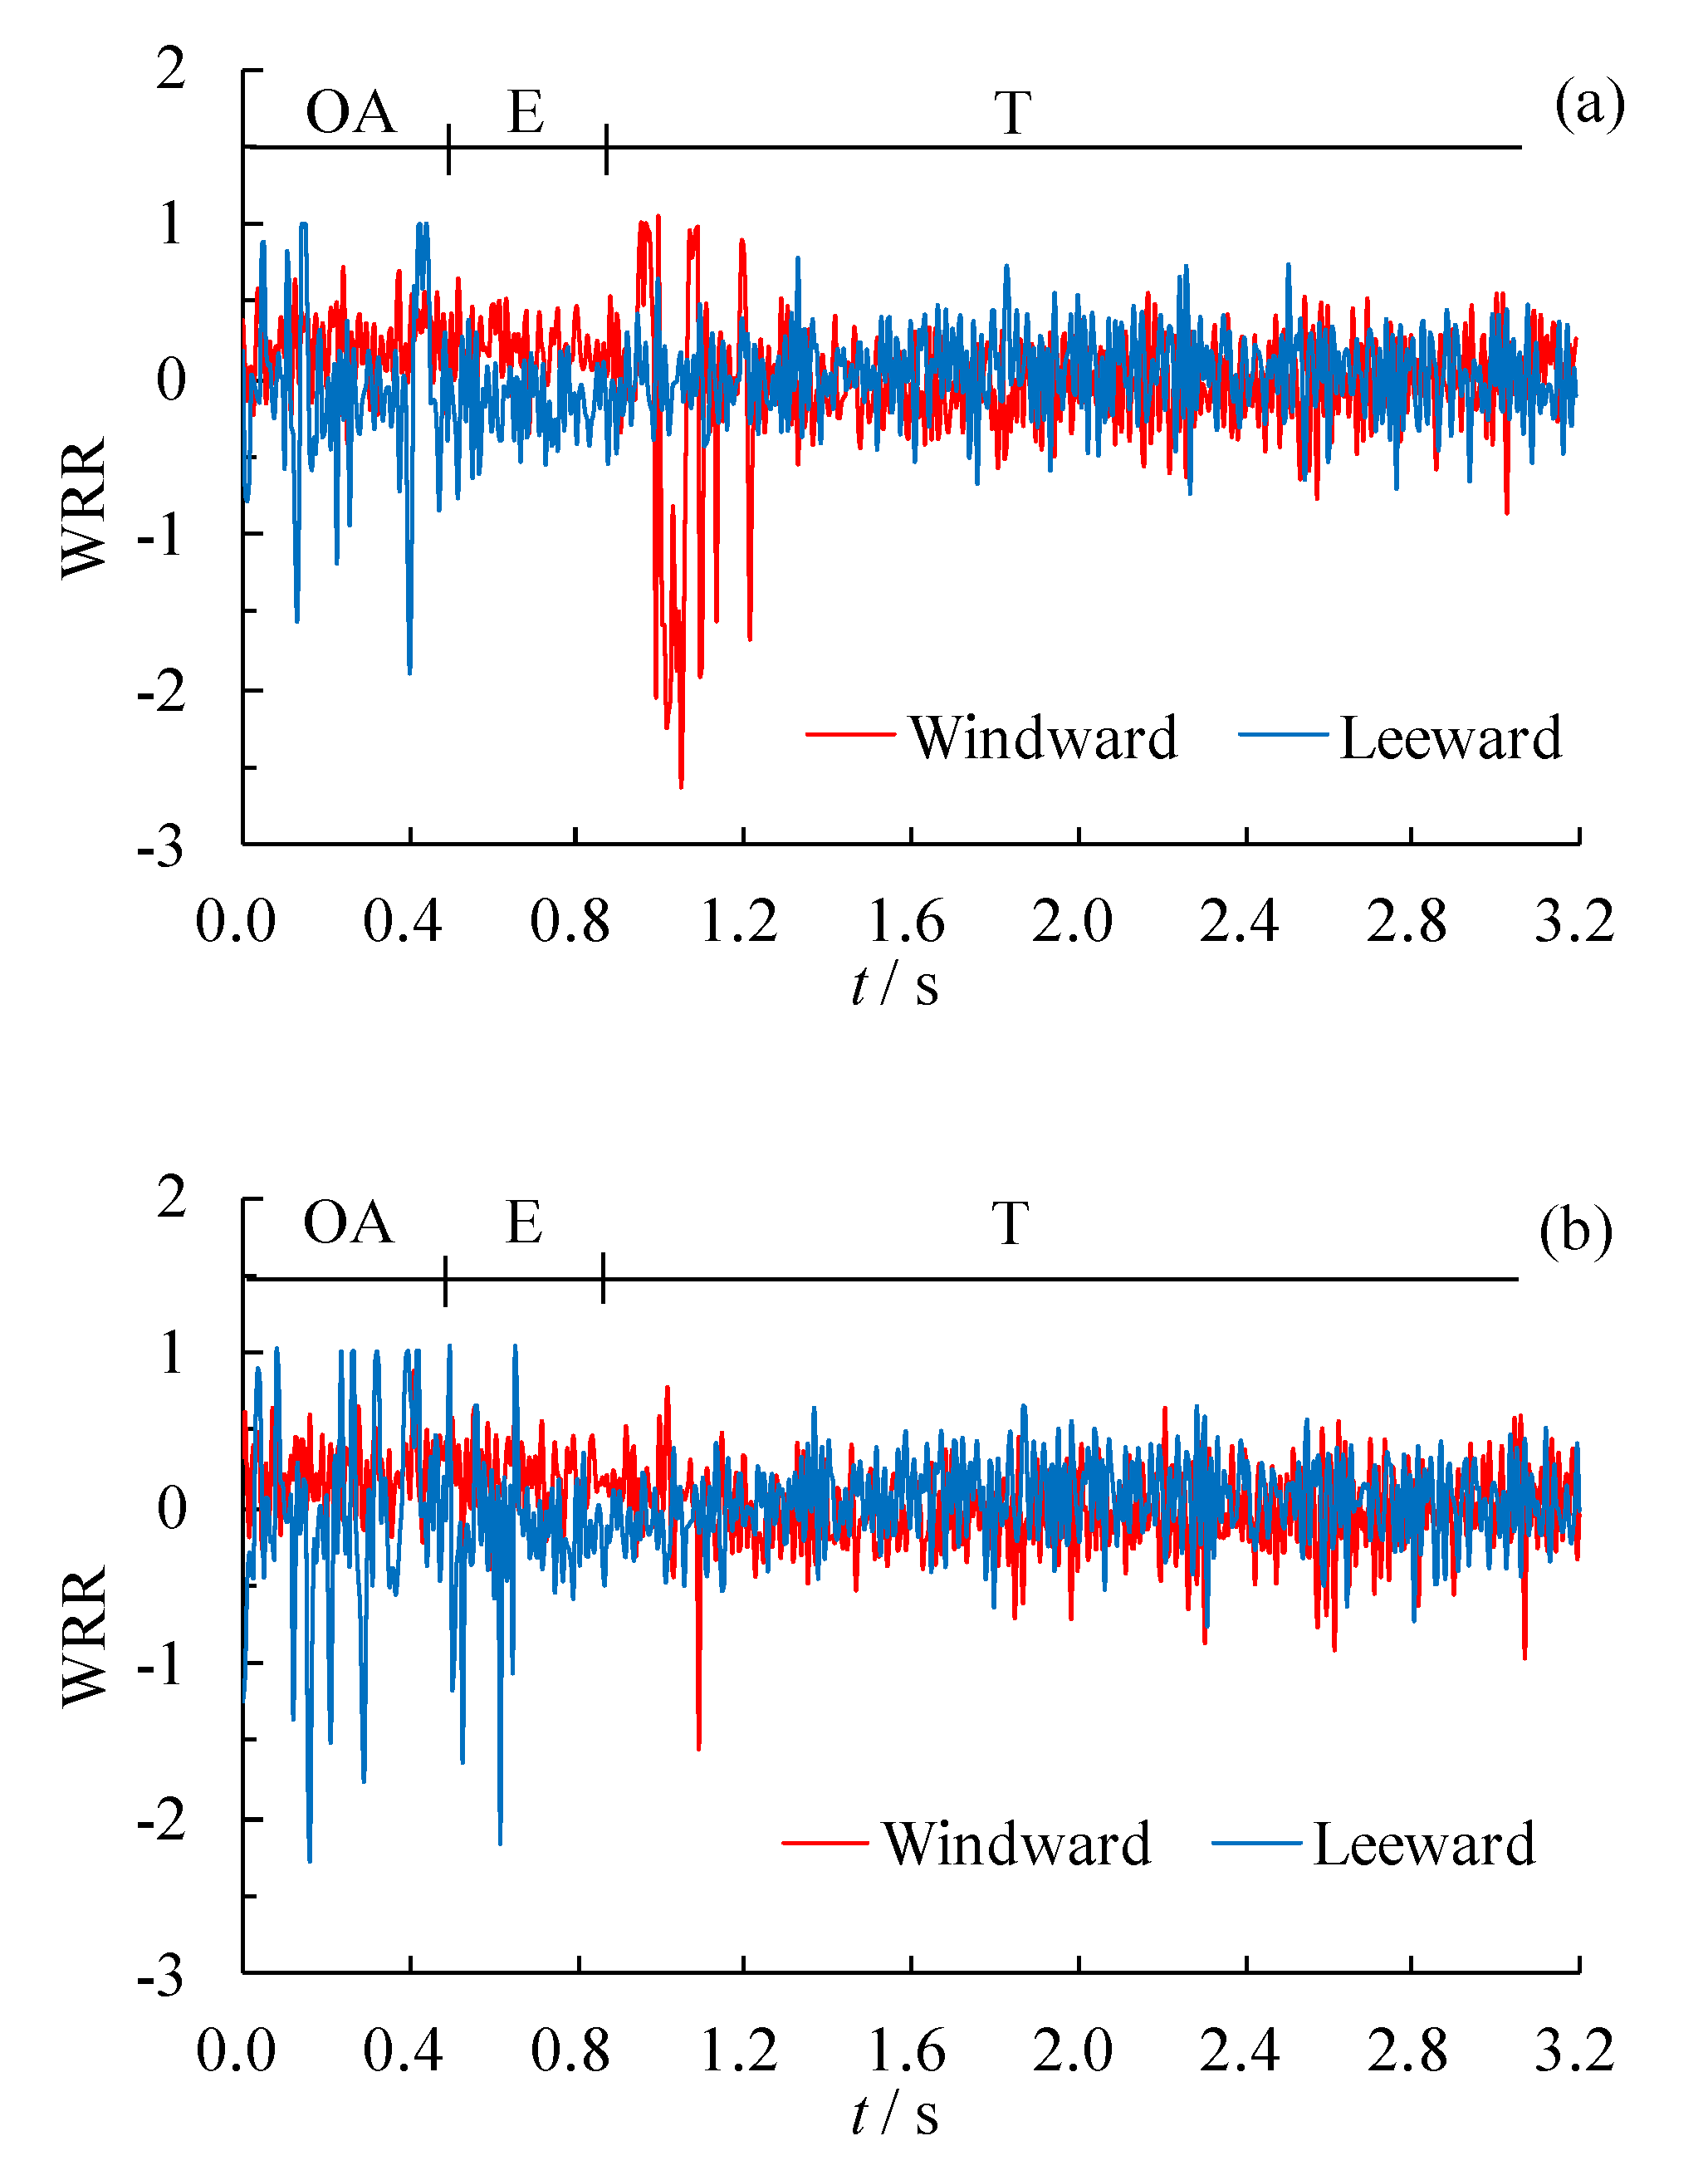
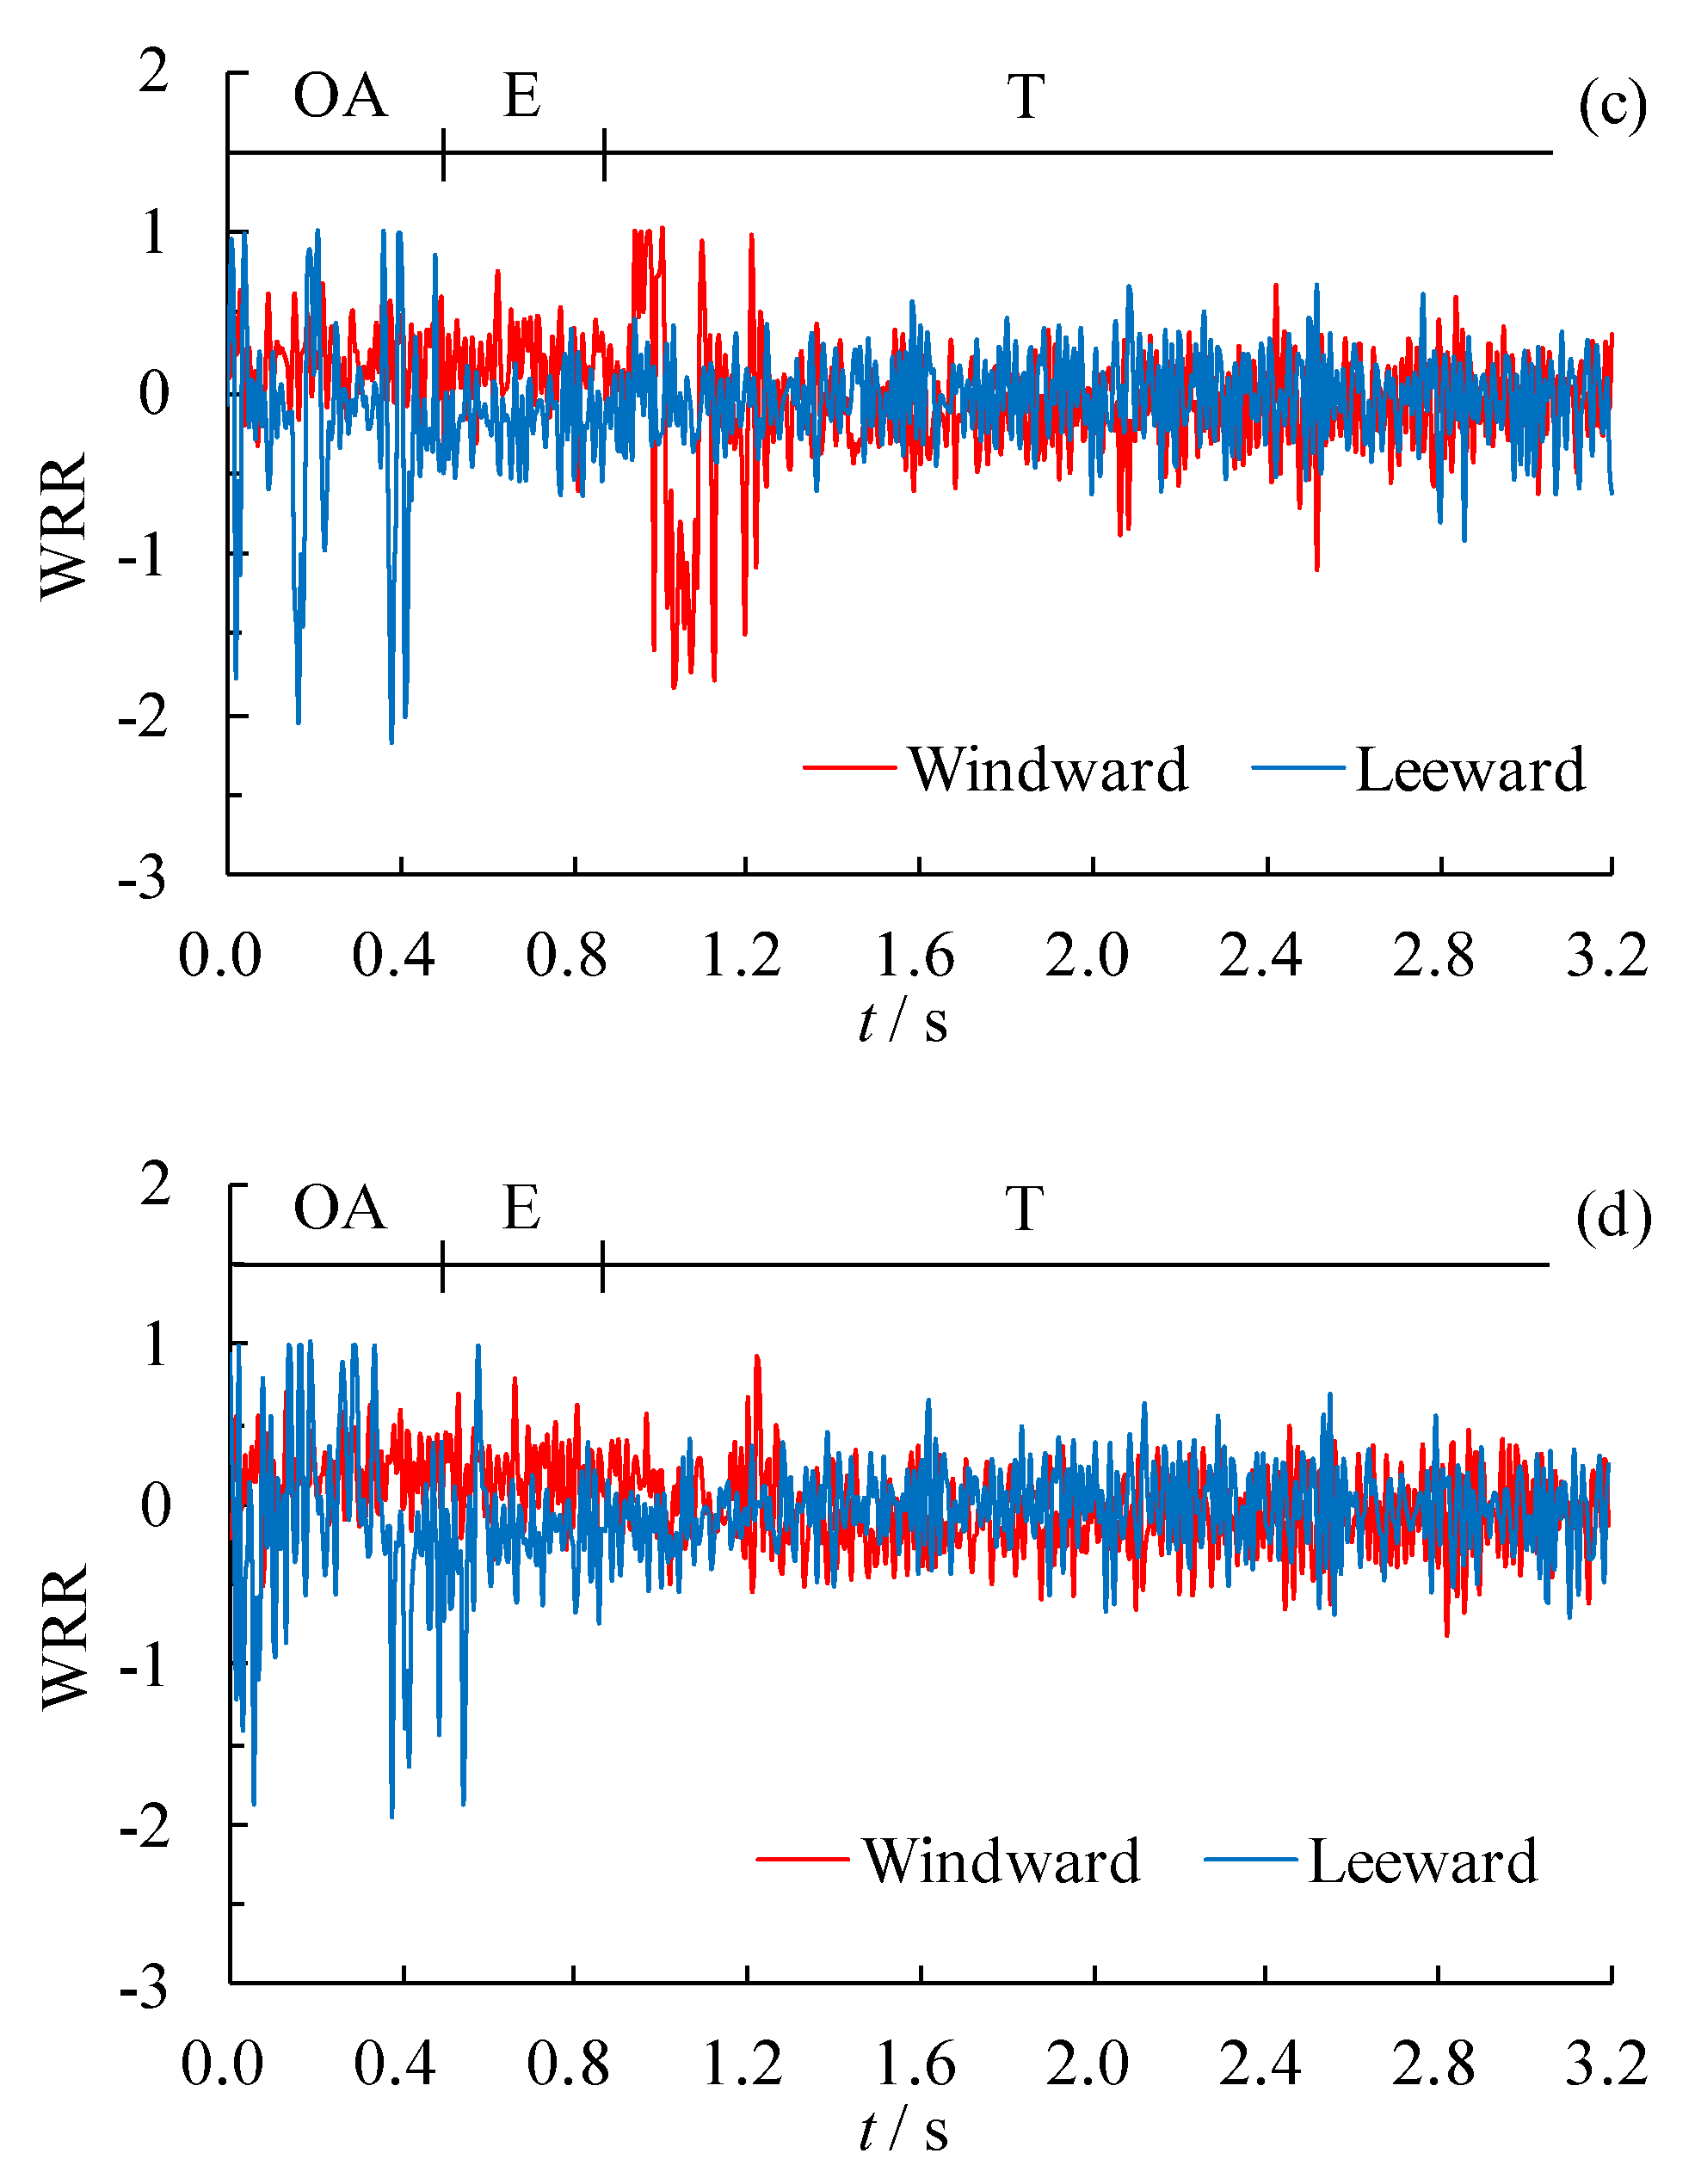
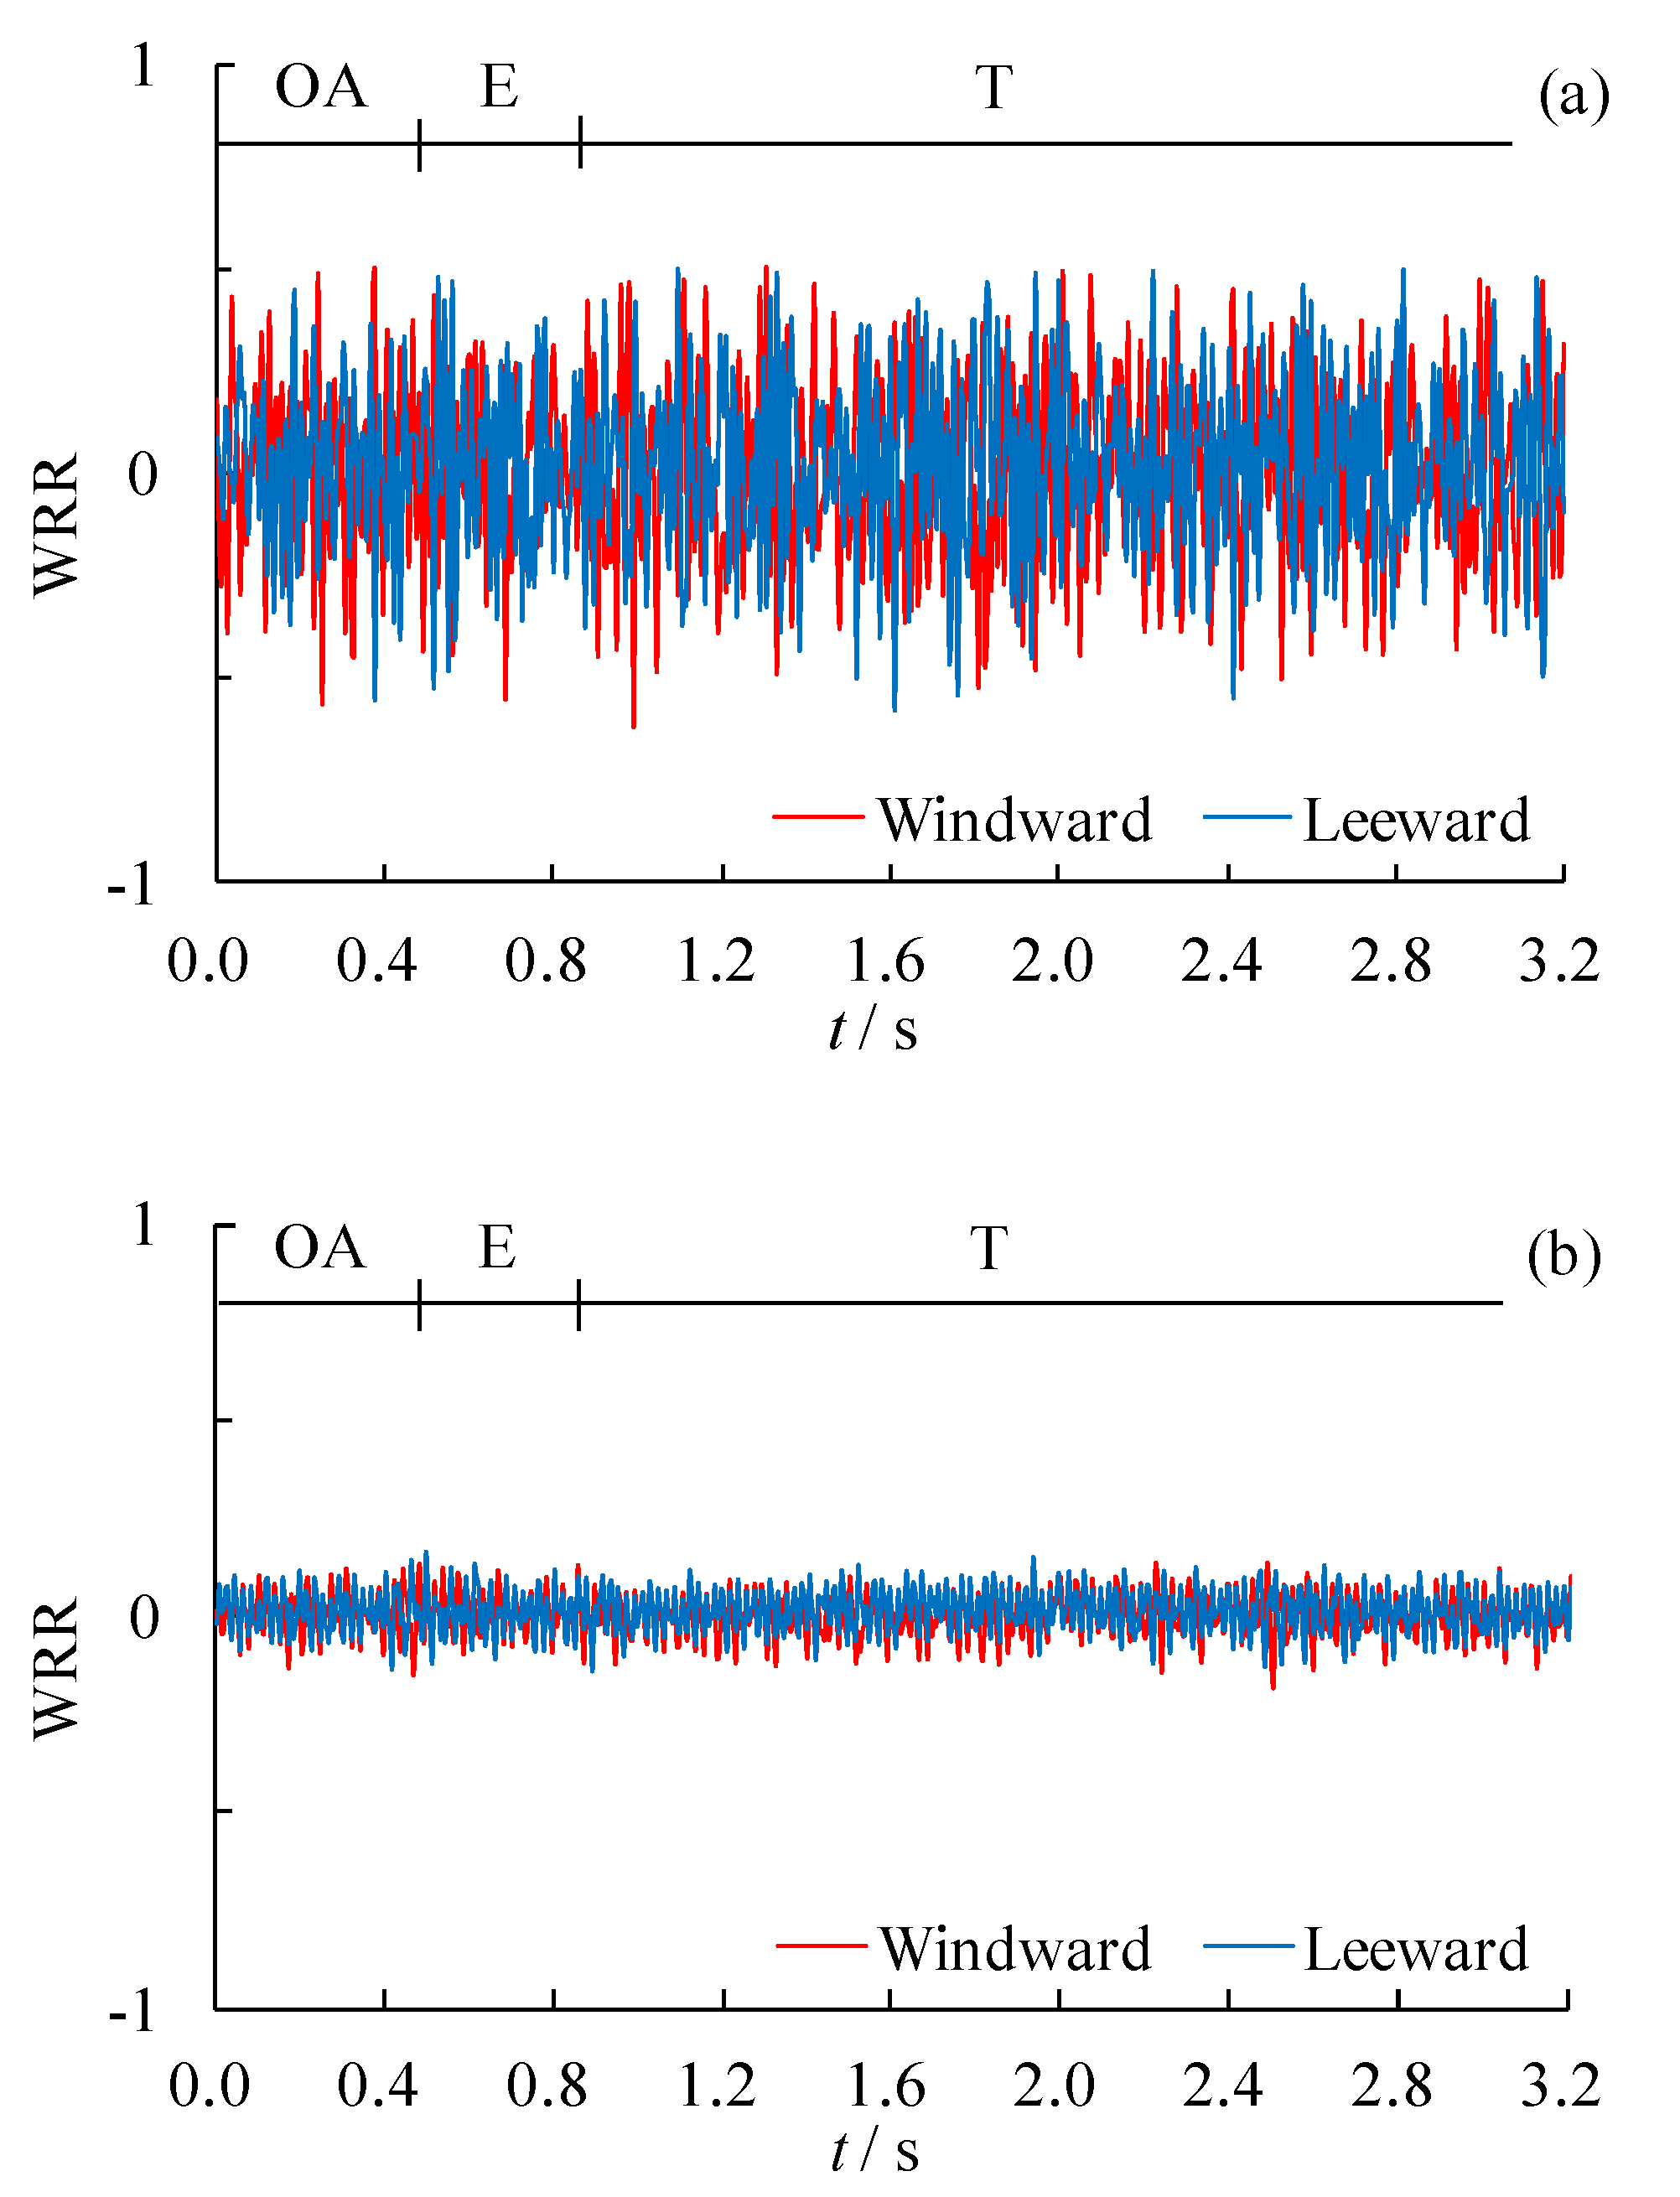
5.2.2. Wheel Load Reduction Rate

When the vertical contact force of a wheel exceeded its original static wheel load, the wheel lifted, and the wheel unloading accident was likely to happen. The corresponding safety coefficient WRR [39] is defined as:
WRR = Δ P / P ¯
where Δ P represents the reduction amount of wheel load in one wheel, which is + for reducing and − for the increase of the vertical contact force. P ¯ represents the load that the total train static self-weight equally distributes on each wheel.
Figure 20 demonstrates the time-history of WRR of the head carriage wheelsets during the train entering tunnel under the conditions of train speed = 250 km/h and crosswind velocity = 15 m/s.
Figure 20a–d shows that the carriage deflected to the leeward side, the vertical contact force decreased in the windward side, and WRR stabilized at a higher level in the windward side when the train ran in the crosswind environment completely. Meanwhile, the variation amplitude of the WRR in leeward side wheel was remarkably larger than that of the opposite side because the wheel tread on the leeward side had close contact with the rail top. When the train was in the process of entry, the carriage turned aside towards the windward side due to the sudden disappearance of wind excitation. As shown in Figure 20a, the WRR in the windward side decreased to −2.63 (the lowest value among the four wheelsets), whereas that in the leeward side increased to 0.64 instantaneously because of self-weight. Then, the WRR in the windward side rose to its global maximum of 1.0, indicating that the wheel had been detached from the rail. Finally, the WRRs on both sides rapidly decreased when the train entered the tunnel due to the buffering effect of the suspension system.
Similar to DC, the variation amplitude of WRR of the first and third wheels in the windward side was larger than those of the other wheels and occurred instantaneously when the train entered tunnel. Figure 21 presents the comparison of all the wheels’ maximum WRR values amongst the head, middle and rear carriages during the two processes (i.e., only in open air and entering tunnel) under conditions of train speed = 250 km/h and crosswind velocity = 25 m/s. A safety risk was likely to be observed in the head carriage based on the discussion of the DCs and WRRs.
To verify the effectiveness of the track irregularity spectrum used in the present study, Figure 22 shows the time-history of the WRR in the first wheelset of the head carriage during the train entering the tunnel at a speed of 250 km/h (no crosswind) under the track spectrum condition in this paper and the corresponding result under the condition of the Chinese track spectrum [40], respectively. It is shown from Figure 22 that the WRRs of wheels on both sides fluctuated at the same level due to the absence of crosswind. The maximum WRR value, shown in Figure 22a,b, was 0.51 and 0.17, respectively. Both were significantly smaller than the corresponding result shown in Figure 20a. Therefore, the track irregularity spectrum adopted in the present study is effective and conservative.

5.2.3. Safety Criteria

(1) DC grade
The safety grade of the DC is proposed further in the code TB/T 2360-1993 [38] (see Table 2).
(2) WRR grade
First   limit :   Δ P / P ¯ 0.65
Sec ond   limit :   Δ P / P ¯ 0.60
Although WRR exceeded the second limit in some conditions, its safety limit value was strict because the running train had no safety issue since the opening of the Beijing–Shanghai HSR [32]. Therefore, Zhai et al. [41] proposed a new criterion of WRR, and many field tests that are widely adopted in the safety assessment of train traffic in Chinese HSR are based on the reported issue.
{ Δ P / P ¯ 0.60 Δ t < Δ t 0 , Δ P / P ¯ > 0.60
where t is the time interval when the WRR continues to exceed 0.6 and Δ t is the maximum allowable time interval, Δ t = 0.035 s.
Figure 23 presents the partial magnification of the WRR at the third wheel of the windward side of the head carriage when the train traveled at the speed of 250 km/h and 300 km/h and the crosswind velocity outside the tunnel was 25 m/s. In this study, safety was considered safe and unsafe when a train ran at the speed of 250 km/h and 300 km/h, because Δ t < 0.035 s and Δ t > 0.035 s, respectively.
Figure 24 presents the CWCs or the wind speed against the train speed for applications based on the safety criteria, where the wind speed had a constant velocity. The allowable speed of Chinese regulations [42,43] when crosswind is involved and the results of other studies found in the scientific literature [44] are presented for comparison. The present investigation shows that in terms of safety, an HST can enter a tunnel with crosswind at 350 km/h when the crosswind velocity is less than 15 m/s, which is looser than the national regulations but more conservative than that of Olmos et al. [44]. The literature results are deduced from the wind–train–viaduct interaction. The CWC comparison implies that the transient wind effect at the tunnel entrance might not be neglected.

6. Conclusions

This study presents a wind–train–track dynamic model to analyze the sudden variation of the aerodynamic force and to assess the operation safety of trains. Specific observations are summarized as follows.
(a)
When a train enters tunnels with crosswind, the difference of flow field and pressure between inside and outside the tunnel causes sudden a variation in the five aerodynamic load components, with respect to time, at the same instance. The five aerodynamic load components contribute to the safety risk of the running train.
(b)
The global maximum of DCs and WRR of trains is likely to be achieved during tunnel entry with crosswind than in a crosswind environment due to the sudden disappearance of wind excitation when other conditions remain the same.
(c)
The safety risk of the head carriage is higher than that of the rear carriage and even more than the middle carriage because of the transient aerodynamic effect on the head and rear carriages at the tunnel entrance. This finding is consistent with the actual situation of the rollover accident of a running train that occurred in Xinjiang, China in 2007.
The sudden variation of aerodynamic load is an important potential source of vehicle safety accidents, such as when a train enters a tunnel with crosswind, which is discussed in this study. The results show that the sudden wind excitation in the tunnel entrance and corresponding safety risks should not be neglected. However, proposing a practicable CWCs curve based on simulation and theoretical analysis is difficult. Therefore, further investigation, especially in the related field test, is needed in the future.

Author Contributions

Conceptualization, W.Y.; methodology, W.Y. and E.D.; formal analysis, Z.Z.; writing—original draft preparation, E.D.; writing—review and editing, W.Y., M.L. and C.S.; supervision, H.H.; funding acquisition, W.Y. All authors have read and agreed to the published version of the manuscript.

Funding

This work was funded by the National Natural Science Foundation of China (Grant Nos. 51978670 and U1534206) and the Fundamental Research Funds for the Central Universities of Central South University (Grant No. 2019zzts291).

Acknowledgments

The authors are grateful for the great support from National Natural Science Foundation of China and the Fundamental Research Funds for the Central Universities of Central South University. In addition, the authors would like to thank Xinyang Li for her great support for this paper.

Conflicts of Interest

The authors declare no conflict of interest.

References

  1. Cheli, F.; Corradi, R.; Sabbioni, E.; Tomasini, G. Wind tunnel tests on heavy road vehicles: Cross wind induced loads-Part 1. J. Wind Eng. Ind. Aerodyn. 2011, 99, 1000–1010. [Google Scholar] [CrossRef]
  2. Dorigatti, F.; Sterling, M.; Baker, C.J.; Quinn, A.D. Crosswind effects on the stability of a model passenger train– A comparison of static and moving experiments. J. Wind Eng. Ind. Aerodyn. 2015, 138, 36–51. [Google Scholar] [CrossRef]
  3. García, J.; Muñoz-paniagua, J.; Crespo, A. Numerical study of the aerodynamics of a full scale train under turbulent wind conditions, including surface roughness effects. J. Fluids Struct. 2017, 74, 1–18. [Google Scholar] [CrossRef]
  4. Krajnović, S.; Ringqvist, P.; Nakade, K.; Basara, B. Large eddy simulation of the flow around a simplified train moving through a crosswind flow. J. Wind Eng. Ind. Aerodyn. 2012, 110, 86–99. [Google Scholar] [CrossRef]
  5. Giappino, S.; Rocchi, D.; Schito, P.; Tomasini, G. Cross wind and rollover risk on lightweight railway vehicles. J. Wind Eng. Ind. Aerodyn. 2016, 153, 106–112. [Google Scholar] [CrossRef]
  6. Suzuki, M.; Tanemoto, K.; Maeda, T. Aerodynamic characteristics of train/vehicles under cross winds. J. Wind Eng. Ind. Aerodyn. 2003, 91, 209–218. [Google Scholar] [CrossRef]
  7. Bocciolone, M.; Cheli, F.; Corradi, R.; Muggiasca, S.; Tomasini, G. Crosswind action on rail vehicles: Wind tunnel experimental analyses. J. Wind Eng. Ind. Aerodyn. 2008, 96, 584–610. [Google Scholar] [CrossRef]
  8. Deng, L.; Yan, W.C.; Nie, L. A simple corrosion fatigue design method for bridges considering the coupled corrosion-overloading effect. Eng. Struct. 2019, 178, 309–317. [Google Scholar] [CrossRef]
  9. Thomas, D.; Berg, M.; Stichel, S.; Diedrichs, B. Rail vehicle response to lateral carbody excitations imitating crosswind. Proc. Inst. Mech. Eng. Part F J. Rail Rapid Transit 2015, 229, 34–47. [Google Scholar] [CrossRef]
  10. Deng, E.; Yang, W.C.; Lei, M.F.; Zhu, Z.H.; Zhang, P.P. Aerodynamic loads and traffic safety of high-speed trains when passing through two windproof facilities under crosswind: A comparative study. Eng. Struct. 2019, 188, 320–339. [Google Scholar] [CrossRef]
  11. Wei, L.; Zeng, J.; Wu, P.B.; Song, C.Y. Safety analysis of high speed trains under cross winds using indirect wheel-rail force measuring method. J. Wind Eng. Ind. Aerodyn. 2018, 183, 55–67. [Google Scholar] [CrossRef]
  12. Yang, W.C.; Deng, E.; Lei, M.F.; Zhang, P.P.; Yin, R.S. Flow structure and aerodynamic behavior evolution during train entering tunnel with entrance in crosswind. J. Wind Eng. Ind. Aerodyn. 2018, 175, 229–243. [Google Scholar] [CrossRef]
  13. Yang, W.C.; Deng, E.; Lei, M.F.; Zhu, Z.H.; Zhang, P.P. Transient aerodynamic performance of high-speed trains when passing through two windproof facilities under crosswinds: A comparative study. Eng. Struct. 2019, 188, 729–744. [Google Scholar] [CrossRef]
  14. Yao, Z.Y.; Xiao, J.H.; Jiang, F.Q. Characteristics of daily extreme-wind gusts along the Lanxin Railwayin Xinjiang, China. Aeolian Res. 2012, 6, 31–40. (In Chinese) [Google Scholar] [CrossRef]
  15. Muñoz-paniagua, J.; García, J.; Crespo, A. Genetically aerodynamic optimization of the nose shape of a high-speed train entering a tunnel. J. Wind Eng. Ind. Aerodyn. 2014, 130, 48–61. [Google Scholar] [CrossRef] [Green Version]
  16. Raffaele, V.; Ferrand, V.; Da Silva, A.; Le Moyne, L. Forces and flow structures evolution on a car body in a sudden crosswind. J. Wind Eng. Ind. Aerodyn. 2014, 128, 114–125. [Google Scholar]
  17. Deng, E.; Yang, W.C.; Yi, R.S.; Zhang, P.P. Study on the transient aerodynamic performance of high-speed train running into tunnel under crosswind. J. Hunan Univ. Nat. Sci. 2019, 46, 69–78. (In Chinese) [Google Scholar]
  18. Deng, E.; Yang, W.C.; Zhang, P.P. Impact effect of aerodynamic load on high speed train entering tunnel under crosswind. J. South China Univ. Technol. Nat. Sci. Ed. 2019, 47, 130–138. (In Chinese) [Google Scholar]
  19. Krajnović, S. Numerical simulation of the flow around an ICE2 train under the influence of a wind gust. In Proceedings of the International Conference on Railway Engineering 2008 (IET ICRE 2008), Challenges for Railway Transportation in Information Age, Hong Kong, China, 25–28 March 2008. [Google Scholar]
  20. Baker, C. The flow around high speed trains. J. Wind Eng. Ind. Aerodyn. 2010, 98, 277–298. [Google Scholar] [CrossRef]
  21. Flynn, D.; Hemida, H.; Soper, D.; Baker, C. Detached-eddy simulation of the slipstream of an operational freight train. J. Wind Eng. Ind. Aerodyn. 2014, 132, 1–12. [Google Scholar] [CrossRef]
  22. García, J.; Muñoz-paniagua, J.; Jiménez, A.; Migoya, E.; Crespo, A. Numerical study of the influence of synthetic turbulent inflow conditions on the aerodynamics of a train. J. Fluids Struct. 2015, 56, 134–151. [Google Scholar] [CrossRef]
  23. Hemida, H.; Baker, C.; Gao, G. The calculation of train slipstreams using large-eddy simulation. Proc. Inst. Mech. Eng. Part F J. Rail Rapid Transit 2014, 228, 25–36. [Google Scholar] [CrossRef]
  24. Muñoz-paniagua, J.; García, J. Aerodynamic surrogate-based optimization of the nose shape of a high-speed train for crosswind and passing-by scenarios. J. Wind Eng. Ind. Aerodyn. 2019, 184, 139–152. [Google Scholar] [CrossRef]
  25. Deng, E.; Yang, W.C.; Deng, L.; Zhu, Z.H.; He, X.H.; Wang, A. Time-resolved aerodynamic loads on high-speed trains during running on a tunnel-bridge-tunnel infrastructure under crosswind. Eng. Appl. Comput. Fluid Mech. 2020, 14, 202–221. [Google Scholar] [CrossRef] [Green Version]
  26. BS EN 14067-6: 2018 BSI Standards Publication Railway Applications–Aerodynamics; BSI: Brussels, Belgium, 2018.
  27. Diedrichs, B.; Ekequist, M.; Stichel, S.; Tengstrand, H. Part F: Journal of Rail and Rapid Transit Quasi-static modelling of wheel–rail reactions due to crosswind effects for various types of high-speed rolling stock. Proc. Inst. Mech. Eng. 2004, 218, 133–148. [Google Scholar] [CrossRef]
  28. Cai, C.S.; Chen, S.R. Framework of vehicle-bridge-wind dynamic analysis. J. Wind Eng. Ind. Aerodyn. 2004, 92, 579–607. [Google Scholar] [CrossRef]
  29. Zhou, Y.F.; Chen, S.R. Fully coupled driving safety analysis of moving traffic on long-span bridges subjected to crosswind. J. Wind Eng. Ind. Aerodyn. 2015, 143, 1–18. [Google Scholar] [CrossRef] [Green Version]
  30. Zhou, Y.F.; Chen, S.R. Vehicle ride comfort analysis with whole-body vibration on long-span bridges subjected to crosswind. J. Wind Eng. Ind. Aerodyn. 2016, 155, 126–140. [Google Scholar] [CrossRef] [Green Version]
  31. Zhu, Z.H.; Gong, W.; Wang, L.D.; Li, Q.; Bai, Y.; Yu, Z.; Harik, I.E. An efficient multi-time-step method for train-track-bridge interaction. Comput. Struct. 2018, 196, 36–48. [Google Scholar] [CrossRef]
  32. Zhu, Z.H.; Gong, W.; Wang, L.D.; Harik, I.E.; Bai, Y. A hybrid solution for studying vibrations of coupled train–track–bridge system. Adv. Struct. Eng. 2017, 20, 1699–1711. [Google Scholar] [CrossRef]
  33. Chu, C.R.; Chien, S.Y.; Wang, C.Y.; Wu, T.R. Numerical simulation of two trains intersecting in a tunnel. Tunn. Undergr. Sp. Technol. 2014, 42, 161–174. [Google Scholar] [CrossRef]
  34. Jeong, U.Y.; Koh, H.M.; Lee, H.S. Finite element formulation for the analysis of turbulent wind flow passing bluff structures using the RNG k-ε model. J. Wind Eng. Ind. Aerodyn. 2002, 90, 151–169. [Google Scholar] [CrossRef]
  35. Kim, J.J.; Baik, J.J. A numerical study of the effects of ambient wind direction on flow and dispersion in urban street canyons using the RNG k-ε turbulence model. Atmos. Environ. 2004, 38, 3039–3048. [Google Scholar] [CrossRef]
  36. Han, K.; Tian, H.Q. Research and application of testing technology of aerodynamics at train-tunnel entry on special passenger railway lines. J. Cent. South Univ. Sci. Technol. 2007, 38, 326–332. (In Chinese) [Google Scholar]
  37. Wan, X.Y.; Wu, J. In-situ test and study on the aerodynamic effect of the rolling stock passing through tunnels with a speed of 200 km/h. Mod. Tunn. Technol 2006, 143, 43–48. (In Chinese) [Google Scholar]
  38. Ministry of Railways of the, P.R.C. TB/T 2360-1993. Identification Method and Evaluation Standard for Dynamic Performance Test of Railway Locomotive; China Railway (Beijing) Culture Media Co., LTD.: Beijing, China, 1993. [Google Scholar]
  39. Standardization Administration of, P.R.C. GB5599-1985. Railway Trains–Specification for Evaluation the Dynamic Performance and Accreditation Test; Standards Press of China: Beijing, China, 1985. [Google Scholar]
  40. National Railway Administration of the P.R.C. TB/T 3352-2014. PSD of Ballastless Track Irregularities of High-Speed Railway; Standards Press of China: Beijing, China, 2014. [Google Scholar]
  41. Zhai, W.M.; Xia, H. Train-Track-Bridge Dynamic Interaction: Theory and Engineering Application; China Science publishing & Media Ltd.: Beijing, China, 2011. [Google Scholar]
  42. TG/03-2009. Railway Passenger Line Technical Management Measures; China Railway Publishing House: Beijing, China, 2009; (Part: 200–250 km/h).
  43. TG/04-2009. Railway Passenger Line Technical Management Measures; China Railway Publishing House: Beijing, China, 2009; (Part: 300–350 km/h).
  44. Olmos, J.M.; Astiz, M. Improvement of the lateral dynamic response of a high pier viaduct under turbulent wind during the high-speed train travel. Eng. Struct. 2018, 165, 368–385. [Google Scholar] [CrossRef]
Figure 1. Wind barriers shaped cut-and-cover tunnels for some high-speed railway in China.
Applsci 10 01445 g001
Figure 2. High-speed vehicle model: (a) side elevation, (b) plan view, and (c) end view.
Applsci 10 01445 g002
Figure 3. Model of track.
Applsci 10 01445 g003
Figure 4. Schematic diagram of track irregularity.
Applsci 10 01445 g004
Figure 5. Calculation schematic of aerodynamic loads.
Applsci 10 01445 g005
Figure 6. Typical numerical configuration of plan view.
Applsci 10 01445 g006
Figure 7. Schematic diagram of mesh model.
Applsci 10 01445 g007
Figure 8. Outline of the wind–train–rail structure (WTRSDYNA) coupling solution.
Applsci 10 01445 g008
Figure 9. The target indicators under different conditions: (a) different numbers of longitudinal segments; (b) different numbers of circumferential calculation faces (train speed = 250 km/h; wind velocity = 25 m/s).
Applsci 10 01445 g009
Figure 10. Time-history of the side force of head carriage during the train entering tunnel under three boundary conditions (train speed = 250 km/h).
Applsci 10 01445 g010
Figure 11. Maximum side force of three carriages under conditions of (a) different boundary layer densities and (b) mesh element numbers (train speed = 250 km/h; wind velocity = 25 m/s).
Applsci 10 01445 g011
Figure 12. The numerical model corresponding to the field test.
Applsci 10 01445 g012
Figure 13. Comparison of the time history of pressure on the train surface between the field test and the present numerical simulation (train speed = 200 km/h; wind velocity = 0 m/s).
Applsci 10 01445 g013
Figure 14. Pressure and flow distribution for train speed = 250 km/h, crosswind velocity = 15 m/s, (a) z = 1.55 m from top of rail, (b) 10 m outside tunnel entrance, and (c) 10 m inside tunnel entrance.
Applsci 10 01445 g014
Figure 15. Pressure and flow distribution for train speed = 250 km/h, crosswind velocity = 25 m/s, (a) z = 1.55 m from top of rail, (b) 10 m outside tunnel entrance, and (c) 10 m inside tunnel entrance.
Applsci 10 01445 g015
Figure 16. Evolution of five aerodynamic loads with respect to time during the train entering the tunnel (train speed = 250 km/h, crosswind velocity = 25 m/s): (a)side force; (b)lift force; (c) rolling moment; (d) pitching moment; (e) yawing moment.
Applsci 10 01445 g016aApplsci 10 01445 g016b
Figure 17. Time-history of head carriage derailment coefficient (DC) conditioned train speed 250 km/h, crosswind velocity 15 m/s, (a) 1st wheelset, (b) 2nd wheelset, (c) 3rd wheelset, (d) 4th wheelset (open air (OA); entering entrance (E); tunnel (T)).
Applsci 10 01445 g017aApplsci 10 01445 g017b
Figure 18. Time-history of head carriage DC conditioned train speed 250 km/h, crosswind velocity 25 m/s, (a) 1st wheelset, (b) 2nd wheelset, (c) 3rd wheelset, (d) 4th wheelset (open air (OA); entering entrance (E); tunnel (T)).
Applsci 10 01445 g018aApplsci 10 01445 g018b
Figure 19. Contrast of global maximum derailment coefficients conditioned train speed 250 km/h, crosswind velocity 25 m/s: (a) head, (b) middle, and (c) rear carriages.
Applsci 10 01445 g019
Figure 20. Time-history of head carriage WRR conditioned train speed 250 km/h, crosswind velocity 15 m/s, (a) 1st wheelset, (b) 2nd wheelset, (c) 3rd wheelset, (d) 4th wheelset (open air (OA); entering entrance (E); tunnel (T)).
Applsci 10 01445 g020aApplsci 10 01445 g020b
Figure 21. Contrast of global maximum wheel reduction rate conditioned train speed 250 km/h, crosswind velocity 25 m/s: (a) head, (b) middle, and (c) rear carriages.
Applsci 10 01445 g021
Figure 22. Time-history of the wheel load reduction rate (WRR) in the first wheelset of the head carriage under conditions of different track irregularity spectrums, (a) present study, (b) Chinese code (open air (OA); entering entrance (E); tunnel (T), train speed = 250 km/h, no crosswind).
Applsci 10 01445 g022
Figure 23. Partial magnification of the wheel reduction rate at the third wheel of the windward side of the head carriage: (a) train speed = 250 km/h and (b) train speed = 300 km/h.
Applsci 10 01445 g023
Figure 24. Safety domain when high-speed train enters tunnel from crosswind.
Applsci 10 01445 g024
Table 1. Value of the main parameters of the vehicle subsystem.
NotationValueUnit
Head (or Rear) CarriageMiddle Carriage
m c 3.96 × 1043.44 × 104kg
J x c 1.015 × 1057.4 × 104kg·m2
J y c 2.74 × 1062.74 × 106kg·m2
J z c 1.0644 × 1062.74 × 106kg·m2
m b 3.2 × 1032.6 × 103kg
J x b 3.2 × 1031.6 × 103kg·m2
J y b 8.6 × 1031.7 × 103kg·m2
J z b 7.2 × 1031.7 × 103kg·m2
m w 2.4 × 1032.4 × 103kg
J x w 1.2 × 1031.2 × 103kg·m2
J y w 1.2 × 1031.2 × 103kg·m2
k p x 9 × 10³kN/m
k p y 1.04 × 10³kN/m
k p z 3 × 10³kN/m
k t x 2.4 × 10²kN/m
k t y 4 × 10²kN/m
k t z 2.4 × 10²kN/m
c 1 x 5kN.s/m
c 1 y 10kN.s/m
c 1 z 5kN.s/m
c 2 x 10kN.s/m
c 2 y 10kN.s/m
c 2 z 30kN.s/m
d s k 0.95m
d w k 1m
l t 1.25m
l c 8.75m
H c b 0.14m
H b t 0.14m
H t w 0.64m
Table 2. Safety limits of the DC.
Safety GradeSuperiorGoodQualified
DC≤0.6≤0.8≤0.9

