Adsorption Cold Storage for Mobile Applications


Istituto per le Tecnologie Avanzate per l’Energia (ITAE-CNR), Via S. Lucia sopra Contesse n°5, 98126 S. Lucia, Messina, Italy
*
Author to whom correspondence should be addressed.
Appl. Sci. 2020, 10(6), 2044; https://doi.org/10.3390/app10062044
Submission received: 4 February 2020
/
Revised: 9 March 2020
/
Accepted: 11 March 2020
/
Published: 18 March 2020
(This article belongs to the Special Issue The State of the Art of Thermo-Chemical Heat Storage)
Abstract
:Featured Application
The present article describes the realization and testing of two different types of cold storage for a mobile refrigeration application, based on two innovative adsorbent reactors. The proposed solution uses the heat produced by the ICE to drive an adsorption cold storage system. It could be used as a back-up refrigeration system during a vehicle-stopping period (e.g., the operator’s lunch break), reducing vehicle CO2 emissions.
Abstract
In recent years, hot and cold storage systems demonstrated themselves to be key components, especially in systems for waste heat exploitation. Moreover, mobile A/C and refrigeration set new efficiency challenges in the field of goods and passengers transport. In such a context, adsorption cold storage devices enable new possibilities and show promising features: high energy density and the possibility of being operated both for heat and cold release to the user. However, only a few studies on small and compact systems for mobile applications have been carried out so far, especially for cold storage exploiting low-temperature sources (<100 °C). The present paper describes the realization and testing of two different types of cold storage based on two innovative adsorbent reactors: a pelletized adsorber filled with commercial FAM Z02 zeolite, and a composite adsorber based on an aluminum porous structure and a SAPO-34 coating. An already developed testing procedure was employed to characterize the prototypes under cold storage mode for mobile refrigeration purposes. The test clearly showed that prototypes can store up to 580 Wh, with an average power during the discharging phase that ranges from 200 W to 820 W and an energy efficiency of 0.3 Whdischarged/Whcharged for the operations in the selected conditions, thus revealing promising opportunities for future further developments.
1. Introduction
The use of renewable energy sources and waste energy is an important task in order to fulfill the newest energy demands [1], especially for heating/cooling and refrigeration purposes, not only for stationary applications (residential and industrial buildings) but also for mobile uses.
Nowadays, mobile A/C and refrigeration are solely based on vapor compression systems, wherein the compressor is mechanically driven by the vehicle engine. Although it is subjected to a phase-out, the most used refrigerant is still HFC-134a, with a global warming potential (GWP) of 1300: if services and end-of-life are considered, it results in equivalent CO2 emissions in the range 15–37 g/km for a vehicle traveling 12,000 km/y [2,3]. Such an environmental impact, neglected by manufacturers and regulations, is equivalent to 16%–39% of the limits set by European emission standards for new passenger cars in 2020.
Refrigerated freight transport is mainly achieved through vapour compression as well, often run by low-efficiency, high-emission auxiliary units (diesel or electric), and presents several criticalities, including a low COP (Coefficient of Performance) ≈ 0.5–1.75, the employment of R404a, and a GWP of 3922 [4]. Alternative systems based on eutectic solutions (cold storage in phase change materials) or cryogenic cooling (with liquid nitrogen) are have been spreading recently. These scale down the issue of refrigerant losses, but do not avoid the energy consumption by refrigeration.
Contrarily, the heat generated by internal combustion engines (ICE) can supply thermally-driven technologies, in order to provide refrigeration for transport. Thermoelectric systems can combine the Seebeck and Peltier effects to generate electric power by heat and produce cooling power by electricity, but their low efficiency prevents practical use. Alternatives could be thermoacoustic refrigeration and the ejector refrigeration cycle. Despite the prospective low cost and durability, which resulted in interest from automotive manufacturers such as Mazda and Peugeot, thermoacoustic refrigeration for mobile applications is still at a basic research level, due to its low efficiency, just like the ejector refrigeration cycle.
Instead, great effort has been applied in the field of adsorption storage for refrigeration for road transport applications, which represent a mature technology: several working pairs have been studied for mobile applications (water/ammonia, silica gel/water, zeolite/water) and commercial products have been available for stationary applications since decades ago. On the other hand, they are generally affected by high specific volume and weight, entailing the need for further development to be successfully applied to transport A/C and refrigeration. This has been a specific subject of the TOPMACS European project, whose aims included the development of a sorption A/C system for heavy trucks supplied by the heat from the engine coolant loop rather than by the flue gases [5]. This TOPMACS prototype was designed and realized by ITAE-CNR [6].
Food and medicine transportation are two further sectors wherein cooling demand requires significant energy consumption. Most of the studies aimed at the reduction of such consumption focused on the use of high-temperature waste heat from the flue gases of the I.C. engine, needed to run a sorption appliance intended for ice-making or sub-zero refrigeration.
To that end, cold storage is a viable technology: the use of sensible heat is the most commonly used technology, even if latent heat, sorption heat, and thermochemical heat storage technology are always more often used nowadays [7]. Thanks to the great advancements in the last few years, adsorption technology has become even more frequently used for cooling/heating production, thanks also to the different units available on the market [8,9]. Cooling (from the evaporator) or heating (from the adsorber) effects could be achieved as a function of working conditions. Thanks to its environmental advantages, water is the most used working fluid, even though other substances could be used, especially when a low evaporation temperature (below 0 °C) would be achieved.
However, few studies on small and compact systems for mobile applications have been carried out so far [10].
In [11] the authors theoretically and experimentally investigated the performance of a 1 kW lab-scale prototype based on LiCl-Water pair. Even though the system was designed for heat storage, experiments showed it was possible to generate cold during the discharging process. However, the authors only provide heating mode performance and efficiency: with an input of 2708 kJ, the recovered heat was 2517 kJ, resulting in a heat storage efficiency of 93% with a heat storage density of 874 kJ/kg consolidated sorbent or 2622 kJ per kg of pure LiCl. Jiang et al. [12] studied an innovative modular sorption cell for cold and heat cogeneration. Results showed good performance in terms of energy density and power density: the stored energy density ranges from 580 kJ/kg to 1368 kJ/kg, whereas cold density ranges from 400 kJ/kg to 1134 kJ/kg; heat and cold power density range from 322 W/kg to 1502 W/kg and from 222 W/kg to 946 W/kg.
The present paper describes the experimental testing of two different types of cold storage for mobile refrigeration applications based on two innovative adsorbent reactors: a pelletized adsorber filled with commercial FAM Z02 zeolite, and a composite adsorber based on an aluminum, porous structure and a SAPO-34 coating.
2. Materials and Methods
2.1. Concept Description
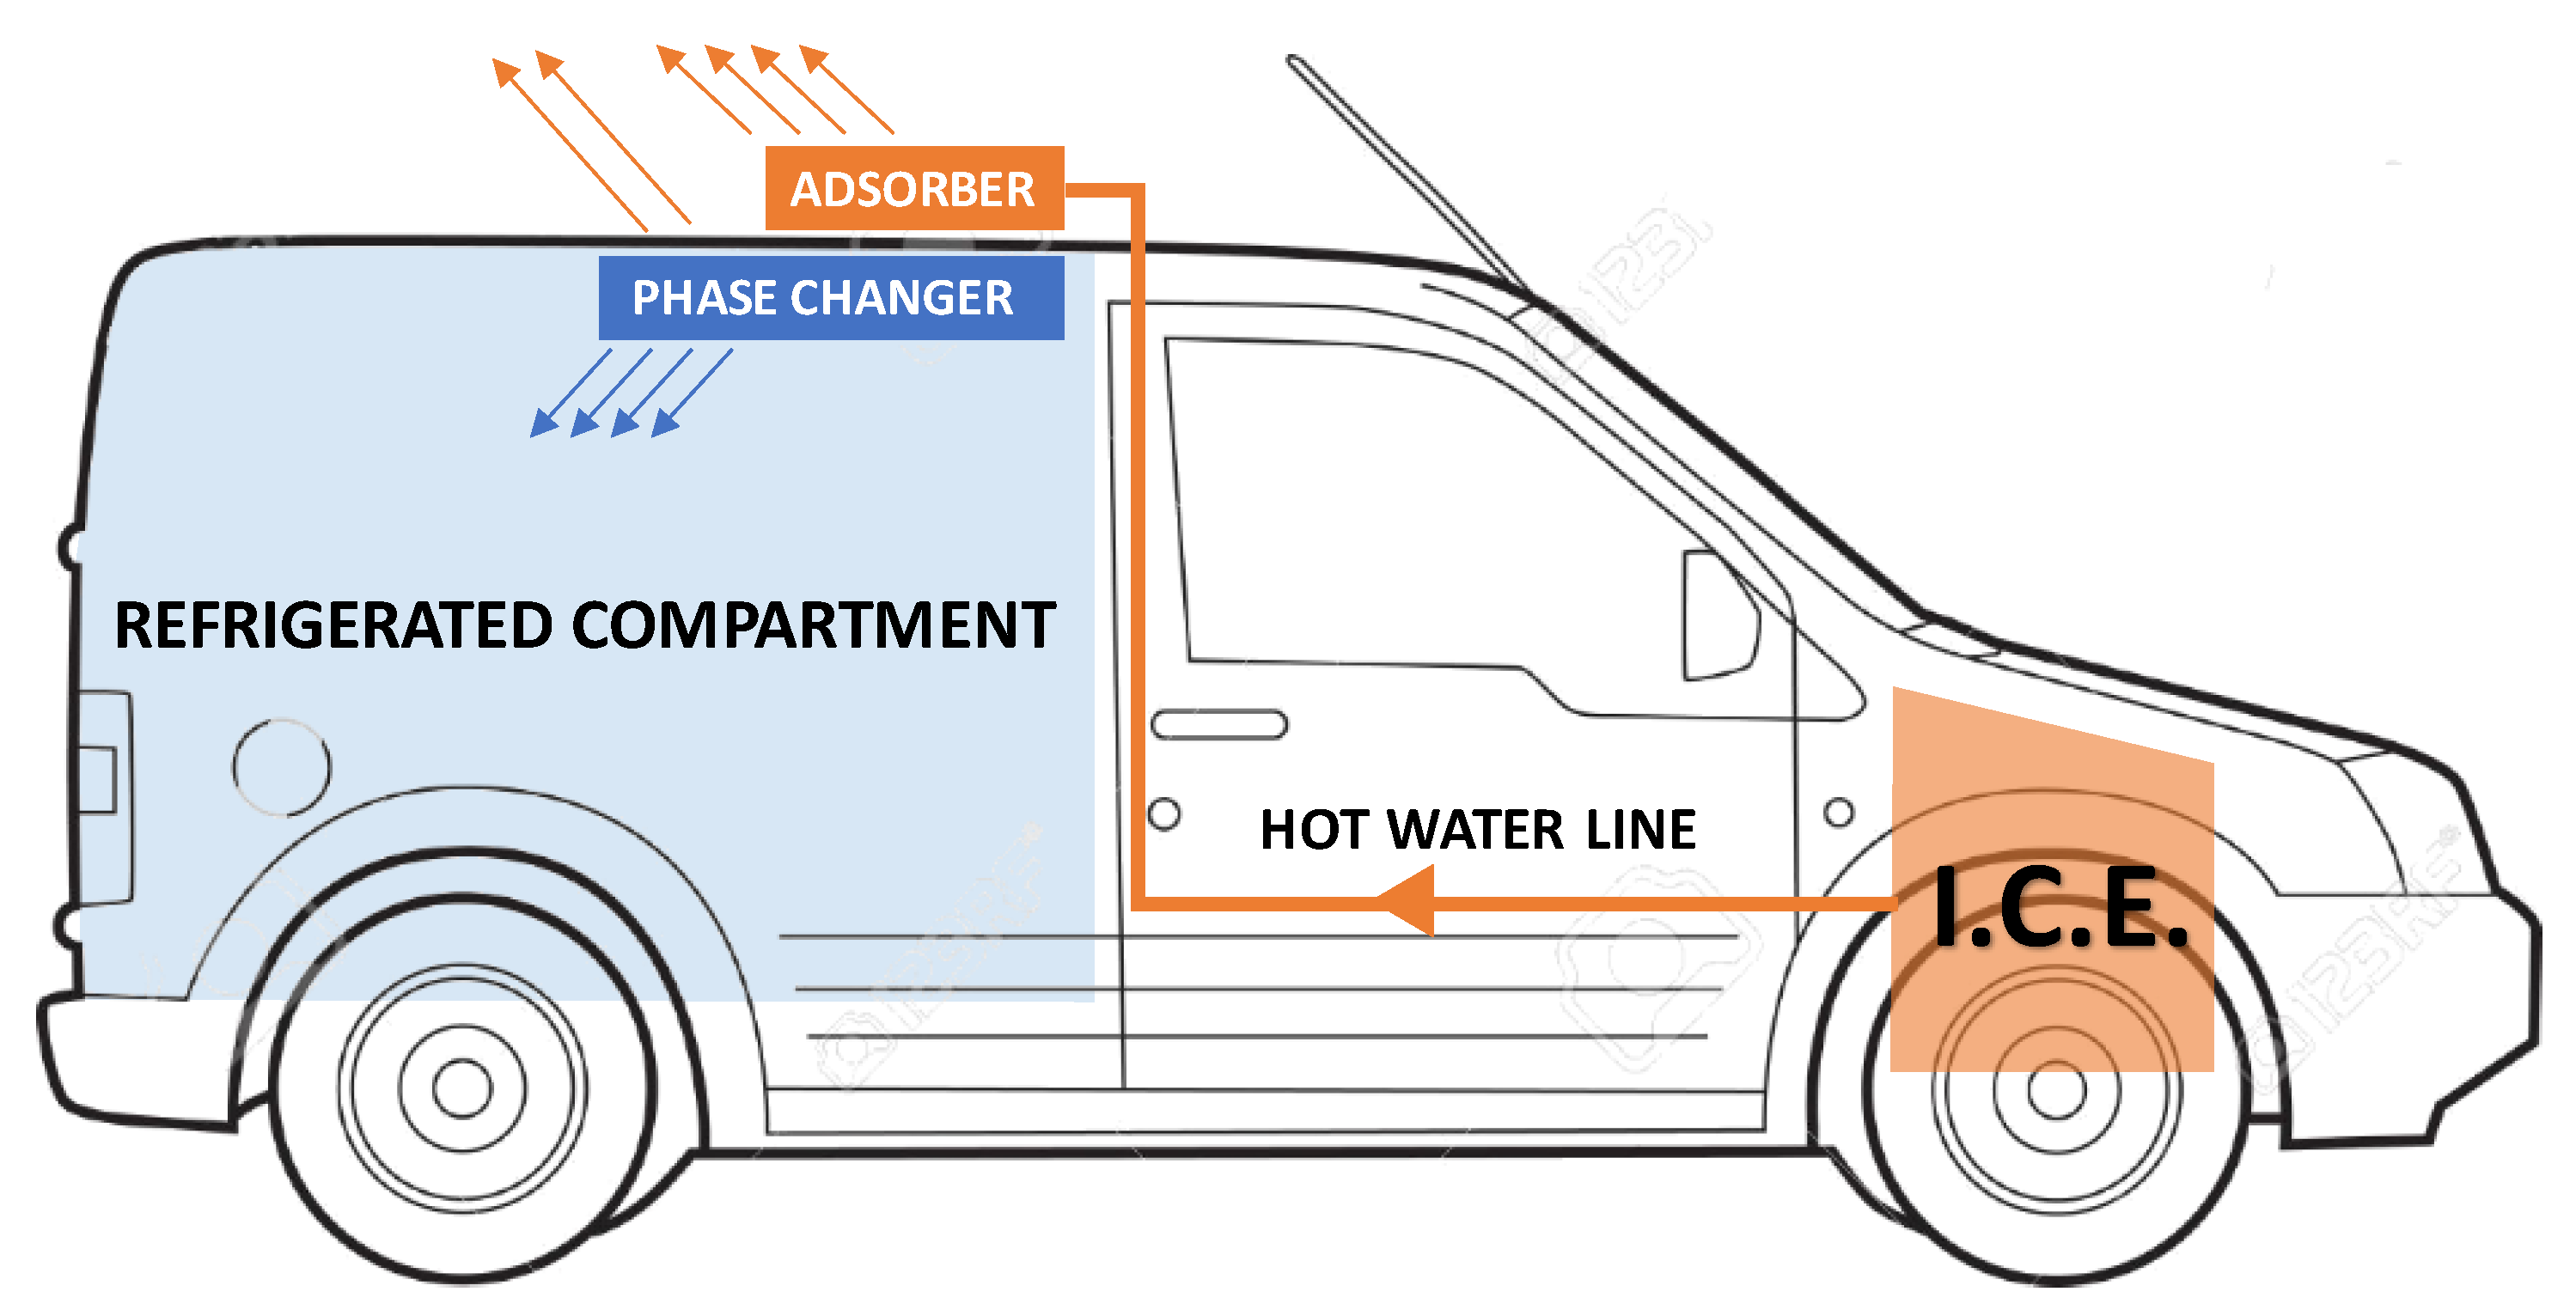
The main idea behind the study we conducted is the possibility of using waste heat from the I.C.E. of a small vehicle for the transport of perishable goods (e.g., food or medicine) to refrigerate the load compartment during the parking phases for a limited time (1–2 h). While the vehicle is running, the heat taken from the engine-cooling loop is used to “recharge” the cold storage system located near the refrigerated compartment. During a stop, when the internal combustion engine is no longer able to supply mechanical or thermal energy, the system is “discharged” to generate the cold necessary to maintain the temperature in the load compartment Figure 1. The “recharge” phase considered in this study hypothesizes that the ICE is at the normal working temperature (85–90 °C) which is maintained almost constant by the engine cooling system already installed in the vehicle. The ICE warm-up cycle was not considered due to the lower engine efficiency.
2.2. Design of the Adsorber
The first task carried out within the research was the sizing and design of the small cold sorption storage system. The system realized consists of an adsorber and a phase-changer, and it operates according to the working principle already described in [13].
In order to size the adsorber (amount of zeolite necessary) data, the constraints provided by an industrial company—which works in the field of small refrigeration systems for vans—have been taken into account. The thermal losses through the shell of the condenser/evaporator have been roughly considered as well. In Table 1 the main data and constraints are shown. However, the constraints refer to the full-scale system to be realized after lab tests. Indeed, for evaluation purposes, a prototype with 25% of the final capacity was designed, as reported in the bottom lines of Table 1.
The reactor realized mainly consists of an aluminum heat exchanger and a zeolitic adsorbent material: the pelletized adsorber is made of a finned heat exchanger (of automotive origin) having flat aluminum tubes, filled with FAM Z02 pellets with a grain size of 0.5–0.8 mm; the composite adsorber is instead based on an aluminum heat exchanger with flat-type tubes and a porous aluminum structure coated with SAPO-34 zeolitic coating.
A further step has been considered for a more accurate design of the system, by considering the thermal losses of the shell as well. Table 2 shows the obtained results: the columns “theoretical” and “real” refer to the ideal sizing (no thermal losses considered) and to a more accurate calculation respectively. The latter results, therefore, take into account an 80 W heat dissipation through the shell of the condenser/evaporator and a safety factor of 1.1 as well.
2.3. The Phase Changer
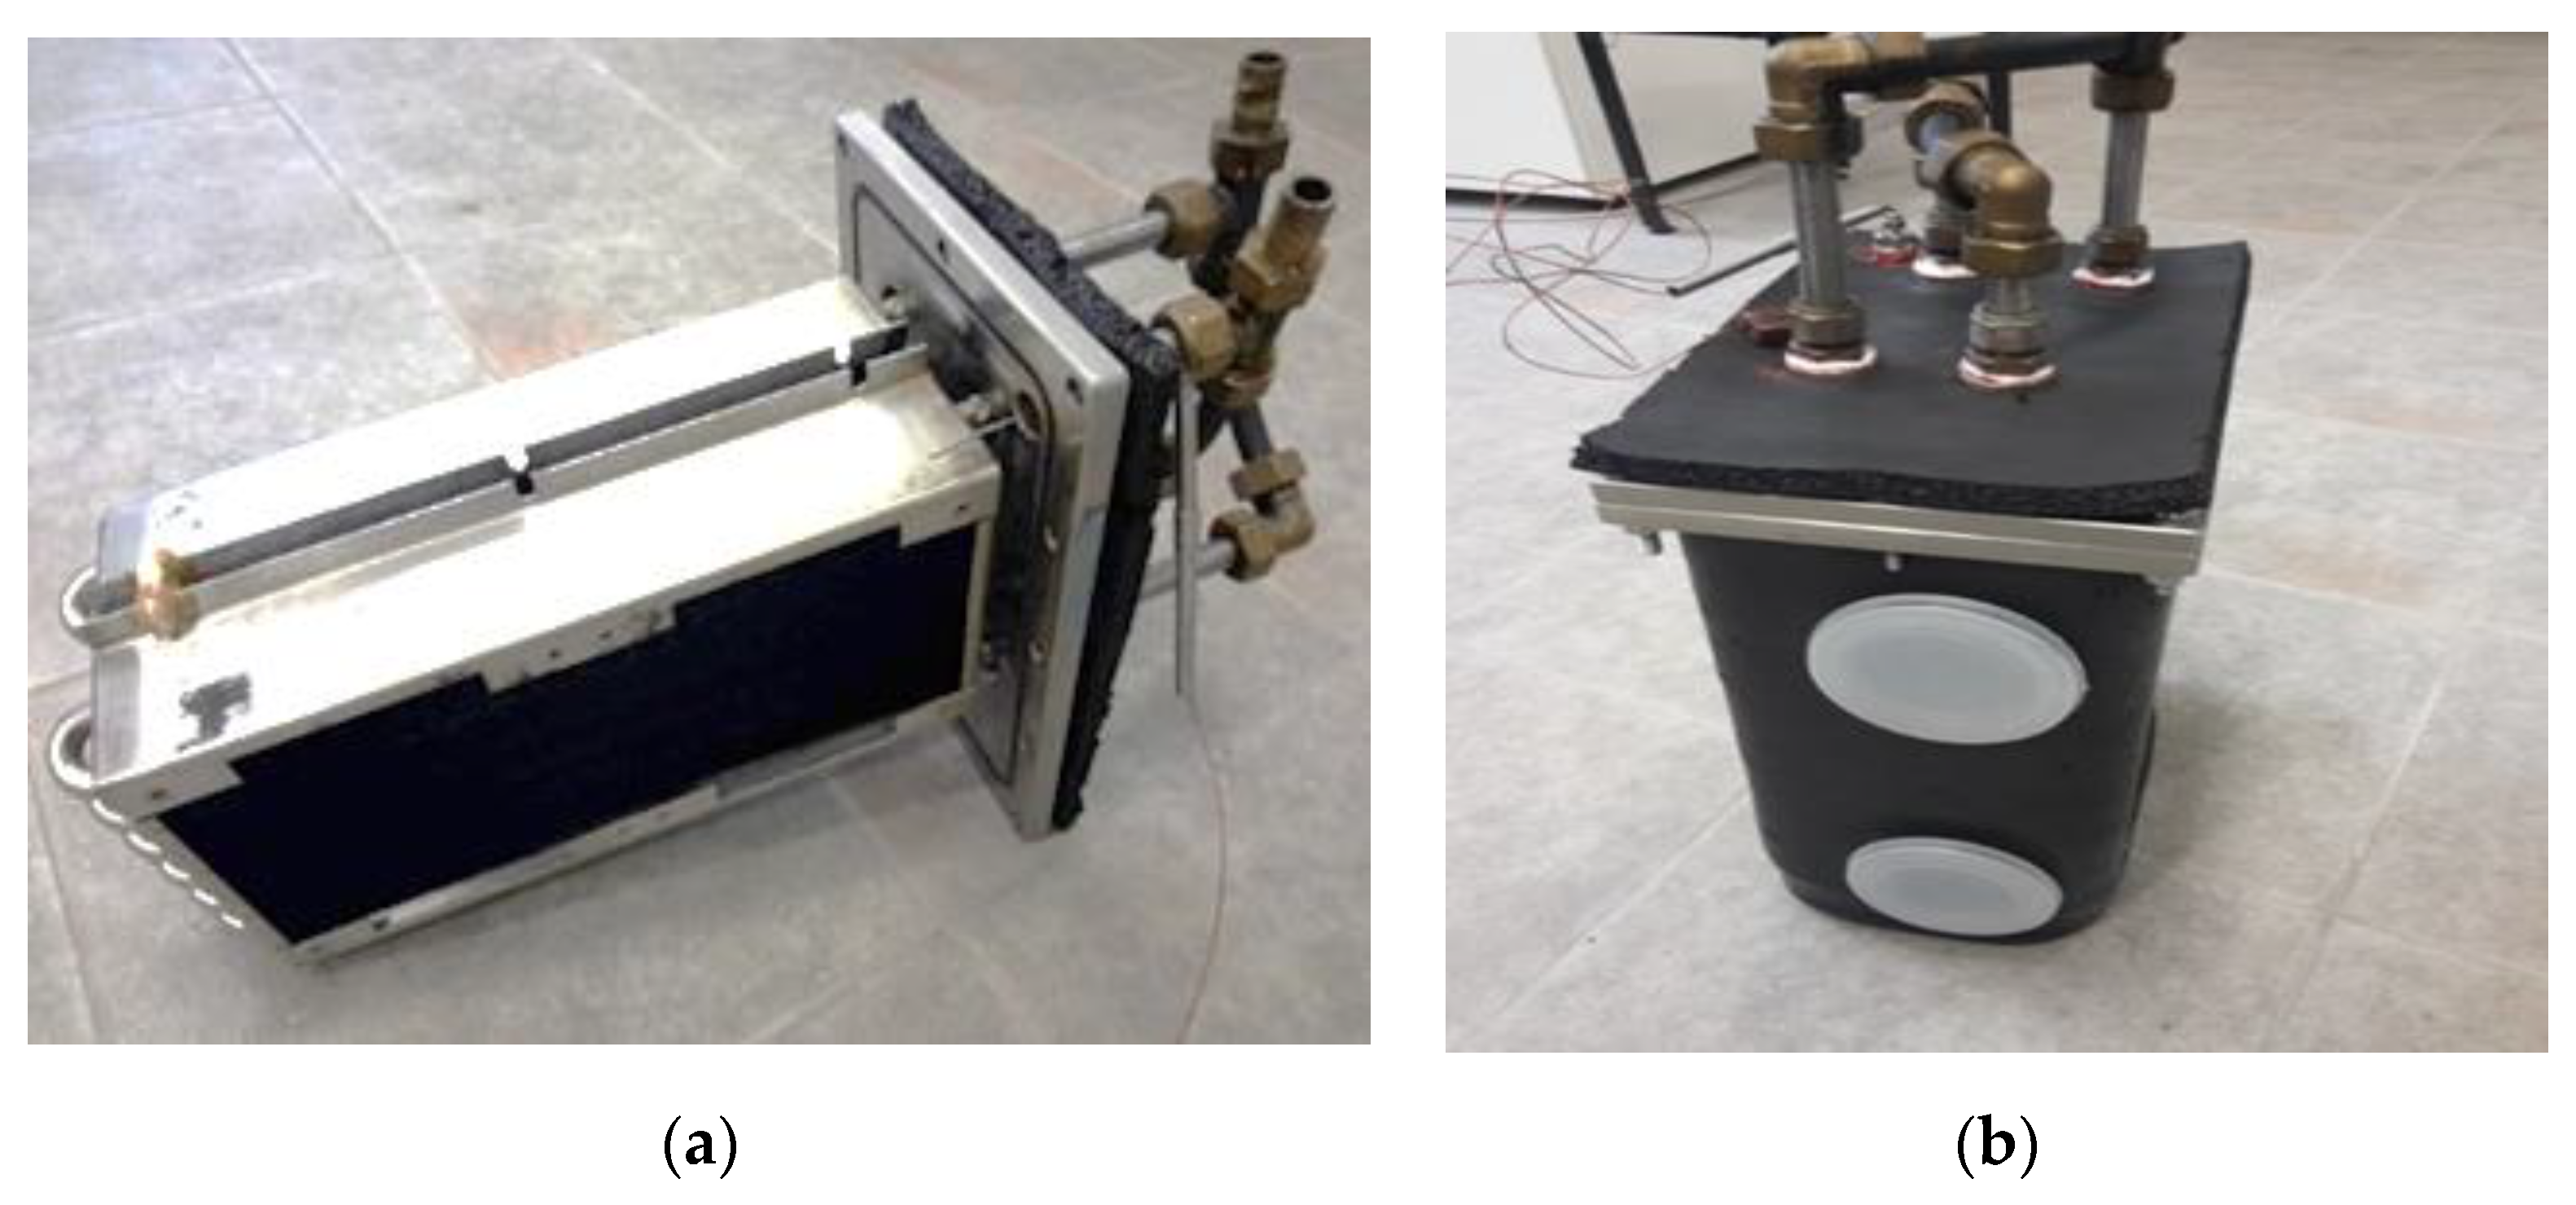
For the phase changer, an existing condenser/evaporator, already developed at ITAE for mobile applications, was used. It is made up of two highly efficient commercial heat exchangers, represented in Figure 2. They have copper fins and stainless steel tubes, to avoid corrosion issues when in direct contact with liquid water. Each heat exchanger has a surface area on the fin side of 0.988 m2; the tube side has a 0.078 m2 thermal contact area; and the fin density is 16 FPI (fins per inch). The exchangers were connected in parallel by means of a hydraulic circuit made with steel pipes and compression fittings on the outside of the vacuum chamber. The vacuum chamber, in which the heat exchanger has been placed, is made of AISI 316 stainless steel and is equipped with vacuum flanges for the connections of all the relevant equipment.
2.4. The Hydraulic Circuit
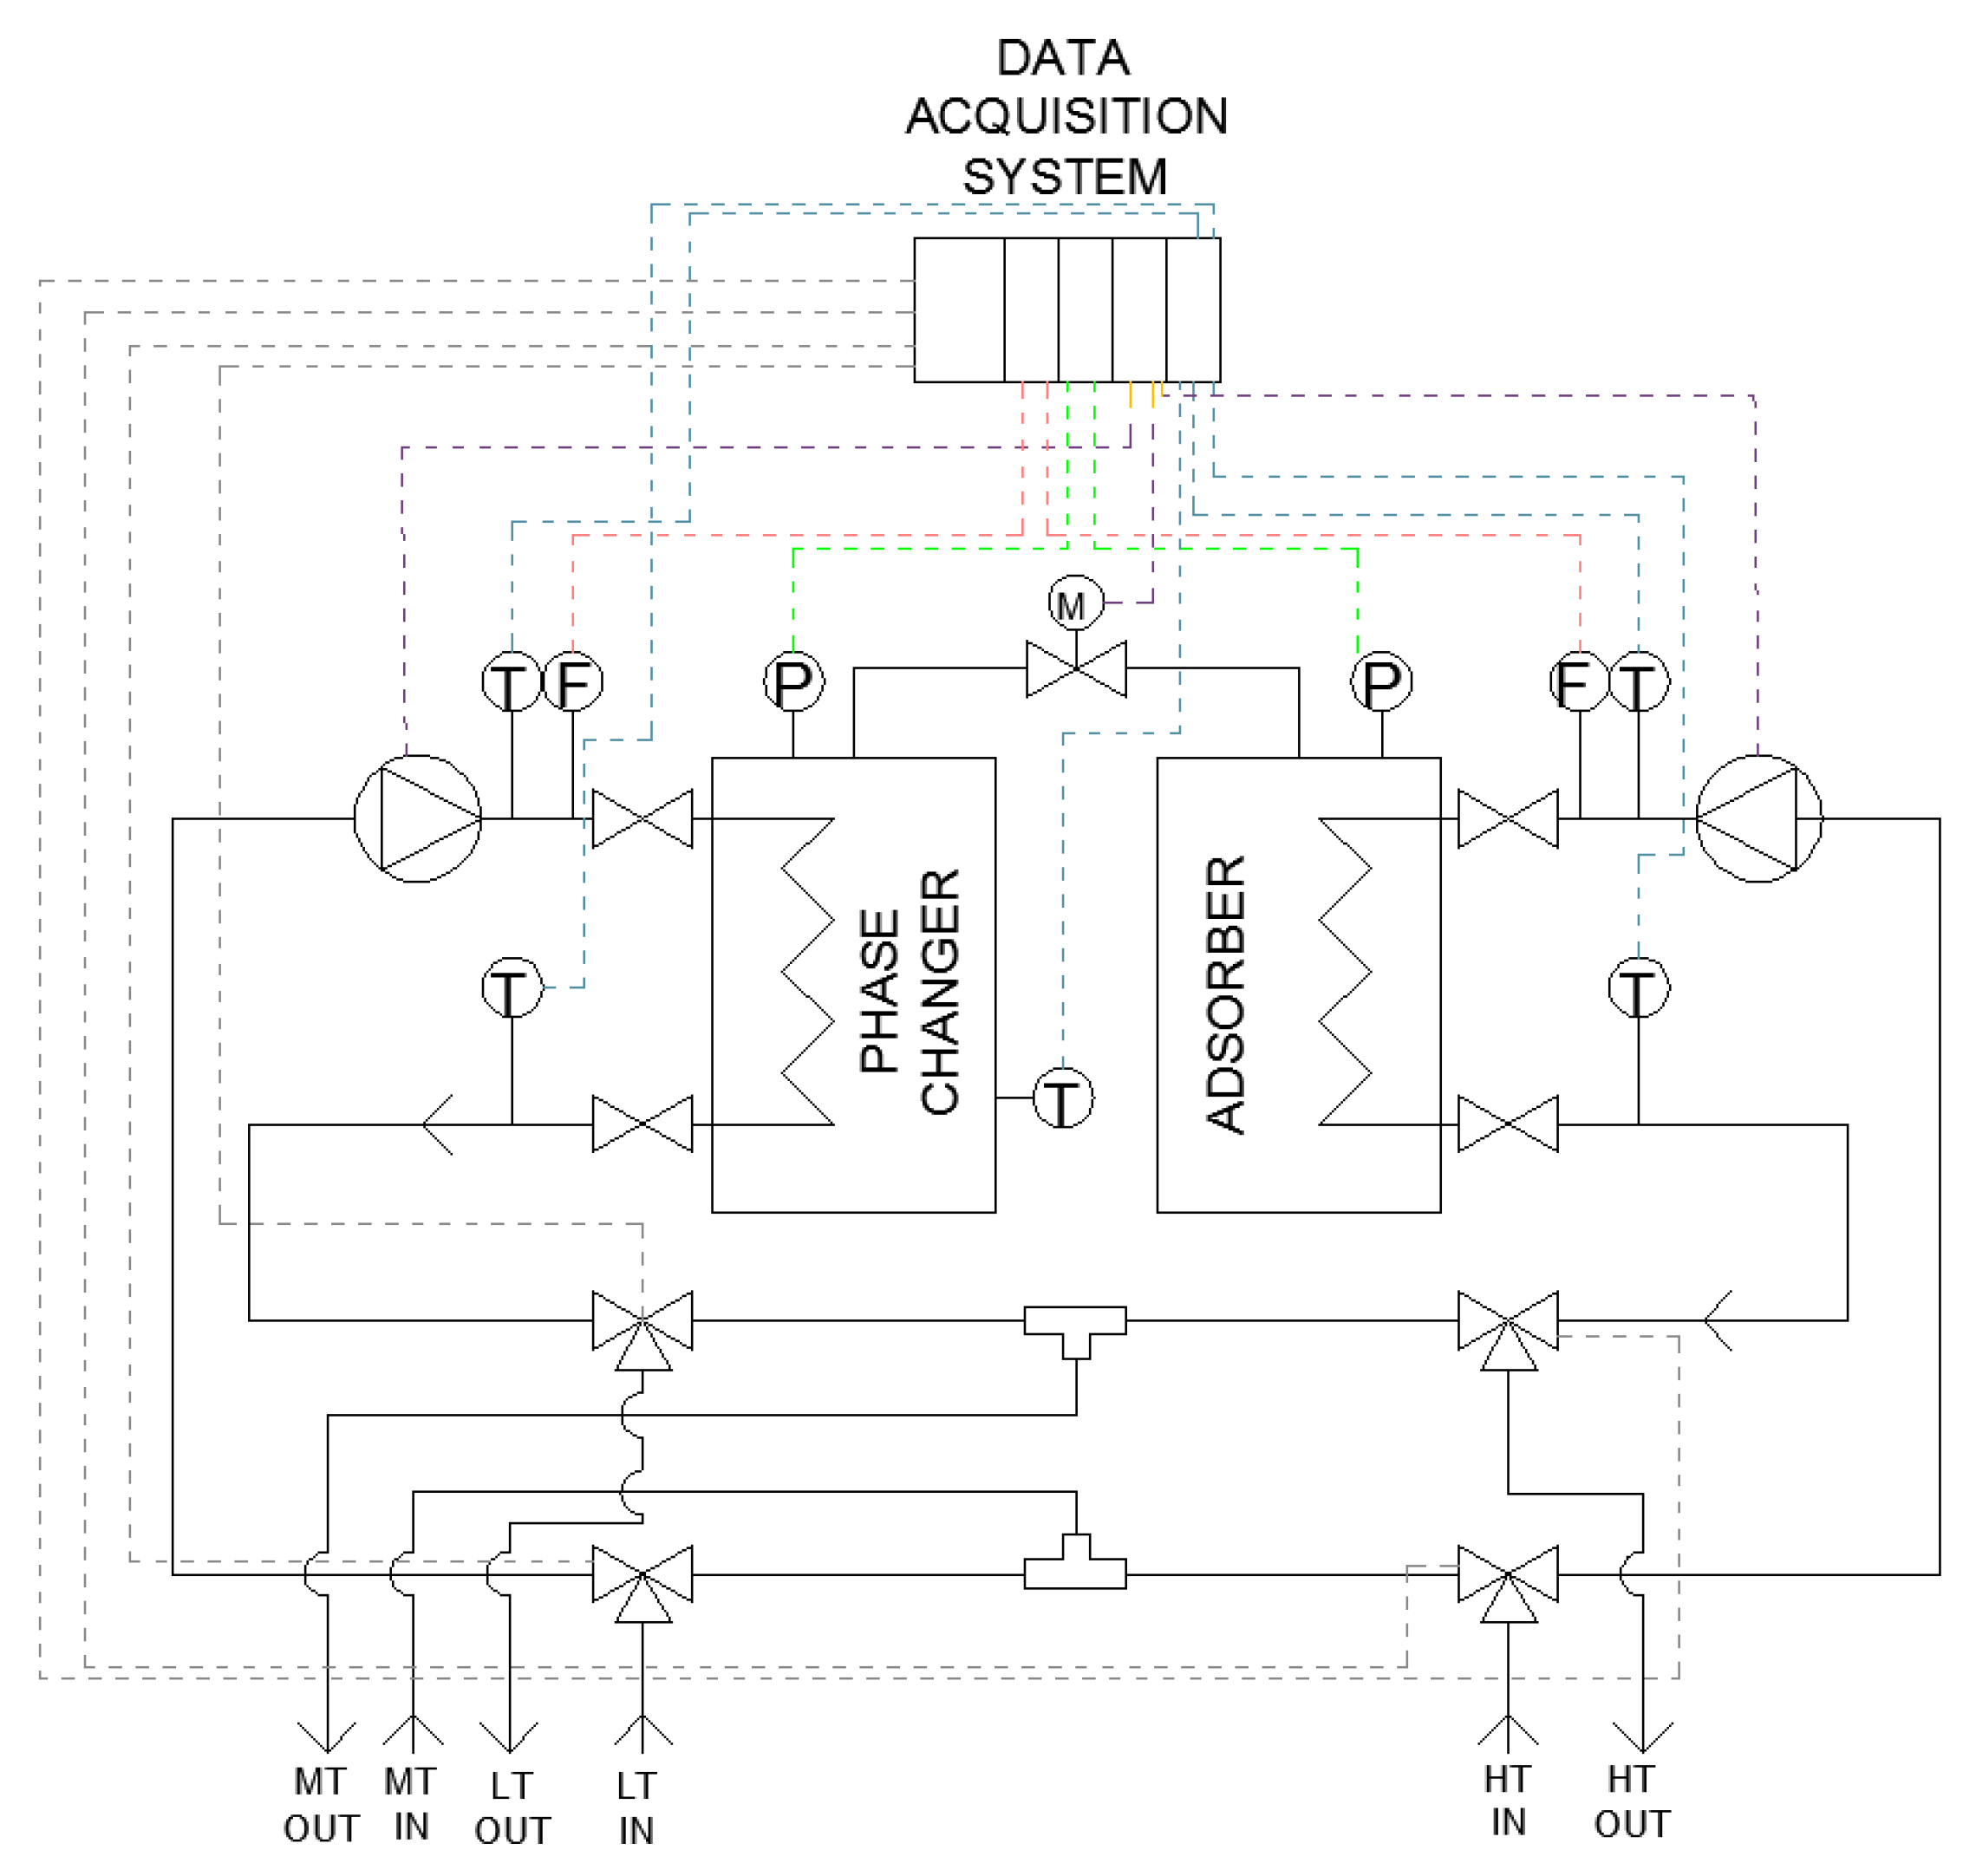
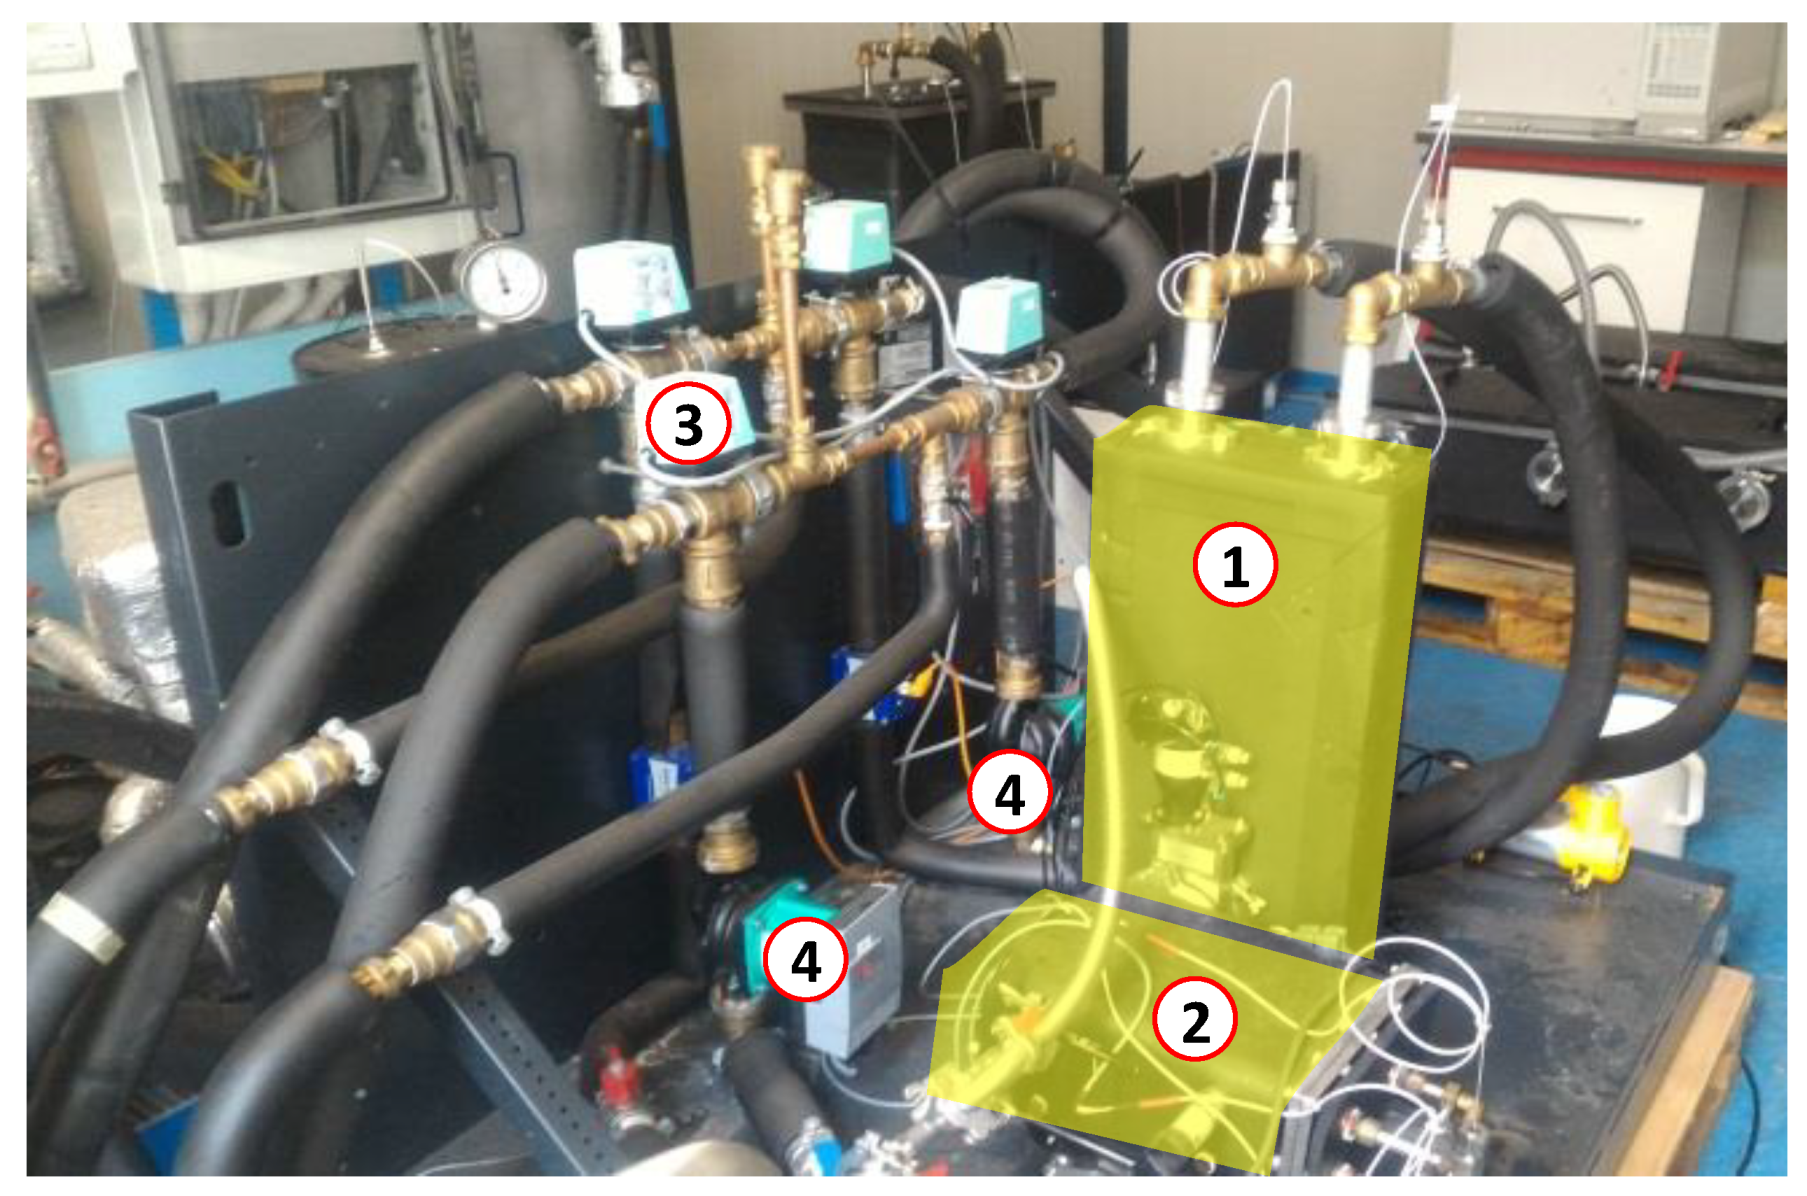
The schematic layout of the realized testing bench is shown in Figure 3, wherein both the hydraulic circuit and the electronic connections to the acquisition system are depicted. Figure 4 shows the experimental setup installed at CENTROPROVE of the ITAE-CNR Institute in Messina.
A data acquisition and control system was realized by a specific software implemented in LabVIEW; it allows the fully automatic operation of the system and records all the measured parameters. The control system uses Compact FieldPoint® acquisition boards for the connection and management of the transducers and the valves. The parameters monitored by the system are shown in Table 3. Moreover, the commands for the deviating valves and to control the speed of the two pumps on the bench have been implemented.
2.5. Testing Procedure
To guarantee the repeatability of the tests and to provide reliable data to be used, for example, as input for calculation methods or the development of numerical models, a specific testing procedure has been developed during the preliminary phase of the activity.
The test is performed as follows: after all the set levels of temperature have been defined, the adsorption cycles are started and oscillation in temperatures is monitored. Once a steady-state condition has been reached, a record is started and all the energy flows are measured for 1 h or 6 cycles (for the longest cycle times), by evaluating the thermal power exchanged across each adsorption machine component. The last three cycles are then analyzed for performance evaluation.
Three main figures of merit have been considered for the assessment of the performance of the small storage:
- The average discharge power during each cycle, calculated as the mean power during the discharge phase.
- The stored energy for mass unit of the adsorbent, calculated as the ratio of the total energy stored during each test and the total mass of adsorbent:
- The thermal COP of the system; in this case, corresponds to the storage efficiency of the system, since it is the ratio between the cooling energy recovered and the energy used as input.
2.5.1. Testing Procedure for a Pelletized Adsorber
The storage testing conditions are summarized in Table 4. As is visible, the inlet temperature for the heat source has been kept constant to 90 °C, while different condensation temperatures and evaporation temperatures have been considered: from 25 °C to 40 °C for the former and from 10 °C to 22 °C for the latter. Such a choice has been realized in order to cover a wide range of different possible applications for the system, corresponding to different climates and different user requirements.
2.5.2. Testing Procedure with the Composite Adsorber Based on an Aluminum, Porous Structure and a SAPO-34 Coating
Compared to the adsorber realized with zeolite pellets, more focus has been put on the composite adsorber based on an aluminum, porous structure and a SAPO-34 coating, to have as wide a characterization as possible. To that end, different testing conditions were considered, which can be divided into three main categories:
- Initial “mapping” tests, aimed at defining the achievable energy capacity under different boundary conditions.
- “Charge effect” tests, aimed at defining the possible benefits arising from realizing the charge of the system with a low condensation temperature. Such tests were realized in various boundary conditions as well, in order to obtain information useful for different applications.
- Four temperature tests, during which the charging of the system with a low condensation temperature, the release of adsorption heat, and the removal of heat at different temperatures have been analyzed.
During the tests of the composite adsorber based on an aluminum, porous structure and a SAPO-34 coating, attention was paid in order to have some experimental points be under conditions comparable with those already tested with the pellet adsorber, so as to realize a direct comparison of the two technologies. However, since a wide range of applications could be imagined for the small cold storage system tested, different condensation and evaporation temperatures were considered as well. Moreover, the effect of the flow rate at the phase changer and the adsorber has been evaluated. It is worth remarking that, for all the tests reported in the present section, the operation of the system was realized at three different temperature levels:
- Heat of desorption is provided at the temperature of the heat source—HT (high temperature);
- Heat of condensation and heat of adsorption are released at the same temperature—MT (medium temperature);
- Heat of evaporation is provided at a temperature level suitable for the user—LT (low temperature).
The testing conditions are summarized in Table 5.
3. Results
3.1. Trend of a Typical Test
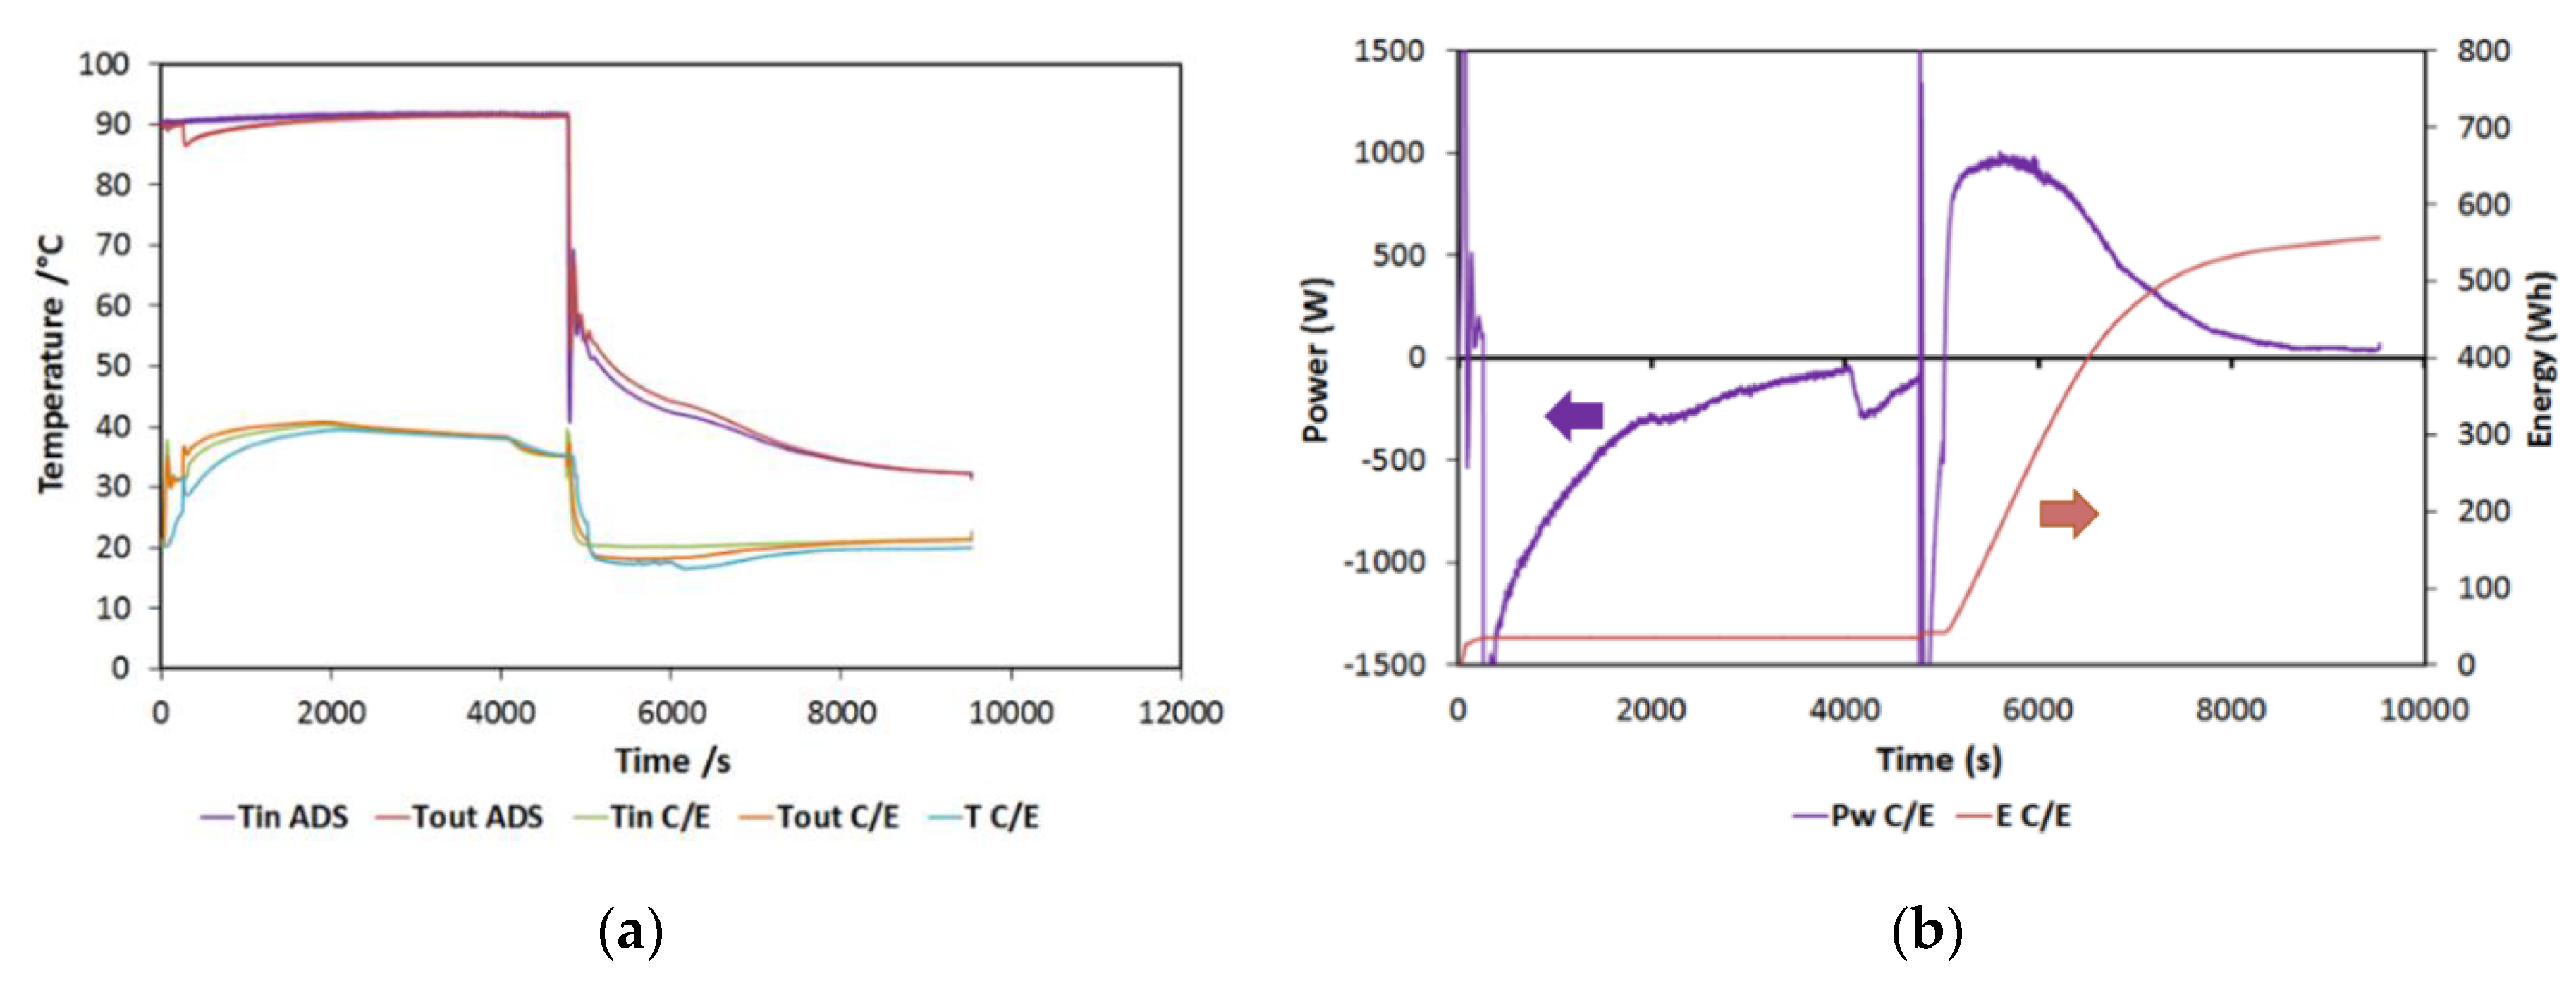
In this section, a typical test will be briefly discussed. In Figure 5a, the typical trends of the temperatures in the components are reported for a 90/38/20 (HT/MT/LT) test. They are consistent with the operation of typical sorption storage: during the first half of the cycle, the adsorber is heated, while the condenser is cooled down. Both the temperatures are constant, indicating a good capacity of the testing bench in terms of maintaining the set conditions. During the second part of the cycle, the useful effect is visualized by the reduction in the temperature at the evaporator (the blue line in the figure), while the adsorber is cooled. During the tests, the same temperature was used both for condensation and for adsorption (three temperature levels).
Instead, in Figure 5b, the power and energy measured at the phase changer are reported. In particular, the power in the negative part of the chart is the condensation power, while the one in the positive part is the evaporation one. Energy (which is represented on the secondary axis on the right) has been instead calculated only for the evaporation, representing the useful effect on the cycle in the present configuration. The curve, in particular, represents the cumulative energy recovered, which, for the examined cycle, amounts to 580 Wh.
3.2. Testing Results for a Pelletized Adsorber
In this section, the results obtained during the tests will be discussed. It is worth noticing that most of them were mainly used afterward for future comparison with the other adsorber, and therefore, new aggregation tables or charts can be found in the following parts of this paper.
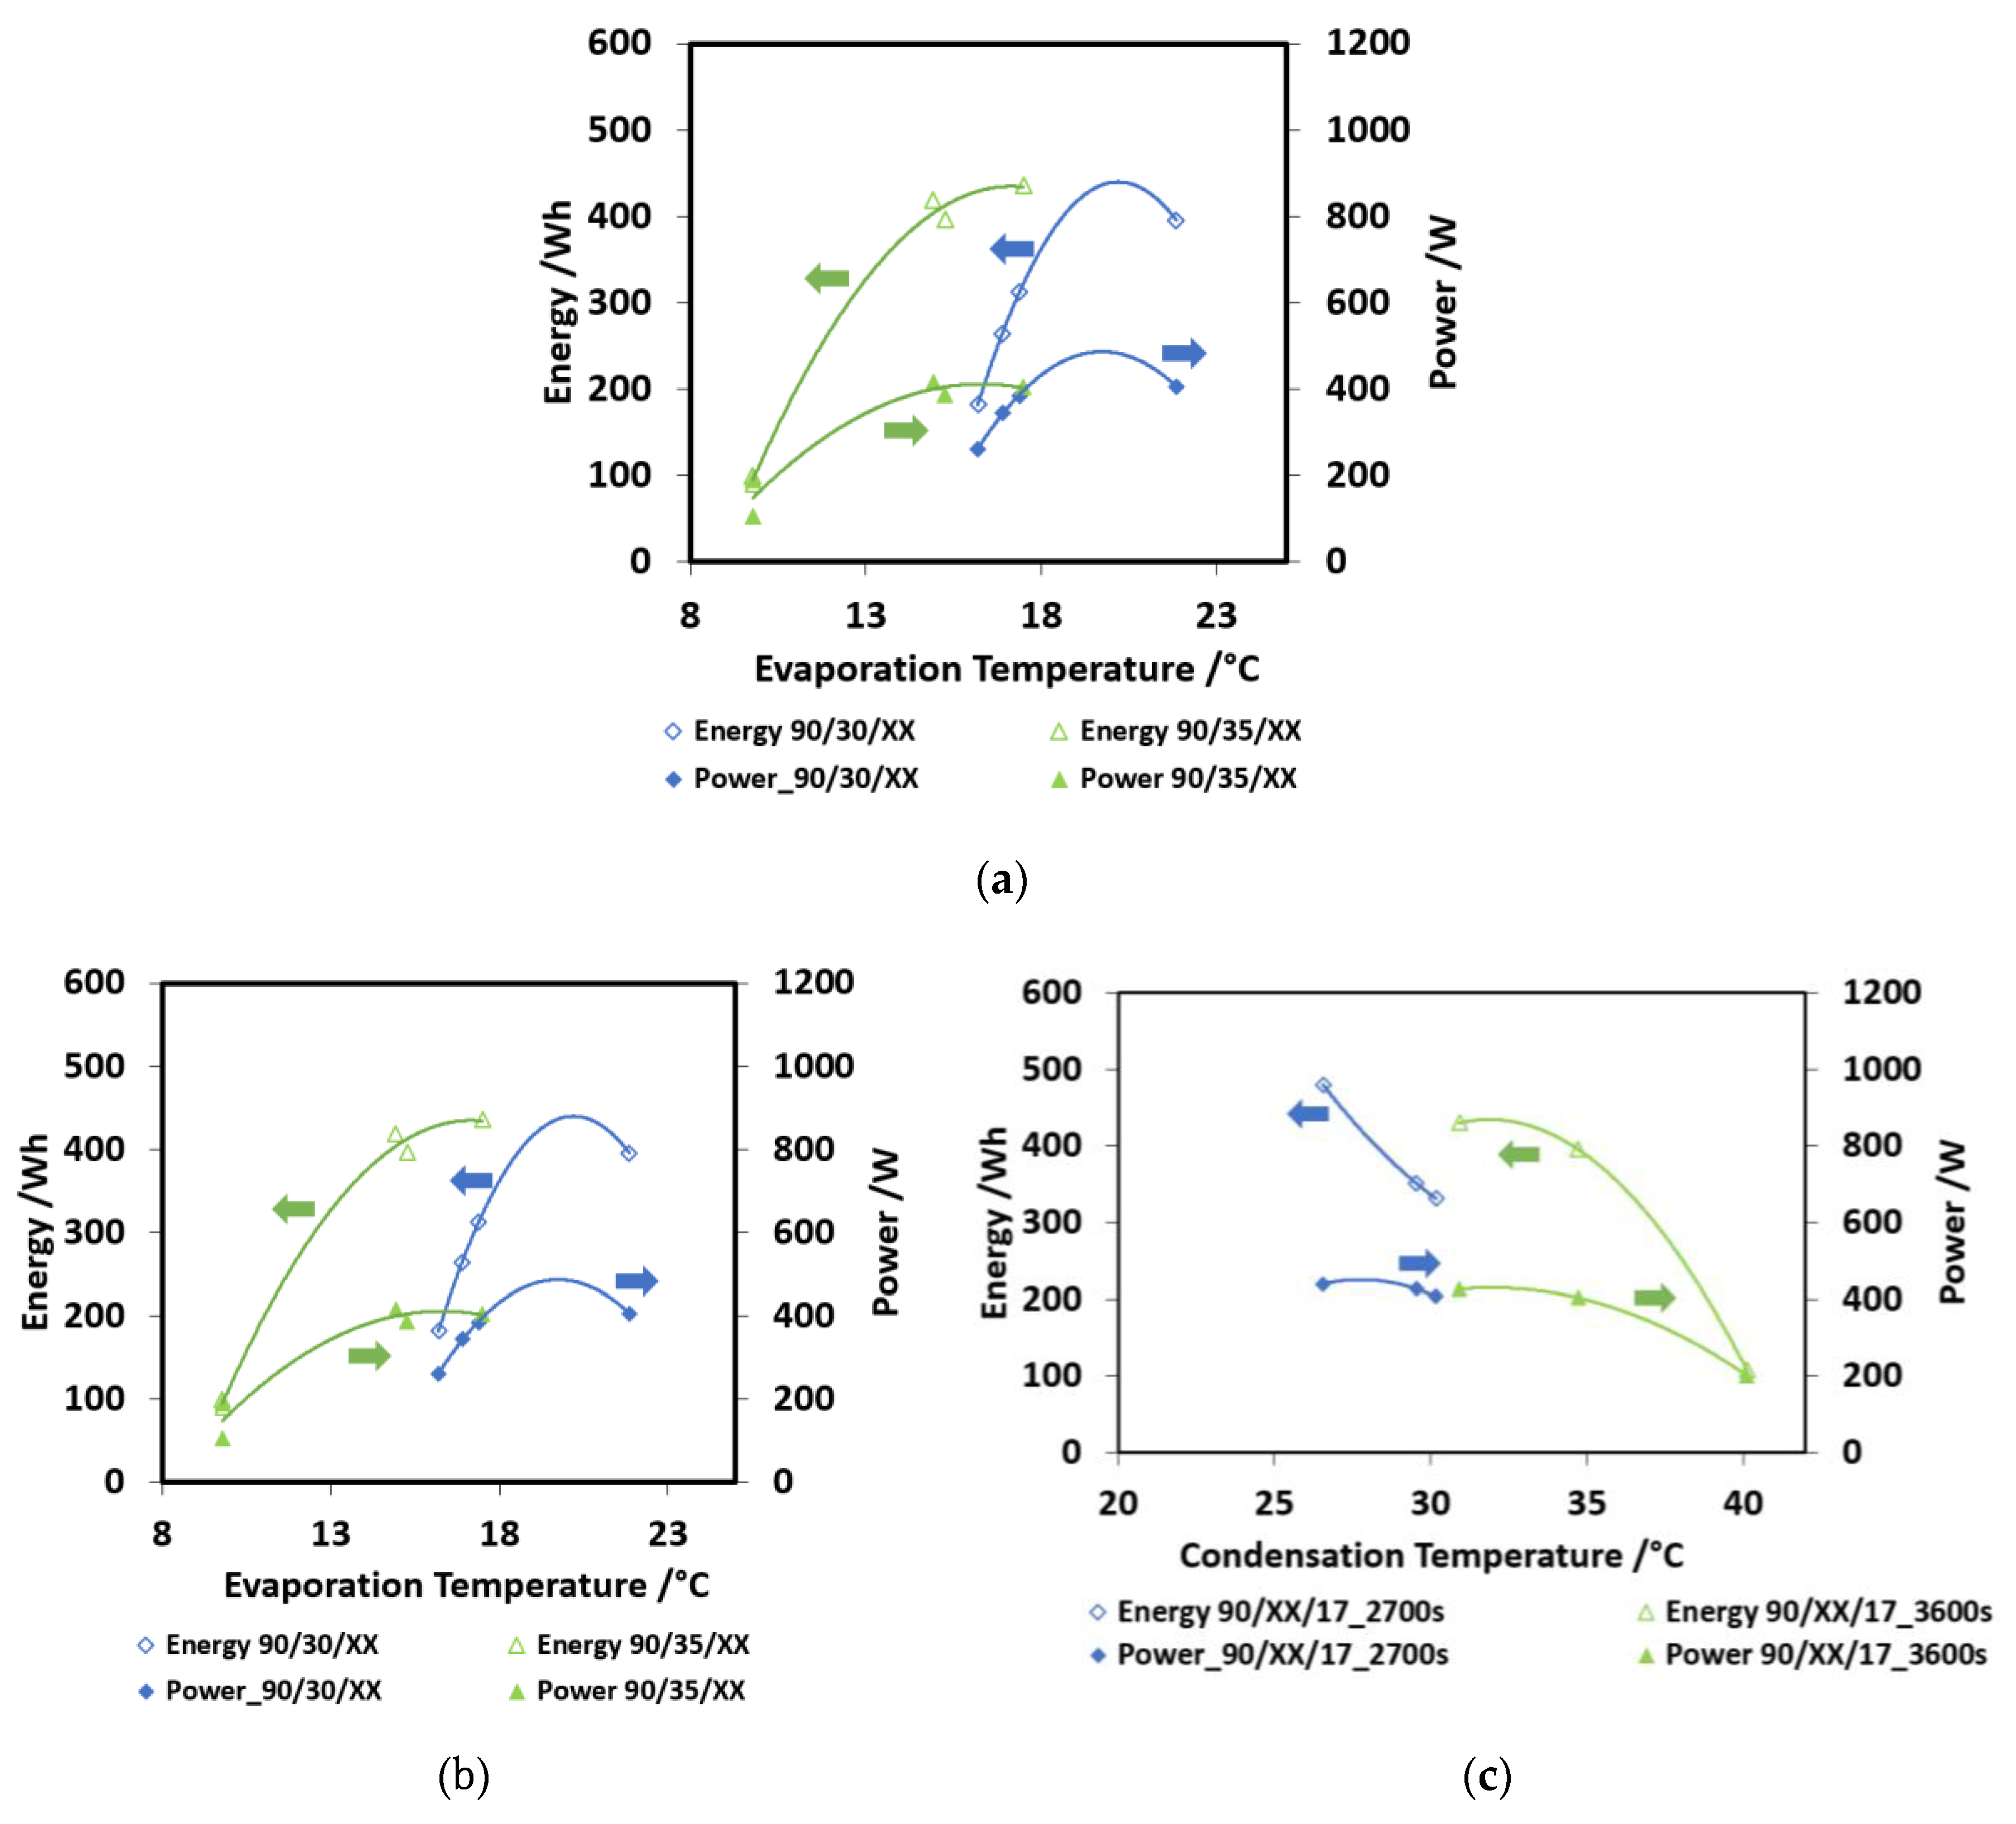
In Figure 6a, the effect of charge/discharge time is shown. This was the first parameter investigated, in order to find out the optimum value to be used in the evaluation of other operating conditions. Two different boundary conditions were investigated—90/35/15 and 90/30/17 cycles, corresponding to more severe and less severe operating conditions. The cold energy recovered and discharge power are shown in the picture. The trends obtained are: increasing energy recovered for higher charge/discharge times and decreasing power for higher charge/discharge times. The trends are more marked for the less severe condition (90/30/17), where a higher amount of working fluid can be processed. Moreover, the decreasing in the output power is not very high, going from 2700 s to 4500 s, probably because of the saturation of the material: after 2700 s, the uptake exchanged, though still present (as testified by the increasing energy stored) is lower than in the first part of the cycle. In Figure 6b, the effect of evaporation temperature over the discharge power and the energy capacity is shown. As expected, the higher the evaporation temperature, the higher the energy recovered. Moreover, with a 2nd grade polynomial equation, it is possible to describe the obtained trend, as often happens for such kind of sorption devices. Two curves, parameterized according to condensation temperature, are reported. The highest discharge power is 400 W, obtained for the lower condensation temperature (30 °C) and an evaporation temperature of 22 °C. Instead, for a 35 °C condensation temperature, the obtained discharge powers are very low. The energy recovered arrives at 400 Wh for the higher evaporation temperatures.
Finally, in Figure 6c, the effect of condensation temperature is shown. The curves are parameterized as a function of discharge times. The results are similar to those of the previous graphs: higher condensation temperatures lead to low powers, around 200 W, and low energy capacity (200 Wh for 40 °C condensation and 2700 s discharge time), whereas more power is available at a lower condensation temperature (300 Wh for 30 °C condensation and 3600 s discharge time).
3.3. Testing Results with a Composite Adsorber Based on an Aluminum, Porous Structure and a SAPO-34 Coating
In this section, the results of the characterization tests are reported, by using the same evaluation parameters previously explained. A direct comparison with the pelletized adsorber will be specifically addressed in a dedicated section.
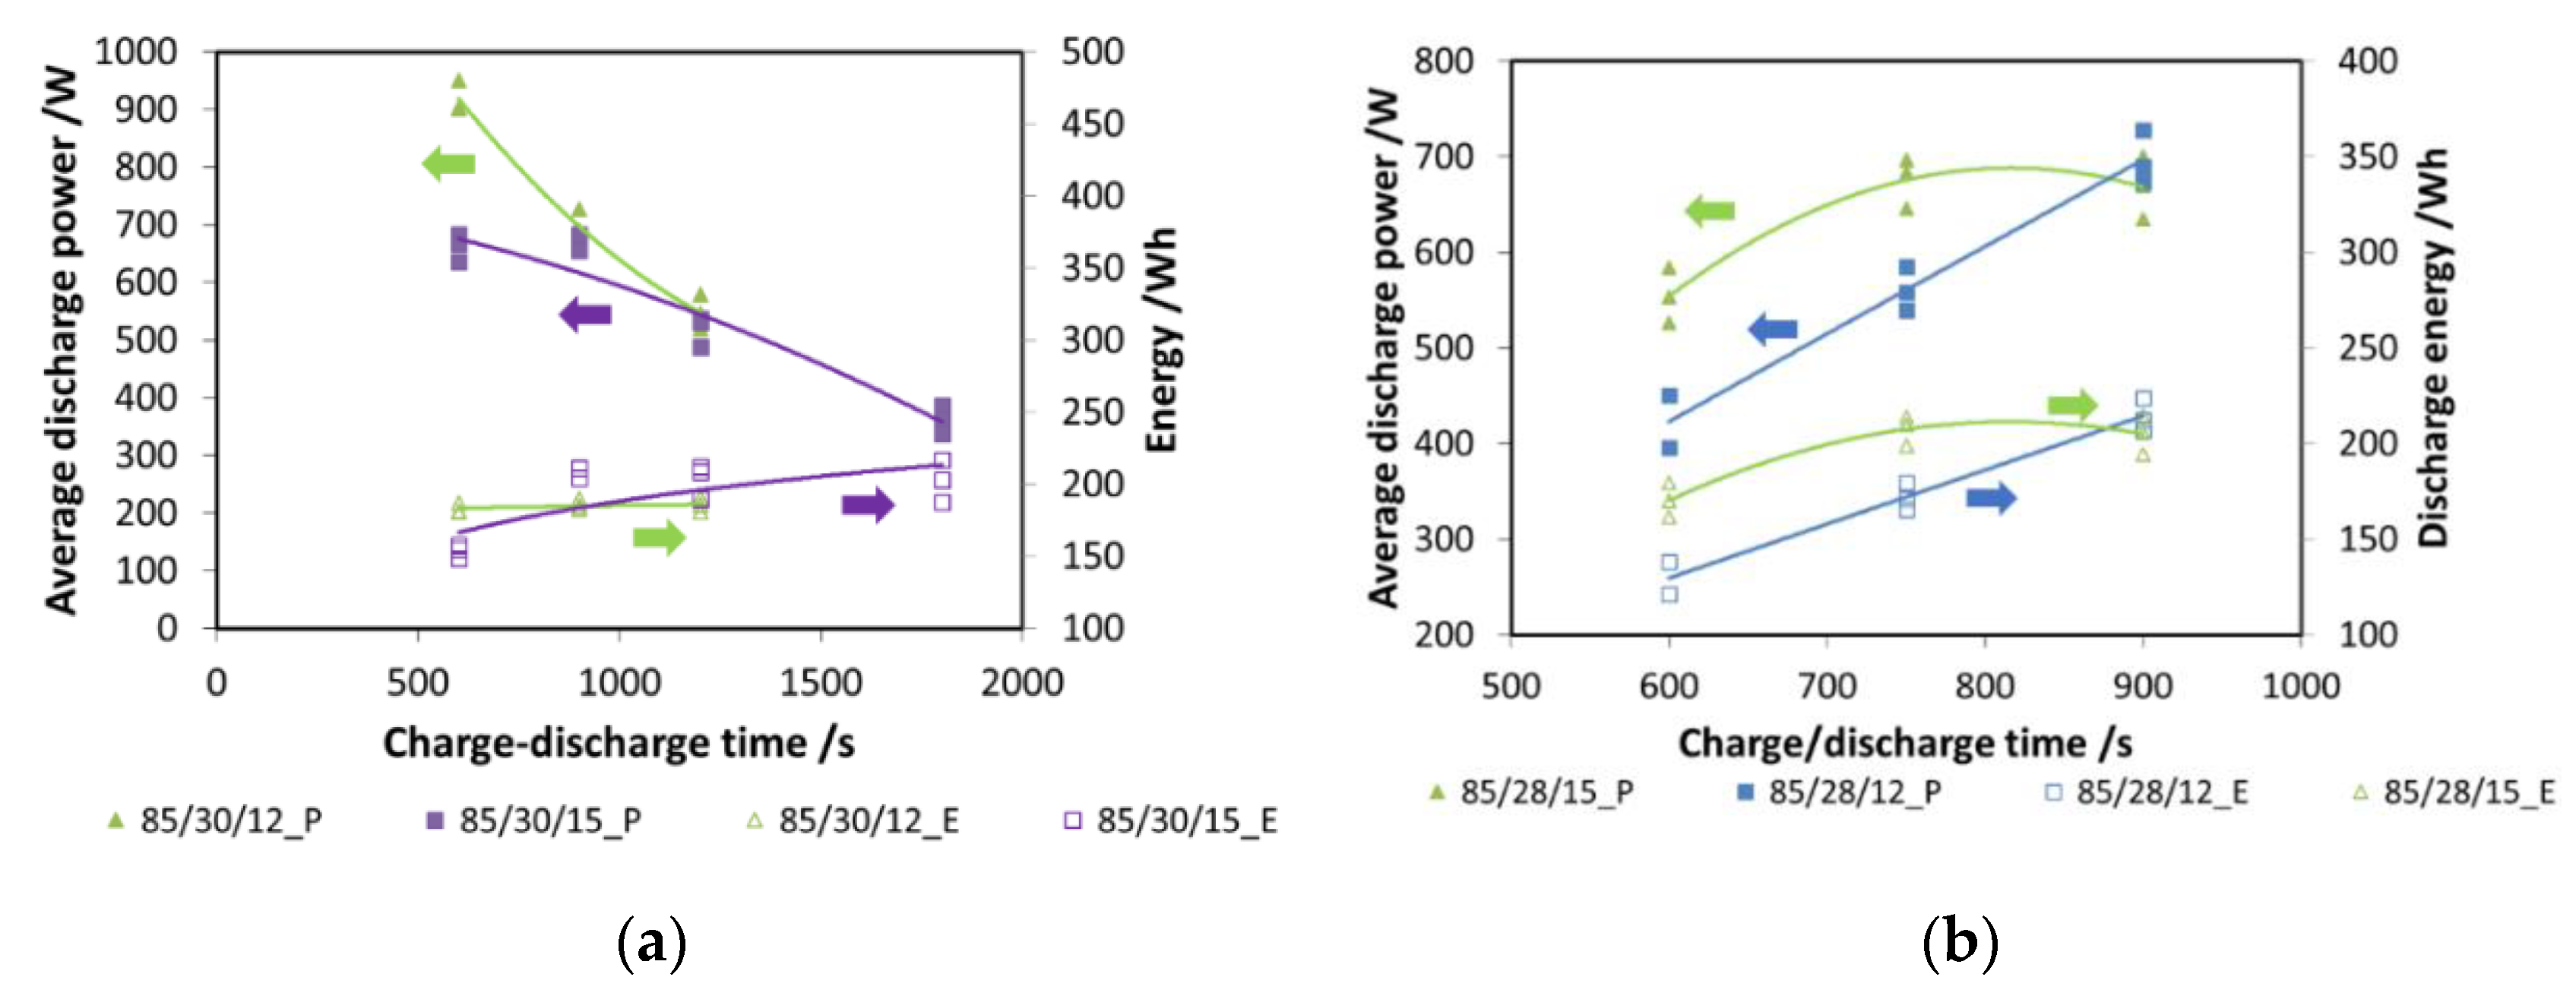
In Figure 7a, tests with two different evaporation temperatures (12 °C and 15 °C) and different cycle times are presented. In particular, for the tests here shown, the durations of charge and discharge are the same. The results are presented both in terms of energy (e.g., 85/30/12_E) and power (e.g., 85/30/12_P): as expected, power decreases with increasing cycle time. However, energy, once 900 s of charge/discharge time is reached, has a plateau, indicating that this is the optimal choice.
Subsequently, the effect of charging time was evaluated: it is well known that the desorption process is faster than adsorption [14]. For a discharging time fixed at 900 s, charging times of 600 s and 750 s were evaluated, again considering two different evaporation temperatures. The results are presented in Figure 7b: for an evaporation temperature of 15 °C, the optimal charging time is 750 s, since no evident benefit from increasing the duration of charge is measured. Instead, for a 12 °C evaporation, a cycle with the same durations of charge and discharge is the best option. Such results were used for the realization of the other tests.
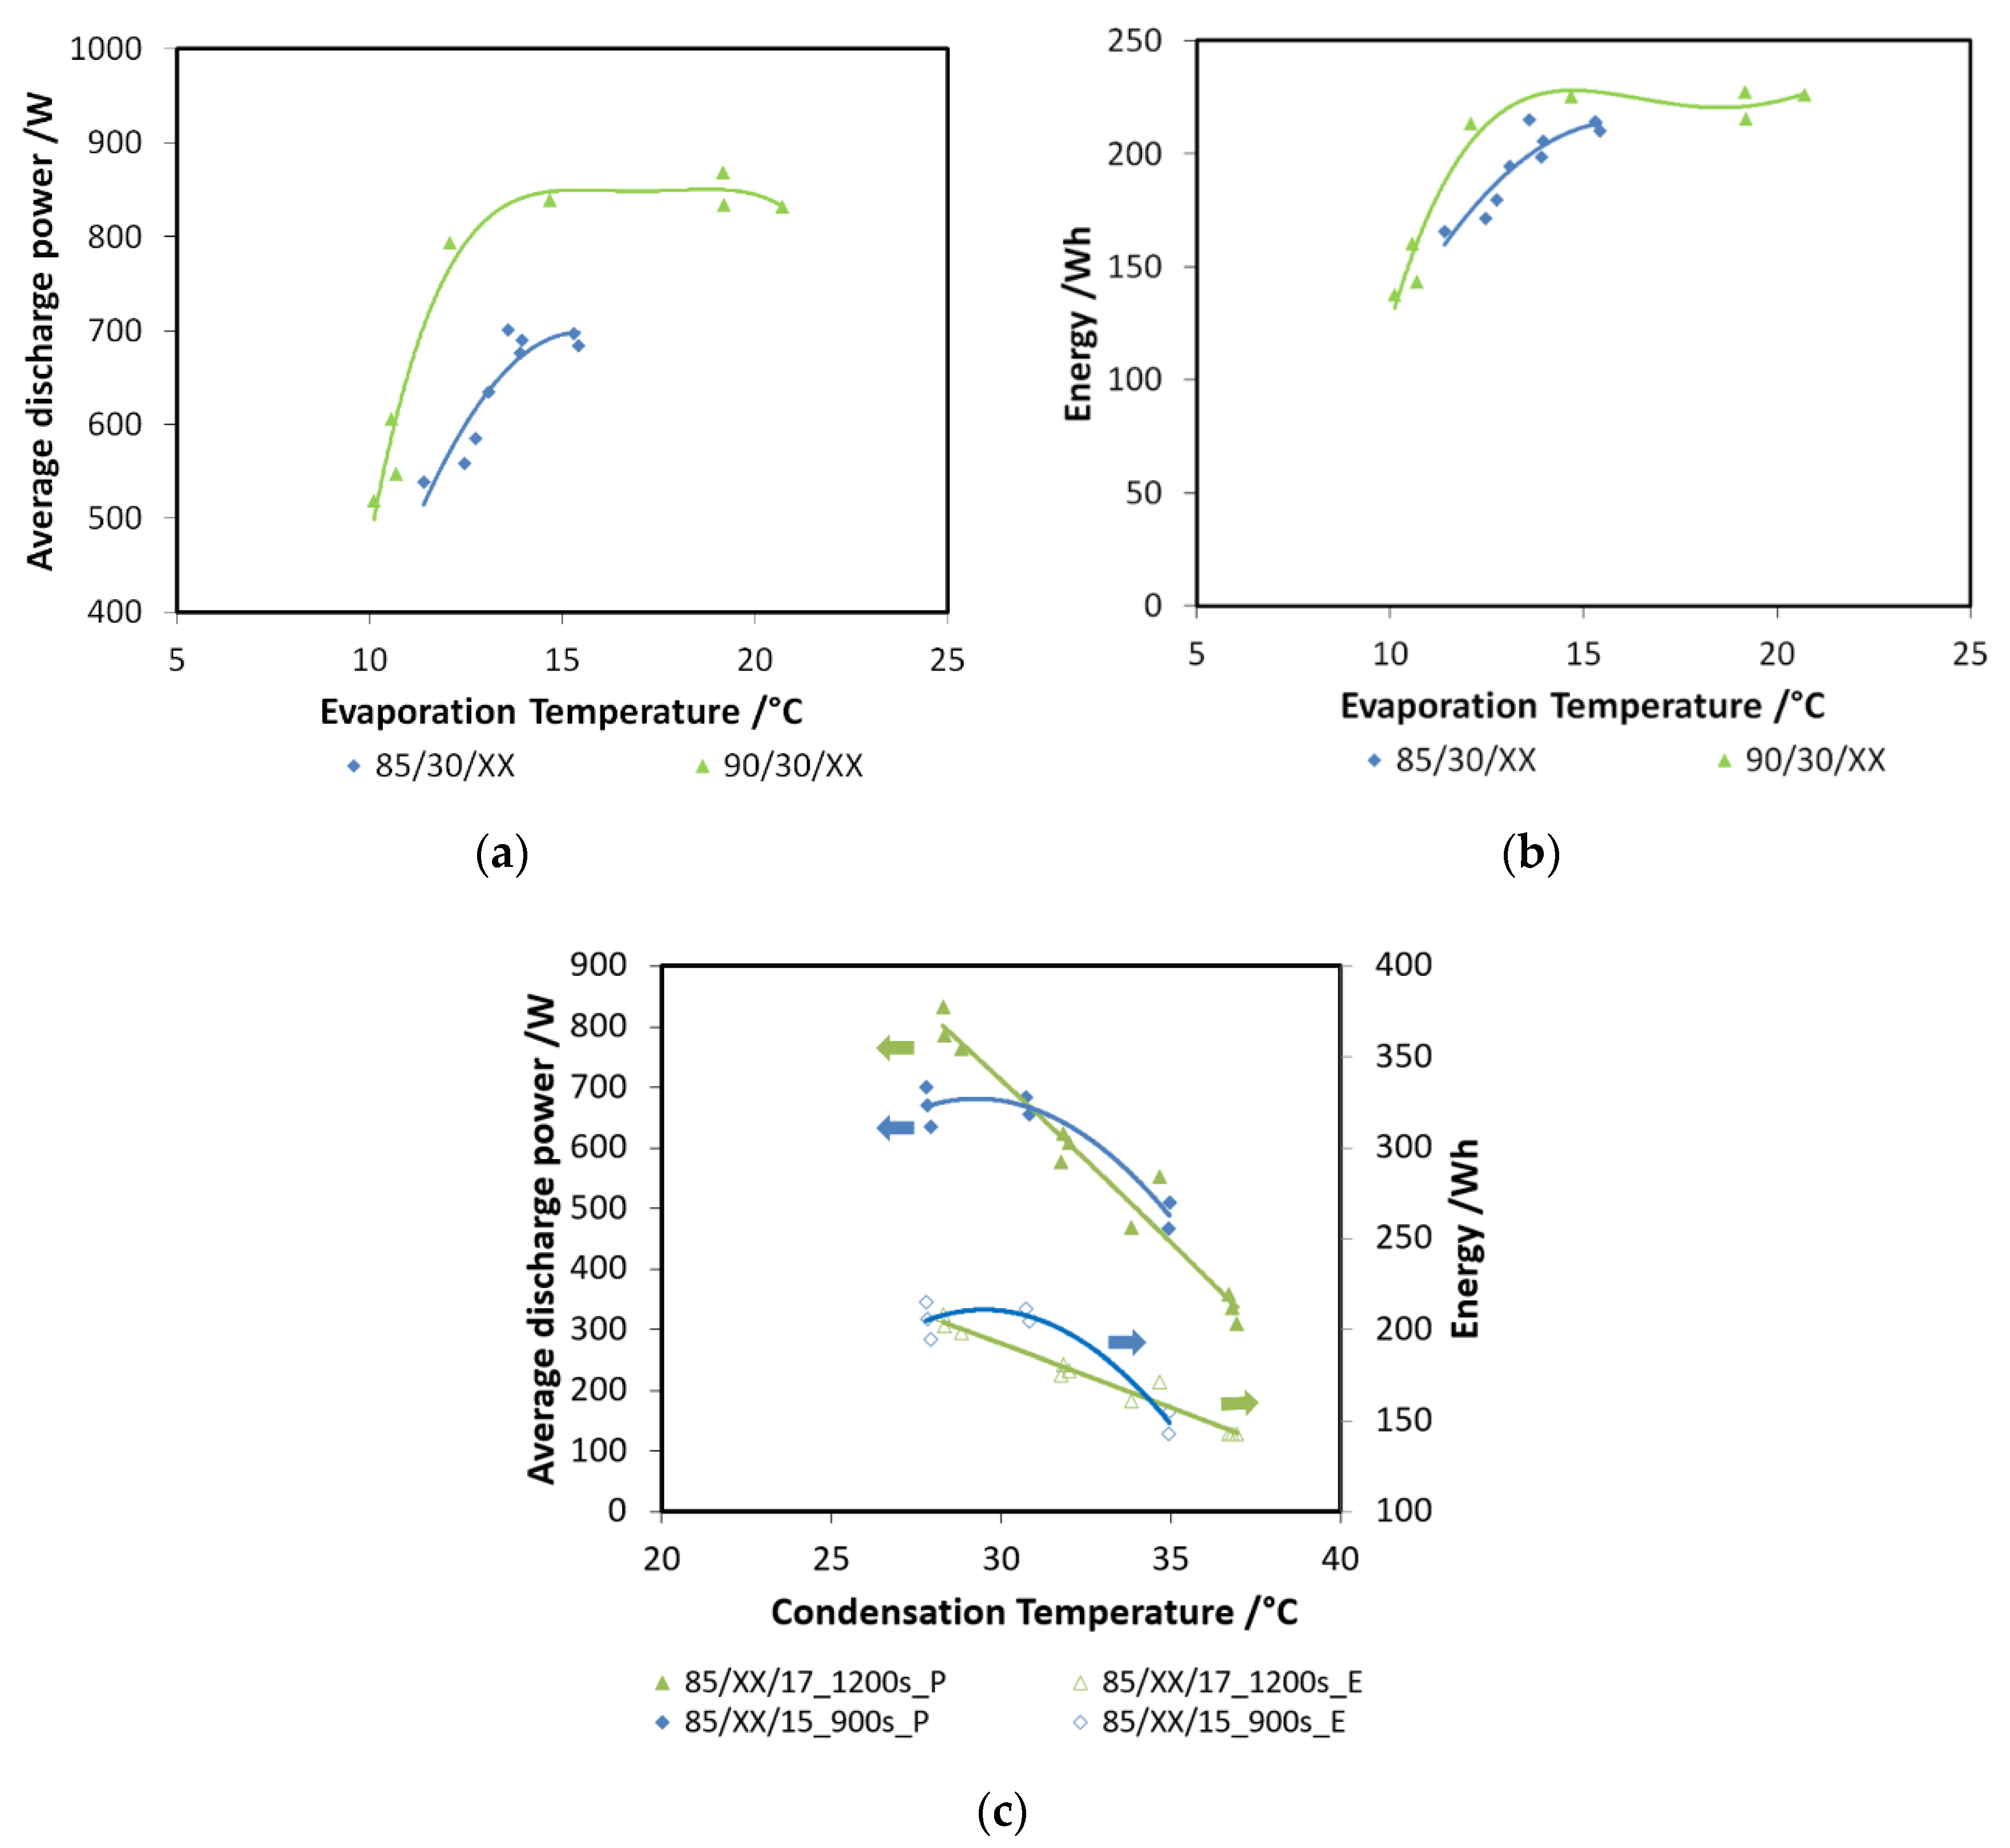
In Figure 8a,b, the effects of evaporation temperature and driving temperature are shown for discharge power and recovered cold energy, respectively. All the tests have been performed for a charge and discharge duration of 900 s with a condensation/adsorption temperature of 30 °C. This part of the experimental test was carried out with the aim of evaluating the effects of two possible ICE operative temperatures (85 °C and 90 °C) and the effect of the cabin’s inside temperature, assuming it at different constant levels (from 10 °C to 20 °C). It is visible that higher driving temperatures are beneficial, especially to discharge power, since an increment of about 15% can be obtained. The average discharge power measured, especially with 90 °C driving temperature, is as high as 850 W. By moving from an evaporation temperature of 10 °C to 15 °C, a great increase is observed; after such a temperature, a plateau is reached. For a lower driving temperature, discharge power in the range 500–730 W has been measured. The effect on recovered energy, though smaller, is still recognizable: for 85 °C tests, energy recovered lied in the range of 170–220 Wh, while for the higher temperature, the maximum energy recovered was about 220 Wh.
The effect of condensation temperature is summarized in Figure 8c: both the recovered energy (e.g., 85/XX/17_1200s_E) and discharged power (e.g., 85/XX/17_1200s_P) decrease for higher condensation temperatures. The effect is more marked for the lower evaporation temperatures, corresponding to a higher pressure lift between the evaporator and the condenser.
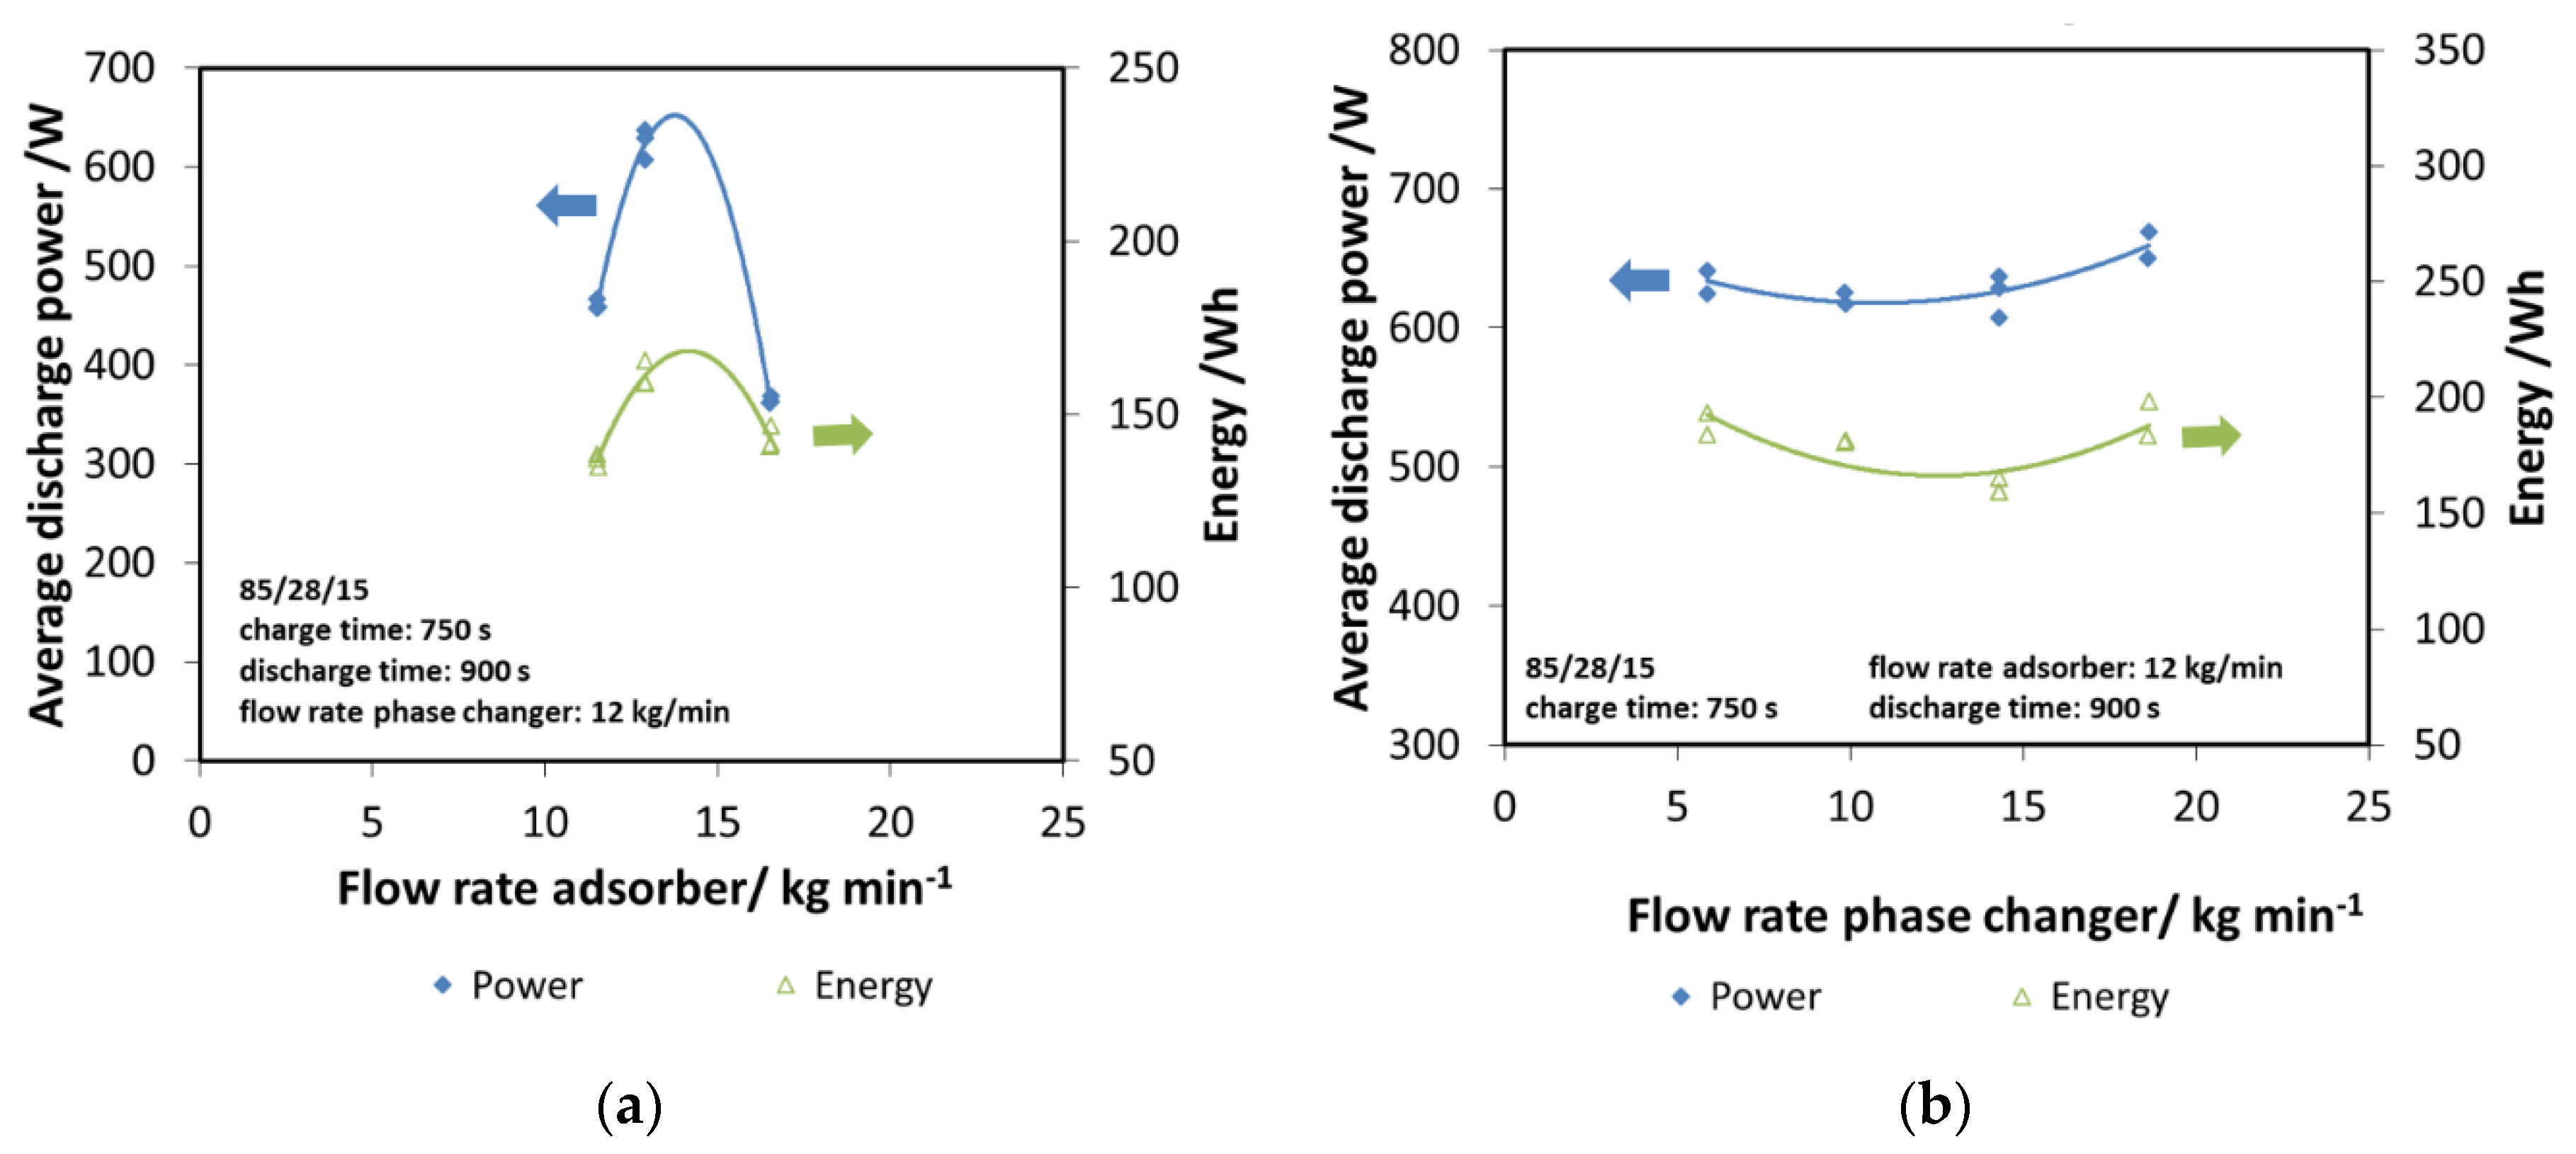
Subsequently, the effect of the flow rate in the two components has been evaluated, since it represents a key design parameter. In Figure 9a, the effect of the flow rate in the adsorber has been evaluated, considering both the discharge power and energy. The trend obtained is clear: there is an optimum value of flow rate allowing the maximizing of the performance of the system, which is 12 kg/min. Indeed, lower flow rates probably worsen the heat transfer inside the heat exchanger of the adsorber, while higher flow rates are as detrimental. Moreover, they lead to very a small temperature difference that might negatively affect the practical application. Therefore, the value of 12 kg/min has been considered for all the other tests.
The same analysis has been done for the phase changer, by varying its flow rate in the range of 8–18 kg/min. In this case, the effect is smaller, with a slightly increasing trend for higher flow rates, as shown in Figure 9b. Such a result further highlights that the key parameter is the heat transfer inside the adsorber, since it affects the adsorption efficiency and dynamics.
3.3.1. “Deep Charge” Tests
After the first characterization of the small storage prototype, another series of tests were realized, with the aim of finding out whether the charge of the system at a lower temperature could hold some benefit on the performance and the amount of energy stored. In this case, the operation of the system is still realized at the following three temperature levels:
- Heat of desorption is provided at the temperature of the heat source, HT;
- Heat of condensation is released at a low temperature, LT;
- Heat of adsorption is released at the temperature of adsorption, MT;
- Heat of evaporation is provided at a temperature level suitable for the user, LT.
The condensation and evaporation temperatures of the tests then are equal. This allows simulating, for example, the case of short-term storage realized with condensation taking place at a very low external temperature.
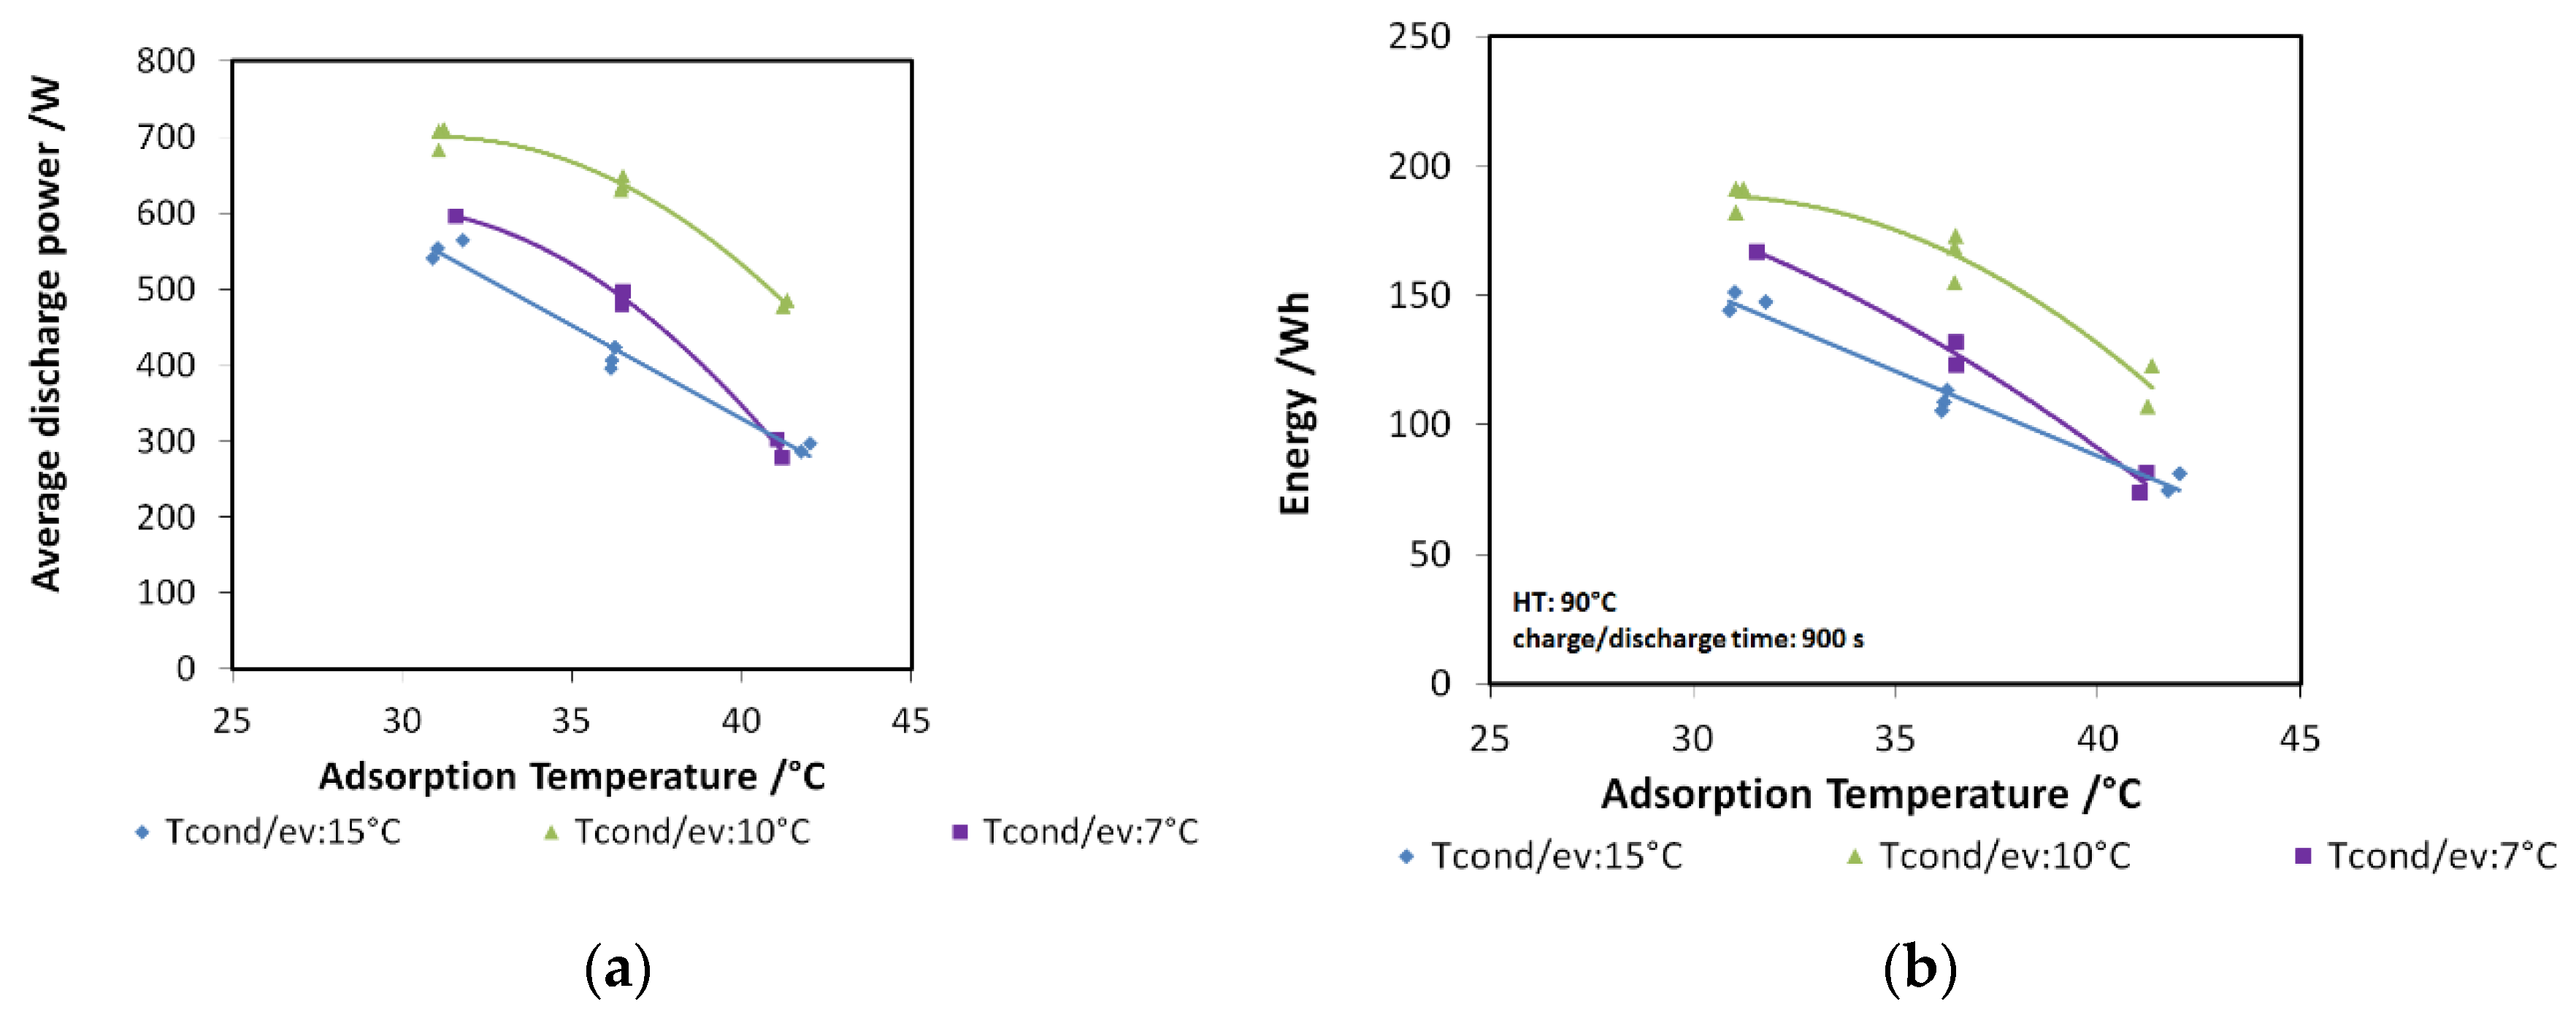
The results of the analysis are shown in Figure 10a,b for discharge power and stored energy, respectively. The performance indicators are represented as a function of adsorption temperature. In particular, three different evaporation/condensation temperatures have been tested (7, 10, and 15 °C), and for each of them, three different adsorption temperatures (30, 35, and 40 °C). The tendency reported in the graphs is clear: there is a benefit in realizing the charge of the system at a lower temperature with respect to adsorption temperature.
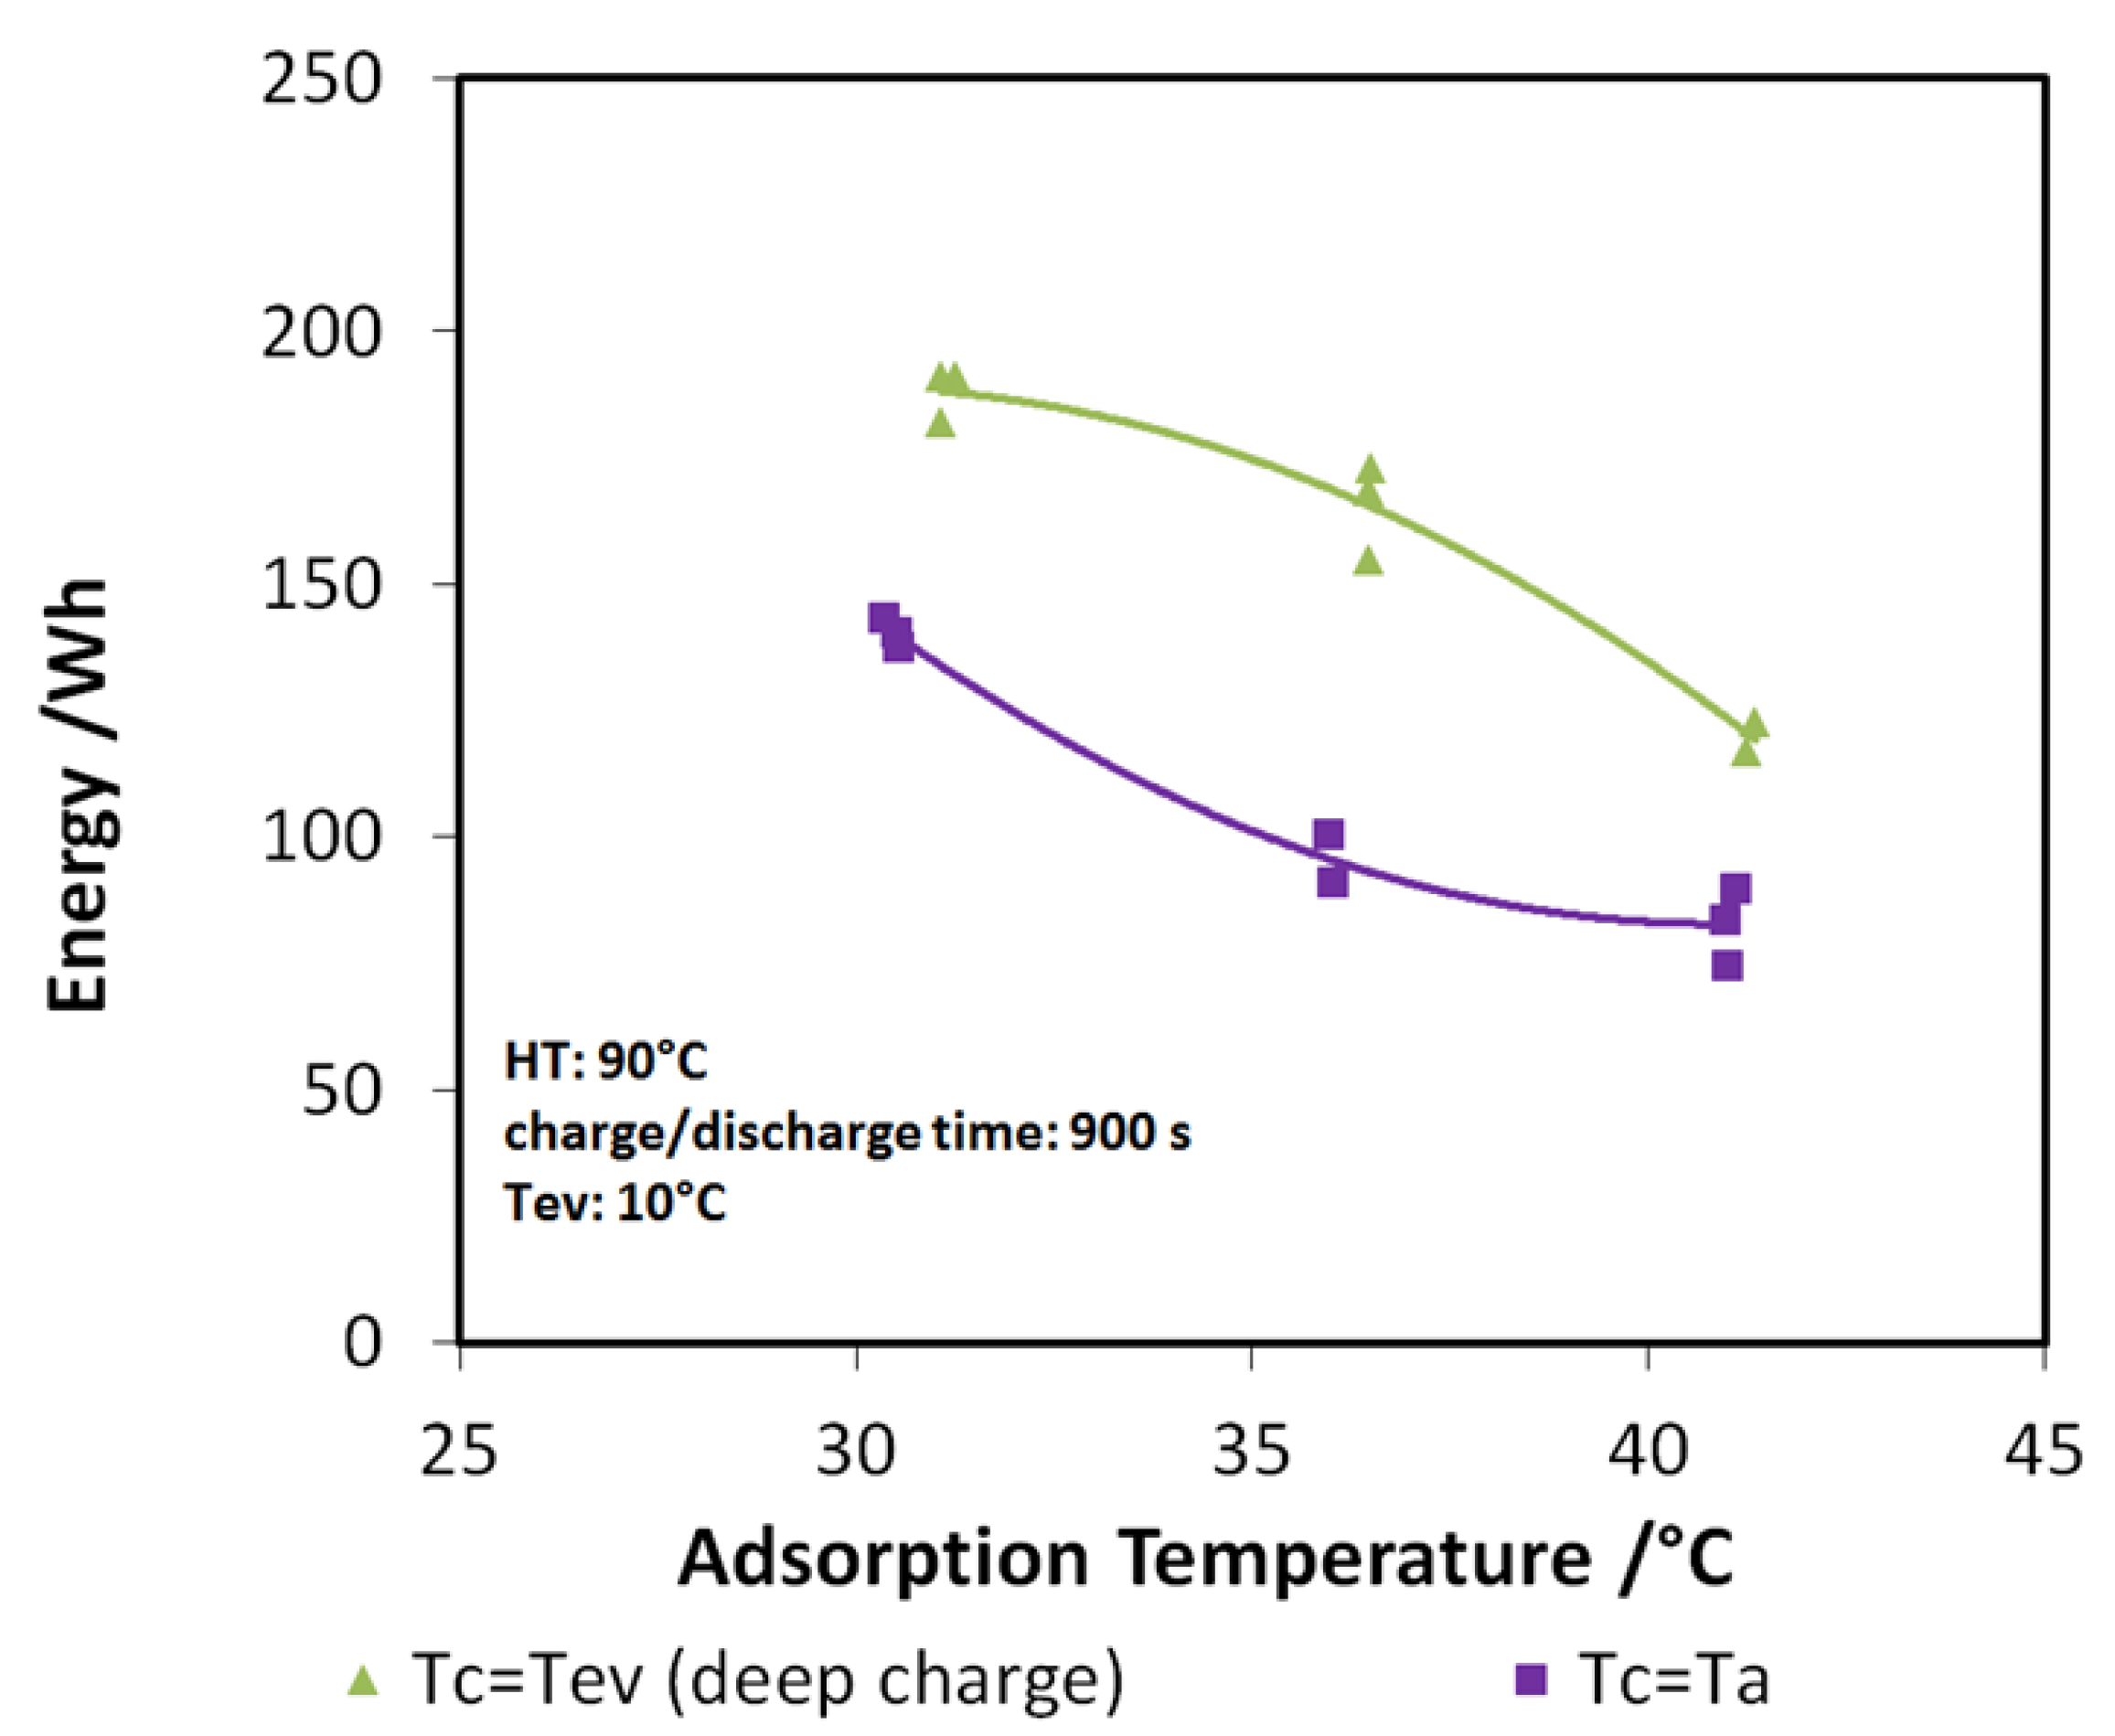
Indeed, the lower the difference between adsorption and condensation temperature, the higher the discharge power and energy recovered, especially when the useful effect has to be provided at 7 or 10 °C. The findings described here are further highlighted in Figure 11, where the case of a 10 °C evaporation temperature has been considered. The green points represent the tests with “deep charge,” while the purple line represents the tests in which the condensation and adsorption temperatures are equal (“normal charge”). It is possible to see that, for the three adsorption temperatures tested (3T), an increase of about 20%–25% in the stored energy is achieved by means of deep charge.
Such results have led to the realization of another run of tests, at four temperature levels (4T), as described in the next section.
3.3.2. Four Temperatures Tests
Once the beneficial effect of “deep charge” on the system had been assessed, further tests were realized by considering the operation of the system at four temperature levels (4T) instead of three (3T). In this case, the operation of the system is realized at the following different temperature levels:
- Heat of desorption is provided at the temperature of the heat source, HT;
- Heat of condensation is released at 10 °C;
- Heat of adsorption is released at the temperature of adsorption, Ta;
- Heat of evaporation is provided at a temperature level suitable for the user, LT.
The characteristic of such tests is that the condensation temperature is lower than adsorption temperature, simulating, for example, the charging of the system through a “booster” or at low ambient temperatures typical of northern countries.
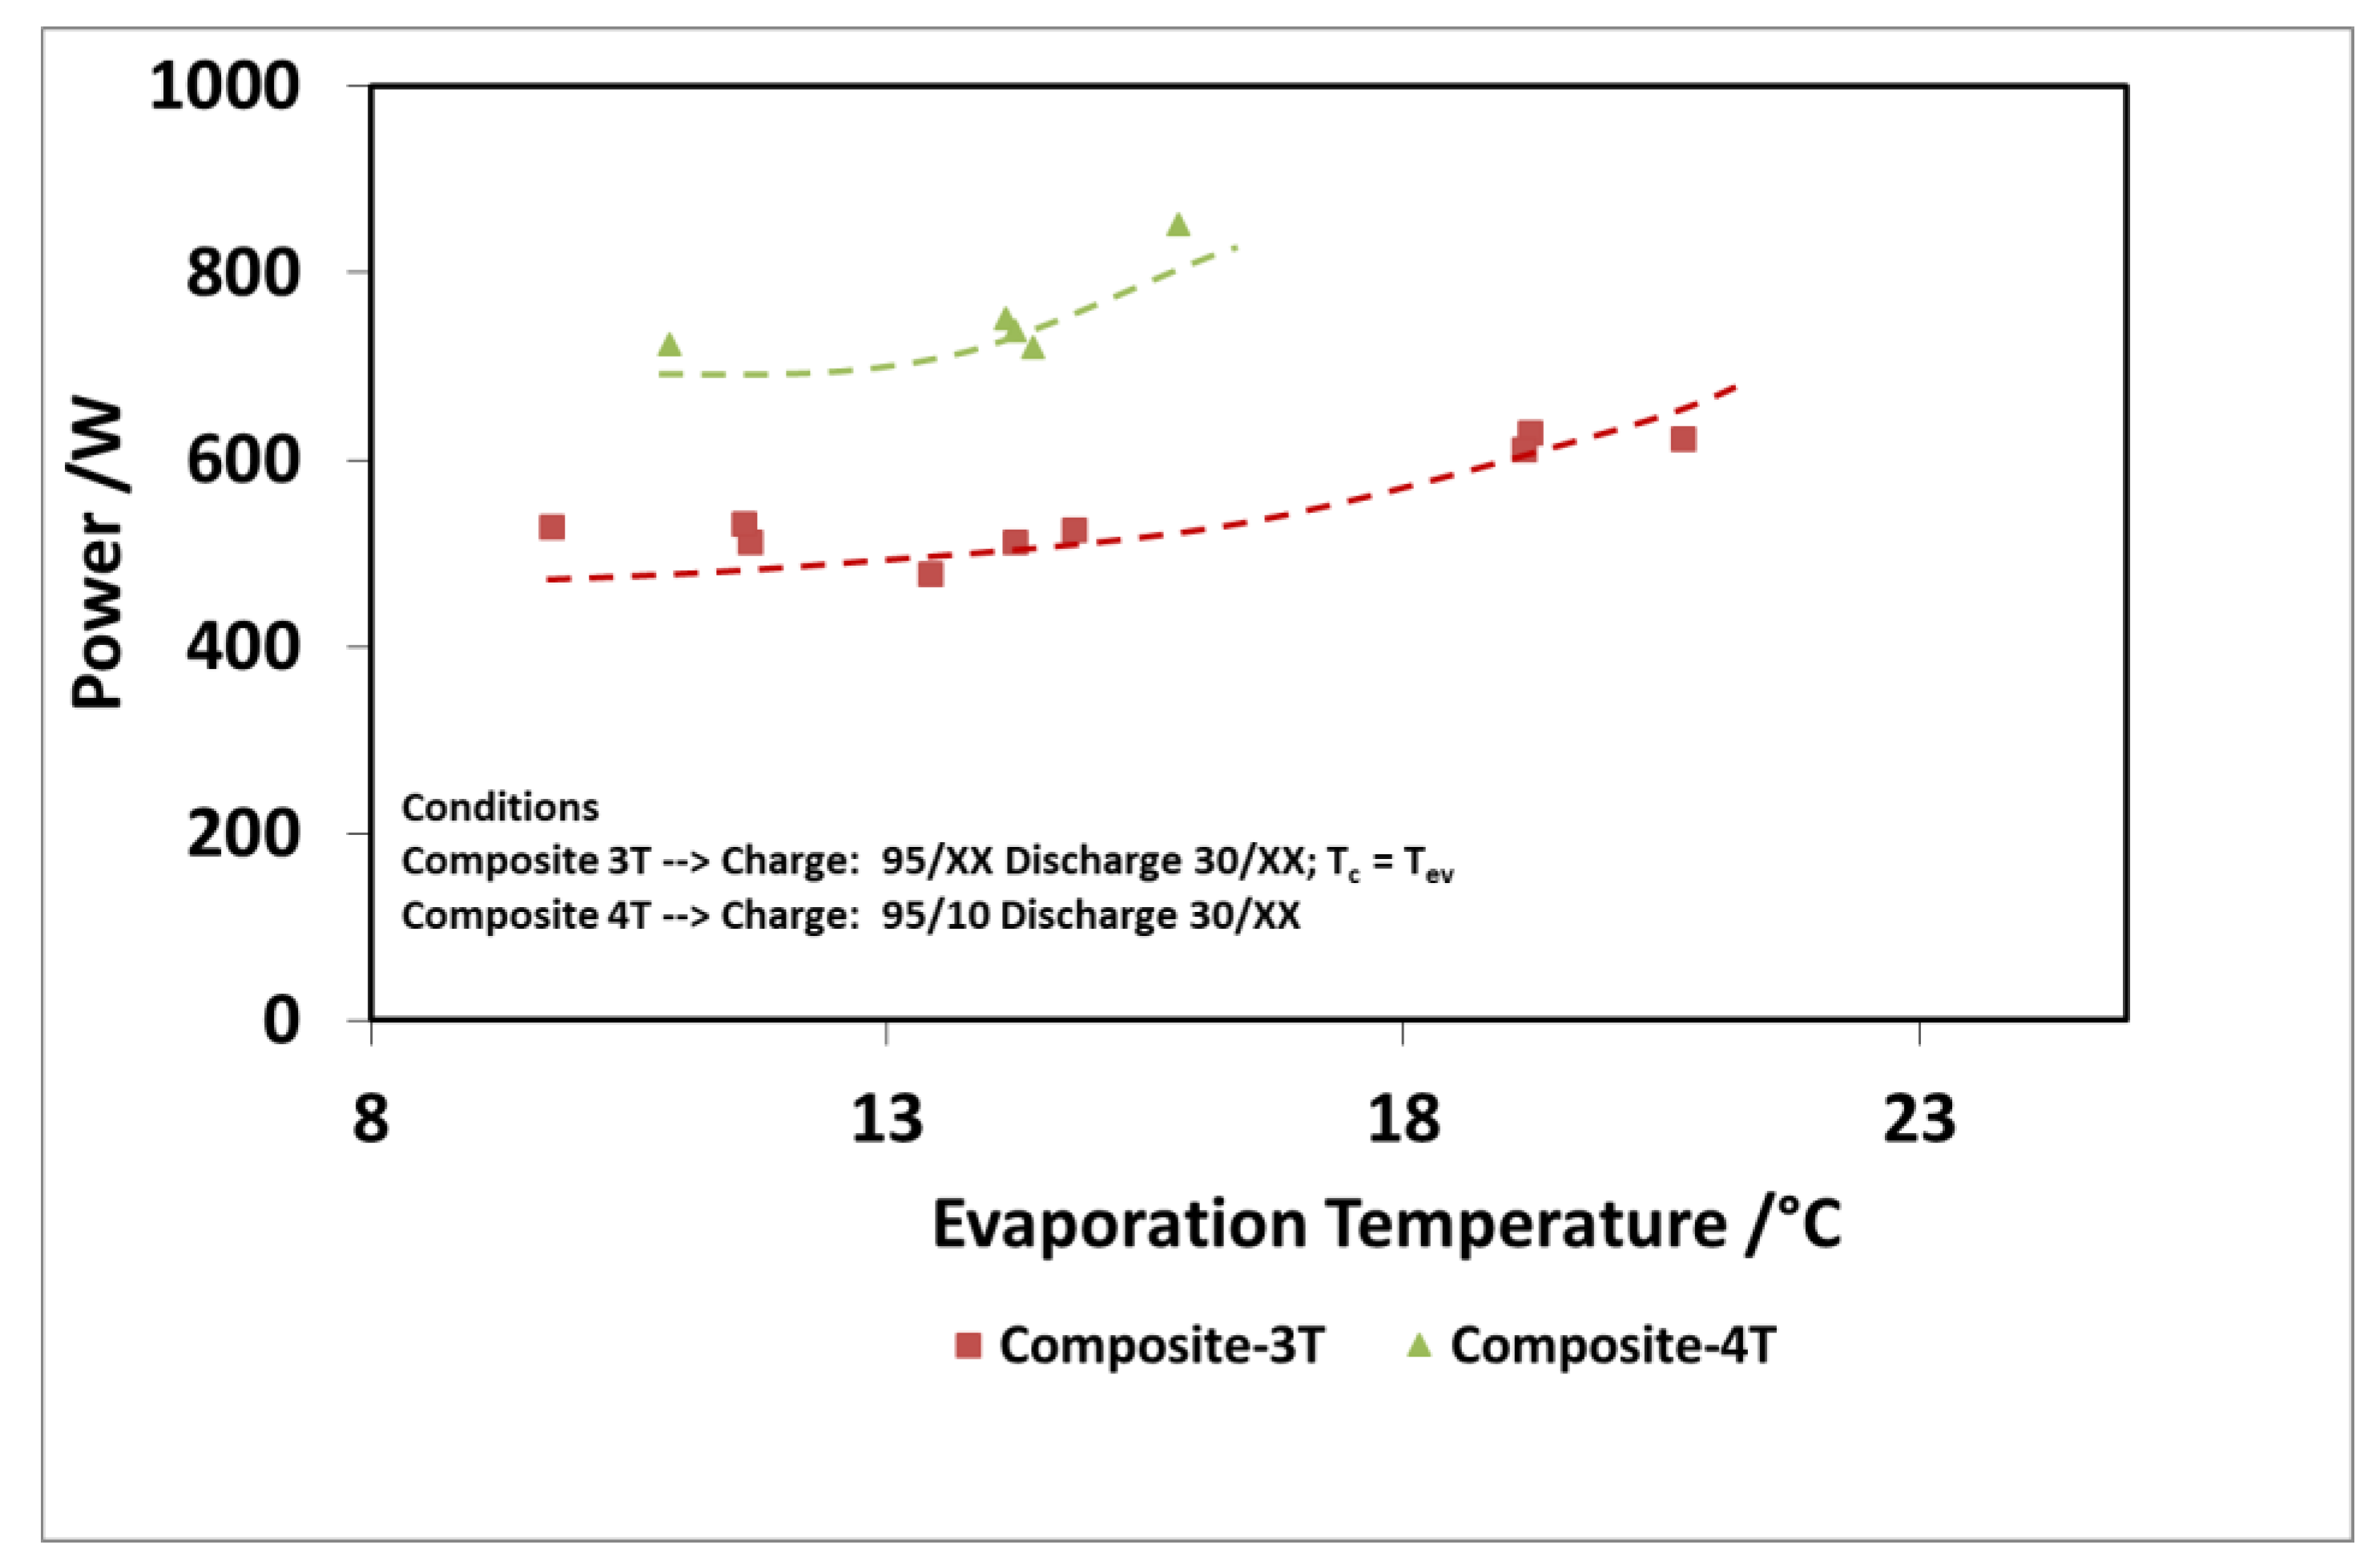
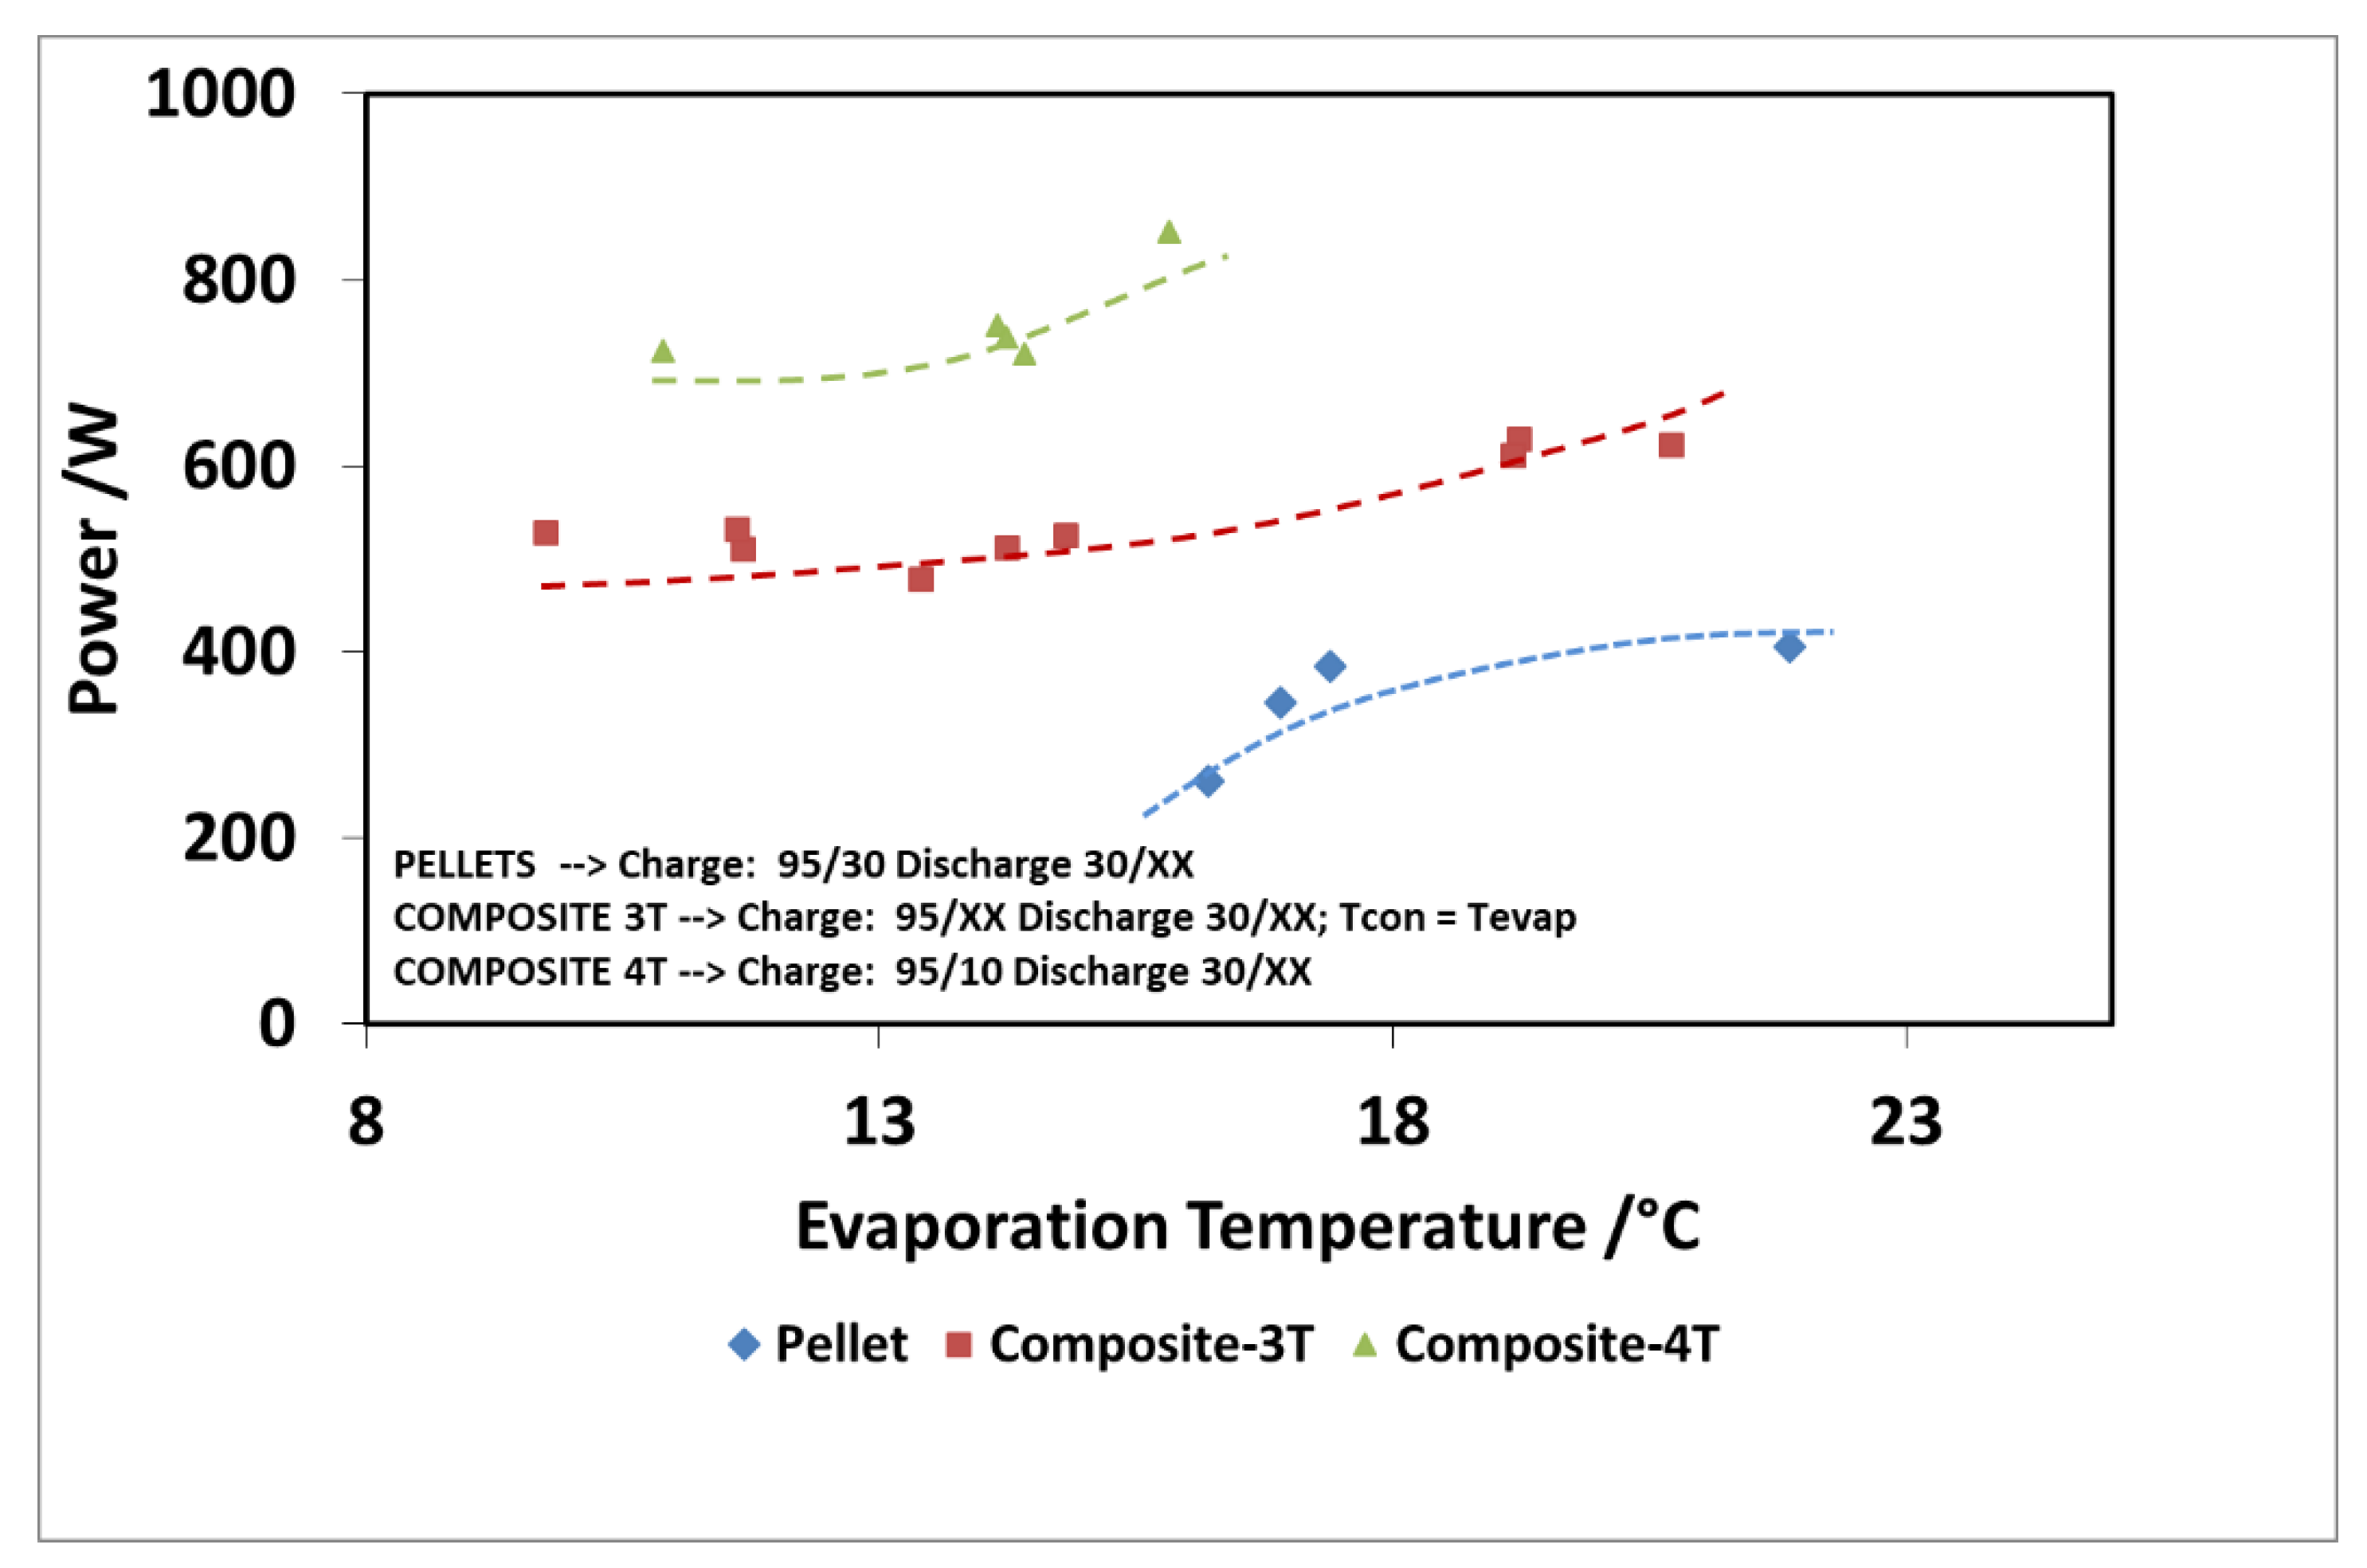
The results of the evaluation are summarized in Figure 12 and Figure 13 for the discharge power and stored energy for different evaporation temperatures and a driving temperature of 95 °C. As suggested by the results on “deep charge” tests, by making the cold storage work at four different temperature levels, there is a benefit; that is, higher evaporation temperatures. In this case, indeed, the difference in the uptake exchanged during charge in three temperature and four temperature tests is higher because the difference between the condensation temperatures in the two types of tests is higher.
3.4. Comparison between the Adsorbers
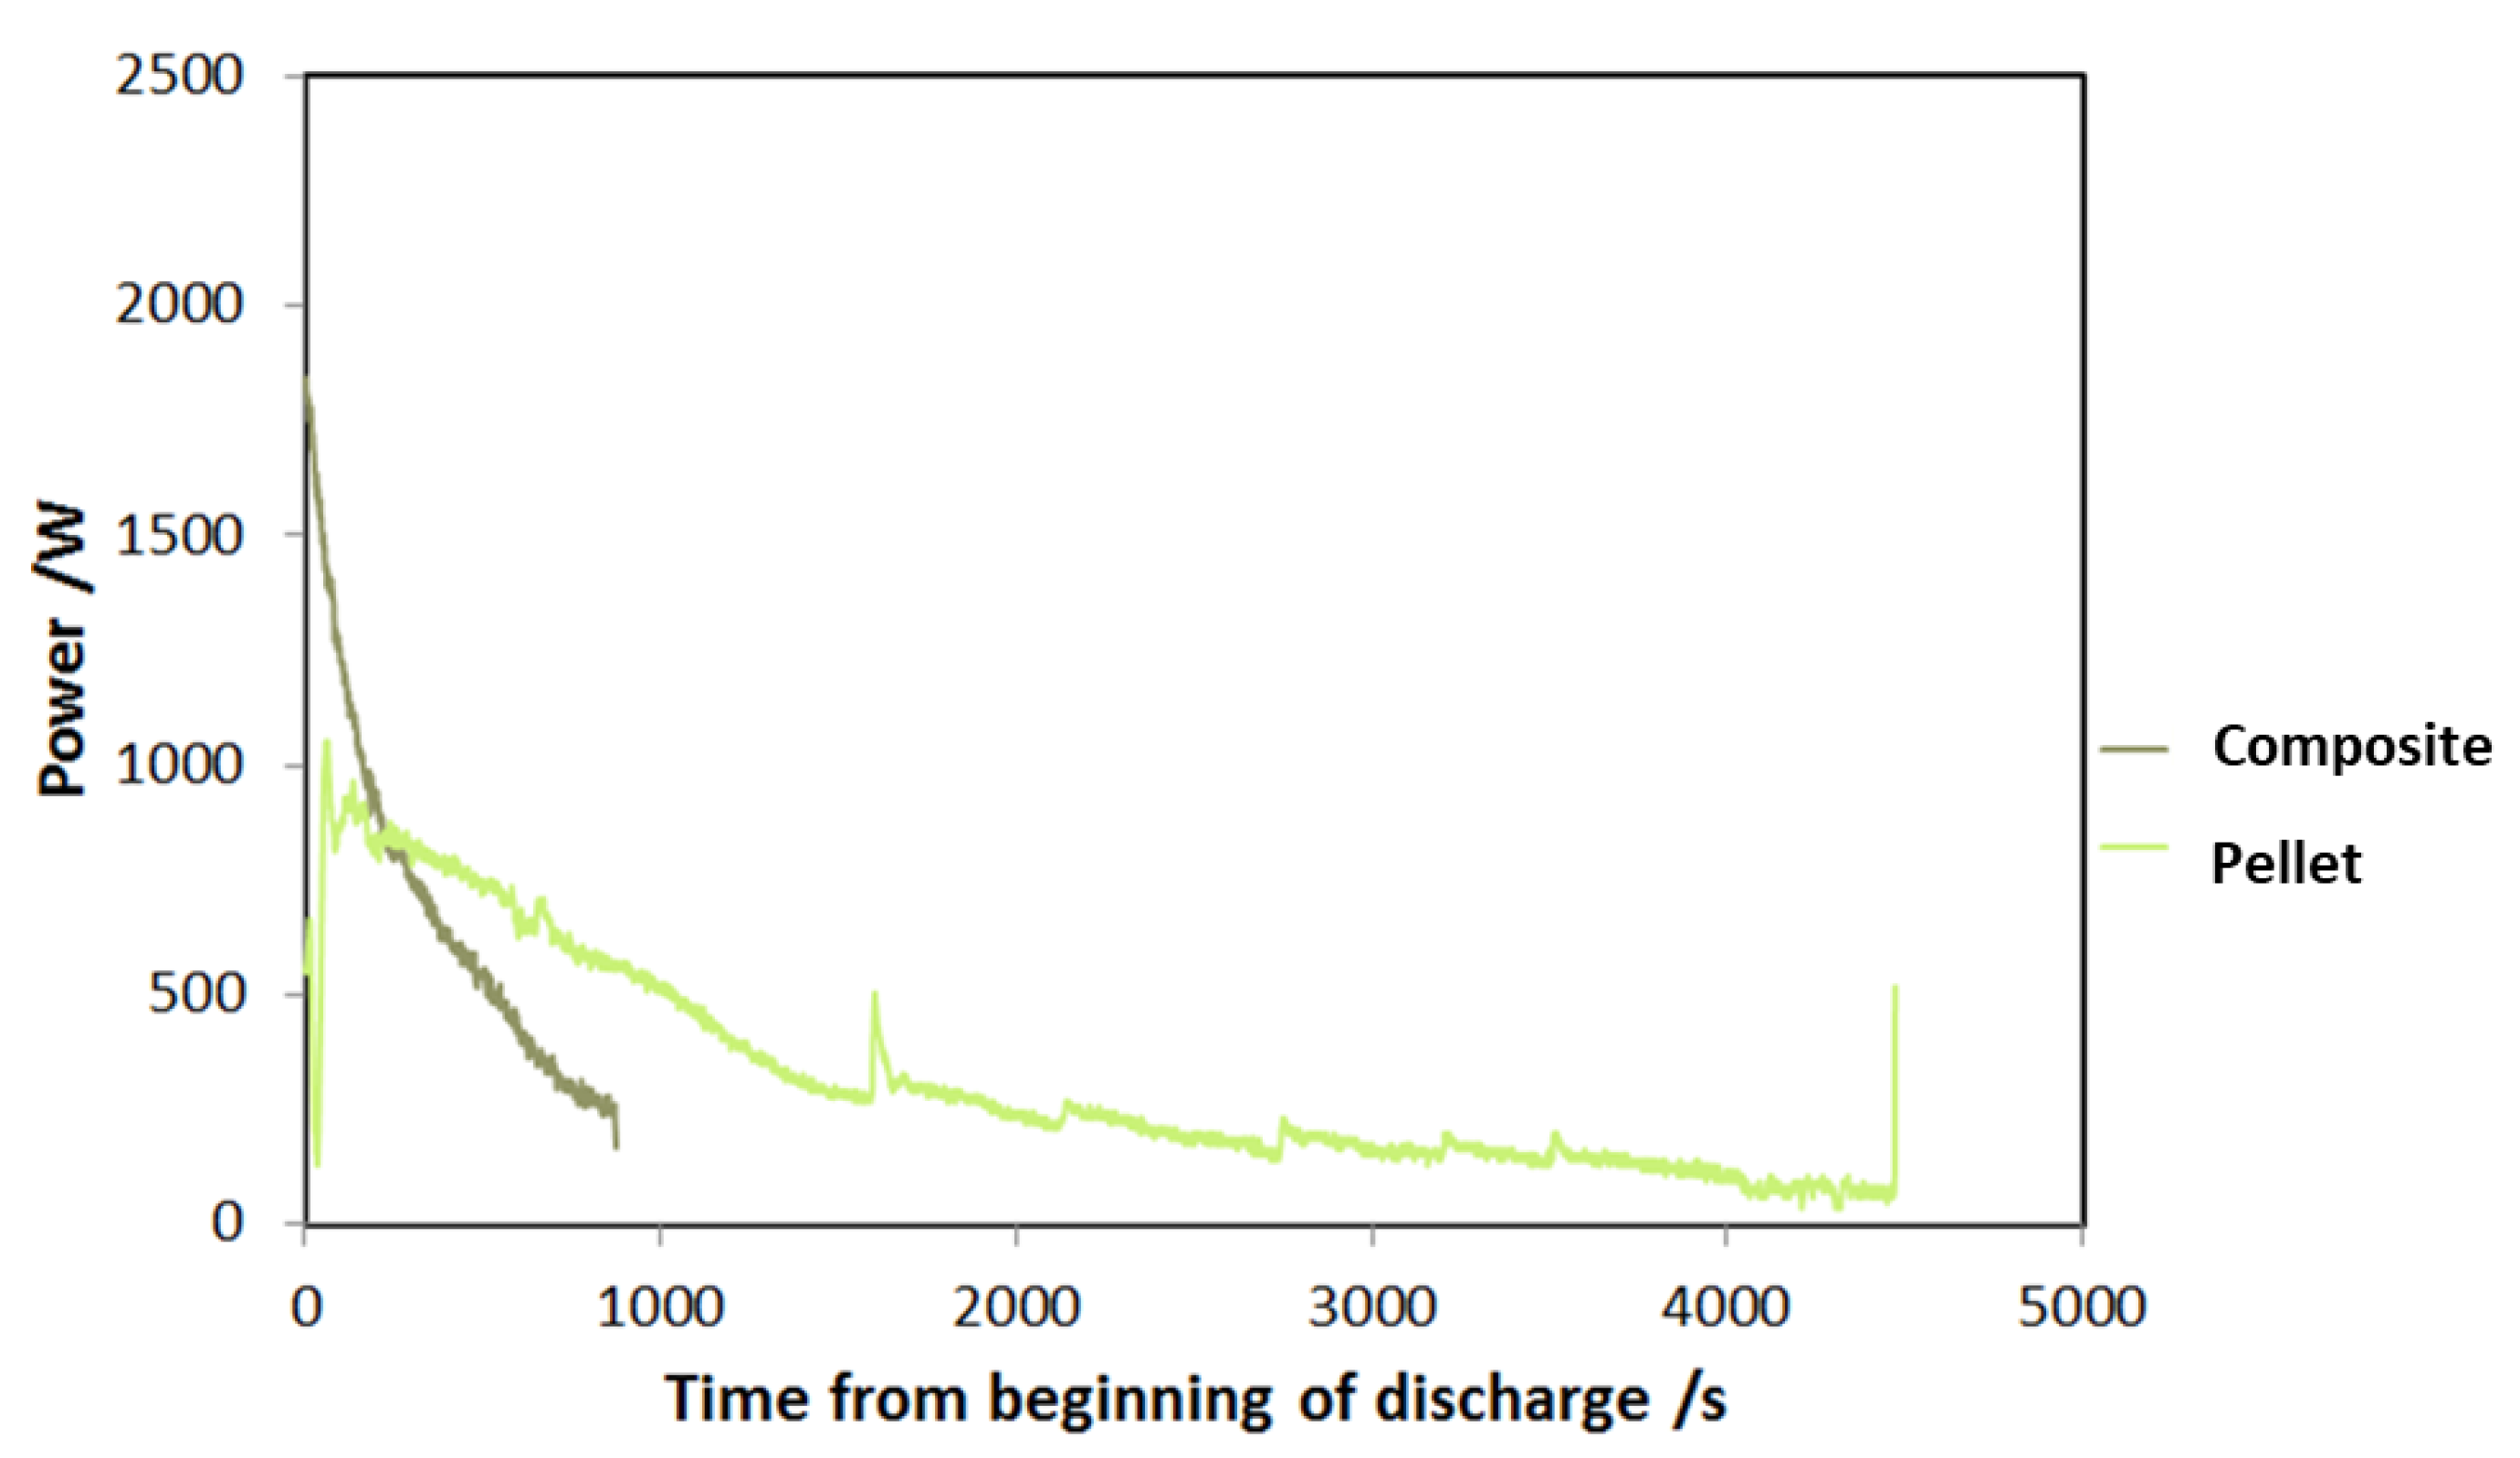
A comparison between the adsorbers has been realized to highlight the benefits arising from the use of a composite technology based on an aluminum, porous structure and a SAPO-34 coating. In Figure 14, the power trend after the beginning of adsorption process is shown for the two types of adsorbers. This is a qualitative measure of the adsorption dynamics in the two different cases. As expected, the peak power of the composite adsorber based on an aluminum, porous structure and a SAPO-34 coating is double with respect to the pellet one, and the whole duration of adsorption is significantly lower (900 s against 4500 s); meanwhile, the pellet adsorber is able to accomplish a more constant discharge.
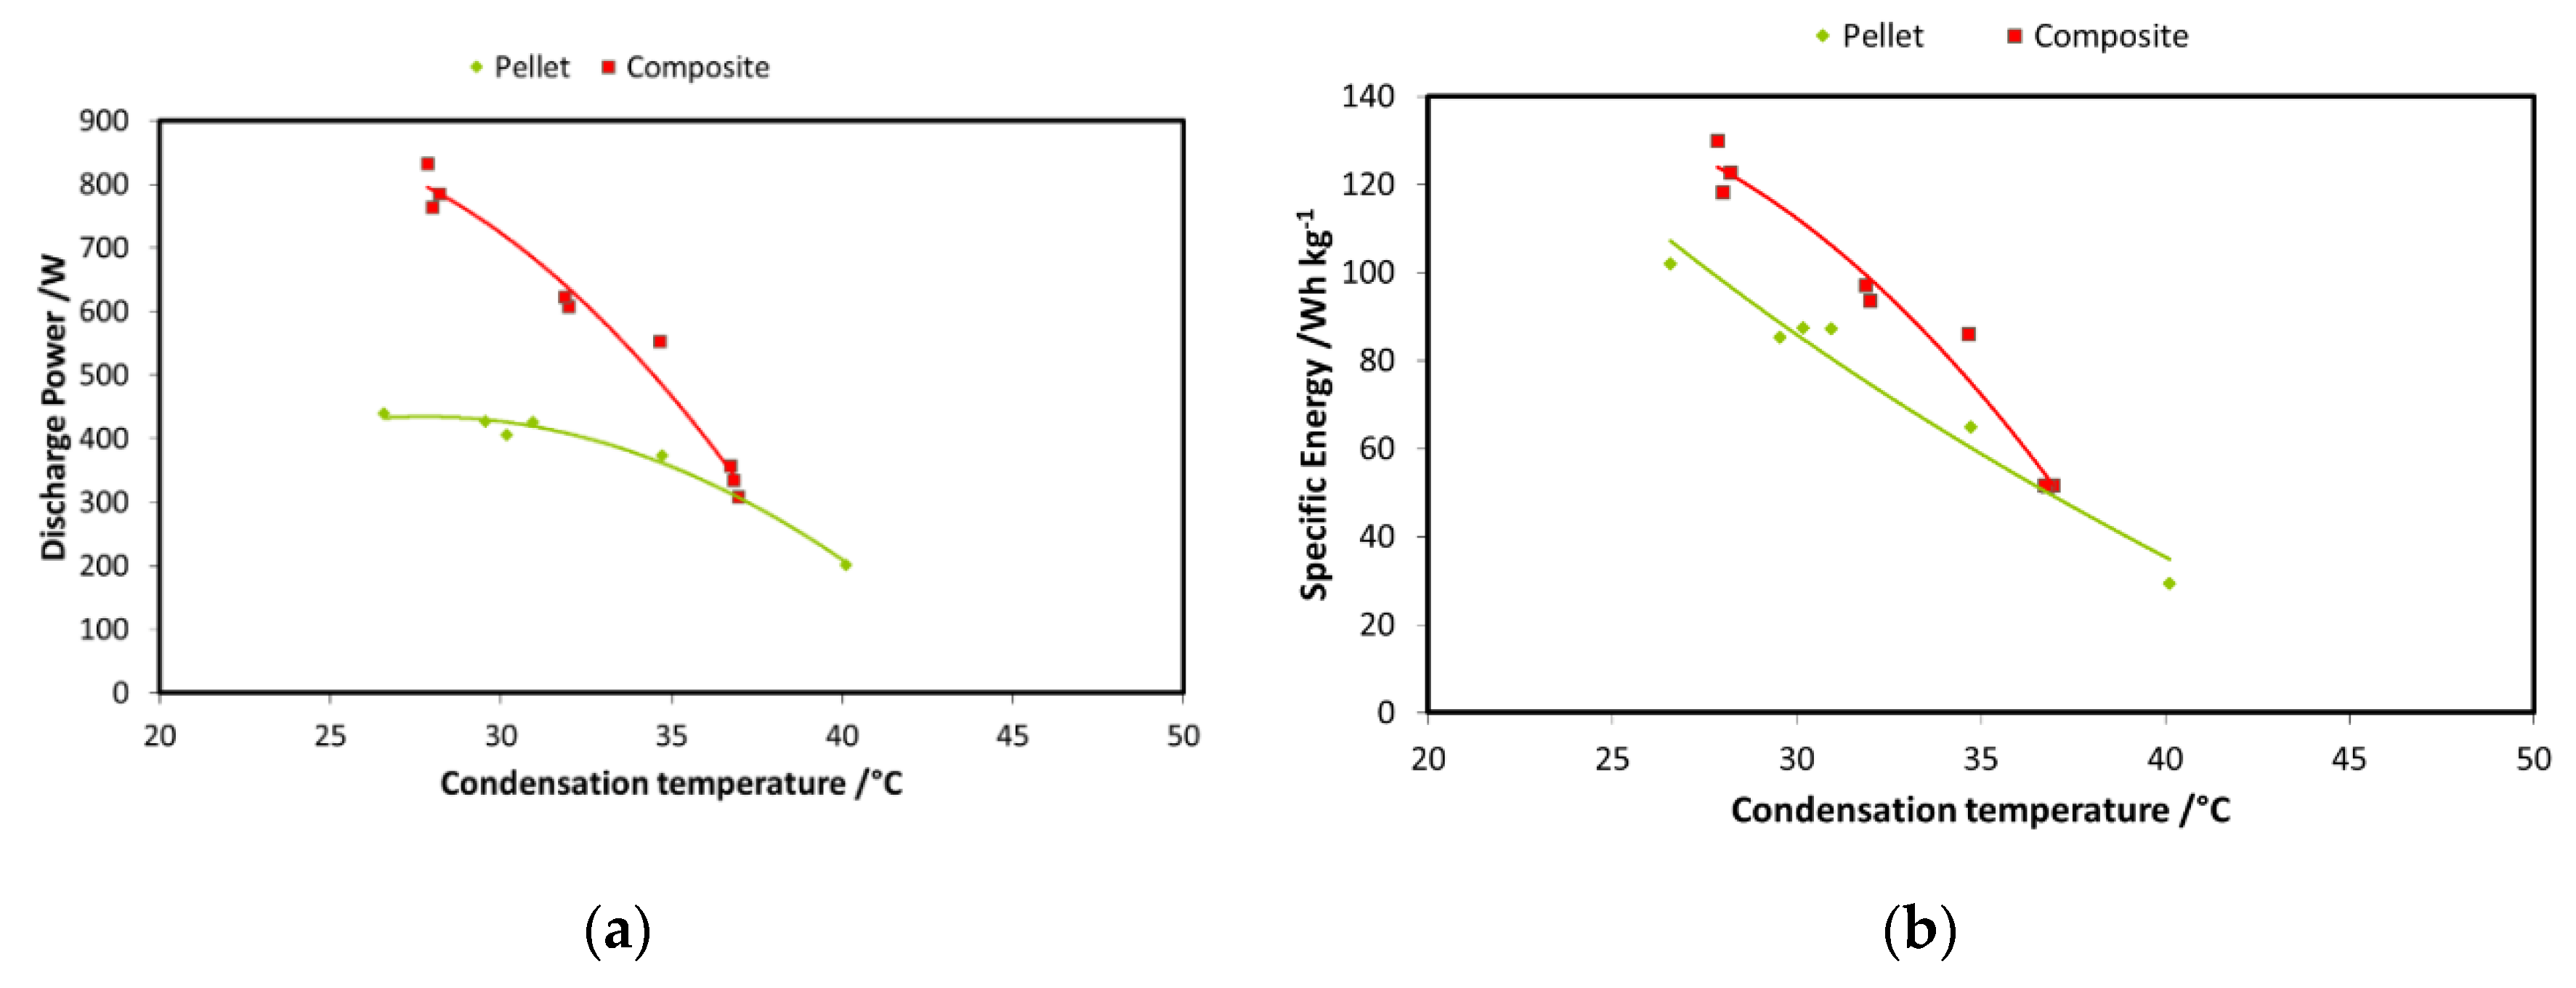
A second step in the comparison between the two systems is reported in Figure 15a,b, wherein the discharge power and recovered energy for the two adsorbers are shown. The boundary conditions used are: 85 °C driving temperature; 15 °C evaporation temperature; and 3600 s charge/discharge time for the pellets adsorber and 900 s for the composite adsorber. Results are displayed as a function of condensation temperature. The results for the energy comparison make use of the specific energy; they are normalized for the masses of the adsorbent materials in the two exchangers. There is a relevant difference in the discharge power achievable with the two technologies: as previously stated, average power during each cycle is much higher in the case of the composite adsorber, about double that of the pellets heat exchanger. The results in terms of specific energy stored do not show the same marked difference; there is only a low increase for the composite technology. However, the results regarding composite heat exchanger probably should take into account the effect of the mass of aluminum composite inside the exchanger.
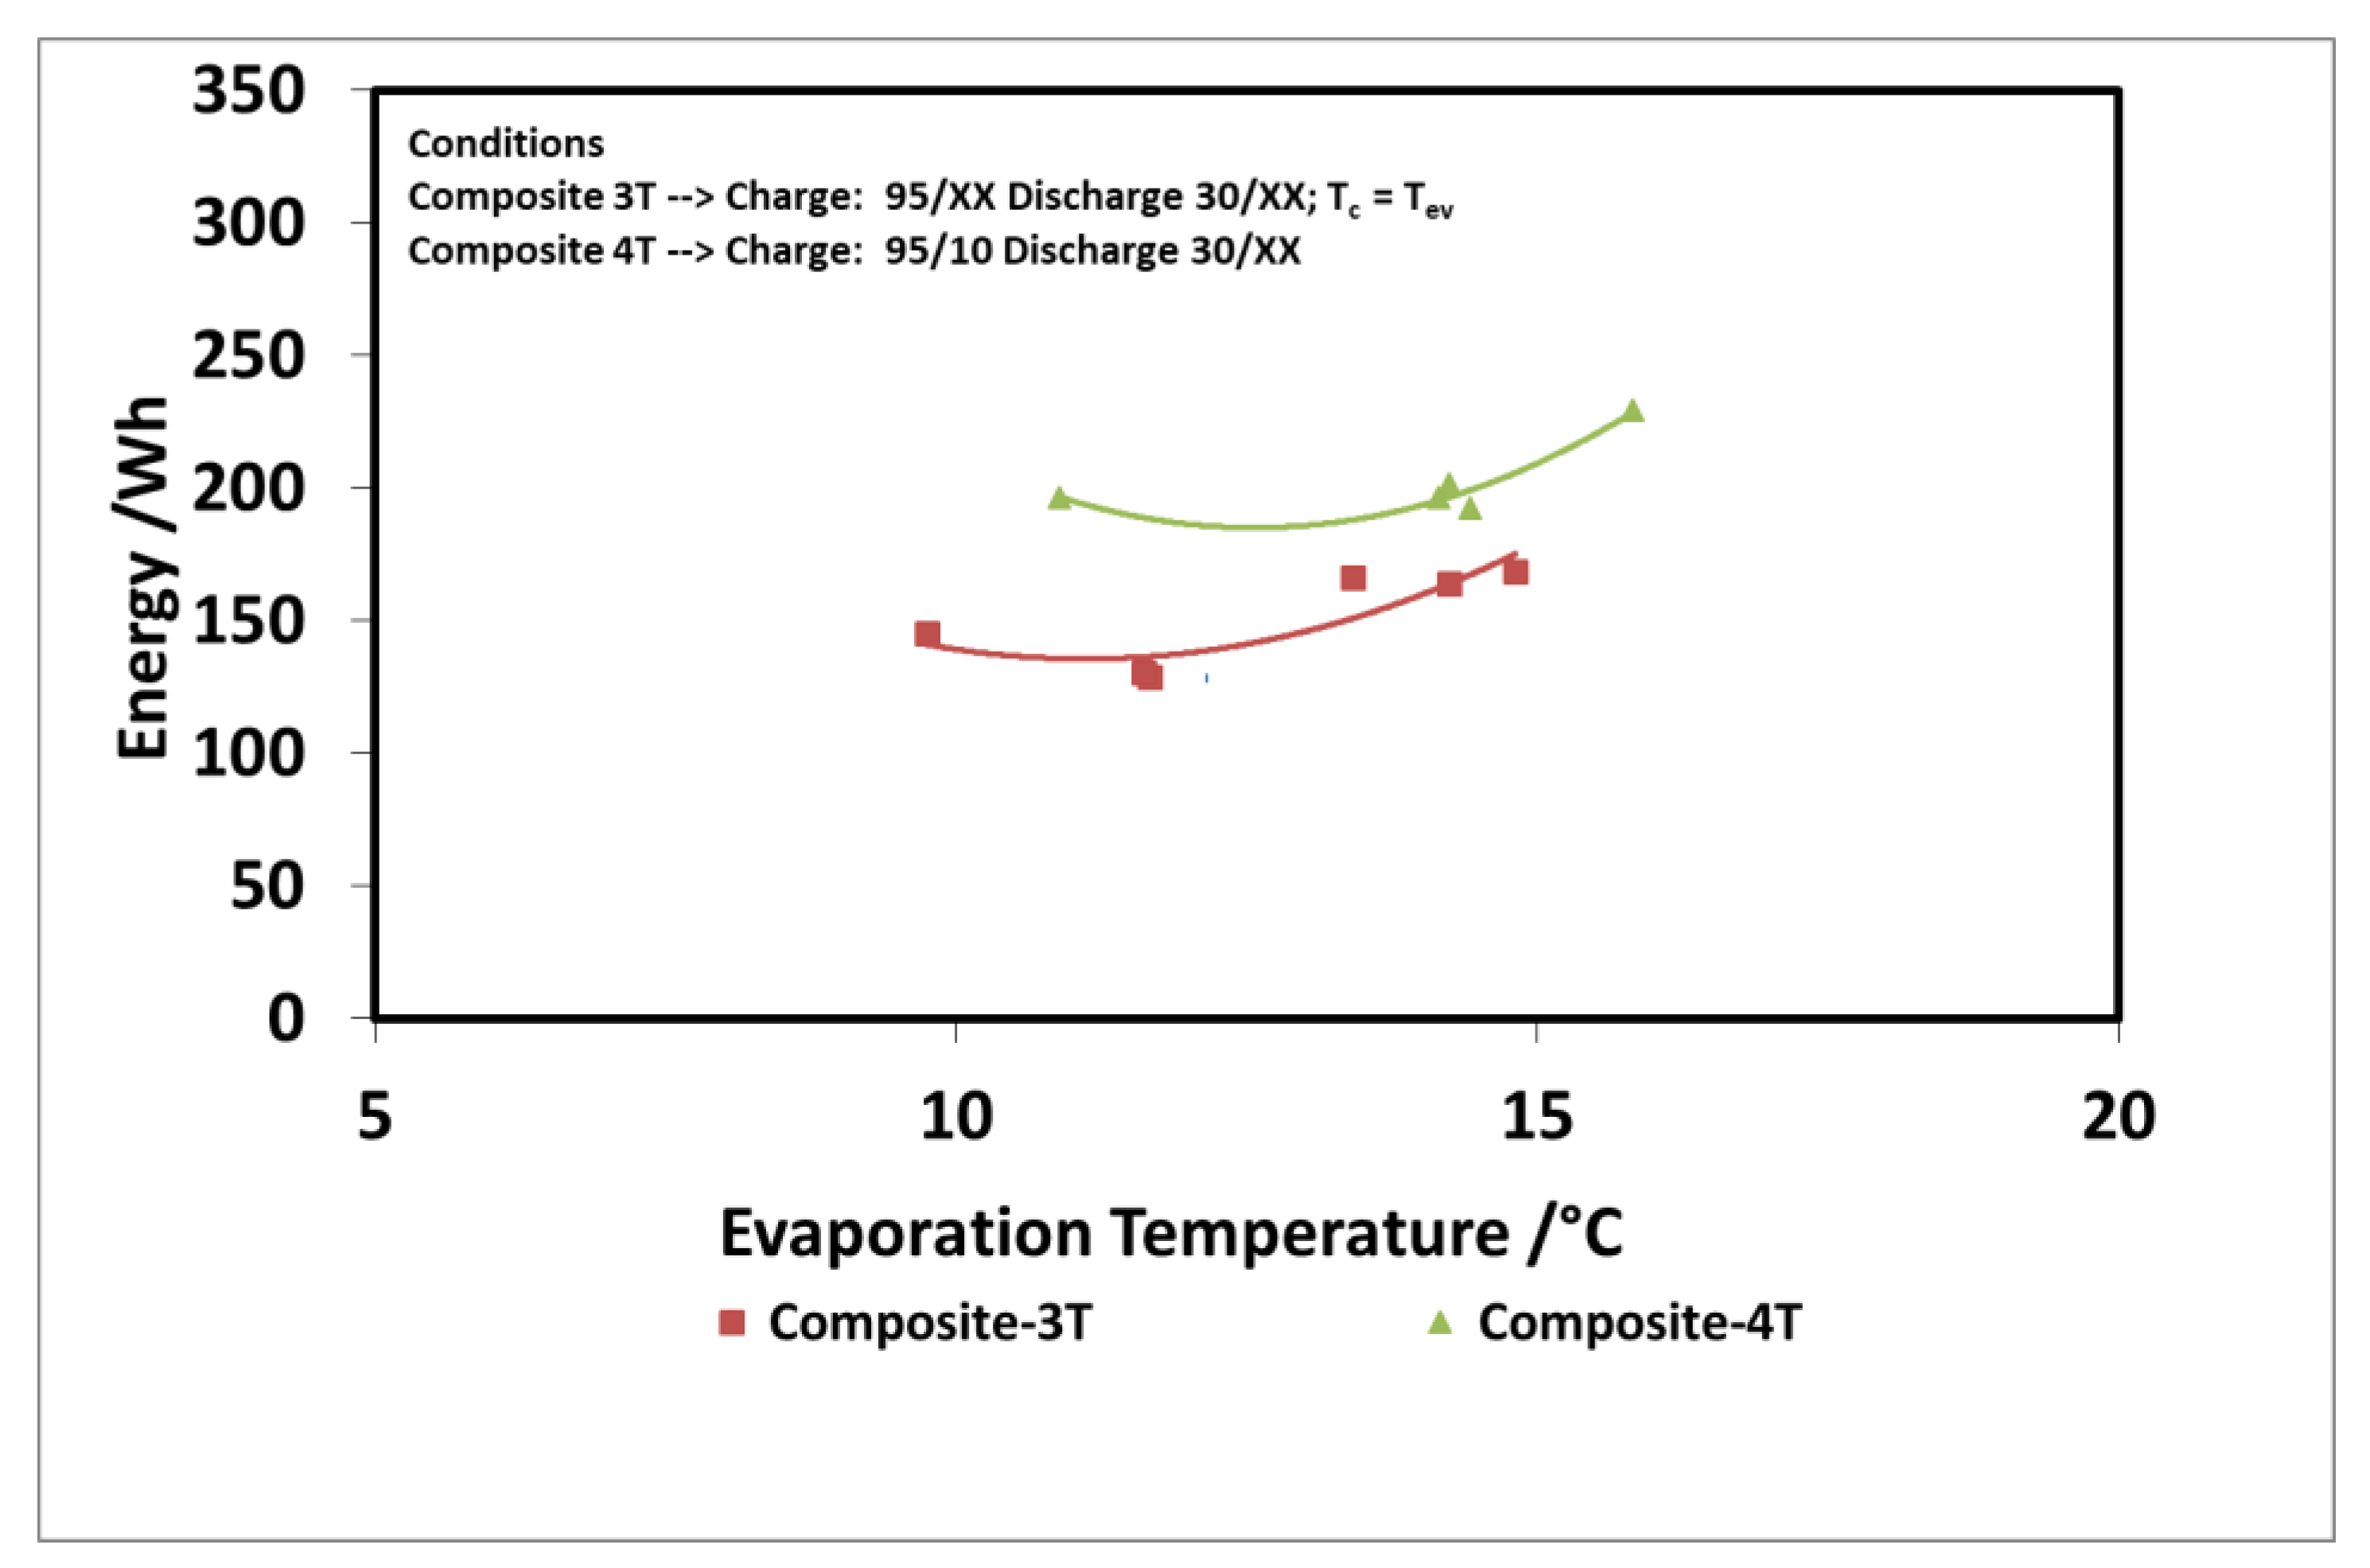
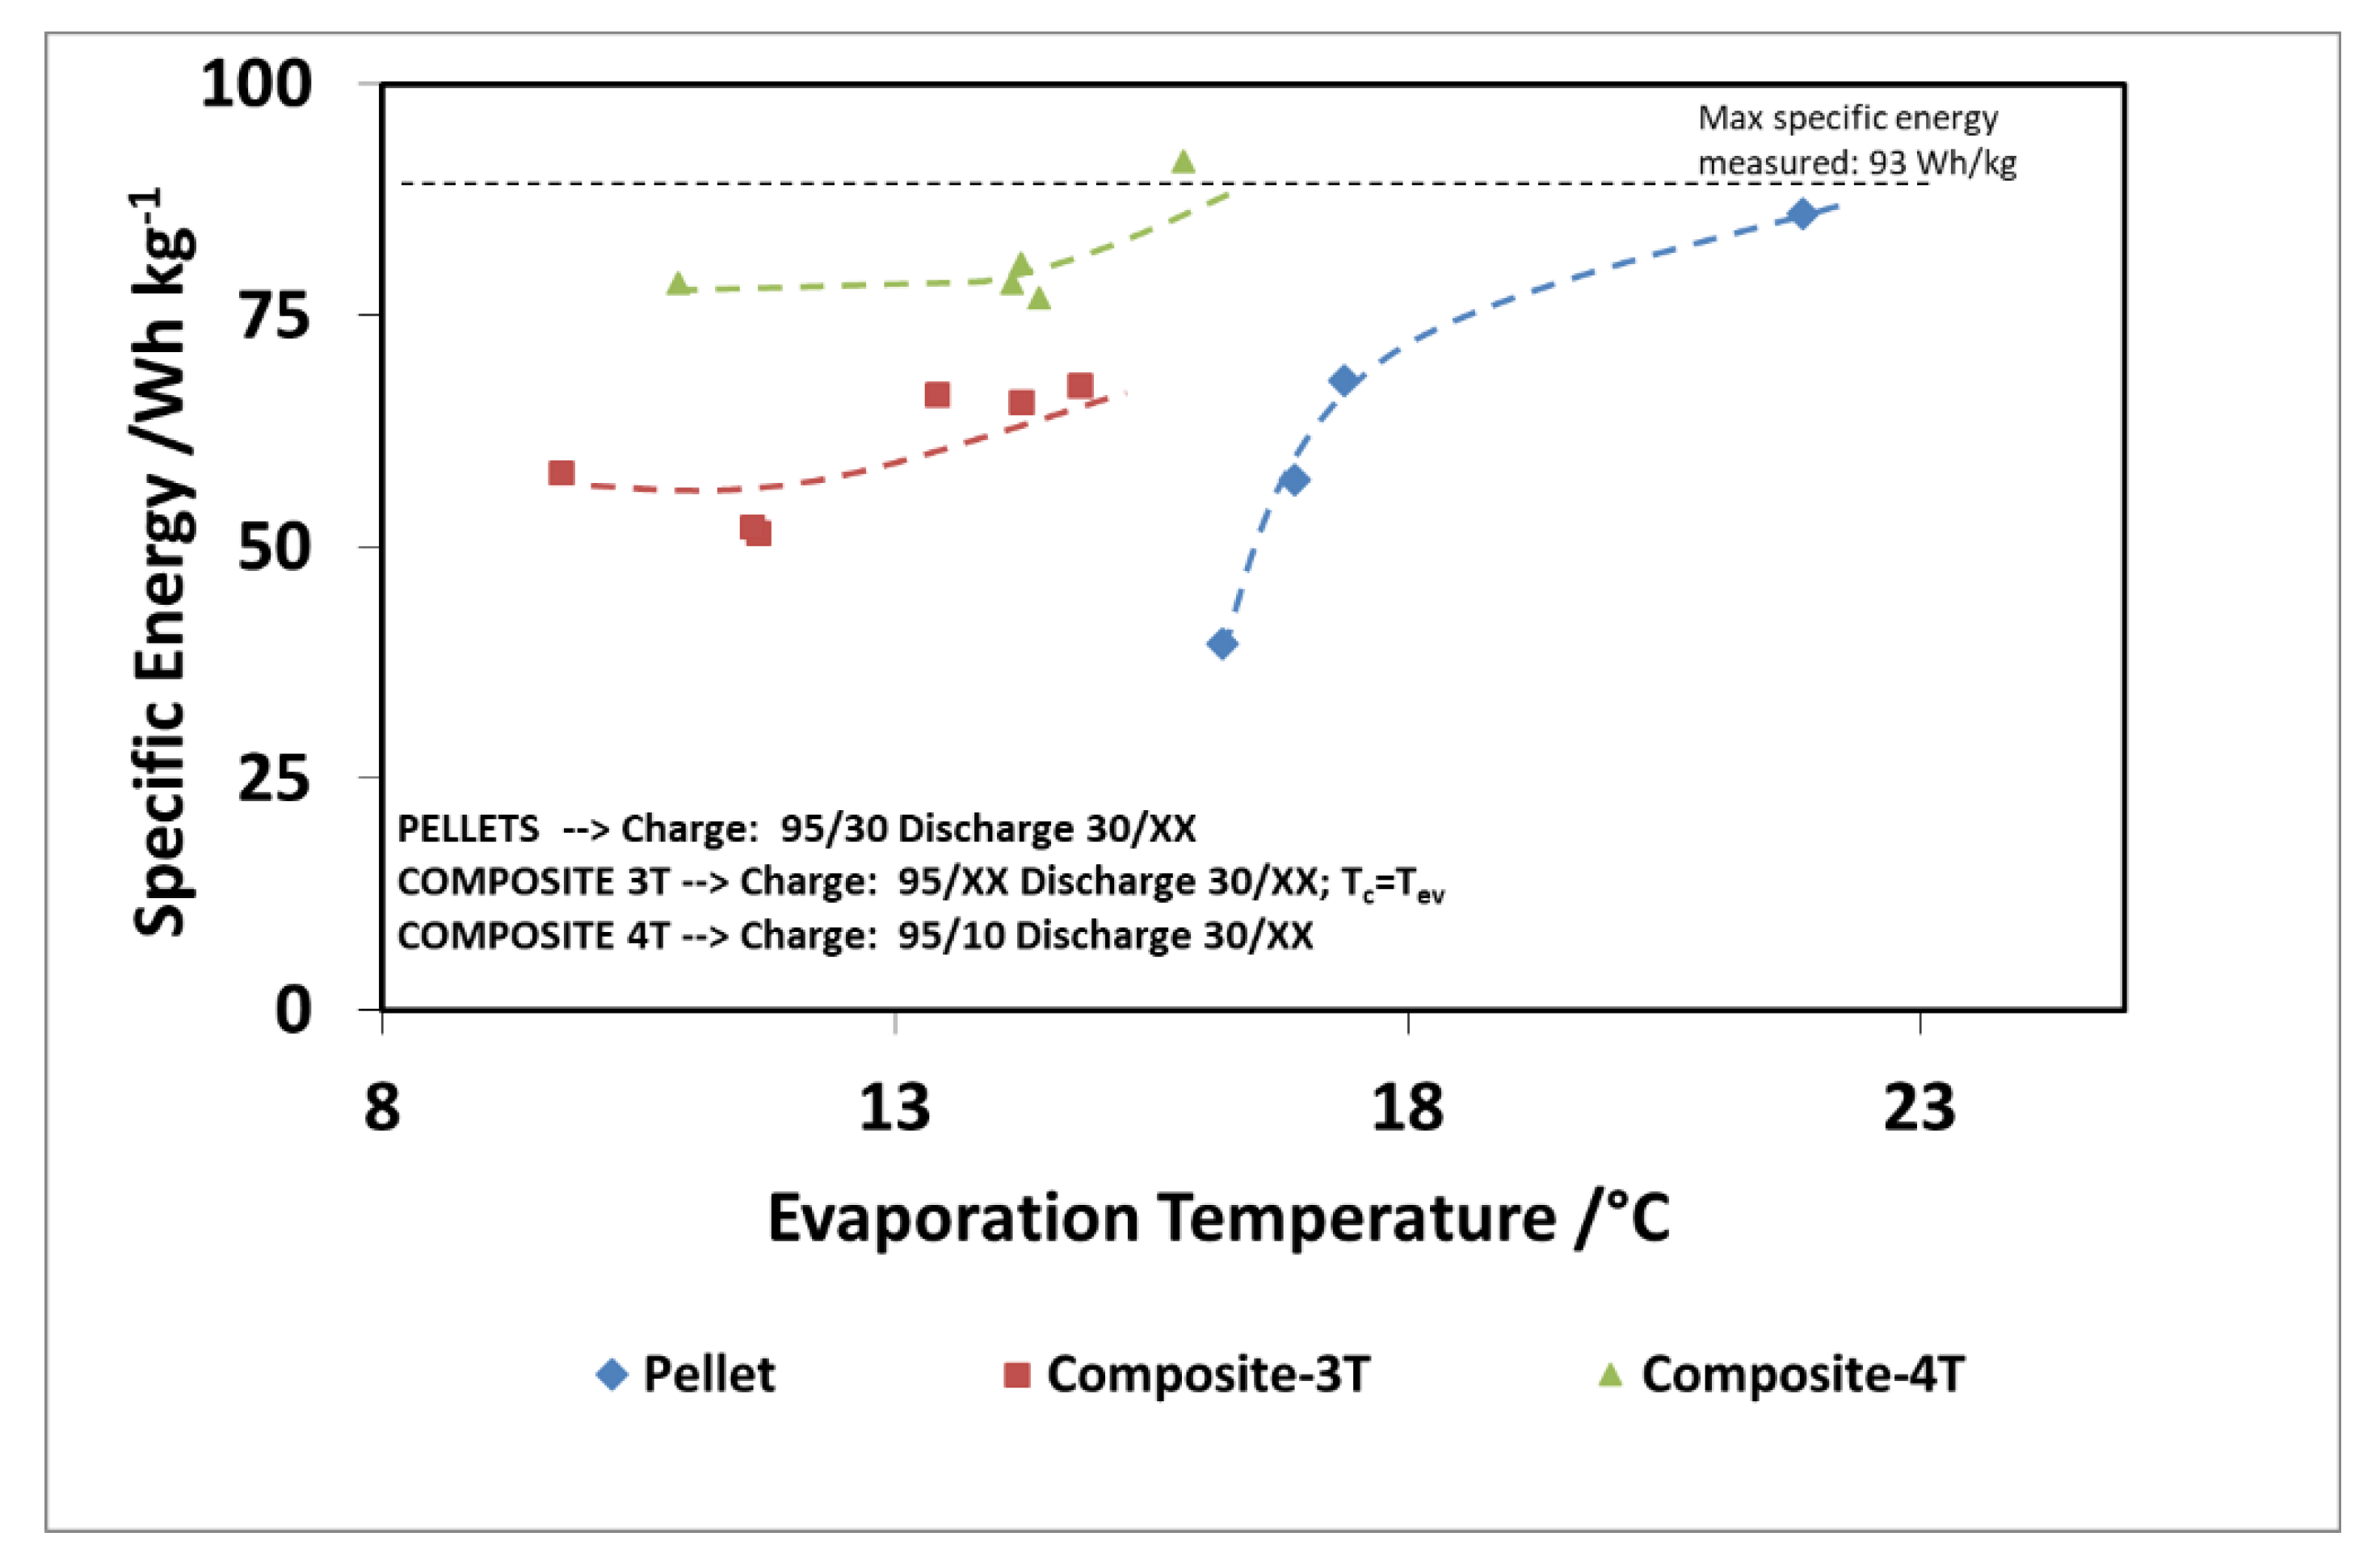
Finally, Figure 16 and Figure 17 show the comparison as a function of evaporation temperature, by considering the operation of the composite adsorber as well, in the best performing configuration, with four temperature levels. In addition, in this case, the results in terms of stored energy are normalized for the mass of adsorbent inside the storage. By considering these conditions, the effect of composite technology is to increase the achievable discharge power by about 60%, especially for higher evaporation temperatures. The maximum specific energy measured in both the pellet and composite adsorber was around 90 Wh/kg, but in the case of the composite adsorber, this result was achieved for an evaporation temperature of 15 °C, whereas for the pellet adsorber this was obtained for an evaporation temperature of 22 °C.
4. Conclusions
In the present paper, the realization and testing of two different types of cold storage for mobile refrigeration applications based on two innovative adsorbent reactors was presented. The performances measured on a pelletized adsorber filled with commercial FAM Z02 zeolite, and a composite adsorber based on an aluminum, porous structure and a SAPO-34 coating were shown. Measurements were carried out thanks to an already existing testing bench specifically realized, and by applying a testing procedure previously developed and published by the authors. The main focus was on the more promising technology. Indeed, a composite adsorber based on an aluminum, porous structure and a SAPO-34 coating was tested by means of three main series of tests: a series of “mapping tests” for its characterization and two series of tests with different charging boundary conditions with respect to traditional operation, with the aim of defining the optimum operating conditions. Finally, a comparison between the two adsorbers has been reported.
The test clearly showed that prototypes are able to store up to 580 Wh, with an average power during the discharging phase that ranges from 200 to 820 W and an energy efficiency of 0.3 for the operations in the selected conditions—revealing promising opportunities for future further developments and demonstrating the feasibility of their application to the refrigeration of the load compartments of small vans or cars.
Author Contributions
Conceptualization, S.V. and V.P.; methodology, S.V.; software, V.P.; validation, S.V., V.P. and D.L.R.; formal analysis, S.V. and V.P.; investigation, V.P. and D.L.R.; resources, S.V.; data curation, V.P.; writing—original draft preparation, A.B.; writing—review and editing, A.B.; visualization, A.B.; supervision, S.V. project administration, S.V.; funding acquisition, S.V. All authors have read and agreed to the published version of the manuscript.
Funding
This research received no external funding.
Conflicts of Interest
The authors declare no conflict of interest.
Nomenclature
| cp | Specific heat, kJ/(kgK) |
| Mass flow rate, kg/s | |
| Mass flow rate to the evaporator, kg/s | |
| Adsorbent material mass, kg | |
| Average Power, W | |
| Stored energy into the evaporator, kJ | |
| COP | Coefficient of Performance, - |
| Inlet temperature to the evaporator, K | |
| Outlet temperature to the evaporator, K | |
| Inlet temperature to the adsorber, K | |
| Outlet temperature to the adsorber, K | |
| Discharge time, s | |
| Charge time, s |
References
- Barberi, P.; Bossmann, T.F.; Laurent, F. METIS Studies Study S6 Decentralised Heat Pumps: System Benefits under Different Technical Configurations; European Commission, Directorate-General for Energy: Brussels, Belgium, 2019. [CrossRef]
- Intergovernmental Panel on Climate Change; Groupe D’experts Intergouvernemental sur L’évolution du Climat. IPCC/TEAP Special Report on Safeguarding the Ozone Layer and the Global Climate System: Issues Related to Hydrofluorocarbons and Perfluorocarbons; Cambridge University Press: Cambridge, UK, 2005; 478p. [Google Scholar]
- European Environment Agency. ADEME (2003), ENERDATA, ISI-FhG, Energy Efficiency in the European Union 1990–2001; SAVE-ODYSSEE Project on Energy Efficiency Indicators; EEA: Copenhagen, Denmark, 2003.
- Tassou, S.A.; De-Lille, G.; Ge, Y.T. Food transport refrigeration—Approaches to reduce energy consumption and environmental impacts of road transport. Appl. Therm. Eng. 2009, 29, 1467–1477. [Google Scholar] [CrossRef] [Green Version]
- Magnetto, D.; de Boer, R.; Vasta, S. TOPMACS: Thermally Operated Mobile Air Conditioning Systems. In Vehicle Thermal Management Systems Conference and Exhibition; Institution of Mechanical Engineers—VTMS 10; Elsevier: Amsterdam, The Netherlands, 2011; pp. 635–647. [Google Scholar]
- Vasta, S.; Freni, A.; Sapienza, A.; Costa, F.; Restuccia, G. Development and lab-test of a mobile adsorption air-conditioner. Int. J. Refrigeration 2012, 35, 701–708. [Google Scholar] [CrossRef]
- Guelpa, E.; Verda, V. Thermal energy storage in district heating and cooling systems: A review. Appl. Energy 2019, 252, 113474. [Google Scholar] [CrossRef]
- Bataineh, K.; Taamneh, Y. Review and recent improvements of solar sorption cooling systems. Energy Build. 2016, 128, 22–37. [Google Scholar] [CrossRef]
- Aydin, D.; Casey, S.P.; Riffat, S. The latest advancements on thermochemical heat storage systems. Renew. Sustain. Energy Rev. 2015, 41, 356–367. [Google Scholar] [CrossRef]
- Engel, G. Sorption cold storage for thermal management of the battery of a hybrid vehicle. Energy Procedia 2018, 155, 149–155. [Google Scholar] [CrossRef]
- Yu, N.; Wang, R.Z.; Wang, L.W. Theoretical and experimental investigation of a closed sorption thermal storage prototype using LiCl/water. Energy 2015, 93, 1523–1534. [Google Scholar] [CrossRef]
- Jiang, L.; Roskilly, A.P.; Wang, R.Z.; Wang, L.W.; Lu, Y.J. Analysis on innovative modular sorption and resorption thermal cell for cold and heat cogeneration. Appl. Energy 2017, 204, 767–779. [Google Scholar] [CrossRef] [Green Version]
- Vasta, S.; Brancato, V.; la Rosa, D.; Palomba, V.; Restuccia, G.; Sapienza, A.; Frazzica, A. Adsorption heat storage: State-of-the-art and future perspectives. Nanomaterials 2018, 8, 522. [Google Scholar] [CrossRef] [PubMed] [Green Version]
- Sapienza, A.; Palomba, V.; Gullì, G.; Frazzica, A.; Vasta, S. A new management strategy based on the reallocation of ads-/desorption times: Experimental operation of a full-scale 3 beds adsorption chiller. Appl. Energy 2017, 1081–1090. [Google Scholar] [CrossRef]
Figure 1.
General scheme of a possible integration on the vehicle of the cold storage system studied.
Figure 1.
General scheme of a possible integration on the vehicle of the cold storage system studied.

Figure 2.
The phase exchanger: (a) the exchangers used; (b) the phase changer, already assembled, used in the prototype.
Figure 2.
The phase exchanger: (a) the exchangers used; (b) the phase changer, already assembled, used in the prototype.

Figure 3.
Layout of hydraulic circuit and data acquisition system.

Figure 4.
The cold storage prototype (highlighted) connected to the testing bench. (1) composite adsorber based on an aluminum, porous structure and a SAPO-34 coating; (2) phase-changer; (3) switching valves; (4) pumps.
Figure 4.
The cold storage prototype (highlighted) connected to the testing bench. (1) composite adsorber based on an aluminum, porous structure and a SAPO-34 coating; (2) phase-changer; (3) switching valves; (4) pumps.

Figure 5.
(a) Typical temperature trends for a reference test; (b) power and energy for a reference test. HT (high temperature) = 90 °C; MT (medium temperature) = 38 °C; LT (low temperature) = 20 °C.
Figure 5.
(a) Typical temperature trends for a reference test; (b) power and energy for a reference test. HT (high temperature) = 90 °C; MT (medium temperature) = 38 °C; LT (low temperature) = 20 °C.

Figure 6.
(a) The effect of charge/discharge time, pelletized adsorber; (b) the effect of evaporation temperature; (c) the effect of condensation temperature. In all these figures, the following nomenclature has been used: HT/MT/LT. When the term XX appears, this means that the specific value (e.g., LT) is variable and must be read on the specific figure (e.g., Figure 6b).

Figure 7.
(a) The effect of charge/discharge time, composite adsorber; (b) the effect of charge time, composite adsorber.
Figure 7.
(a) The effect of charge/discharge time, composite adsorber; (b) the effect of charge time, composite adsorber.

Figure 8.
(a) The effects of evaporation temperature (XX—must be read on the figure) and driving temperature (85 °C or 90 °C) on discharge power for the composite adsorber; (b) the effects of evaporation temperature (XX—must be read on the figure) and driving temperature (85 °C or 90 °C) on recovered cold energy for the composite adsorber; (c) the effect of condensation (XX—must be read on the figure) temperature for the composite adsorber.

Figure 9.
(a) The effect of adsorber flow rate, composite adsorber; (b) the effect of the flow rate of the phase changer, composite adsorber.
Figure 9.
(a) The effect of adsorber flow rate, composite adsorber; (b) the effect of the flow rate of the phase changer, composite adsorber.

Figure 10.
(a) The effect of “deep charging” on discharge power, composite adsorber; (b) the effect of “deep charging” on stored energy, composite adsorber.
Figure 10.
(a) The effect of “deep charging” on discharge power, composite adsorber; (b) the effect of “deep charging” on stored energy, composite adsorber.

Figure 11.
Effect of “deep charge” on the stored energy for evaporation temperature of 10 °C.

Figure 12.
Comparison of 3T and 4T operation on discharge power—composite adsorber.

Figure 13.
Comparison of 3T and 4T operation on stored energy—composite adsorber.

Figure 14.
Dynamic curve of power during discharge for the two adsorbers tested.

Figure 15.
(a) Comparison of the adsorbers—power; (b) comparison of the adsorbers—energy.

Figure 16.
Comparison of discharge power for the adsorbers, considering the 4T operation as well (XX—must be read on the figure).
Figure 16.
Comparison of discharge power for the adsorbers, considering the 4T operation as well (XX—must be read on the figure).

Figure 17.
Comparison of recovered cold energy for the adsorbers, considering also, the 4T operation (XX—must be read on the figure).
Figure 17.
Comparison of recovered cold energy for the adsorbers, considering also, the 4T operation (XX—must be read on the figure).


Table 1.
Data and constraints used for the full-size system and for the demonstrator.
| Full Scale | Parameter | Value | |
| Storage Capacity | 2 kWh | ||
| Discharge Time | 2 h | ||
| Avg. Power | 1 kW | ||
| Water needed | 2.9 l | ||
| Design temperatures | Adsorber | Phase Changer | |
| Charge | 95 °C | 35 °C | |
| Discharge | 35 °C | 10 °C | |
| Useful ΔX | 15% | ||
| Amount of Zeolite | 19.4 kg | ||
| Spec. Zeolite density | 800 g/l foam | ||
| Foam Volume | 24.2 l | ||
| Volume of tubes | 2.4 l | ||
| Total volume | 26.6 l | ||
| Required storage time | > 1 h | ||
| Specific Capacity | 75 Wh/l | ||
| Specific Power | 28 W/l | ||
| Prototype (lab-scale) | Parameter | Value | |
| Portion of product | 25% | ||
| Storage Capacity | 500 Wh | ||
| Avg. Power | 250 W | ||
| Volume of foam | 6.1 l | ||
| Total volume | 6.7 l | ||
Table 2.
Main results of the preliminary sizing process.
| Adsorber Design | |||
|---|---|---|---|
| Theoretical | Real | ||
| Total Capacity | Wh | 500 | 636.40 |
| Total Capacity | kJ | 1800 | 2291.04 |
| Water latent heat | kJ/kg | 2272 | 2272 |
| Water to be evaporated | kg | 0.792 | 1.008 |
| Expected adsorption capacity | kg/kg | 0.15 | 0.15 |
| Minimum zeolite mass | kg | 5.28 | 6.72 |
| Foam density | kg/l | 0.8 | 0.8 |
| Minimum adsorber volume | l | 6.60 | 8.40 |
Table 3.
Parameters monitored during the tests.
| Monitored Parameter | |
|---|---|
| T in/out Adsorber; | T liquid phase into Phase Changer; |
| T in/out Phase Changer (CON/EVAP); | Adsorber HTF (Heat Transfer Fluid) flow rate; |
| Phase changer HTF flow rate; | Adsorber pressure; |
| Phase changer Pressure; | T shell; |
| T ambient. | |
Table 4.
Testing condition, pelletized adsorber.
| Parameter | Value |
|---|---|
| Charge/discharge time (s) | 2700, 3600, 4500 |
| High temperature inlet (°C) | 90 |
| Medium temperature inlet (°C) | 25, 28, 30, 33, 35, 38, 40 |
| Low temperature inlet (°C) | 10, 15, 18, 20, 22 |
| Adsorber Flow rate (kg/min) | 12 |
| Phase changer flow rate (kg/min) | 10 |
Table 5.
Testing conditions for the first characterization tests of the composite adsorber based on an aluminum, porous structure and a SAPO-34 coating.
Table 5.
Testing conditions for the first characterization tests of the composite adsorber based on an aluminum, porous structure and a SAPO-34 coating.
| Parameter | Value |
|---|---|
| Charge/discharge time (s) | 600, 750, 900, 1200 |
| High temperature inlet (°C) | 85, 90 |
| Medium temperature inlet (°C) | 28, 30, 33, 35, 38 |
| Low temperature inlet (°C) | 5, 10, 12, 15, 18, 20 |
| Adsorber Flow rate (kg/min) | 8, 12, 15 |
| Phase changer flow rate (kg/min) | 5, 10, 15, 18 |
© 2020 by the authors. Licensee MDPI, Basel, Switzerland. This article is an open access article distributed under the terms and conditions of the Creative Commons Attribution (CC BY) license (http://creativecommons.org/licenses/by/4.0/).
Share and Cite
MDPI and ACS Style
Vasta, S.; Palomba, V.; La Rosa, D.; Bonanno, A. Adsorption Cold Storage for Mobile Applications. Appl. Sci. 2020, 10, 2044. https://doi.org/10.3390/app10062044
AMA Style
Vasta S, Palomba V, La Rosa D, Bonanno A. Adsorption Cold Storage for Mobile Applications. Applied Sciences. 2020; 10(6):2044. https://doi.org/10.3390/app10062044
Chicago/Turabian StyleVasta, Salvatore, Valeria Palomba, Davide La Rosa, and Antonino Bonanno. 2020. "Adsorption Cold Storage for Mobile Applications" Applied Sciences 10, no. 6: 2044. https://doi.org/10.3390/app10062044
Note that from the first issue of 2016, this journal uses article numbers instead of page numbers. See further details here.