Article

Energy-Efficient Resource Provisioning Using Adaptive Harmony Search Algorithm for Compute-Intensive Workloads with Load Balancing in Datacenters

1
School of Computing, SASTRA Deemed University, Thanjavur 613401, India
2
School of Electrical and Electronics Engineering, SASTRA Deemed University, Thanjavur 613401, India
3
Department of Energy IT, Gachon University, Seongnam 13120, Korea
*
Authors to whom correspondence should be addressed.
Appl. Sci. 2020, 10(7), 2323; https://doi.org/10.3390/app10072323
Submission received: 5 March 2020 / Revised: 21 March 2020 / Accepted: 23 March 2020 / Published: 28 March 2020

Abstract

:
Drastic variations in high-performance computing workloads lead to the commencement of large number of datacenters. To revolutionize themselves as green datacenters, these data centers are assured to reduce their energy consumption without compromising the performance. The energy consumption of the processor is considered as an important metric for power reduction in servers as it accounts to 60% of the total power consumption. In this research work, a power-aware algorithm (PA) and an adaptive harmony search algorithm (AHSA) are proposed for the placement of reserved virtual machines in the datacenters to reduce the power consumption of servers. Modification of the standard harmony search algorithm is inevitable to suit this specific problem with varying global search space in each allocation interval. A task distribution algorithm is also proposed to distribute and balance the workload among the servers to evade over-utilization of servers which is unique of its kind against traditional virtual machine consolidation approaches that intend to restrain the number of powered on servers to the minimum as possible. Different policies for overload host selection and virtual machine selection are discussed for load balancing. The observations endorse that the AHSA outperforms, and yields better results towards the objective than, the PA algorithm and the existing counterparts.

Graphical Abstract

1. Introduction

The evolution of cloud computing paves the way for realizing the long-held dream of the deliverance of computing resources as a utility to users. The applications, development environments and infrastructure services are delivered to the users through large and small datacenters [1]. However, the datacenters persistently suffer from their ever-increasing energy consumption and CO2 emissions. Besides this, the money spent on energy consumption by a datacenter plays a crucial role in deciding the cloud provider’s service cost [2]. According to the natural resources defense council (NRDC) report [3], U.S. datacenters’ energy consumption is expected to reach 140 billion kilowatt-hours of electricity in the current year of 2020, which is equivalent to 50 large coal-based power plants emitting nearly 150 million tons of carbon dioxide (CO2). Further, the report emphasizes that the best energy efficiency practices and policies could reduce electricity use by 40%. Due to this, energy consumption reduction has become a crucial design parameter in modern datacenters [4]. Interestingly, the primary source of energy consumption in a datacenter is its enterprise servers, which consume more than 60% of the overall energy [5]. At the granular level, the power consumption of enterprise servers can be categorized into static and dynamic: static power consumption is due to powered-on servers with no circuit activity, whereas dynamic power consumption is due to the switching of transistors during workload execution. On average, 30% of the existing servers are comatose, meaning that they are idle and contributing to static power consumption [6]. Further, more than 80% of the information technology (IT) budget is spent to keep them running as an essential measure to ensure availability, which is an overestimated resource requirement. To meet the service level agreement, it is essential to keep all servers running. An idle server consumes approximately two-thirds energy of its 100% utilization at full load [7,8,9]. In addition, it is noteworthy that idle power and dynamic power consumption on a utilization level varies based on the different power models of physical servers. The energy reduction caused by shrinking the number of existing resources by virtual machine (VM)-consolidation may spin-off lower-level resource availability resulting in jeopardizing the goodwill and credibility of the provider. Utilization of the server at a high voltage results in a high temperatures and shorter lifetime. Optimal server utilization provides an optimized power consumption of central processing unit (CPU) resources resulting in the increased lifetime of the resource with a power consumption that is limited to its specification. The computation capacities of the servers have to be realized and optimum utilization of resources should be achieved [10] to reduce idle and active servers’ power consumption. By considering the above-mentioned advantage, in this research work an adaptive harmony search algorithm (AHSA) and power award (PA) algorithm is proposed to achieve minimum power consumption of the servers.
The rest of the paper is organized as follows: Firstly, general facts about the datacenter power consumption are outlined in Section 1. Secondly, several closely associated research works are given in Section 2. Following that, the research problem formulation is given in Section 3. Subsequently, Section 4 elaborates on the algorithms that are considered in this research work. Afterwards, the virtual machine distribution algorithm is explained in Section 5. Then, the experimental set-up for evaluation, results and discussions about the significance of load balancing are discussed in Section 6. Finally, Section 7 concludes the findings of this research work.

2. Related Works

A multi-objective genetic algorithm is proposed for dynamic demand prediction to minimize energy consumption and increase resource utilization [11]. Many heuristic algorithms have been used in the VM placement problem: ant-colony-based VM placement is formulated as a multidimensional bin-packing problem to control resource wastage and energy consumption simultaneously [12]. Group technology-based cuckoo optimization technology is used to control the datacenter’s operating cost, considering task migration, VM creation and energy consumption [13]. An improved practical swarm optimization is used to increase the quality of service with reduced power consumption [14]. A nature-inspired genetic algorithm and bacterial-foraging algorithm are used for efficient task scheduling to reduce energy consumption and to minimize the overall makespan of the task [15]. A modified genetic algorithm is proposed by generating an initial population with the Max–Min approach to get a better makespan [16]. A new heuristic embedded with the ant colony is proposed to reduce energy consumption [17]. The nature of the harmony search algorithm adopts itself to suit both discrete and continuous variable problems [18]. Virtual machine consolidation is performed using harmony memory search by reducing the number of active machines along with the quality of service requirement [19]. Ant-colony-based consolidation of VMs is utilized to minimize energy consumption with acceptable performance levels [20]. The modified practical swarm optimization approach is used to perform virtual machine consolidation with an aim to reduce power reduction using CloudSim [21]. Meta-heuristic approaches are a considerable alternate to obtaining a solution that offers a trade-off between computational cost and the best fitness solution for NP (non-deterministic polynomial-time)-hard problems. There is no single global optimal algorithm that derives the best optimal solution in all optimization schemes [22]. A few optimization algorithms, like ant colony and genetic algorithms, follow the search path of recently generated partial solutions, few others provide a single-point search solution, in which the search path is decided based on the solution generated at each interval. Many meta-heuristic algorithms are population-based, storing a set of feasible solutions in the search path, which paves the way for efficient exploration in global search space.
Metaheuristic algorithms have been identified as efficient tools to solve engineering design problems [23]. Harmony Search Algorithm (HSA) has been used in the majority of applications, like power and energy management, distributed generation and capacitor placement, transmission network planning, job scheduling, neural network training, water pump switching, water distribution network, heat and power economic dispatch, charge scheduling of energy storage systems with renewable power generators, estimation of life cycle cost and carbon dioxide equivalent emission of the buildings [24,25,26,27,28,29,30] and so on. A hybrid approach, coral reefs optimization has been used to tackle the feature selection problem for an extreme learning machine prediction model for short-term wind prediction in [31]. Optimization techniques are widely used in many sustainable energy sources such as building, environment and energy. The finding of much recent scientific research works highlights the growth and popularity of optimization approach towards the reduction in the CO2, energy consumption and power cost. The potential and strength of meta-heuristic algorithms in exploration and exploitation have made its applicability in sustainable energy optimization problems possible, which is the current need [32]. The increasing demand for the power and environmental challenges of global warming has made renewable energy (solar, wind and hydro) an inevitable substitute of existing power sources to reduce greenhouse gas emissions. The attention and expansion of solar energy have increased due to a decrease in its installation cost. Despite its cost, there is a need to overcome the regulatory, technical barriers to achieving its growth [33].
The most efficient server first greedy task scheduling algorithm considers the energy profile of the servers and allocates the task to the servers with a minimum increment in overall power consumption. The energy reduction is achieved by two factors: (i) by reducing the number of active servers, (ii) by choosing an appropriate server for task placement [34]. The most urgent, CPU-intensive, Bag-of-Task scheduling is performed by introducing a dynamic voltage frequency scaling intelligence in the scheduling algorithm to achieve power reduction [35]. Energy reduction is achieved by executing the processors in minimum frequency level and the quality of service is maintained by executing the tasks within the deadline. The unbalanced resource usage, high energy usage and the number of migrations are handled by task categorization and a resource utilization square model [36]. The weight function is applied to each task based on its resource requirement for task categorization. The individual resource is ranked based on its utilization via the resource utilization square model and the resource famine is reduced by efficient VM consolidation by selecting energy-efficient target servers. The sufficient utilization of green energy, maintaining the required resource demand within the datacenter is achieved by combining the heuristics and statistical approaches. The optimization problem for cost reduction is formulated considering the server and cooling device’s power consumption, aiming at overall net revenue.VM migration is based on the joint optimal planning on two parameters: maximum profit and maximum green energy utilization [37]. Scheduling of workflow considering data file assignment reduces the execution time of the task with reduced overall makespan. The distribution of the tasks and data are considered as a single dependent problem, rather than two independent problems. A hybrid evolutionary algorithm-based task scheduling and data assignment approach outperforms the standard approaches, Min-Min and heterogeneous earliest finish time [38]. VM placement and data placement are considered as a single problem to reduce cross-network traffic and bandwidth usage. Ant colony optimization was used for the selection of physical machine’s (PMs) for the placement of data adjacent to VMs. Data, placed in close proximity to the VM, with the decrease in VM communication distance, resulted in a reduction in job completion time [39]. A queuing structure to handle a large set of VMs and crow-search-based multi-objective optimization was used to reduce resource wastage and power consumption in datacenters [40]. The results were compared against the genetic algorithm and the first fit decreasing approach. The live migration was handled in serial, parallel and improved serial methods. A hybrid krill herd optimization algorithm with an eagle strategy was used for VM expansion during heavy load to maintain the quality of service agreement. The problem of eccentrics and congestion was handled by a new proposed change and response and agreement protocol by monitoring the packet delay, latency and throughput. The experimental results of the hybrid krill herd optimization approach were compared against particle swarm optimization, ant colony optimization, genetic algorithm and simulated annealing [41].
In this article, AHSA, a population-based method suitable for solving continuous and discrete optimization problems, is proposed to reduce the power consumption of the servers. AHSA holds its strength in obtaining a new solution by considering both the probabilistic parameters of all the individual values of the initial harmony and independent variable tuning (stochastic operators). The additional credit is that the rate of convergence and quality of the solution does not depend on initial values, such as a gradient-search. The objective function used in AHSA could satisfy the analytical and differentiable metric.

3. Problem Formulation

Let V = {V1, V2, V3, …, VN} represent the N number of reserved VMs with operating frequency (F1, F2, F3, …, FN), cores (C1, C2, C3, …, CN) and execution time (τ1, τ2, …, τN). Each Vi where i ε [1, N] can be characterized as a triplet (Fi, Ci, τi), thus Fi represents reserved frequency, and Ci represents the number of cores, τi represents the execution time reserved for Vi. Let S = {S1, S2, S3, …, SM} represents M number of heterogeneous servers, each with k number of discrete frequencies (f0, f1, f2, f3, …, fk+1) with utilization(U0, U1, U2, …, Uk+1), U0 = 0%,Uk+1 = 100% and dynamic power (P0, P1, P2 P3, …, Pk+1). U0 is idle state with power consumption P0. Each Sj, where j ∈ [1,M] with utilization (Uj,0, Uj,1, Uj,2, …, Uj,k+1) and power consumption (Pj,0, Pj,1, Pj,2, Pj,3, …, Pj,k+1) can be characterized as a triplet (Utlj, Pj, TCj), where Utlj is the current utilization of server Sj, Pj, is the power consumption of server Sj, where as the TCj is the total processing capacity of Sj. The relation R between jth physical machine (PM) and ith VM indicates whether VMi is placed in PMj, i.e.,
R ( j , i ) = { 1 VM i CPU PM j CPU   a n d   VM i mem PM j mem , VM i is   allocated   to   PM j i [ 1 , N ]   and   j [ 1 , M ] 0 otherwise }
The Service Level Agreement (SLA) is measured using the Ratio of VM Acceptance (RVA) calculated as
RVA(V) = T(R)/N
where, N is the total number of VM requests submitted and T(R) is the total number of VM requests accepted and mapped to available PMs. It is derived as
T ( R ) = j = 1 M i = 1 N R ( j , i )

3.1. Objective Function

The VM requests (ReqQ) are accepted at the beginning of each reservation cycle. The VM request in ReqQ with (Fi, Ci, τi) remains constant. τi is the total number of reservation cycles reserved by the VM for the resource (Fi × Ci). Utlj(t) is the current utilization of server j. The power consumption of jth physical machine with utilization l at time t is represented as P j , l ( t ) and derived as [42]
P j , l ( t ) = ( U t l j ( t ) ) ( U j , l ) ( U j , l + 1 ) ( U j , l ) × ( ( P j , l + 1 ) ( P j , l ) ) + ( P j , l )
where, Uj,l ˂ Utlj(t) ˂ Uj,l+1, 0 ≤ l < k + 1.
The energy consumption of jth PM within a reservation cycle (rc) can be calculated as
0 r c l = 0 k + 1 P j , l ( t ) d t
The total energy consumption of all the PMs within a reservation interval [0, rc] can be calculated as
j = 1 M 0 r c l = 0 k + 1 P j , l ( t ) d t
The energy consumption (E) of all the physical machines in the data center within an interval [0, T] can be partitioned as number of reservation cycles (nrc) segments and it is obtained by
E ( D ) = j = 1 M r c = 1 n r c l = 0 k + 1 i = 1 N R j , i ( t r c ) × P j , l ( t r c ) × ( t r c t r c 1 )
The resource allocation problem in datacenters is formulated as
G ( x ) = { G e n e r g y ( x ) = min E ( D ) s . t ( 9 ) ( 13 ) }
The objective function G(x) is subject to the following constraints:
The total number of VM’s allocated to a machine should not exceed the servers computing (CPU) and memory capacity (mem).
i = 1 N R j , i c p u P M i c p u . m a x
i = 1 N R j , i m e m P M j m e m . m a x
The relation R between VM and PM is many-to one, i.e., R ⊆ N × M if
  i ϵ N &   j , k ϵ M : ( i , j ) R   ( i , k ) R j = k
The total energy (eng) consumed by all the VM’s should not exceed the available brown energy (B) at the datacenter
i = 1 N R j , i e n g T o t a l   A v a i l a b l e   B
The total brown energy consumed should not exceed the cloud providers’ agreed upon grid electricity consumption (G)
T o t a l   a v a i l a b l e   B T o t a l   a s s i g n e d   G .

3.2. System Model Overview

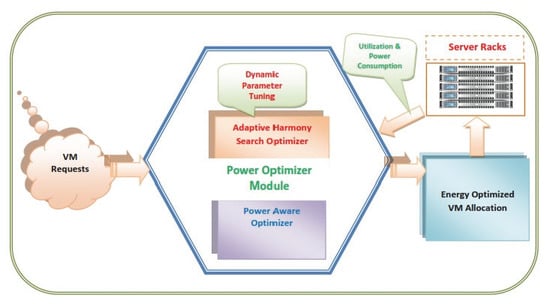
Figure 1 presents the system model of the proposed work. Each component of the system model is explained below:
  • Request Queue (ReqQ): The ReqQ stores the entire reserved VM provisioning request.
  • Physical Machine Repository (HostQ): The resource details related to available memory, CPU capacity, current operating frequency, power consumption, percentage of CPU utilization, number of active VMs, state (on/off) about all the PMs are stored in the HostQ.
  • Target VM Queue (TargetVMQ): TargetVMQ contains VM details about the server assigned, the percentage of CPU time utilized by the VM, submission time, placement time, remaining execution time, power consumption.
  • Management Node: The allocation and reallocation management (ARM) algorithm is a daemon executed in the management node. It activates the scheduling algorithm for VM to PM mapping, resource deallocation algorithm for resource recovery and task distribution algorithm for VM reallocation at specific intervals. It updates TargetVMQ, HostQ and ReqQ.
  • Physical Machine Manager (PMM): PMM is a daemon that is executed on each physical machine. It monitors and records the machines functional parameters. It is responsible for updating the HostQ repository with server details.
  • Virtual Machine Manager (VMM): VMM is a daemon that is executed on each VM. It is responsible for updating the TargetVMQ with VM functional parameter details.

4. Evaluation of Algorithms

The primary objective of this research work is to propose a PA algorithm and AHSA for VM placement and to obtain an overall power reduction in the servers with the required quality of service.

4.1. ARM-Algorithm

The high-level structural design of the ARM algorithm which is executed in the management node is given in Algorithm 1. This algorithm is partitioned into three sections. Section 1: Lines 2–4 perform VM to PM mapping using the scheduling algorithm; Section 2: Lines 5–6 Perform resource deallocation for every interval, starting from minimum execution time (Min-exe-time). Section 3: Lines 7–9 perform task distribution at regular migration intervals.
Algorithm 1: High-level overview of ARM algorithm approach
Input: Hostlist, VMinstancelist
Output: TargetVMQ
1For each interval do
2ReqQ ← Get VMs from VMinstancelist;
3HostQ ← Get hosts from HostList;
4TargetVMQ ← Call scheduling algorithm (in Section 4.2, Section 4.3, Section 4.4 and Section 4.5);
5If interval > min-exe-time then
6Completedlist ← Get VMs with active time completion from TargetVMQ;
7For VM in Completedlist do
8 Deallocate resources associated with the VM;
9If interval == Mig-interval, then
10TargetVMQ ← Call task distribution algorithm (TDA);
11Return TargetVMQ.

4.2. Proposed Power-Aware Algorithm (PA)

Algorithm 2 presents the pseudo code for the PA algorithm. In the proposed PA algorithm, the VM is allocated to the server, which showcases the minimum increase in the overall power consumption. The main highlight of the proposed PA algorithm is the inclusion of the outgoing tasks’ minimum remaining execution time to predict the dynamic power in host selection (Line 13–23). Algorithm 2 receives host capacity and the VM’s resource request through HostQ and ReqQ. The feasible hosts (with maximum utilization) for VM placements are identified as SelectedHost and the difference in dynamic power before and after VM placement is calculated in Line 8 of Algorithm 2. The power consumption P2 is not constant throughout the execution of the VM, as it depends on the next incoming and outgoing task of the machine to which it is allocated. The decision is performed based on the new VM execution time and the next outgoing task’s remaining execution time, as explained in Lines 13–23 of Algorithm 2.

Complexity Analysis

The time complexity of the algorithm can be analyzed by considering ‘n’ VM requests in ReqQ and ‘m’ number of hosts in HostQ. Lines 3–4 need to execute O(n) times. Lines 1–24 need to execute O(m) times. The sort functions in Line13 and 20 need to execute O(m log(m)). The complexity of the algorithm is conquered by the number of VM requests n, sort operation and the number of host m. The complexity of the algorithm is estimated as O(nmlog(m)).
Algorithm 2: Power-Aware algorithm (PA)
Applsci 10 02323 i001

4.3. FFD Algorithm

In first fit decreasing (FFD), the VM selection is based on the first-fit strategy of the VMs ordered in non-increasing order of CPU utilization and first-fit heuristics are used for host selection. FFD has O(nm) complexity.

4.4. BFD Algorithm

In best fit decreasing (BFD), the host selection is based on the first-fit strategy of the PMs in non-decreasing order of CPU capacity and first-fit heuristics is used for VM selection.

4.5. Adaptive Harmony Search Algorithm

The HSA algorithm is derived from the imitation of musical performance in a search for better harmony. The harmony of any musical instruments is a combination of different sound waves depicting the relationship between them. The HSA performs a stochastic search based on the harmony memory consideration rate and pitch adjustment rate [43]. The HSA was used on continuous variables to obtain an optimum design plane in [44]. HSA optimization parameters have been modified and improved from different viewpoints to suit its applicability in the decision-making process for different problems [45]. Many studies on discrete and continuous problems found a slow convergence on the application of basic HSA for more decision variables due to constant HMCR (harmony memory consideration rate) and PAR (pitch adjustment rate). The AHSA avoids constant values for HMCR and PAR, and dynamically modifies it in the optimization process. Taking advantage of AHSA in this work, we have dynamically changed the HMCR and PAR based on the problem search space. The typical HMCR and PAR values lie in the range 0–1 [18].

4.5.1. Initialization

In this work, the number of discrete decision variables is the number (N) of requests in the ReqQ {V1, V2, V3, …, VN}. The set of available discrete values (D) for each Vi is initialized, D ∈ {id1, id2, … idM}, where M is the number of machines and id represents the machine identifier. The initial structure of the harmony memory vector is randomly generated and sorted based on objective function values as
H M V = [ v 1 1 , v 2 1 , v 3 1 v N 1 o b j 1 v 1 2 , v 2 2 , v 3 2 v N 2 o b j 2 v 1 s , v 2 s , v 3 s v N s o b j s ] .
where, v1ivNi represents the ith vector of N decision variables. obji represents the obtained objective function based on Equation (8). The number of rows in harmony memory vector (HMV) is represented as s, which is the HMV-size and N represents the number of requests in ReqQ. The HSA parameters are to be initialized for HMV-size, and maximum iterations and bandwidth.

4.5.2. Improvisation of HMV

In this work, the size of the decision variable, i.e., the number of requests in ReqQ, varies in each iteration. The HMCR and PAR values are dynamically identified prior to the improvisation process in each interval based on the available PMs, as in Table 1.
The HMCR value controls the rate of choosing a value from HMV. The rate of choosing a random value from the HMV is 1-HMCR, presented as:
If (rand1() < HMCR), then
New-assignVMi = Oldi
Else
New-assignVMi = New-assign-VMi’
Endif
where Oldi represents a set of { v 1 i , v 2 i , v 3 i v N i o b j i } in HMV. New-assign-VMi’ represents a new set of assignments of { v 1 i , v 2 i , v 3 i v N i } to obtain a new objective n e w _ o b j i . rand1() is the uniformly generated random number between 0 to 1. With an HMCR value of 0.75, the probability of choosing from HMV is 75% and the probability for the new assignment is 25%. The new assignment generated with 25% probability is updated in HMV if the new objective function value is better than the worst objective function value in HMV. With 75% probability, all the decision variables of randomly chosen ith HMV are pitch-adjusted based on BW. With PAR assumed to be 0.10, and if the uniform random number generated is less than PAR, it means the probability of choosing the value from the neighboring values to the right and left of the chosen value is 10% × HMCR probability. The rate of doing nothing is (1-PAR).
The pitch adjustment on the discrete variable is performed as
If (rand1() < PAR), then
New-assignVMi’ = New-assignVMi ± BW
Endif

4.5.3. The Measure of Fitness and HMV update

The new harmony generated in step 2 is checked for feasibility using the constraints given in Equations (9)–(13). If the new harmony found is better than the worst harmony in the HMV, the worst harmony is updated. The HMV is sorted based on objective value. In this work, the non-deterministic nature of the problem may lead to non-convergence of the results, aiming for a high SLA and global optima. The optimal solution may not happen to take into account all the decision variables to satisfy the constraints in higher intervals. In that case, the decision variables are reduced one by one after considering the number of attempts made towards an impossible solution.
Figure 2 displays the AHSA design procedure used to solve the power optimization problem described in Section 4.5.1, Section 4.5.2 and Section 4.5.3. In Figure 2, NHMV(Vi)represents the new harmony memory value of the ith decision variable, r-ind represents the random row index chosen for improving the ith decision variable, and PM-id is the set of physical machine identifiers in which the VM is to be placed.

4.5.4. High-Level Overview of AHSA

Algorithm 3 presents the top-level view of the AHSA approach. Considering there are NVM requests to be placed in M PMs, then at the beginning of each interval, the AHSA is activated.
Algorithm 3: High-level overview of AHSA
Input: HostQ, ReqQ
Output: TargetVMQ
For each interval do
  (TargetplanVMQ), ← Call Algorithm 4 with (HostQ, ReqQ);
  TargetVMQ ← Actual allocation of VM to HostQ as per TargetplanVMQ;
Return TargetVMQ
Algorithm 4 presents the AHSA for optimal host identification. In Algorithm 4, Line 2 generates an initial HMV population vector. The feasible host of the VM is computed using Equation (1). After the initial population generation, exploration is done from lines 15–21, and the exploitation of existing search space is done from lines 6–14 by using Equation (15). The new vector is generated by identifying the next feasible host. If the new vector yields a better objective, it is updated in HMV in Line 11 and 17. The procedure is detailed in Section 4.5.
Algorithm 4: AHSA proposed for power optimization
Input: HostQ, ReqQ
Output: TargetplanVMQ
1HMV-size = N × M as in Table 1.
2HMV ← Call Algorithm 5;
3For each iteration to Max-iteration do
4 Choose HMCR based on Table 1
5 If rand( ) < HMCR then
6   Choose PAR based on Table 1
7  If rand( ) < PAR then
8    i ← randomly chosen row index of HMV;
9    New-assignVM i’New-assignVM i ± BW using Equations (8) and (15);
10  New-obj1’← Objective function value obtained for New-assignVMi’ using Equation(8);
11    if New obji < HMV [1].obj1’ then
12     H MV[1] · obj1 ← new-obji’;
13     H MV[1] 1 ← New-assignVMi’;
14 else
15  set HMS Size to 1 × M
16  New-assignVM i ← Call Algorithm 5;
17  If New_obj1’ < HMV [1].obj1 then
18   H MV [1] · obj1New_obj1;
19   H MV [1]1New-assignVMI’;
20Sort the HMV in non-increasing order based on HMV · obj;
21TargetplanVMQHMV[Last];
22Return TargetplanVMQ
Algorithm 5: AHSA—Initial population generation
Input: HostQ, ReqQ, HMS-size
Output: HMV
1For each hm in HMS-Size do
2[host-id] ← Random selections of discrete values from a set of possible values for ReqQ;
3 If feasible [host-id] based on Equations (1), (9)–(11)
4  HMV [hm].add[host-id];
5  HMV [hm] · obj ← Objective function value corresponding to the HMV using Equation (8);
6 else
7  Go to line 2;
8Sort the HMV in non-increasing order based on HMV · obj;
9Return HMV

5. Task Distribution Strategy

In the distribution process, a VM of the same type is created in the destination host while the same type is under execution in the source host. After the complete migration of the tasks from the source to the destination, the source VM resources are released. The number of migration and migration time of the VM chosen for migration has to be reduced, as it involves energy overhead, as the VM to be migrated kept executing at both the machines, and there is a possibility of performance degradation due to migration time. Half of the total available bandwidth is used for migration. The migration time involves the communication overhead drawn in by the memory reserved by the VM.

5.1. Overload Server Detection Methods

Two adaptive thresh hold methods of overload detection are used. A robust statistic is a needed alternative to standard classical methods [46].

5.1.1. Median Absolute Deviation

Median Absolute Deviation (MAD) is a statistical measure that is more flexible than the sample variance and standard deviation in handling outliers in the sample data. The utilization threshold is determined as
UTH = 1 − x.MAD
where x ∈ R+ that decides the persuasive nature of consolidation.

5.1.2. Inter Quartile Range

Inter Quartile Range (IQR) measures the dataset’s statistic dispersion based on third and first quartiles. The quartiles’ breakdown point encloses 25%. The utilization threshold is determined as
UTH = 1 − x.IQR
where x ∈ R+ that decides the persuasive nature of consolidation.

5.1.3. Static Threshold

In this work, we assume that, to balance the load in all the machines with 65% utilization, the static threshold is assumed as 65 %.

5.2. Virtual Machine Selection Methods

The virtual machine selection for migration is performed using the following two methods.

5.2.1. Minimum Migration Method

VM with higher CPU utilization is considered for migration. It selects the minimum number of VMs to be migrated. Let Vi be the set of VMs running in ith PM, and Ui is the overall utilization of the set greater than the threshold (UTH), and let P(Vi) be the power set of Vi, then minimum migration method (MMM) finds a subset ϵ P(Vi)using
S ϵ P ( V i ) , U i v i ϵ S U ( v i ) < t h r e s h o l d
where, U ( v i ) is the utilization of a VM v i . The v i ϵ S chosen for migration is subject to the following constraint. v i should satisfy both Condition 1 and Condition 2 to maintain the utilization of PM close below the threshold (UTH).
Condition 1: The utilization of U ( v i ) should be higher than |Ui −UTH|;
Condition 2: If condition 1(Con1) is true, then the new utilization | ( U i U ( v i ) ) U T H | should be minimal among the other VMs running in ith PM.

5.2.2. Maximum Migration with Least Resource Request

The VM with the minimum migration time and a remaining execution time greater than the migration time is considered for migration.
The half of the total available bandwidth (bw) is used for migration. The migration time involves the communication overhead drawn in by the memory reserved by the VM. The communication over head is calculated as
Mbw = bw/2, MT = (Mem-size/Mbw)
where migration bandwidth (Mbw) and migration time (MT) depends on the memory size (Mem-size) of the VM to be migrated.

5.3. Task Distribution Algorithm

The task distribution presented in Algorithm 6 is activated at regular intervals. The SourceHost is the host from HostQ with a power consumption higher than the threshold and DestHost are the hosts from HostQ with a power consumption less than the threshold. The VMs are selected from the Sourcehost based on any one of the VM selection methods and the destination host is identified by considering the power consumption constraint in Line 13. The algorithm complexity for m number of hosts and t number of tasks considered for migration is (O(mtm) + O(mlog(m)). The final complexity of the algorithm is O(m2t).

6. Experimental Evaluation

Considering the expense and time incurred in the evaluation of large-scale experiments in real-time, Matlab is used to simulate the environment. Each reservation cycle is assumed to have a duration of 300 s (rc = 300 s). An input request is accepted at the beginning of each reservation cycle.
The VM’s resource requirements are assumed constant throughout the interval. A single datacenter with heterogeneous systems capable of provisioning multiple VMs is considered. As the size of the requested virtual resource is not known, with no limitation for VM request, only the active state execution time of the VM is considered. As the CPU is considered to consume a significant fraction of energy, the tasks are considered CPU-intensive. In this work, CPU utilization and power consumption are considered linearly proportional. All the machines are assumed idle when not in use consuming static power. The datacenter assumed to be powered only by grid energy source. The peak IT load (only server) power estimation of a datacenter is estimated ≈ as 44 kW for the physical machine specification given in Table 2 [47]. A datacenter is assumed to have a floor space of ≈ 500 square feet. Total electricity power requirement is calculated as ≈136.8 kW (including cooling load, lighting and others). The CPU power consumption of all the servers should not exceed 23kW [48].
Algorithm 6: Proposed task distribution algorithm (TDA)
Applsci 10 02323 i002

6.1. Physical Machine and VM Reservation Modeling

Table 2 and Table 3 represent the model of physical machines with real power consumption and the configurations of heterogeneous systems. This is taken from the Standard Performance Evaluation Corporation (SPEC) power benchmark [47], which is considered for simulation. A small-scale datacenter with 50 systems is considered for algorithm evaluation. The VM characteristics given in Table 4 are used to model the virtual machine reservations. It is based on Amazon EC2 compute unit (ECU) inspiration but customized according to physical machine characteristics to avoid the fragmentation of resources. Normally, the storage and network requested by the VM are not confined to the physical machine in which it is placed. Therefore, the storage and network bandwidth do not influence the placement of VM on a particular PM. The actual location of data storage is decided by the provider in a timely manner. In this real scenario, a feasibility check involves placing VM on a particular PM, mainly based on the availability of memory and the CPU clock cycle which has a strong bond with each other in computing node. The arrival time of VM is modeled using Poisson distribution. Lambda is determined by the average number of requests submitted in a reservation cycle. Uniform distribution in the interval (τmin, τmax) is used to model the execution time (τ) of the VM, where τmin and τmax are the minimum and maximum execution times (VM’s reservation cycles) of 10 and 60, respectively.

6.2. Evaluation Metrics and Baseline Approaches

The adaptive harmony search algorithm and power-aware algorithm are compared with first-fit decreasing and best fit decreasing. To show the effectiveness of the approaches, the following metrics are considered.

6.2.1. Overall Power Consumption

Considering overall power consumption as an essential energy efficiency metric to reduce grid energy consumption, the total power consumed by the servers for the accepted VM request is formulated in Equation (7).

6.2.2. The Ratio of VM Acceptance

This is considered as a service level agreement metric. The ratio equals the total number of VM requests accepted pertaining to overall request submitted.

6.3. Evaluation of the Proposed Approach without VM Distribution

6.3.1. The Scenario I: Mapping of Heterogeneous VM Types to Heterogeneous Machines without Distribution Policy

The mapping of VMs to PMs is modeled as a variable size bin-packing problem. For Scenario I, Figure 3 depicts the variation in number of VM requests and CPU demand in the workload. The VM types given in Table 4 are mapped to the machines given in Table 2. Figure 4 displays the RVA% of AHSA, PA, FFD and BFD approaches for 24-h duration. Figure 4 reveals 1–2% increase in RVA% by AHSA than PA, and 3–13% for FFD and BFD. Figure 5 presents the RVA% for the first 12 reservation cycles. The CPU utilization for the first five reservation cycles with 100% RVA for all approaches is 19.75%, 38.74%, 52.12%, 67.35% and 78.25%. The AHSA achieved an overall power reduction (24-h duration) of 2.18% more than FFD, 1.481% more than PA, and 2.24% more than BFD, as shown in Figure 6. Figure 7 presents the power consumption for the acceptance rate indicated in Figure 5. As in Figure 7, the power reduction for 100% acceptance of AHSA with respect to the first four intervals is 1.05% less than PA, 1.78% less than FFD and 1.86% less than BFD.

6.3.2. Scenario II: Mapping of Heterogeneous VM types to Homogeneous Machines without Distribution Policy

In Scenario II, the total number of 50 M4 machines, as in Table 2, is considered for mapping the VM types given in Table 4, which portrays a fixed size bin-packing problem. The RVA% for the 24-h duration is shown in Figure 8. It can be inferred from Figure 8 that the AHSA has obtained 1–4% more RVA% than PA, and approximately 5–22% more than FFD and BFD.
Figure 9 presents the overall power consumption of all the methods for a day. The overall power reduction achieved by AHSA is approximately 1.75% more than PA, BFD and FFD. In Figure 10, the first 14 reservation cycles depict 100% acceptance of all the algorithms, which can be used as a fair measure for comparison of power for the same utilization. AHSA provides approximately 7% more overall power reduction in the first 14 cycles than BFD and FFD, and approximately 1% more than PA for the same utilization.

6.4. Evaluation of the Proposed Approach with VM Distribution

Simulation reservation cycles are grouped into three categories, namely RAC, RBC and RMC, to evaluate the effectiveness of migration. For every eight RAC, three RBC are allowed to create a demand for migration, followed by one RMC. Figure 11 presents the CPU demand considered for VM distribution with all reservation cycle categories.

Scenario III: Mapping of heterogeneous VM types to heterogeneous machines with different distribution policies

In Scenario III, the overload host selection is based on MAD, IQR and static threshold (ST). Similarly, VM selection is based on MMM and maximum migration with least resource request (MML) policy for task distribution. Figure 12a–c presents the number of migrations, RVA% and power consumption of different combinations of host and VM selection policies. Figure 12a–c concludes that IQR-MML has an average of 1% increase in acceptance rate and considerable increase in power reduction than other approaches. IQR-MML based host and VM selection policy has resulted in a power reduction of 0.1–0.4% more than ST-MMM, 0.2–0.5% more than IQR-MMM, 0.3–0.4% more than MAD-MMM, 0.2–0.4% more than MAD-MML, and 0.1–0.4 %more than ST-MML. The placement of VMs without task distribution policy has resulted in increased an power consumption of 0.13% in AHSA, 0.49% in PA, 0.44% in FFD, and 0.38% in BFD than IQR-MML.
In this work, non-parametric Mann–Whitney U/Wilcoxon rank-sum test is used to check whether there is a significant difference in the results obtained. Figure 13 demonstrates the power consumed by different types of VM-placement approaches. After running the test on two samples, AHSA with FFD, AHSA with BFD, PA with FFD, PA with BFD, the p value is less than 0.0001, and therefore it can be concluded that AHSA- and PA-based allocation has a significant difference with other approaches towards energy consumption. Figure 14 demonstrates the power consumed by different types of load balancing approaches. IQR-based host selection and MML-based VM selection have a minimum power consumption compared to methods. The FFD approach has more power consumption in all distribution policy and VM selection approaches. MMM-based VM selection has more power consumption irrespective of host selection, due to migration of more VMs. The MML-based VM selection works better with IQR than in ST- and MAD-based host selection.

7. Conclusions

This research work proposed two approaches, AHSA and PA, to decrease the power consumption of servers in the datacenters. Further, the proposed task distribution approach for load-balancing among the server facilitates maintaining the maximum number of active servers with the lowest attainable server frequency. The overload host detection was based on MAD, IQR and ST. The virtual machine selection for migration was based on MMM and MML. The mapping of VMs to both homogeneous and heterogeneous machines with and without task distribution is analyzed in terms of power reduction and RVA metric. The simultaneous placement of VMs using the AHSA optimization approach yields a better RVA metric with improved power reduction compared to the proposed sequential-based PA allocation and its counterparts FFD and BFD. The simulation results conclude that AHSA-based allocation with IQR-MML migration policy for load balancing provides a better loss reduction for heterogeneous systems with different power models.

Author Contributions

Conceptualization, T.R. and K.M.; Methodology, T.R. and K.M.; Writing—Original Draft Preparation, T.R. and K.M.; Supervision, K.G., Z.W.G.; Writing—Review and Editing, K.G., Z.W.G.; Funding, Z.W.G. All authors have read and agreed to the published version of the manuscript.

Funding

This research was supported by the Energy Cloud R&D Program through the National Research Foundation of Korea (NRF) funded by the Ministry of Science, ICT (2019M3F2A1073164).

Conflicts of Interest

The authors declare no conflict of interest

Abbreviations

AHSAAdaptive Harmony Search Algorithm
ARMAllocation and Reallocation Management algorithm
BFDBest-Fit Decreasing algorithm
FFDFirst Fit Decreasing algorithm
HMCRHarmony Memory Consideration Rate
HMVHarmony Memory Vector
HSAHarmony Search Algorithm
IQRInter Quartile Range
IQR-MMLIQR host selection and MML VM selection policy
IQR-MMMIQR host selection and MMM VM selection policy
MADMedian Absolute Deviation
MAD-MMLMAD host selection and MML VM selection policy
MAD-MMMMAD host selection and MMM VM selection policy
MMLMaximum Migration with Least resource request
MMMMinimum Migration Method
PAPower-Aware algorithm
PARPitch Adjustment Rate
PMPhysical Machine
STStatic Threshold
ST-MMLST host selection and MML VM selection policy
ST-MMMST host selection and MMM VM selection policy
RACRequest Accept Cycles
RBCRequest Block Cycles
RMCRequest Migration Cycles
RVARatio of VM Acceptance
VMVirtual Machine
VMQVirtual Machine Queue

References

  1. Foster, I.; Zhao, Z.; Raicu, I.; Lu, S. Cloud Computing and Grid Computing 360-Degree Compared; Grid Computing Environments Workshop: Austin, TX, USA, 2008. [Google Scholar] [CrossRef] [Green Version]
  2. Hamilton, J. Overall Data Center Costs. Available online: https://perspectives.mvdirona.com/2010/09/overall-data-center-costs/ (accessed on 9 December 2019).
  3. Heyd, E. America’s Data Centers Consuming Massive and Growing Amounts of Electricity. 2014. Available online: https://www.nrdc.org/media/2014/140826/ (accessed on 9 December 2019).
  4. Beloglazov, A.; Buyya, R.; Lee, Y.C.; Zomaya, A. A taxonomy and survey of energy-efficient data centers and cloud computing systems. Adv. Comput. 2011, 82, 47–111. [Google Scholar] [CrossRef] [Green Version]
  5. Koomey, J. Growth in Data Center Electricity Use 2005 to 2010. A Report by Analytical Press, Completed at the Request of The New York Times. 2011. Available online: https://alejandrobarros.com/wp-content/uploads/old/Growth_in_Data_Center_Electricity_use_2005_to_2010.pdf (accessed on 9 December 2019).
  6. Joukov, N.; Shorokhov, V. Hunt for unused servers. In Proceedings of the USENIX Workshop on Cool Topics on Sustainable Data Centers (CoolDC 16), Santa Clara, CA, USA, 19 March 2016. [Google Scholar]
  7. Buyya, R.; Beloglazov, A.; Abawajy, J. Energy-efficient management of data center resources for cloud computing: A vision, architectural elements, and open challenges. In Proceedings of the 2010 International Conference on Parallel and Distributed Processing Techniques and Applications (PDPTA 2010), Las Vegas, NV, USA, 12–15 July 2010. [Google Scholar]
  8. Jin, Y.; Wen, Y.; Chen, Q.; Zhu, Z. An empirical investigation of the impact of server virtualization on energy efficiency for green data center. Comput. J. 2013, 56, 977–990. [Google Scholar] [CrossRef]
  9. Lu, Z.; Takashige, S.; Sugita, Y.; Morimura, T.; Kudo, Y. An analysis and comparison of cloud data center energy efficient resource management technology. Int. J. Serv. Comput. 2014, 2, 32–51. [Google Scholar] [CrossRef]
  10. Panneerselvam, J.; Liu, L.; Hardy, J.; Antonopoulos, N. Analysis, Modelling and Characterisation of Zombie Servers in Large-Scale Cloud Datacentres. IEEE Access. 2017, 5, 15040–15054. [Google Scholar] [CrossRef]
  11. Tseng, F.H.; Wang, X.; Chou, L.D.; Chao, H.C.; Leung, V.C. Dynamic resource prediction and allocation for cloud data center using the multiobjective genetic algorithm. IEEE Syst. J. 2017, 12, 1688–1699. [Google Scholar] [CrossRef]
  12. Gao, Y.; Guan, H.; Qi, Z.; Hou, Y.; Liu, L. A multi-objective ant colony system algorithm for virtual machine placement in cloud computing. J. Comput. Syst. Sci. 2013, 79, 1230–1242. [Google Scholar] [CrossRef]
  13. Tavana, M.; Shahdi-Pashaki, S.; Teymourian, E.; Santos-Arteaga, F.J.; Komaki, M. A discrete cuckoo optimization algorithm for consolidation in cloud computing. Comput. Ind. Eng. 2018, 115, 495–511. [Google Scholar] [CrossRef]
  14. Wang, S.; Zhou, A.; Hsu, C.H.; Xiao, X.; Yang, F. Provision of data-intensive services through energy-and qos-aware virtual machine placement in national cloud data centers. IEEE Trans. Emerg. Top. Comput. 2015, 4, 290–300. [Google Scholar] [CrossRef]
  15. Srichandan, S.; Kumar, T.A.; Bibhudatta, S. Task scheduling for cloud computing using multi-objective hybrid bacteria foraging algorithm. Future Comput. Inform. J. 2018, 3, 210–230. [Google Scholar] [CrossRef]
  16. Singh, S.; Kalra, M. Scheduling of independent tasks in cloud computing using modified genetic algorithm. In Proceedings of the 2014 International Conference on Computational Intelligence and Communication Networks, Bhopal, India, 14–16 November 2014; pp. 565–569. [Google Scholar] [CrossRef]
  17. Alharbi, F.; Tian, Y.C.; Tang, M.; Zhang, W.Z.; Peng, C.; Fei, M. An ant colony system for energy-efficient dynamic virtual machine placement in data centers. Expert Syst. Appl. 2019, 120, 228–238. [Google Scholar] [CrossRef]
  18. Geem, Z.W.; Kim, J.H.; Loganathan, G.V. A new heuristic optimization algorithm: Harmony search. Simulation 2001, 76, 60–68. [Google Scholar] [CrossRef]
  19. Fathi, M.H.; Khanli, L.M. Consolidating VMs in Green Cloud Computing Using Harmony Search Algorithm. In Proceedings of the 2018 International Conference on Internet and e-Business, Singapore, 25–27 April 2018; pp. 146–151. [Google Scholar] [CrossRef]
  20. Farahnakian, F.; Ashraf, A.; Pahikkala, T.; Liljeberg, P.; Plosila, J.; Porres, I.; Tenhunen, H. Using ant colony system to consolidate VMs for green cloud computing. IEEE Trans. Serv. Comput. 2014, 8, 187–198. [Google Scholar] [CrossRef]
  21. Dashti, S.E.; Rahmani, A.M. Dynamic VMs placement for energy efficiency by PSO in cloud computing. J. Exp. Theor. Artif. Intell. 2016, 28, 97–112. [Google Scholar] [CrossRef]
  22. Wolpert, D.H.; Macready, W.G. No free lunch theorems for optimization. IEEE Trans. Evol. Comput. 1997, 1, 67–82. [Google Scholar] [CrossRef] [Green Version]
  23. Saka, M.P.; Hasançebi, O.Ğ.; Geem, Z.W. Metaheuristics in structural optimization and discussions on harmony search algorithm. Swarm Evol. Comput. 2016, 28, 88–97. [Google Scholar] [CrossRef]
  24. Muthukumar, K.; Jayalalitha, S. Optimal placement and sizing of distributed generators and shunt capacitors for power loss minimization in radial distribution networks using a hybrid heuristic search optimization technique. Int. J. Electr. Power Energy Syst. 2016, 78, 299–319. [Google Scholar] [CrossRef]
  25. Siddique, N.; Adeli, H. Applications of harmony search algorithms in engineering. Int. J. Artif. Intell. Tools 2015, 24, 1530002. [Google Scholar] [CrossRef]
  26. Geem, Z.W. Harmony search in water pump switching problem. In Proceedings of the International Conference on Natural Computation, Berlin/Heidelberg, Germany, 27–29 August 2005; pp. 751–760. [Google Scholar] [CrossRef]
  27. Geem, Z.W. Harmony search optimisation to the pump-included water distribution network design. Civ. Eng. Environ. Syst. 2009, 26, 211–221. [Google Scholar] [CrossRef]
  28. Nazari-Heris, M.; Mohammadi-Ivatloo, B.; Asadi, S.; Geem, Z.W. Large-scale combined heat and power economic dispatch using a novel multi-player harmony search method. Appl. Therm. Eng. 2019, 154, 493–504. [Google Scholar] [CrossRef]
  29. Geem, Z.W.; Yoon, Y. Harmony search optimization of renewable energy charging with energy storage system. Int. J. Electr. Power Energy Syst. 2017, 86, 120–126. [Google Scholar] [CrossRef]
  30. Fesanghary, M.; Asadi, S.; Geem, Z.W. Design of low-emission and energy-efficient residential buildings using a multi-objective optimization algorithm. Build. Environ. 2012, 49, 245–250. [Google Scholar] [CrossRef]
  31. Salcedo-Sanz, S.; Pastor-Sánchez, A.; Del Ser, J.; Prieto, L.; Geem, Z.W. A coral reefs optimization algorithm with harmony search operators for accurate wind speed prediction. Renew. Energy 2015, 75, 93–101. [Google Scholar] [CrossRef]
  32. Sadollah, A.; Nasir, M.; Geem, Z.W. Sustainability and Optimization: From Conceptual Fundamentals to Applications. Sustainability 2020, 12, 2027. [Google Scholar] [CrossRef] [Green Version]
  33. Alsharif, M.H.; Yahya, K.; Geem, Z.W. Strategic Market Growth and Policy Recommendations for Sustainable Solar Energy Deployment in South Korea. J. Electr. Eng. Technol. 2019, 1–13. [Google Scholar] [CrossRef]
  34. Dong, Z.; Zhuang, W.; Rojas-Cessa, R. Energy-aware scheduling schemes for cloud data centers on google trace data. In Proceedings of the IEEE Online Conference on Green Communications, Tucson, AZ, USA, 12–14 November 2014. [Google Scholar] [CrossRef]
  35. Calheiros, R.N.; Buyya, R. Energy-efficient scheduling of urgent bag-of-tasks applications in clouds through DVFS. In Proceedings of the IEEE 6th international conference on cloud computing technology and science, Singapore, 15–18 December 2014. [Google Scholar] [CrossRef] [Green Version]
  36. Mekala, M.S.; Viswanathan, P. Energy-efficient virtual machine selection based on resource ranking and utilization factor approach in cloud computing for IoT. Comput. Electr. Eng. 2019, 73, 227–244. [Google Scholar] [CrossRef]
  37. Wang, X.; Du, Z.; Chen, Y.; Yang, M. A green-aware virtual machine migration strategy for sustainable datacenter powered by renewable energy. Simul. Model. Pract. Theory 2015, 58, 3–14. [Google Scholar] [CrossRef]
  38. Teylo, L.; de Paula, U.; Frota, Y.; de Oliveira, D.; Drummond, L.M. A hybrid evolutionary algorithm for task scheduling and data assignment of data-intensive scientific workflows on clouds. Future Gener. Comput. Syst. 2017, 76, 1–17. [Google Scholar] [CrossRef]
  39. Shabeera, T.P.; Kumar, S.M.; Salam, S.M.; Krishnan, K.M. Optimizing VM allocation and data placement for data-intensive applications in cloud using ACO metaheuristic algorithm. Eng. Sci. Technol. Int. J. 2017, 20, 616–628. [Google Scholar] [CrossRef] [Green Version]
  40. Satpathy, A.; Addya, S.K.; Turuk, A.K.; Majhi, B.; Sahoo, G. Crow search based virtual machine placement strategy in cloud data centers with live migration. Comput. Electr. Eng. 2018, 69, 334–350. [Google Scholar] [CrossRef]
  41. Kesavaraja, D.; Shenbagavalli, A. QoE enhancement in cloud virtual machine allocation using Eagle strategy of hybrid krill herd optimization. J. Parallel Distrib. Comput. 2018, 118, 267–279. [Google Scholar] [CrossRef]
  42. Zhang, X.; Wu, T.; Chen, M.; Wei, T.; Zhou, J.; Hu, S.; Buyya, R. Energy-aware virtual machine allocation for cloud with resource reservation. J. Syst. Softw. 2019, 147, 147–161. [Google Scholar] [CrossRef]
  43. Geem, Z.W. Novel derivative of the harmony search algorithm for discrete design variables. Appl. Math. Comput. 2008, 199, 223–230. [Google Scholar] [CrossRef]
  44. Lee, K.S.; Geem, Z.W. A new structural optimization method based on harmony search algorithm. Comput. Struct. 2004, 82, 781–798. [Google Scholar] [CrossRef]
  45. Nazari-Heris, M.; Mohammadi-Ivatloo, B.; Asadi, S.; Kim, J.H.; Geem, Z.W. Harmony search algorithm for energy system applications: An updated review and analysis. J. Exp. Theor. Artif. Intell. 2019, 31, 723–749. [Google Scholar] [CrossRef]
  46. Huber, P.J.; Ronchetti, E. MyiLibrary. Robust Statistics; Wiley Online Library Hoboken: Hoboken, NJ, USA, 1981. [Google Scholar]
  47. Standard Performance Evaluation Corporation. SPECpower2008. Available online: http://www.spec.org/power_ssj2008 (accessed on 9 December 2019).
  48. Sawyer, R. Calculating Total Power Requirements for Data Centers. White Paper, American Power Conversion. 2004. Available online: http://accessdc.net/Download/Access_PDFs/pdf1/Calculating%20Total%20Power%20Requirements%20for%20Data%20Centers.pdf (accessed on 9 December 2019).
Figure 1. System Model.
Applsci 10 02323 g001
Figure 2. AHSA based power optimization procedure.
Applsci 10 02323 g002
Figure 3. Processor demand without migration.
Applsci 10 02323 g003
Figure 4. Ratio of virtual machine acceptance percentage (RVA%)—Scenario I.
Applsci 10 02323 g004
Figure 5. RVA% Scenario I within an hour.
Applsci 10 02323 g005
Figure 6. Power consumption Scenario I.
Applsci 10 02323 g006
Figure 7. Power consumption Scenario I within an hour.
Applsci 10 02323 g007
Figure 8. RVA metric of scenario II for a day.
Applsci 10 02323 g008
Figure 9. Power consumptions of scenario II for a day.
Applsci 10 02323 g009
Figure 10. CPU utilization of scenario II for 100% RVA for first 14 cycles.
Applsci 10 02323 g010
Figure 11. Generated processor demand with request migration cycles.
Applsci 10 02323 g011
Figure 12. Impact of migration (a) Number of migrations (b) RVA% (c) Power consumption.
Applsci 10 02323 g012aApplsci 10 02323 g012b
Figure 13. Power consumption.
Applsci 10 02323 g013
Figure 14. Power consumption with load balancing approaches.
Applsci 10 02323 g014
Table 1. Adaptive harmony search algorithm dynamic parameter values.
ParameterValue
Max-Iteration5000
Dynamic-HMV-size10 × N(Number of requests in ReqQ)
Dynamic-HMCR Max (0.8, (1 − (Total PMs with full utilization/Total number of PMs)))
Dynamic-PARMin (0.35, (1/Total PMs with full utilization))
Bandwidth (BW)1
Table 2. Physical machine characteristics.
MachinesFrequency(MHz)No of cores Power modelMemory(GB)
M12500561192
M2220016224
M3220016324
M425001124384
M52200645128
M6230036664
Table 3. Power (in Watts) setting of physical machines (PMs).
Power ModelIdle10%20%30%40%50%60%70%80%90%100%
148.2106129154179205235269306347385
269.4103117137159182201218240290315
359.587.698.5109120136153177204233261
489.8237286333383442511592710839939
584.9138154168182197214234253271287
647.392.3108123138153172199230260289
Table 4. Virtual machine request types.
NameECUSpeed (GHz)Memory (MB)
M11.small111740
M1.large247680
M1.xlarge4815,360
M2.xlarge26.517,510
M22.xlarge41335,020
C1.median251740

