Article

Safety Lighting Sensor Robots Communicate in the Middle of the Highway/Roads †

1
Graduate School of Convergence Science and Technology/Dept. of Earth Science Education, College of Education, Seoul National University, Seoul 08826, Korea
2
Division of Design, Incheon National University, Incheon 02447, Korea
3
Language Technologies Institute, Carnegie Mellon University, Pittsburgh, PA 15213, USA
4
Department of Business Administration, Korea Polytechnic University, Siheung 15073, Korea
5
National Institute of Horticultural and Herbal Science, Wanju 55365, Korea
6
Department of Visual Information Design, Kyunghee University, Yong-in 17104, Korea
7
Midea Group Laundry Appliances Business Division, Wuxi 214028, China
8
College of Fine Arts, Hongik University, Seoul 04066, Korea
9
Department of Computer Science, Korea National Open University, Seoul 03087, Korea
10
Dept. of Earth Science Education, School of Education, Seoul National University, Seoul 08826, Korea
11
Department of Craft and Design, Intermedia Lab, Seoul National University, Seoul 08826, Korea
*
Authors to whom correspondence should be addressed.
This paper is an extended version of our paper published in “Prevention through Design-Based on Safety Lighting for Perception on Highway Repairing Area Scenario” presented at the Korean Society of Design Studies Conference KSDS2016 and “Guidance Application for Drivers’ Safety at Moving to Work” presented at the Human Computer Interaction Conference in Korea HCIK2020.
Appl. Sci. 2020, 10(7), 2353; https://doi.org/10.3390/app10072353
Submission received: 31 December 2019 / Revised: 21 March 2020 / Accepted: 23 March 2020 / Published: 30 March 2020
(This article belongs to the Special Issue Swarm Robotics 2020)

Abstract

:

Featured Application

Swarm robots, including sensors that emit safety lights, collect traffic information from ad-hoc networks to make it easier for commuters to drive easily or help them decide not to drive. The robot interaction is transferred directly face-to-face to vehicles nearby, and through mobile apps for distant drivers.

Abstract

A new robot-to-robot communication system is designed for operation in the middle of highways/roads to support mobile safety of approaching vehicles. Robot devices capable of directing a vehicle on a bypass route using the proposed vehicle guidance method are detailed. The safety device includes a detector configured to detect a vehicle approaching the sensor robot and an image projector configured to project an image onto the road surface of the approaching vehicle when the vehicle is recognized. Robots can interact in two ways: (1) directly with drivers in the car to avoid the lane problem and (2) among sensor robots in ad-hoc networks, to transfer the information to the cloud to distribute via the mobile app for users far away from the location. In summary, the research results show that the sensor robots and mobile app mainly operated from 6 a.m. to 10 a.m. and provided customized service by modifying/solving uncommon sudden events on the road quickly.

Graphical Abstract

1. Introduction

In recent years, data science with respect to road traffic has advanced with the development of the internet/intelligence of things. Transportation authorities and car manufacturers [1] have compiled more information regarding car accidents. There has been increasing interest in using these car driving logs to predict and prevent car accidents that occur in the middle of highways and roads [2]. Still, research on traffic has focused primarily on vehicles and not on users (drivers).
On the other hand, We focused this research mainly on user experience. This research aims to propose multiple access point robots along highways and roads to safely and conveniently provide useful information for users. The real-time communicative sensor robot system provides users with information on detours from busy roads to prevent secondary vehicle accidents [3] or allows them to select alternatives among other transportation modes in their enhanced experience. For these purposes, mobile applications (apps) simultaneously connected with open application program interfaces (APIs) become useful for providing information.
Users can be in critical situations as they commute to work [4]. For example, a damaged section of a road [5] that is temporarily unavailable for use is one example where a detour will be required. In this case, the driver of the vehicle must know the detour route and be able to use it. Detours are also necessary when a road is under construction, or when a traffic accident occurs. In these cases, safety personnel or mannequins are arranged on the roads, yet the risk of an accident remains if the driver cannot access the bypass route in time.
Figure 1a shows the initial draft of a safety lighting device that generates a relatively narrow, intense light beam to prevent car accidents while driving at near and distanced places. The objective of the current research is to enable the driver to determine the bypass path and be guided into that path promptly. In addition, we aim to efficiently communicate to the driver that the road is hazardous. If a road is nonfunctional, the information first flows from the sensor robot to other robots to represent the message and finally to the cloud network of the database [6]. From the database, the application programming interface (API) transfers the log message to users’ mobile phones per their customized settings [7], as shown on Figure 1b.
This article describes a convergence project of infrastructure from robot and application software “Today’s commute” based on public API. A group of sensor robot devices that are designed for the highway/road environment have to communicate together effectively for providing information to more users. They can send transactions via TCP-IP in a wireless environment (e.g., ad-hoc network among sensor robots.) Communication is ensured through APIs and widespread networks. To support data distribution, these nodes are linked together and operate collaboratively.

2. State of Art: Data Science in the Road

Causality is prevalent in scientific and philosophical research; for example, how effective a policy was for efficient utility, how effective medicine (treatment) was for lung cancer, which advertisement (treatment) would give the highest click are for a given client (AB-testing).
Causal inference in statistics interprets the abovementioned questions as ones inferring the effect of a given treatment in the data generating process. Causal inference has been used in the technology industry, public health, and economics; in addition, it has received recent attention as a tool for data-driven decision-making processes. A considerable amount of research has been conducted regarding road safety with causality [8,9]. Many traffic data are observational, rather than experimental; this makes causal inference applicable.
For determining whether or not certain factors have any effect in reducing road traffic crashes, most published papers have used regression models with simulated [2] or observational data [10]. Low pavement marking visibility has been shown to increase the rate of accidents at night, compared to during the day, by the two popular methods: potential outcomes and causal diagrams frameworks.
In road safety, data are restricted to that of drivers and vehicles involved in road accidents. For solving the selection bias problem, responsibility analysis is implemented to evaluate the effect of a given factor on the risk of an accident.

2.1. A Sensor Communication System for Users near the Point of Issue

To interact with the sign systems and for the driver to have a contextual [10] knowledge, we need a technique that can solve the problems mentioned above. From a construction area, an automated behavior system can disclose the location of a traffic guide mannequin robot device. However, this system still does not identify the dangerous regions of the road. To identify the safe parts of the road and to manage the risk of high accident/fatality [11] rates, worker/driver safety measures should be implemented on roads. It is necessary to:
  • Improve the visibility of the information that the driver needs to identify the bypass path when it is necessary to guide the vehicle to the bypass path at night [3,12].
  • Increase the level of safety and accident prevention policies during road management [13].
  • Inform the driver of the detour route efficiently so they can safely bypass unusable roads and avoid unavailable roads (e.g., based on Monte Carlo Simulation [14]).
When a device [3] guides a vehicle to a bypass path, it is possible to efficiently inform the driver of the vehicle that the road is in an unusable state.

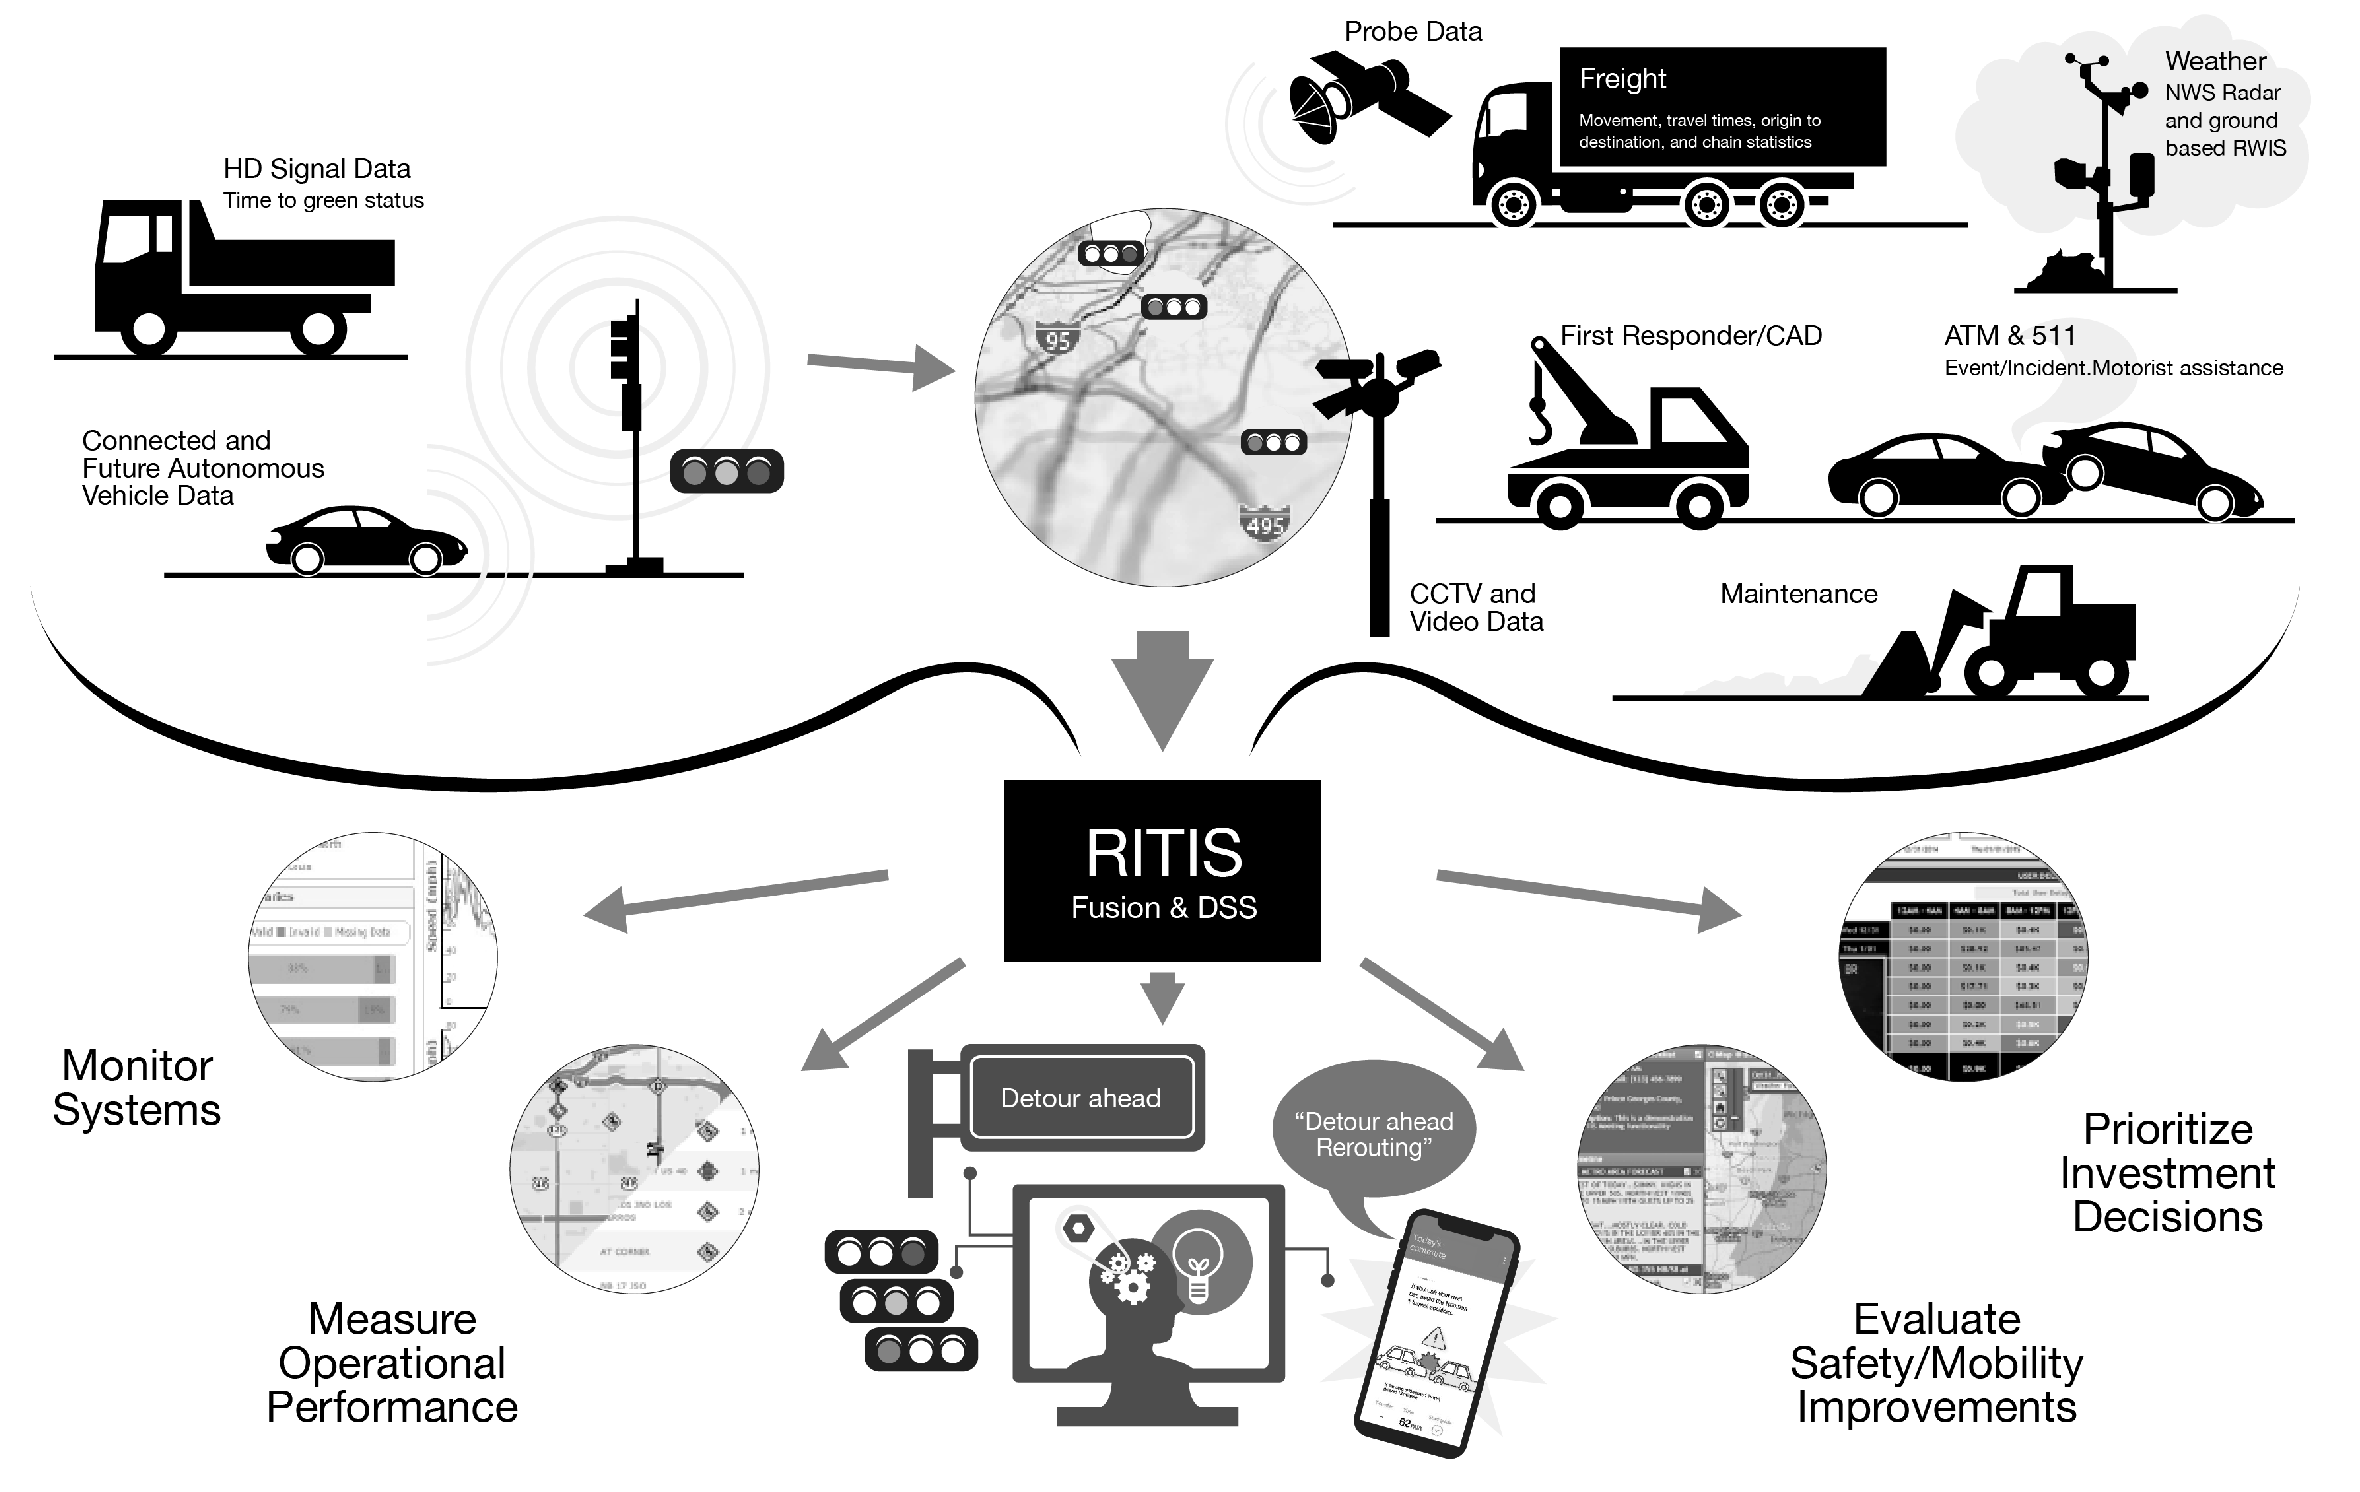
2.2. Information App Service for Users far away from the Point of Issue

Real-time path exploration is needed for analyzing the road situations, such as car accidents, status of road pavement, and black ice zones because of weather, and alternative suggestions (pathway/route) for users who are not on the road. Road safety apps should include:
  • Simulation of real-time path exploration [15,16].
  • Traffic congestion indication [17].
  • Show alternate options, including selection of customized path [18].
Customized pathfinding in networks can share information not only to drivers’ vehicle guidance but also to public transport information services. In the research on drivers from greater Seoul metropolitan areas [18], selecting options of driving and public and customized paths were major concerns influencing users.
In Figure 2, the Regional Integrated Transportation Information System (RITIS) [19] shows the convergence of information that can influence road safety. A database of public infrastructure and third-party data is one way of improving transportation efficiency, security, and safety [20] via the integration of data. The collected data are interlocked with the application and secures stability.

2.2.1. Probe Data Analytics and Exploring and Visualizing Crashes

The RITIS platform [19,20] has a detailed query builder within EVC (Exploring and Visualizing Crashes) that enables users to generate complex queries in real-time depending on causality using data: crash accident type, damage receipt, lighting condition, vehicle type, age, gender, injury type, received location, date range, collision type, and damage type, which is drug/alcohol-related.
Impact and causality analysis are the final objectives of the archived operational data analysis. Impact analysis provides a more hidden observation of observations (e.g., last week’s heavy snow caused significant delays in the region). In addition, the government officials can use other analysis tools found within the RITIS platform to review the safety data of police accident reports or Advanced Traffic Management System (ATMS) incident/incident reports to determine if there are accident hot spots that could have a global impact on road congestion. Some of these tools make deep query and causality analysis possible.

2.2.2. The New Jersey Department of Transportation (NJDOT)

NJDOT [21] combines archived operational data with data processing and visualization tools to identify performance problems in transport systems and develop easy-to-understand performance measures through visualization; this is consistent with senior leadership, elected officials and the public. It helps decision makers by providing them with the ability to automatically detect and rank the worst bottlenecks across counties or states, determine causality, determine whether congestion is repeated, measure economic impact, and create graphics that can be inserted in pairs of analysis documents. Once the user determines when and where congestion occurs, additional tool overlays (e.g., construction, accidents, special events) can be selected to place data on the time vortex to identify event causalities.

3. Process and Method

Based on the connectivity between the infrastructure and mobile devices [22], the “Vehicle Guidance Network” began with the need for classifying traffic jams and enabling AI-driven problem solving to improve driver commutes. For both drivers and public transport users, a safety sensor robot was designed to act as a guidance system for urban commuters. Requirements and needs to develop the guidance system can be extracted from the series of design processes described below.

3.1. Causal Inference with Graphical Model

We use the structural causal model (SCM) framework [23], as graphical models are used to encode scientific assumptions in qualitative (nonparametric) and transparent tools and to derive the logical effects of these assumptions. Consider intervening in parameter X to predict the distribution of result Y. Q = P(Y = y|do(X = x)) [23]. Assuming that the information available to us comes from observational studies measuring X, Y, Z and W, the samples are selected at random. It is required that we gain the conditions that allow us to deduce query Q from the available information, which takes the form of P(y,x,z,w) where Z and W are observed covariates [23].

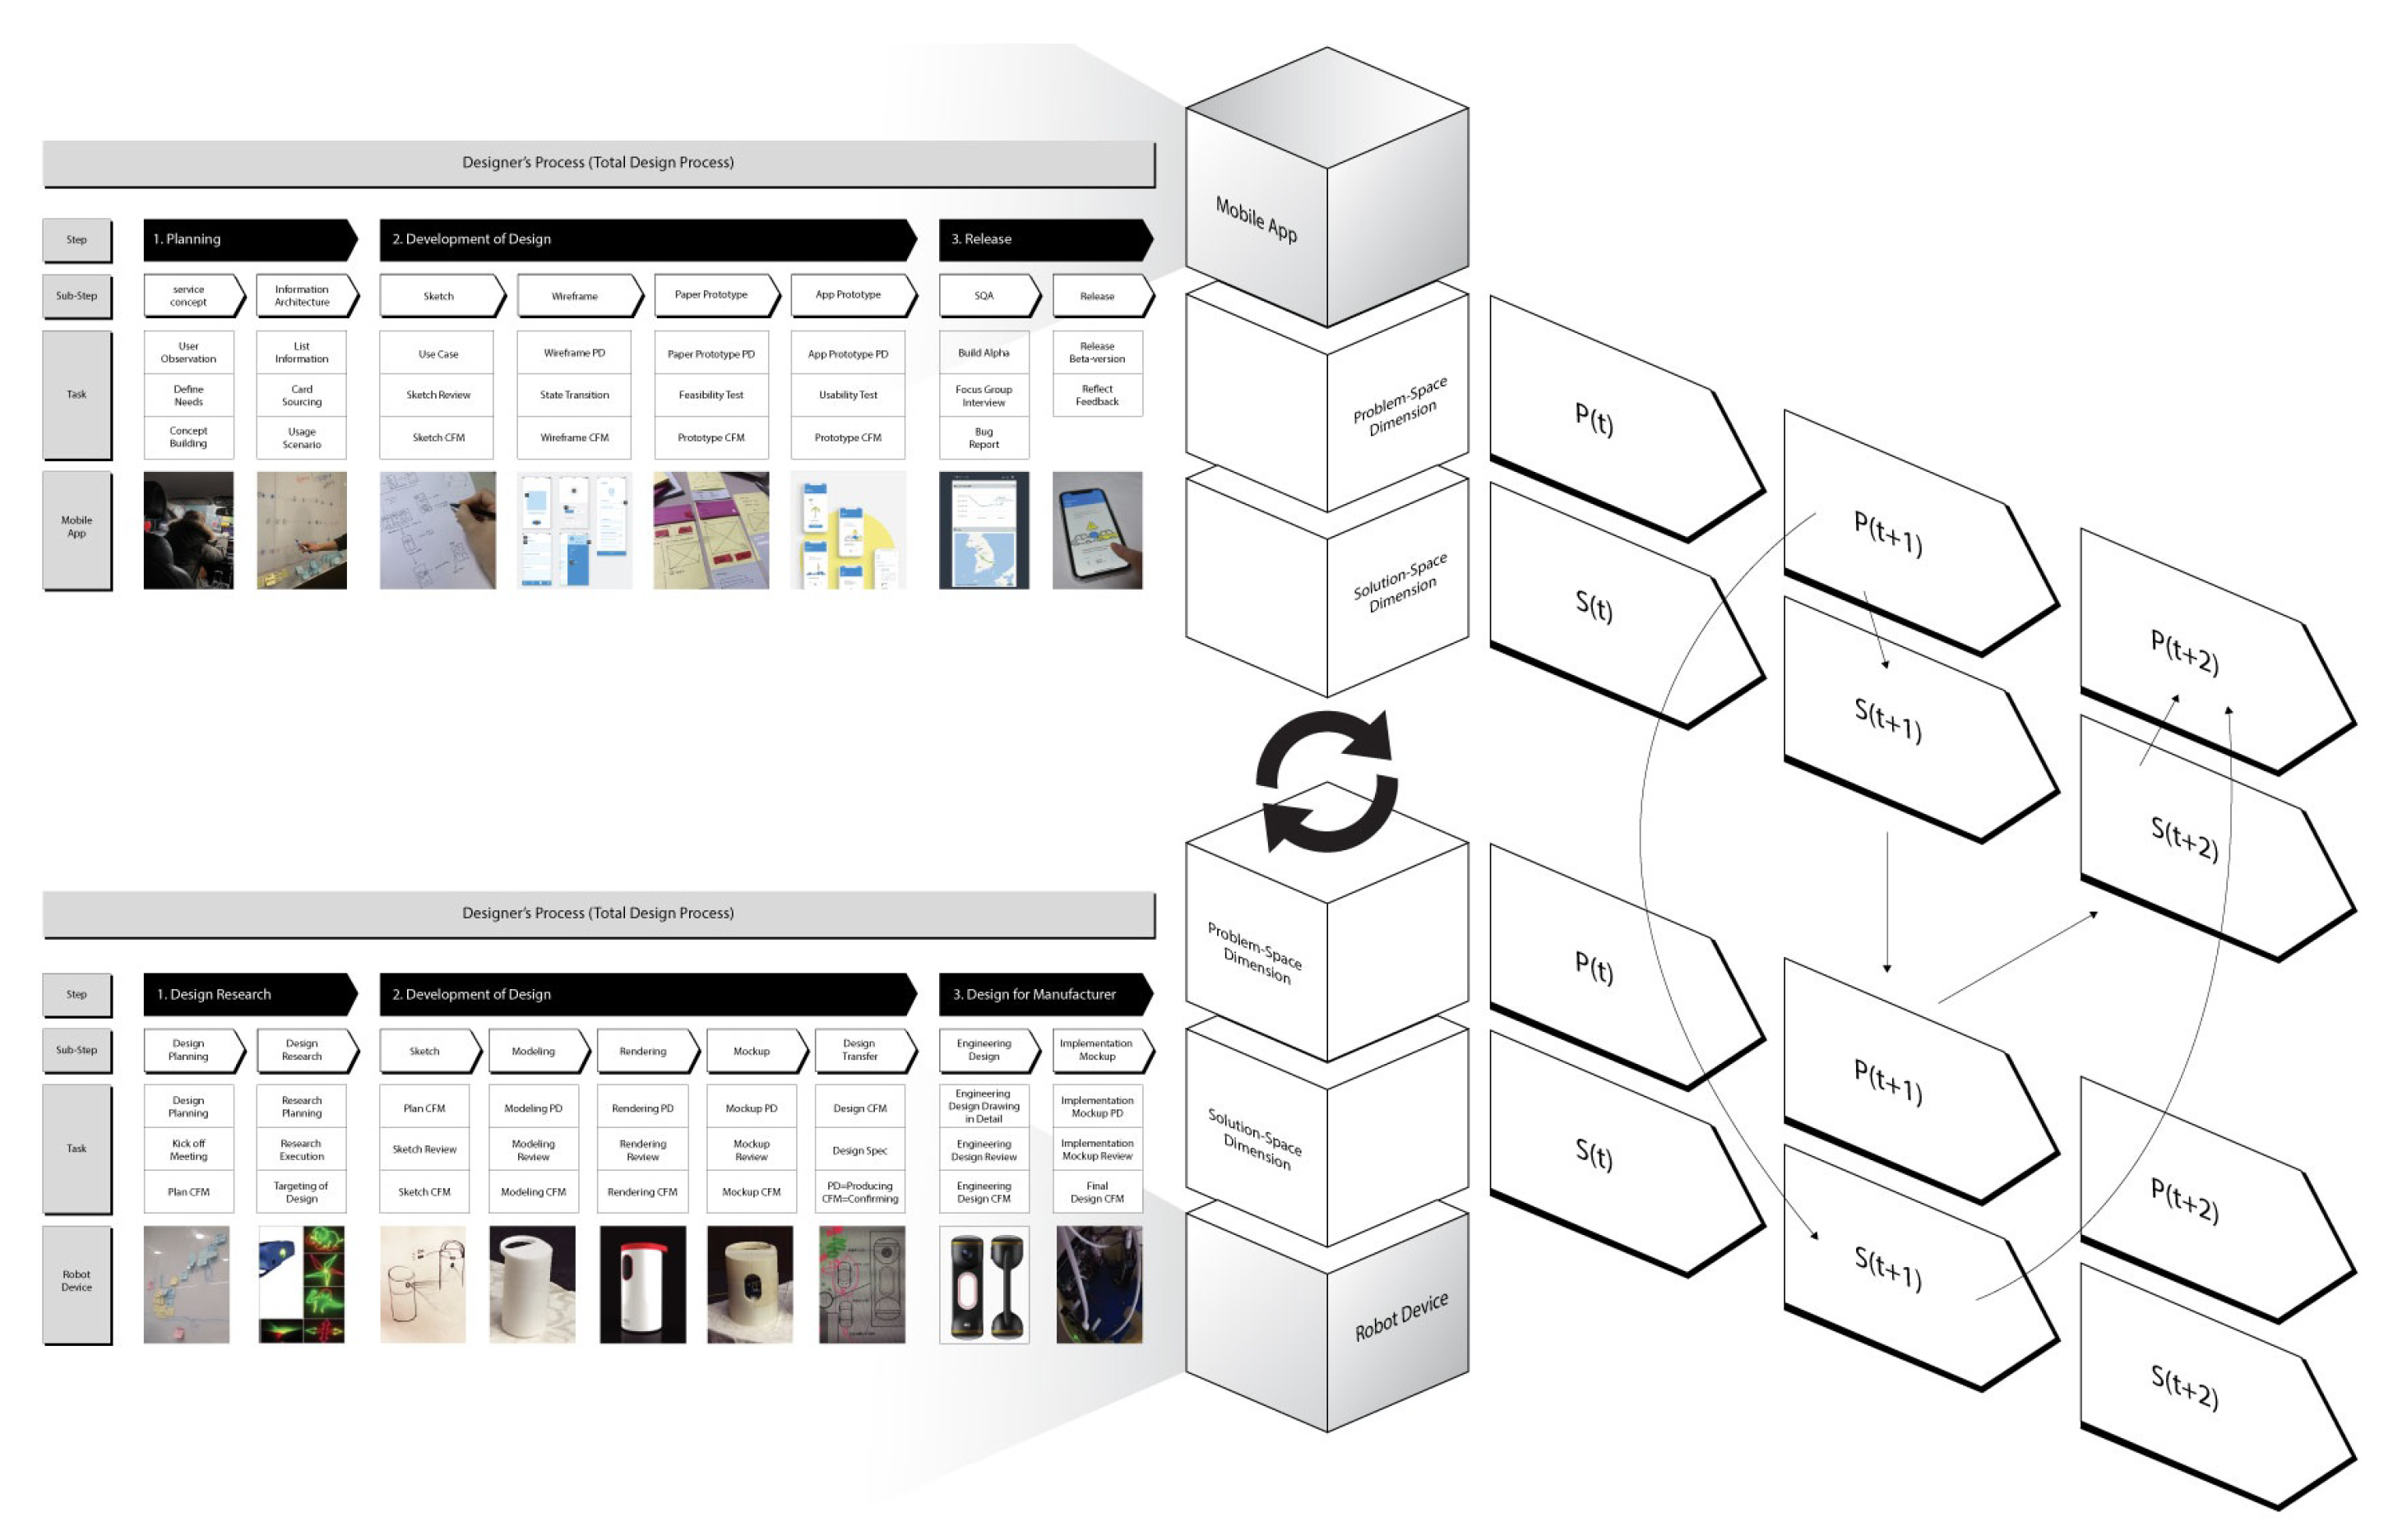
3.2. Total Process: Design Thinking Methodology From Design Research to Development and Implementation

The design process consists of two sub-processes; the robot design process and the mobile app development process, which have a sequential order according to the task and guide. The order of processes is (1) robot design steps from planning to implementation, and (2) mobile app design steps from IA to release version. The process of designing a robot and a mobile app is shown in Figure 3. Both design processes were conducted in the following stages: planning research, development, and productization. Each design process contains three stages: user research, design enhancement, and productization and interactively modeled with co-evolution of problem-solution mentioned below.

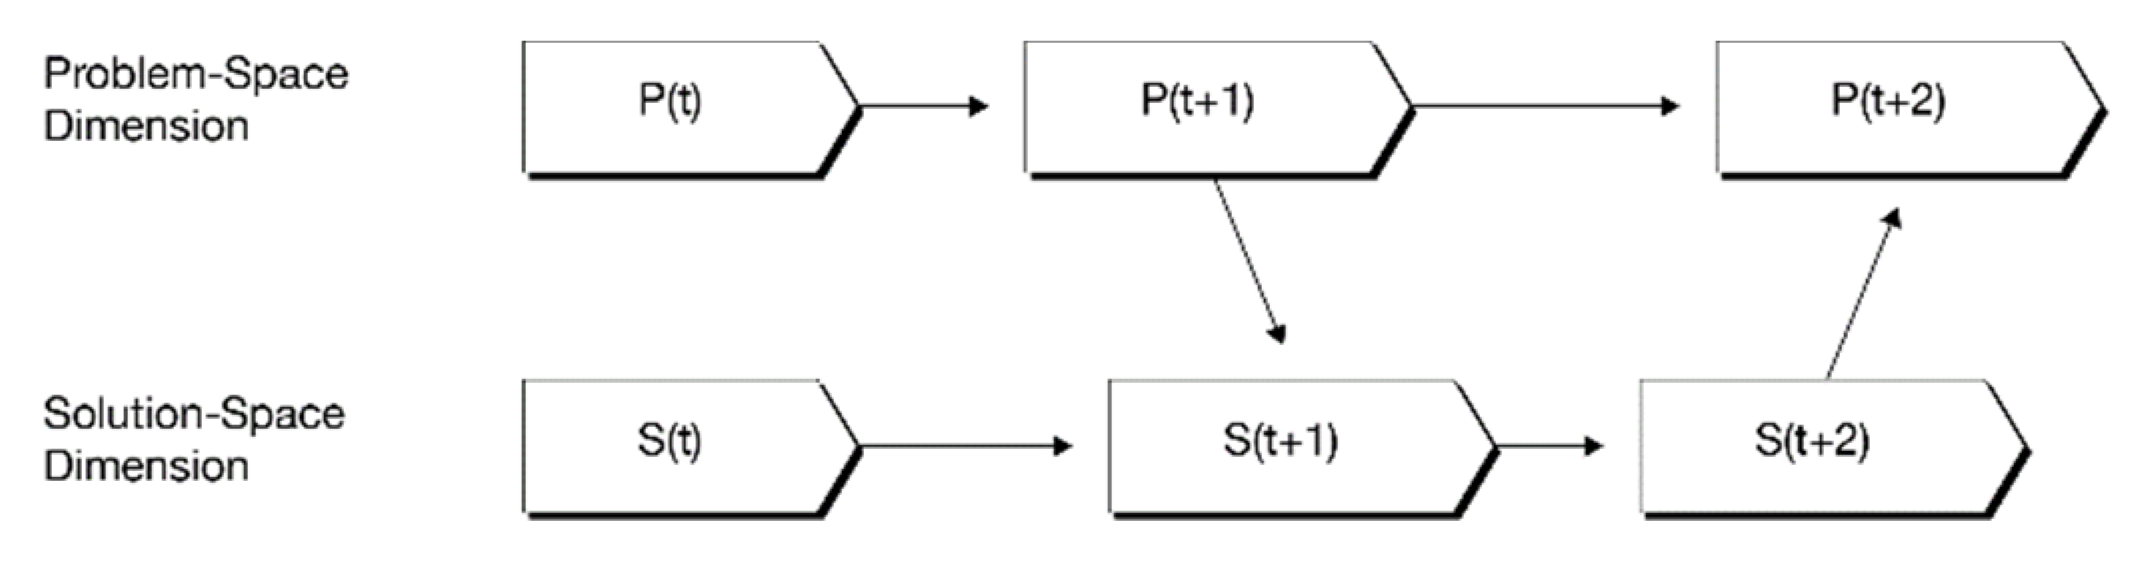
3.3. Method: Design Thinking and Co-Evolution for Problem-Solving

Design thinking is a sequential qualitative research method to reflect the needs of users [24]. Dorst and Cross (2001) developed the design thinking and its model to “Co-evolution of problem-solution” dealing with the problem-space dimension [25], as shown in Figure 4. The dimension of problem-space and solution-space evolve and develop cooperatively with each other. We considered a lot of variables that occur on the road and set up a system that manages data in an integrated way in the co-evolved design process. It represents the phase of solutions with problems.
Here, the initial problem and solution spaces, respectively; P(t+1) and S(t+1) are the partial structuring of problem and solution spaces, respectively; P(t+2) and S(t+2) are the developed structuring of problem and solution spaces, respectively. Design thinking follows the 4D process of ‘Discover’, ‘Define’, ‘Develop’, and ‘Deliver’. The four processes are discussed as below.

3.3.1. Discover: User Research on a Vehicle Guide System on the Road

We observed and interviewed several commuters with the method of town-watching and in-depth interviews (IDI). As shown in Table 1, the purpose of this observation is to identify inconveniences caused by a lack of information during the commute. As the observations were aimed at finding/creating [25] ways to improve the information, we also observed the flow of behaviors that led to decision making by the commuter. A contextual interview was conducted to find the hidden inconveniences that participants felt during the morning commute. We inquired about the reasons that led to particular driving decisions in their daily commute schedule.
Through the observation and context interviews, we were able to identify various types of incidents faced by drivers on their way to work, as shown in Figure 5. In the event of a road accident, the involved drivers and their vehicles are held up until the insurance company gets to the accident scene, resulting in a traffic bottleneck. Distant drivers should be informed to bypass such risky paths via a channel (e.g., mobile app) through the vehicle guidance system network. We could find, discover, and recognize a partial structure [25] of the network by exploring such problem spaces.

3.3.2. Define: Affinity Map and Persona

According to the affinity diagram of Figure 5, we could categorize drivers into four groups (upcoming, entered the road in issue, on the accident road, already in an accident). We arranged the user journey map belonging to the four groups of drivers, in the right side.
The affinity map identified the needs of users. First, rare data were positioned along the axis of feasibility and driver’s needs, and the necessity for two products (robot/app) was derived based on the time and the distance from the road where the accident occurred. The key insight extracted from these figures is that drivers near and distant from a car accident area require different solutions.

3.3.3. Develop: Design Draft as a Solution and Progress of the User Findings to Needs

Both near and distant solutions for given road information are required, based on the findings from the user journey map, as shown in Table 2. An adjacent sensor robot device in the car accident area can provide solutions to nearby drivers by directly projecting a message from the robot device. To project the message in optical rays, at least one manipulator is required to achieve the desired angle (of laser projection). The simplest manipulator in a laser projection unit is an actuator, a base, and an R-R manipulator that rotates a total of two turns each time just before the end-effector. It is useful for projecting forward light rays to emphasize the bypass path.
The requirements of distant users from the road in issue can be solved by communication from sensor robots to the access point server. Stable IoT communication via wireless TCP/IP using the LoRa module available with a mobile phone telecommunication network.

3.3.4. Deliver: Design Implementation

The design for the manufacturer requires assembled and linked products for distribution. Further product validation is required for the distribution of the product in the scalable production process. According to the total design process in Figure 3, we implemented an industrial model of sensor robot hardware as well as an alpha-released mobile app in Figure 6 to deliver information for targeted users.

4. Results and Discussion

In this section, the architecture of the sensor robot system used in this research is introduced first. Next, the connected network of APIs and three case studies of mobile apps according to the extracted needs from the design thinking are presented and discussed. As the result of design delivery, the overall information architecture of the process (from the robots-networks to APIs-mobile app) is shown in Figure 6. It is then summarized to support the different, wise, and refreshing way to commute to work. Lastly, the discussion of the results is provided with examples.

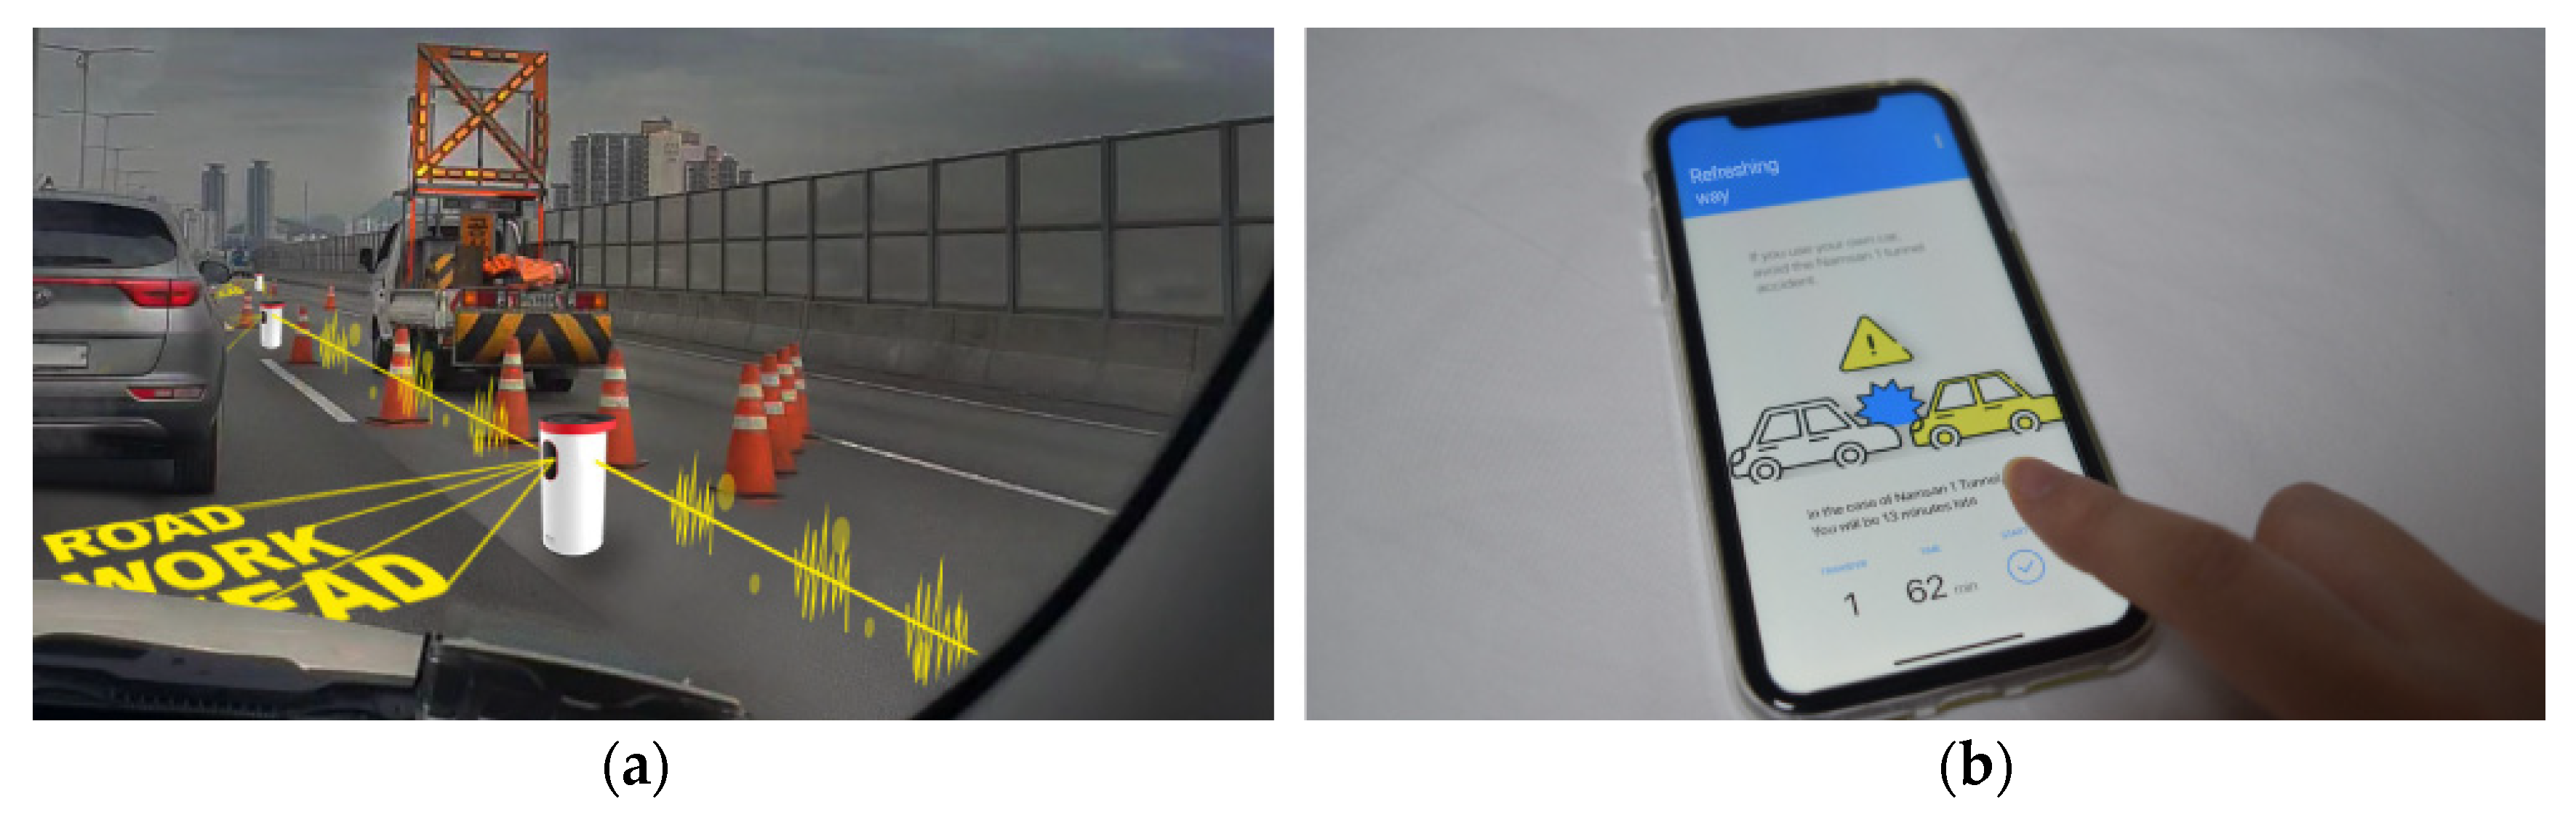
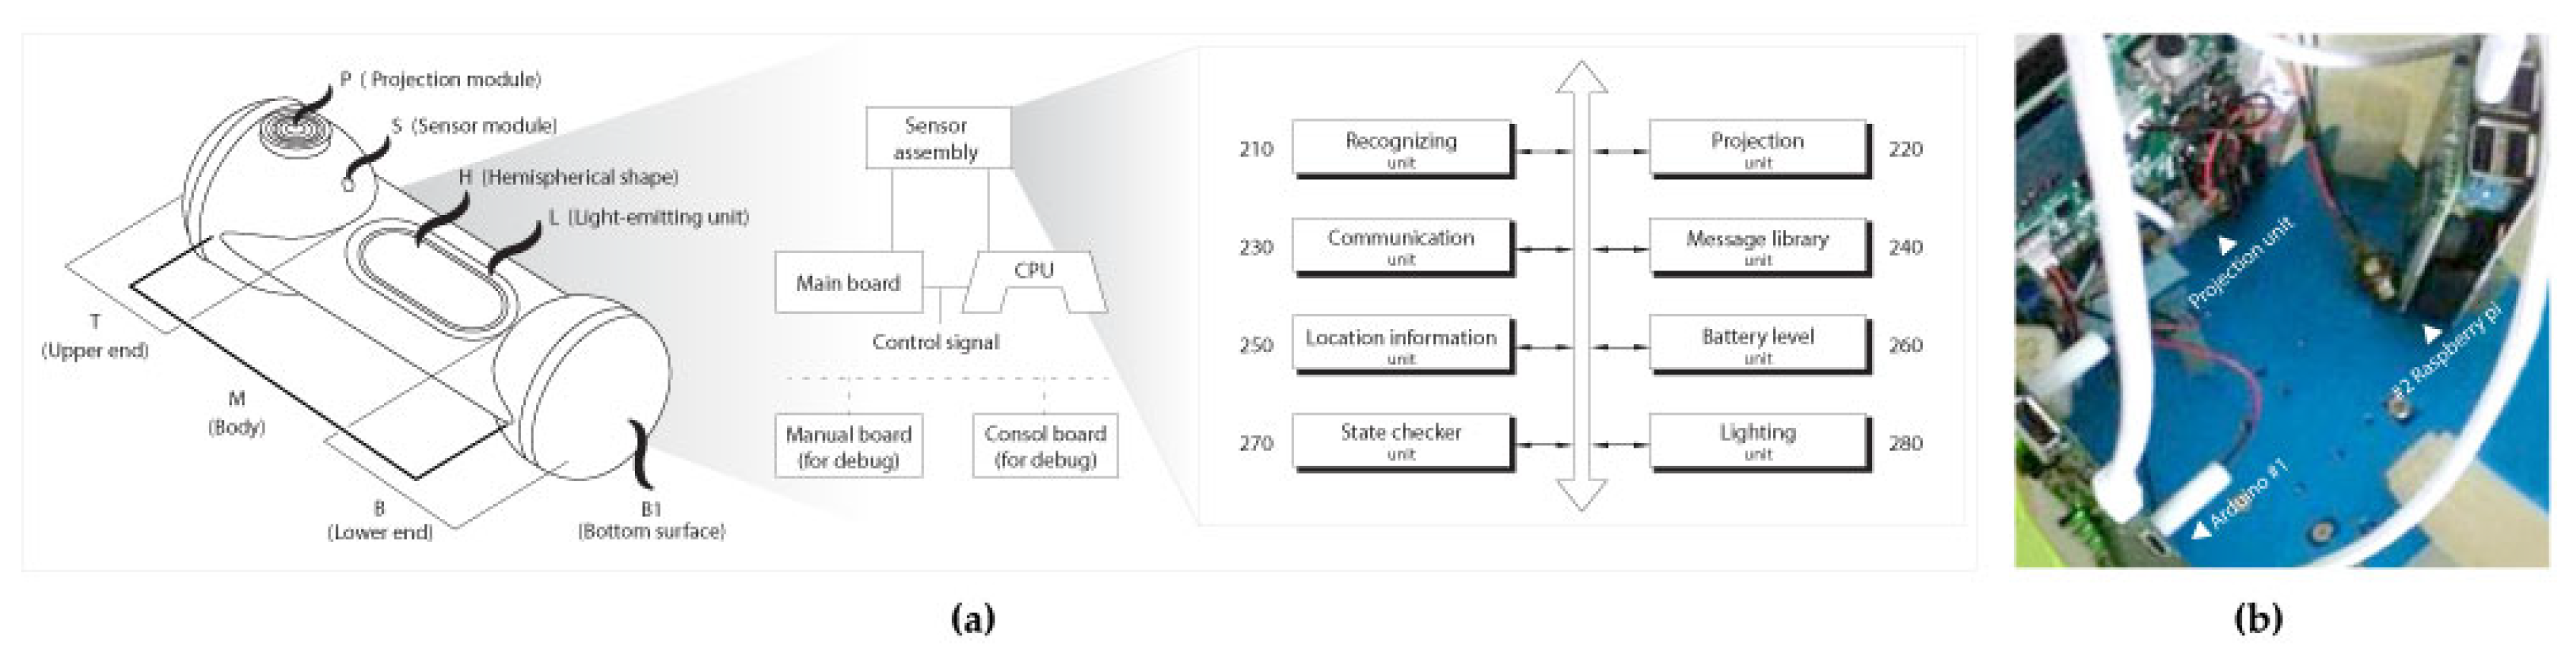
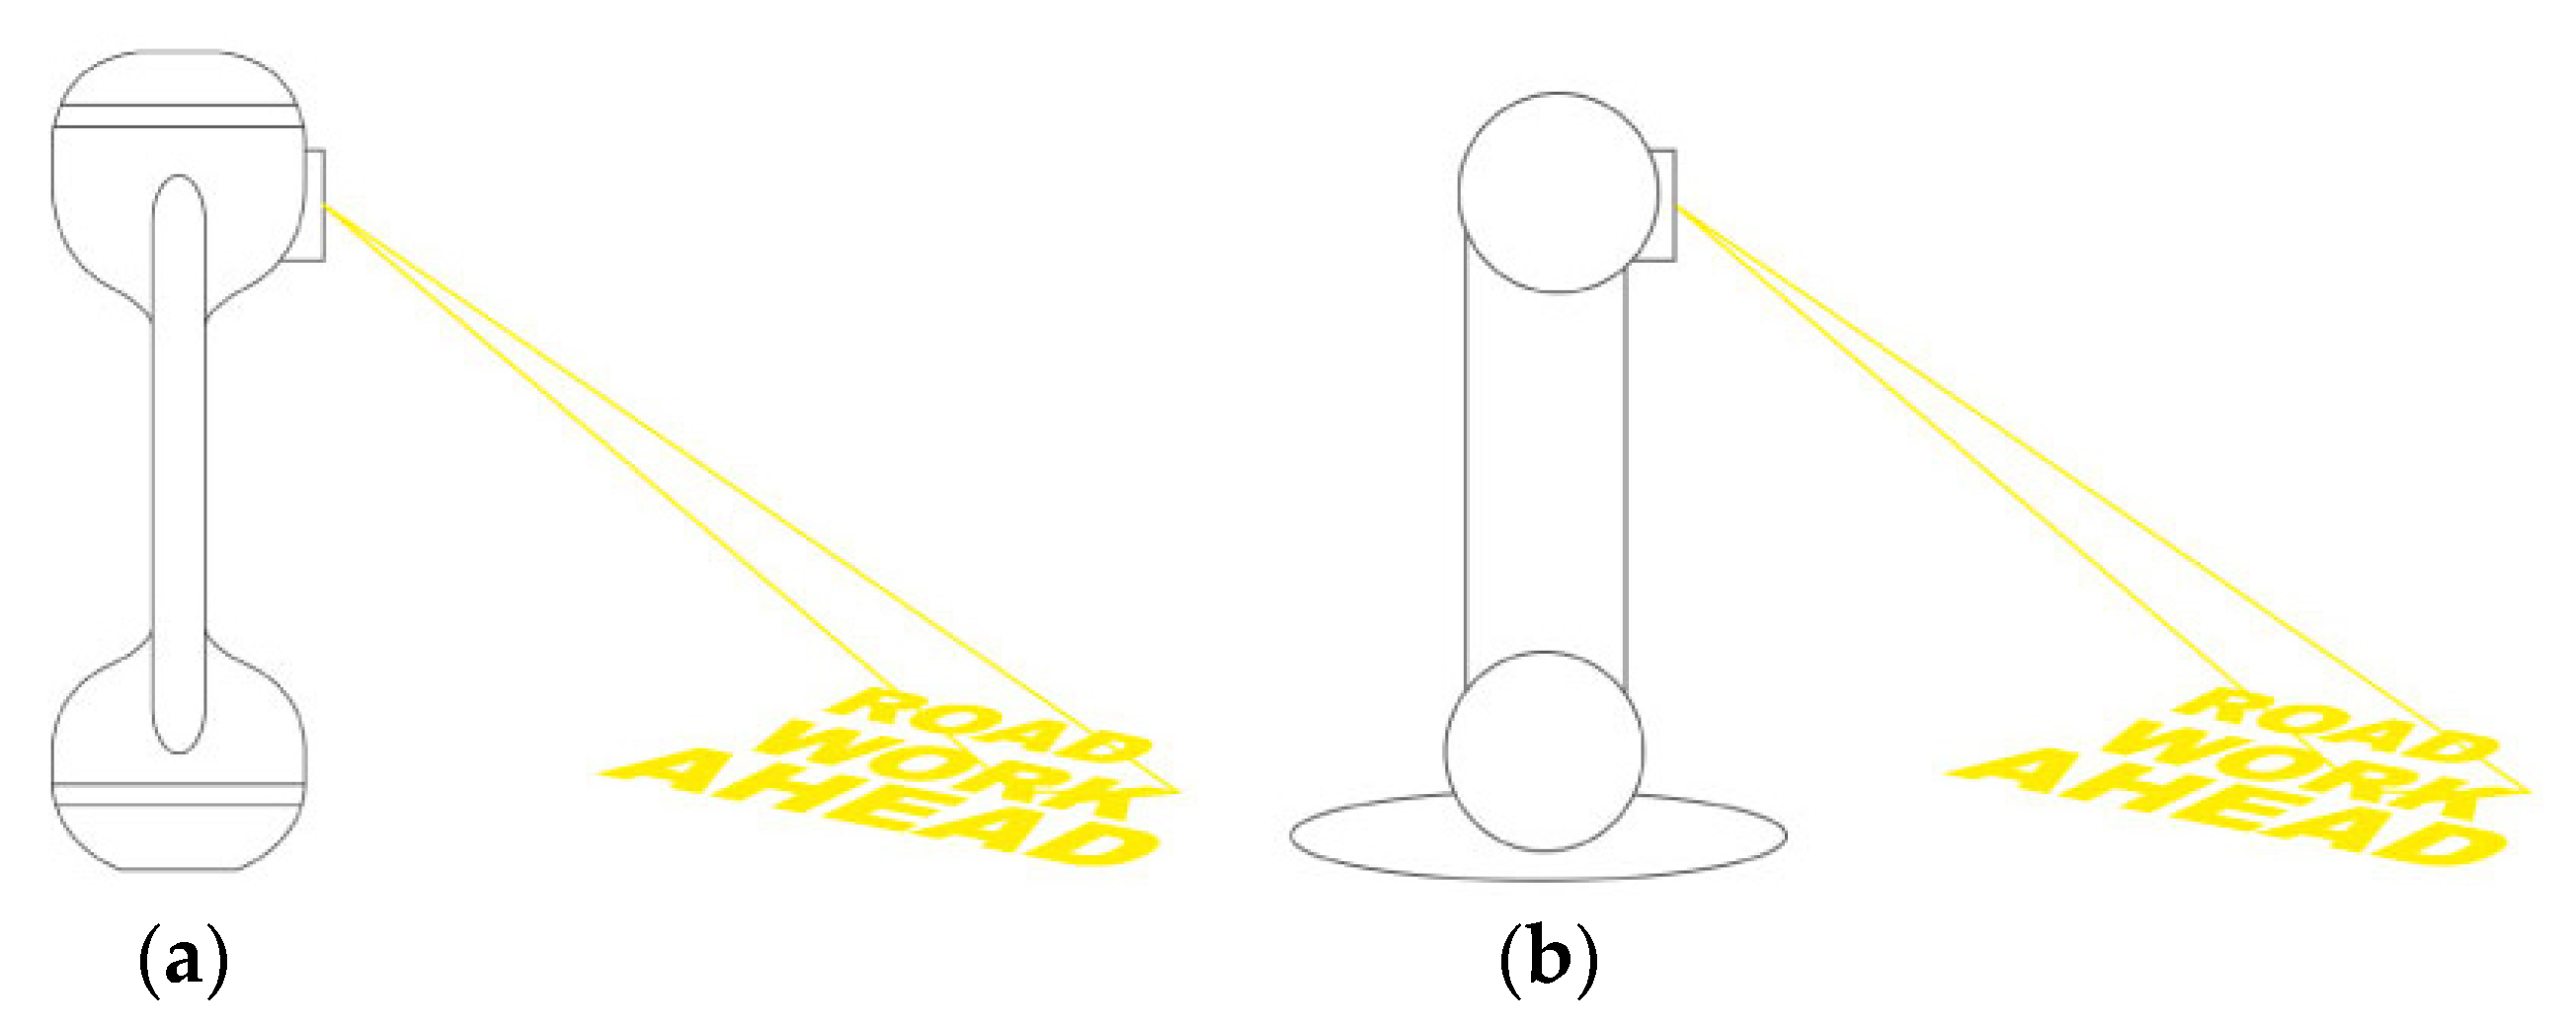
4.1. Sensor Robot Design as Access Point

The background information mentioned in Section 3 was used for the derivation of robot design, reflecting the needs of the users. The sensor robot device is an automated input device stationed on the highways/roads, and has communication dependency with other robots as an access point. According to the requirements from the needs-based function list, the architecture of the sensor robot has a sensor assembly comprising recognizing, projection, communication, message library, location information, battery level, state checker, and light units, as shown in Figure 7.
Figure 7a shows the schematic labeling of each portion of the robot device. The robot includes an upper end (T), body (M), and lower end (B). T is positioned above M and includes a projection module (P) and sensor module (S) for projecting an image and detecting approaching vehicle, respectively. The projection module can be in at least one configuration of the image projection unit and the detection sensor module of the robot device.

4.1.1. Recognizing Unit: For Sensing Vehicles

The recognition unit (the detector, labeled as 210 in Figure 7a) uses an ultrasonic sensor to measure the distance to the vehicle approaching the sensor robot device. The detector uses an ultrasonic to a RADAR (or LIDAR) sensor, which uses frequency bands in the range of 20 kHz to 79 GHz to measure the distance from an object. Besides the ultrasonic sensor, the detector includes a sensor equipped with a position-sensitive detector sensor, a charge-coupled device image sensor, and an infrared (IR) sensor to identify the presence and distance of the vehicle.
The recognition unit periodically measures the distance between the robot device and the vehicle. When the measured distance between vehicles is close to 0–200 m, the vehicle is considered to be approaching the robot device. The recognition unit then generates access information when an approaching vehicle is detected. Here, the “access information” refers to information about the detection of the approach of a vehicle to the robot device and includes at least one piece of unique identification information of the robot.

4.1.2. Image Projector (Safety Lighting) for Alerting Signals to Vehicles

The sensor robot device also includes an image projector (220 in Figure 7a) in the projection unit (220 in Figure 7b). It projects an image or text with a laser and lighting onto a road surface when the vehicle approaches. Here, the projected image can include a video or image message that notifies the driver of a road condition or a detour route. Also, the image as safety lighting can include a warning message indicating the state of the road. For example, a warning video can consist of a message indicating the state of the road, such as “under construction” and “incident section.” The projected image can also indicate a detour route. For example, the ‘detour route image’ can include a message indicating a direction in which the vehicle should bypass, such as ‘->’ and ‘>>>’. In this case, the image to be projected can be set by the image manager of the message library unit (240 in Figure 7a).
The image projector can project an image onto a road surface when the approaching vehicle is within a preset range set by the detector. For example, when the ultrasonic detector detects a distance that is fewer 10 m and RADAR detects a distance of less than 200 m from the approaching vehicle, the image is projected on the road surface to warn the driver. For efficient battery usage, it can stop projecting an image while no vehicle is approaching the robot device.
The image projector includes a light source unit inside the package. We adopted a light source unit including red, green, and blue laser diodes and connected it to Arduino, as shown in Figure 7b. In this case, the plurality of light-emitting devices can emit color by combining at least one white beam. The light source unit can emit light generated in each of the laser diodes by a driving current applied from the power supply unit (260 in Figure 7a) according to a predetermined driving signal. It can also control the projection angle to project the image within the distance measured by the detection unit.
Here, for the purpose of setting the accurate angle of the laser lighting, the projection manipulator, as shown in Figure 8a, controls the image projector to project an image on a road surface within a distance from the vehicle, measured by the detector, based on a vertical axis relative to the road surface. A portion of the robot device can also be horizontally rotated to control the projection angle.
This is an example of an kinematics of the end effector (projection light) on the transformation matrix:
T e n d F 0 = ( cos θ f 1 sin θ f 1 sin θ f 1 cos θ f 1         0 0 0 0 0 0 0 0         1 L f 1 0 1 )
When the image projecting unit projects an image in a direction opposite to an approaching vehicle, part of the robot device is rotated horizontally by 180 degrees to the left on the vertical axis of the road surface, as shown in Figure 8b. The projection angle can be controlled to project an image in the vehicle direction. The lower end B, in Figure 7a, has a hemispherical shape, at least a portion of which is convex downward. In addition, it can include a bottom surface B1, at least a portion of which is in contact with the road surface as the first revolving joint, as shown in Figure 8b.

4.1.3. Communication Unit for Sharing Information

The communicator (230 in Figure 7a) can transmit and receive wireless data to and from the operator terminal or other robot devices using a mobile communication module on a short-range communication band.
The near field communication module is for near field communication and is internally equipped with Bluetooth, Radio, WIFI Direct (WFD: TCP/IP), NFC, and a universal serial bus (USB). The robot device can configure an ad-hoc network with the operator terminal or at least one other robot device through the communication unit, which transmits the access information generated by the recognizing unit to the operator terminal or other robot devices.

4.1.4. Message Library: Image Manager Stores at Least One Image

The image manager can include a module for managing an external storage device, such as a USB memory stick, to manage at least one image stored in the external storage device. The message library (240 in Figure 7a) can set an image to be projected by the image projector. For example, the image to be projected by the image projector can be set based on the image setting information received from the operator terminal through the communication unit.
Here, the image setting information includes identification information of an image to be projected according to the unique ID of each robot device, which can be a combination of numbers or letters for distinguishing each image. This includes the symbol of a bypass path or warning. When the identification information of an image, including an ‘under construction’ message among warning symbols, is received from the operator terminal through the communication unit, the image projector can be configured to project a warning image matching the identification information of the received image.

4.1.5. Location Information Unit Determined by Global Positioning System (GPS)

The image manager includes an input unit (interface) capable of receiving image setting information. When the operator inputs image setting information through the input unit, the image manager can include one or more images. The image manager can also set an image to be projected among at least one image based on the image setting information stored in the external storage device. The operation is based on the location information of the robot device obtained by the location information unit (250 in Figure 7a). For example, when it is determined that the robot device is within a preset range at the traffic accident point, based on the acquired location information, the image manager views the warning image to be projected by the image projector in an ‘accident occurrence’. The image manager can also determine which robot device is located closer to the approaching vehicle based on the acquired location information.
Additionally, the location information unit can acquire longitudinal and latitudinal information of the robot device using a GPS and an indoor-outdoor positioning system. The location information of the robot device can also be obtained through a media access control address of a connected WIFI access point.

4.1.6. Battery Level Unit: Rechargeable and Replaceable Battery

The robot device includes a battery level (indicator) unit (260 in Figure 7a). The battery level unit can receive power from an external or internal power source and supplies the energy required for each component of the robot device. The power supply unit includes a general rechargeable built-in battery that is replaceable. The lower portion has a weight greater than the weight of the upper portion so that it can move like a portable machine when the robot device is installed, even if the robot device falls. Additionally, B includes the power supply unit of the robot device.

4.1.7. State Checker Unit: Status Information to Be Written in Distributed Databases

First, the robot device includes a state checker unit (270 in Figure 7a), which can check the operating state of each component of the robot device to generate state information. Accordingly, the ’status information’ refers to information on the operation state of each component of the robot device: the detection unit, the image projection unit, the communication unit, the image management unit, and the location information unit. Information about the operation state of at least one of the information and power supply units is included. Information on the remaining battery charge of the power supply unit is also included. Furthermore, the status checker can cause the light emitter (280 in Figure 7a) to illuminate to notify an operator when the remaining charge in the battery is within a preset, remaining range.
Second, the state checker unit can check the communication state of at least one other robot device through the communication unit. The status checker can store unique identification information of each robot device connected through a network, periodically check the communication state with at least one other robot device and communicate with other status checkers. Unique identification information of a robot device can also be extracted. In this case, the status checker can transmit the extracted unique identification information of the robot device that cannot be communicated to one of the operator terminals or another robot device through the communication unit, in which case, the light-emitting unit can also emit light.
Third, the status checker includes a gyro sensor and can, therefore, determine whether the robot device has moved or fallen based on the motion information detected by the gyro sensor. If it is determined that a robot device has fallen, the state check unit generates state information indicating that the robot device is inoperable and is communicated by the communication unit to at least one other robot device or the operator terminal.

4.1.8. Light-Emitting Unit

The robot device includes a light-emitting unit (280 in Figure 7a). The light-emitting diode (LED) light [26] emits light based on the status information generated by the status checker and is set by the operator terminal. For example, white light is emitted when the robot device is operational, and the remaining battery charge level of the power supply unit in the status checker is within a preset range. A green light indicates that the communication of at least one other robot device is impossible.

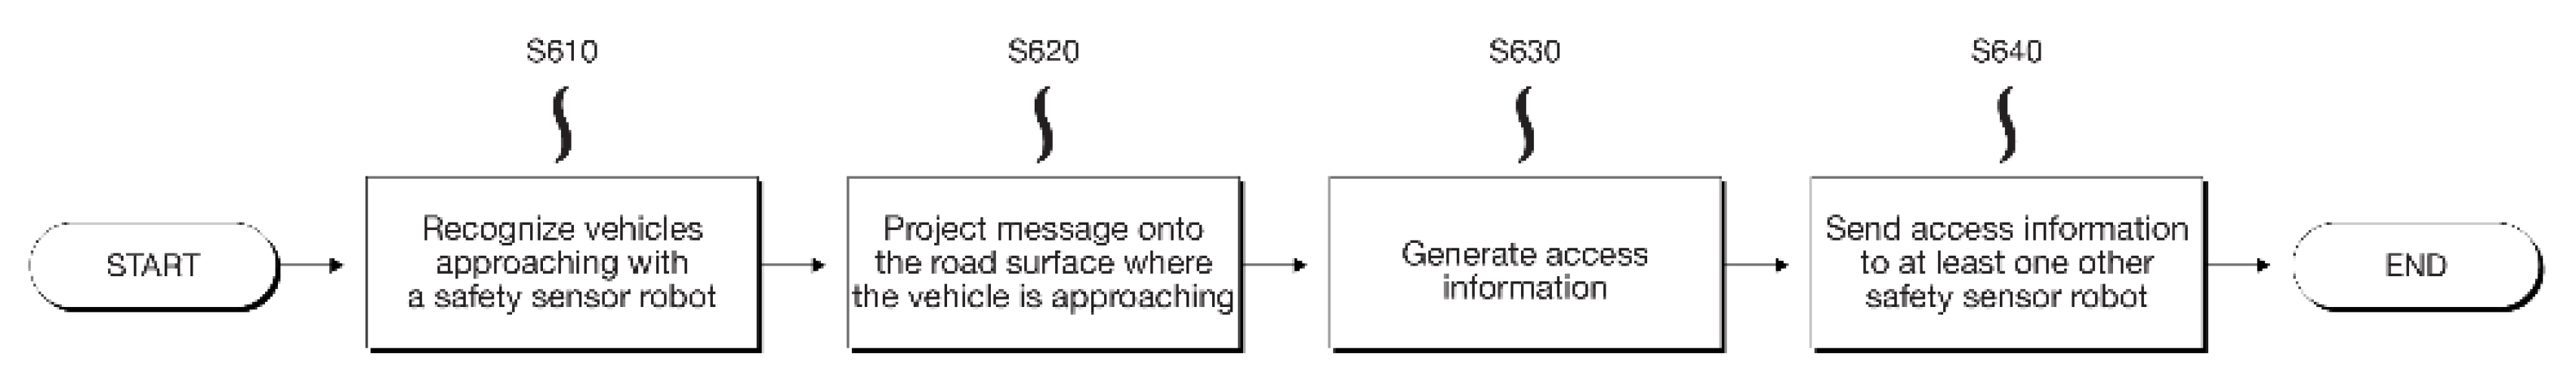
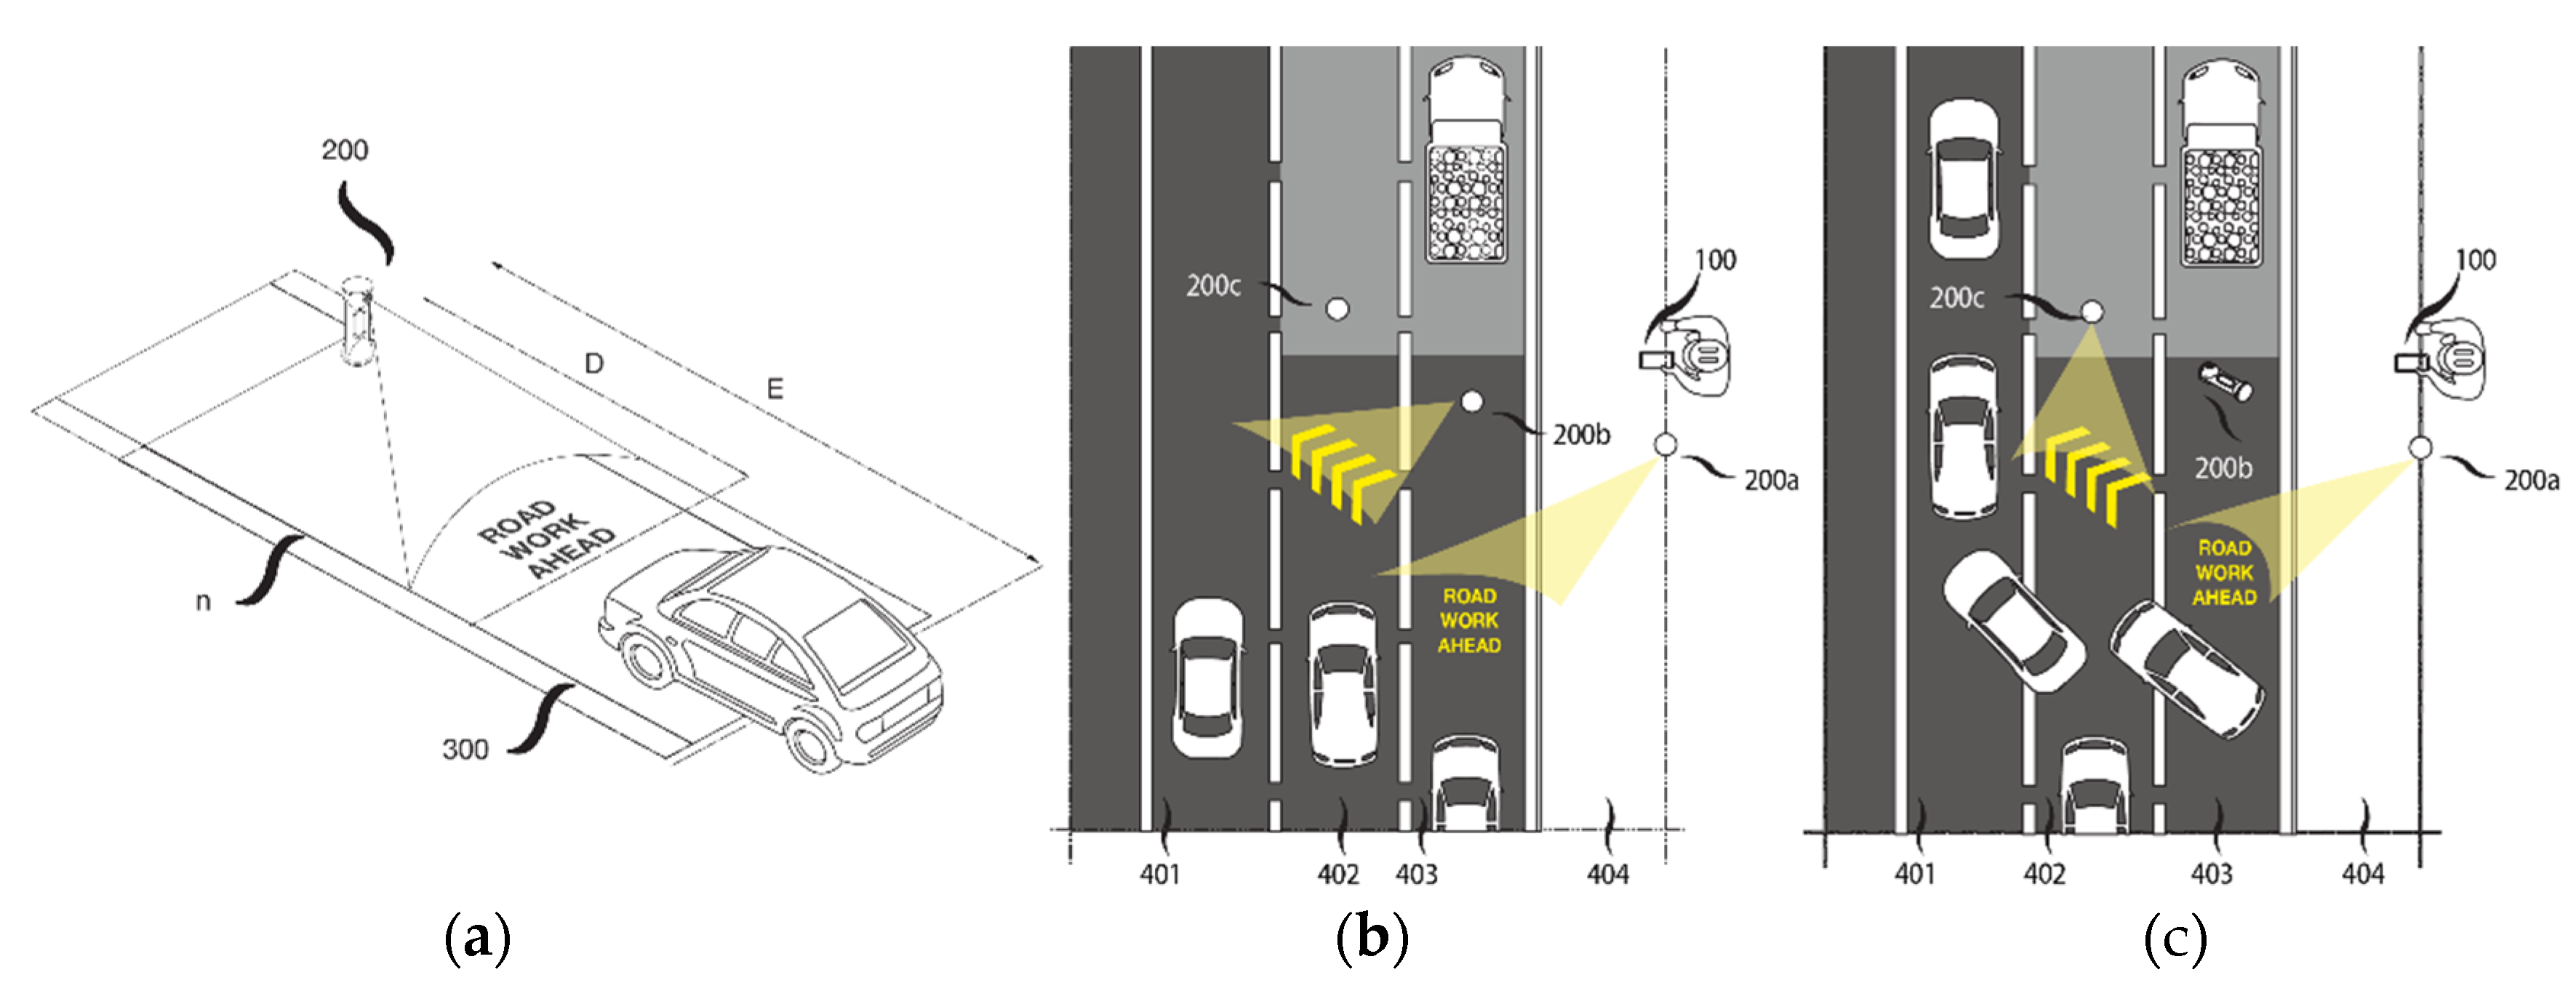
4.1.9. Vehicle Guidance Method

The vehicle guidance method includes steps that are processed in time series in the robot device shown in Figure 8, Figure 9 and Figure 10. The flowchart in Figure 11 is an exemplary view for explaining the method of inducing a vehicle by the robot device.
The robot can detect the vehicle (300 in Figure 10a) approaching the robot device (S610 in Figure 11), then measure the distance D from the vehicle. For convenience, the distance D between the robot device and the vehicle is expressed perpendicularly to the vehicle while being parallel to the road surface. The robot periodically measures D from approaching vehicles. If a vehicle is detected as approaching, the robot projects an image on to the road surface R of the approaching vehicle (indicated by S620 in Figure 11). Figure 11 includes a warning image with an under construction (’road work ahead’) sign. The safety robot device can:
  • Project an image on the road surface R on which the vehicle is approaching, when the distance D with the vehicle is within a preset range E. For example, E can be set to 200 m, and the robot detects an approaching vehicle when D is detected to be within 200 m. The image is then projected on the road surface R.
  • Control the projection angle to project an image on R within D from a vehicle and project the image according to the projection angle.
  • Generate access information when the vehicle approaches the robot device.
  • Transmit the access information generated by at least one other robot device
The first robot (200a) in Figure 10 can detect the approach of the vehicle and project a warning image on the road surface. It also generates access information and transfers the generated access information to at least one other robot device, say 200b.
The second robot receives the access information from the first robot and projects the detour path image. Furthermore, when an error occurs in at least one of the robot devices, the third robot device (200c) can replace the robot device in which the error has occurred, as in Figure 10b,c. The third robot device can determine whether an error has occurred based on the state information received from the first or second robot device. Alternatively, the third robot device can extract the unique identification information of the non-communicable robot device to identify the failing robot device.
When the second robot device is damaged or felled by a vehicle, the second robot device provides its status information to the first and third robot devices and at least one operator terminal through peer-to-peer communication. The status information includes the unique identification information of the second robot device. Image setting information, which contains the information about the image set that needs to be projected by the fallen second robot, is also transmitted to the first and third robot devices, and the operator terminal.
In this case, the operator terminal displays the received status information and the operator checks the status information so that the third robot device can operate to replace the second robot device. For example, when the third robot device receives status information indicating that the third robot device has fallen or moved from the second robot device, the second robot device matches the identification information of the robot device in which the error has occurred. The error-prone robot device is identified and the second robot device, which is an error-prone robot device, can be projected based on the image setting information received.
When the second robot device is in an emergency state where communication is impossible, the third robot device extracts the unique identification information of the second robot device. The image set in the second robot device can be projected from the image setting information based on the unique identification information of the second robot device. At this time, the image setting information includes identification information of the image to be projected according to the unique identification information of each of the devices. The third robot device projects an image of which at least one image stored in the image manager matches the identification information of the image.
Along with the sensor robot device, the vehicle guidance system is applied to road construction and traffic accidents. Even if it is necessary to guide the vehicle through the bypass route, the technical idea is applicable. The vehicle guidance data flow is described in Figure 11. The guidance system includes instructions executable by a program module instance from the sensor robot, through the API server, to the Android mobile app. The in-vehicle system can process instructions within the computing device, such as displaying graphical information for providing a graphical user interface on an external input or output device (such as a display connected to a high-speed interface through On Board Diagnostics (OBD) [27] with an Android mobile app).

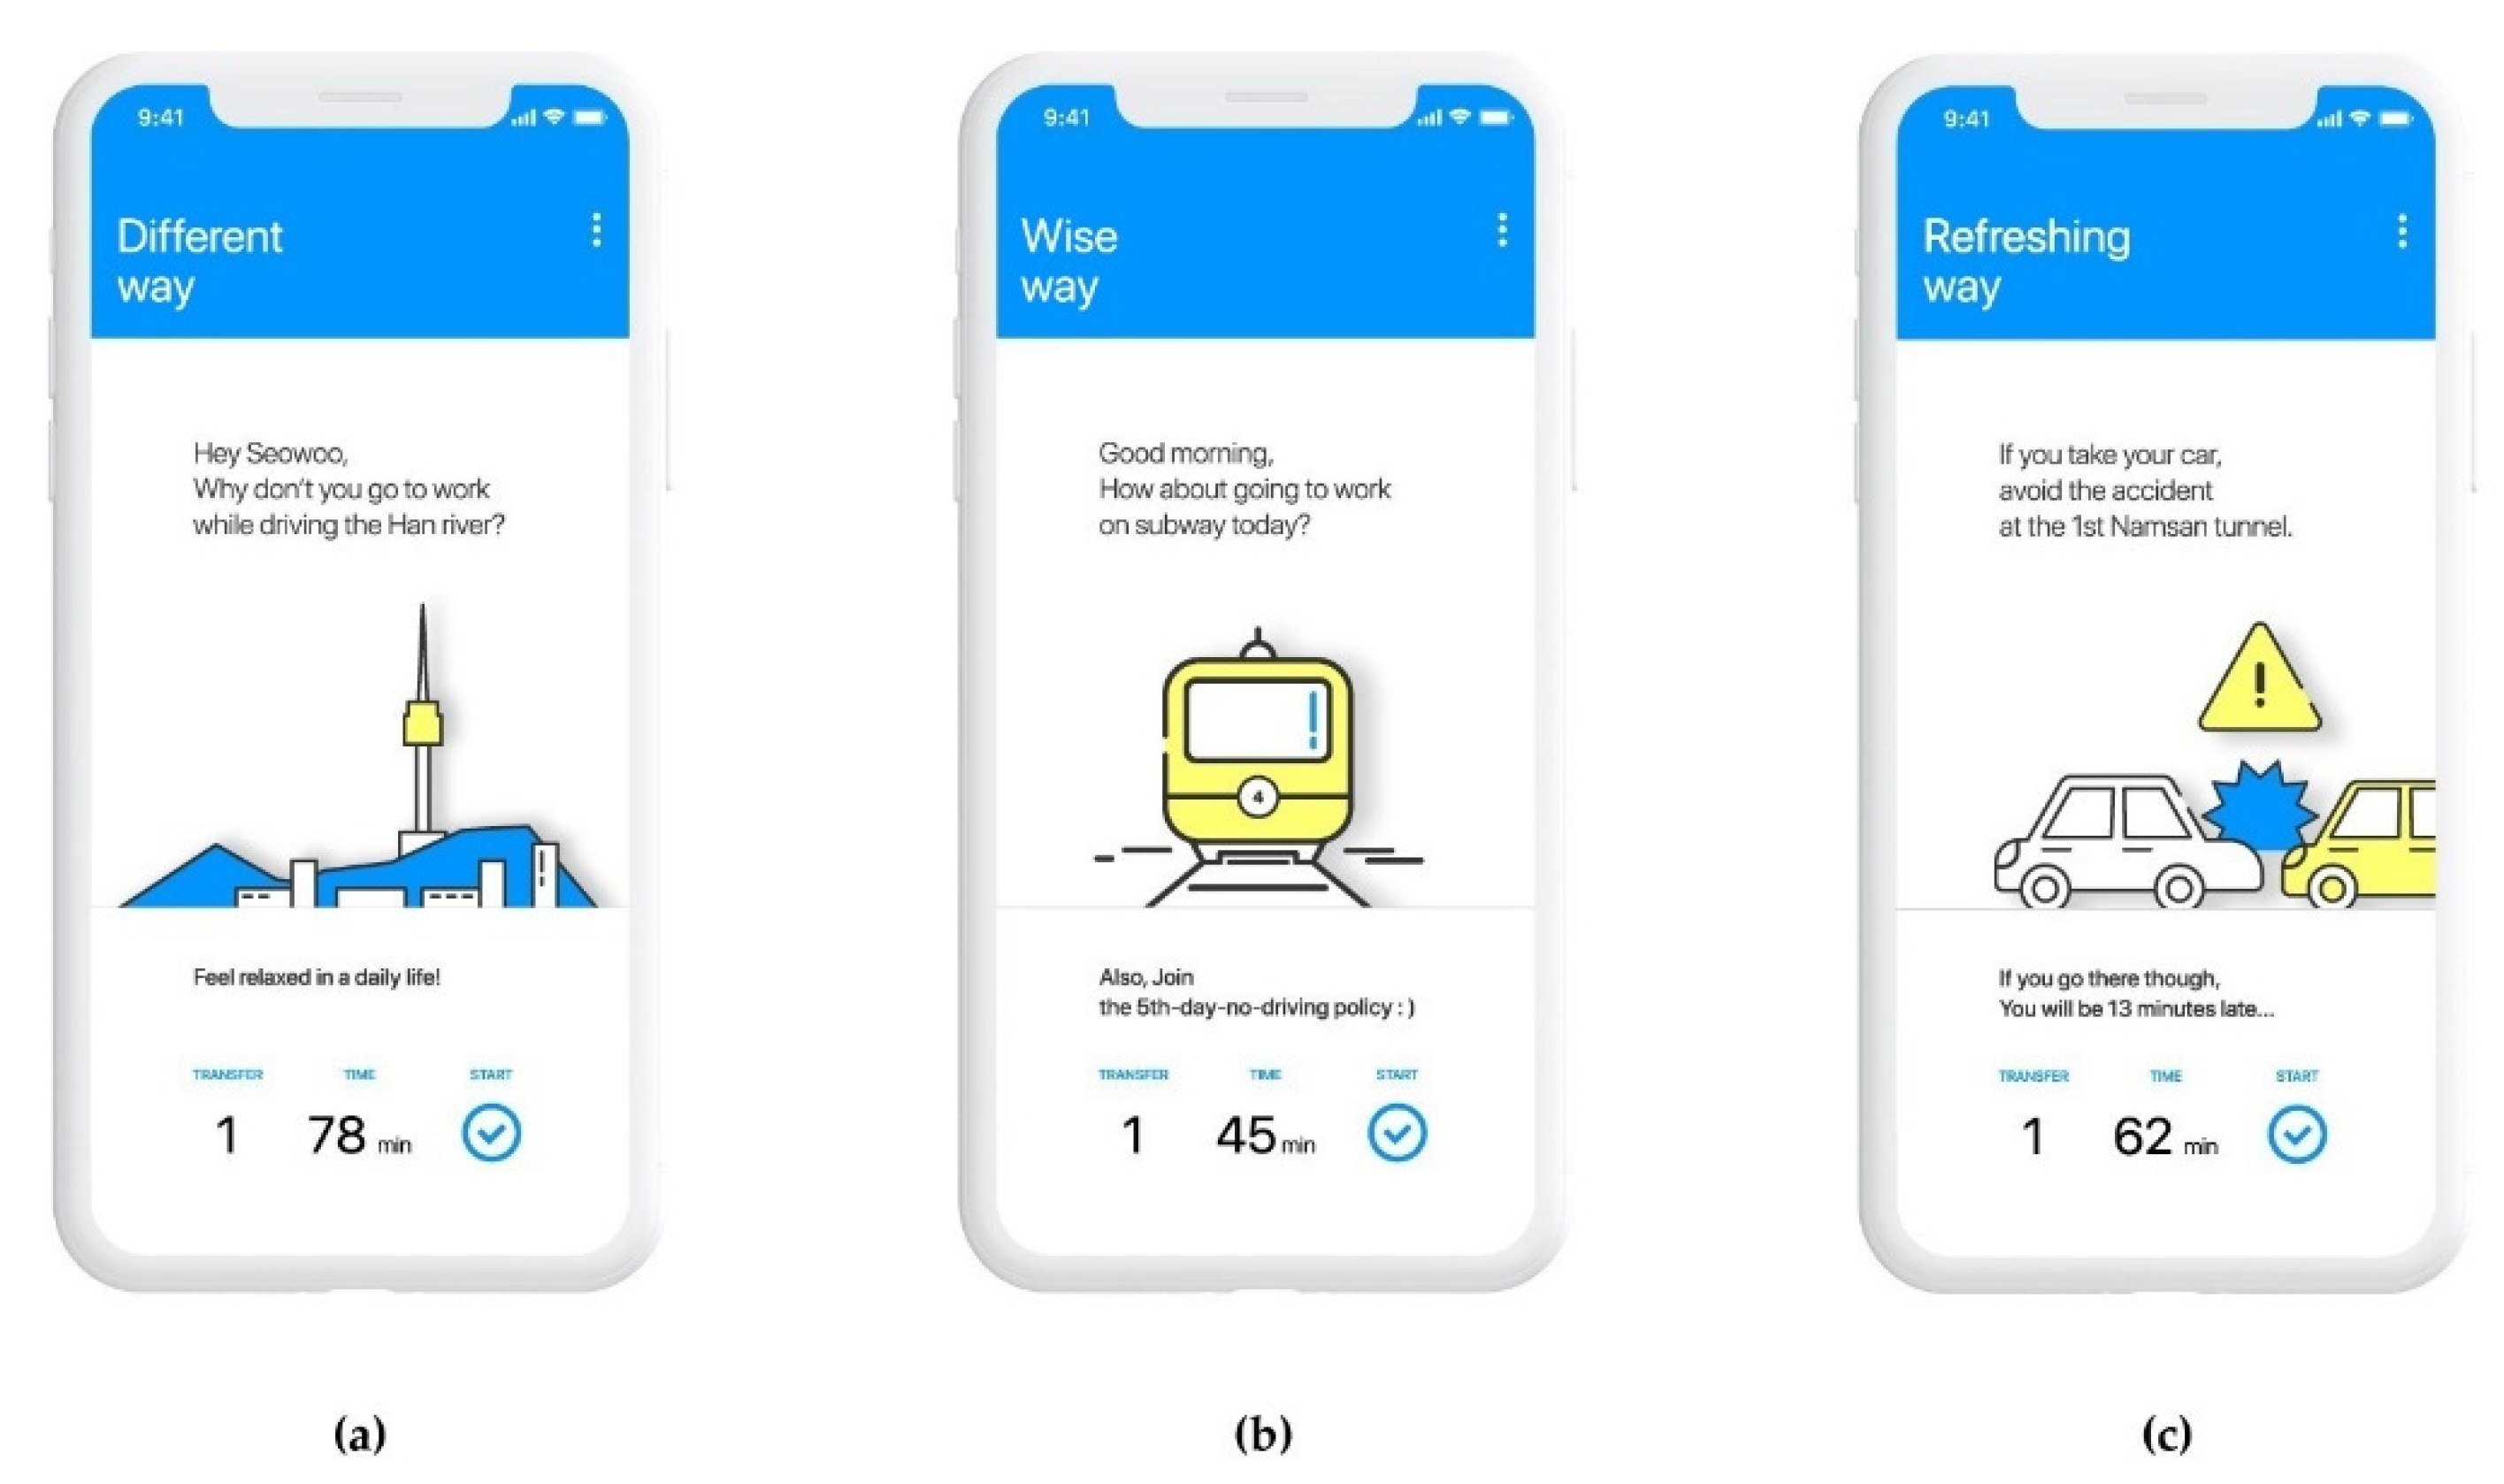
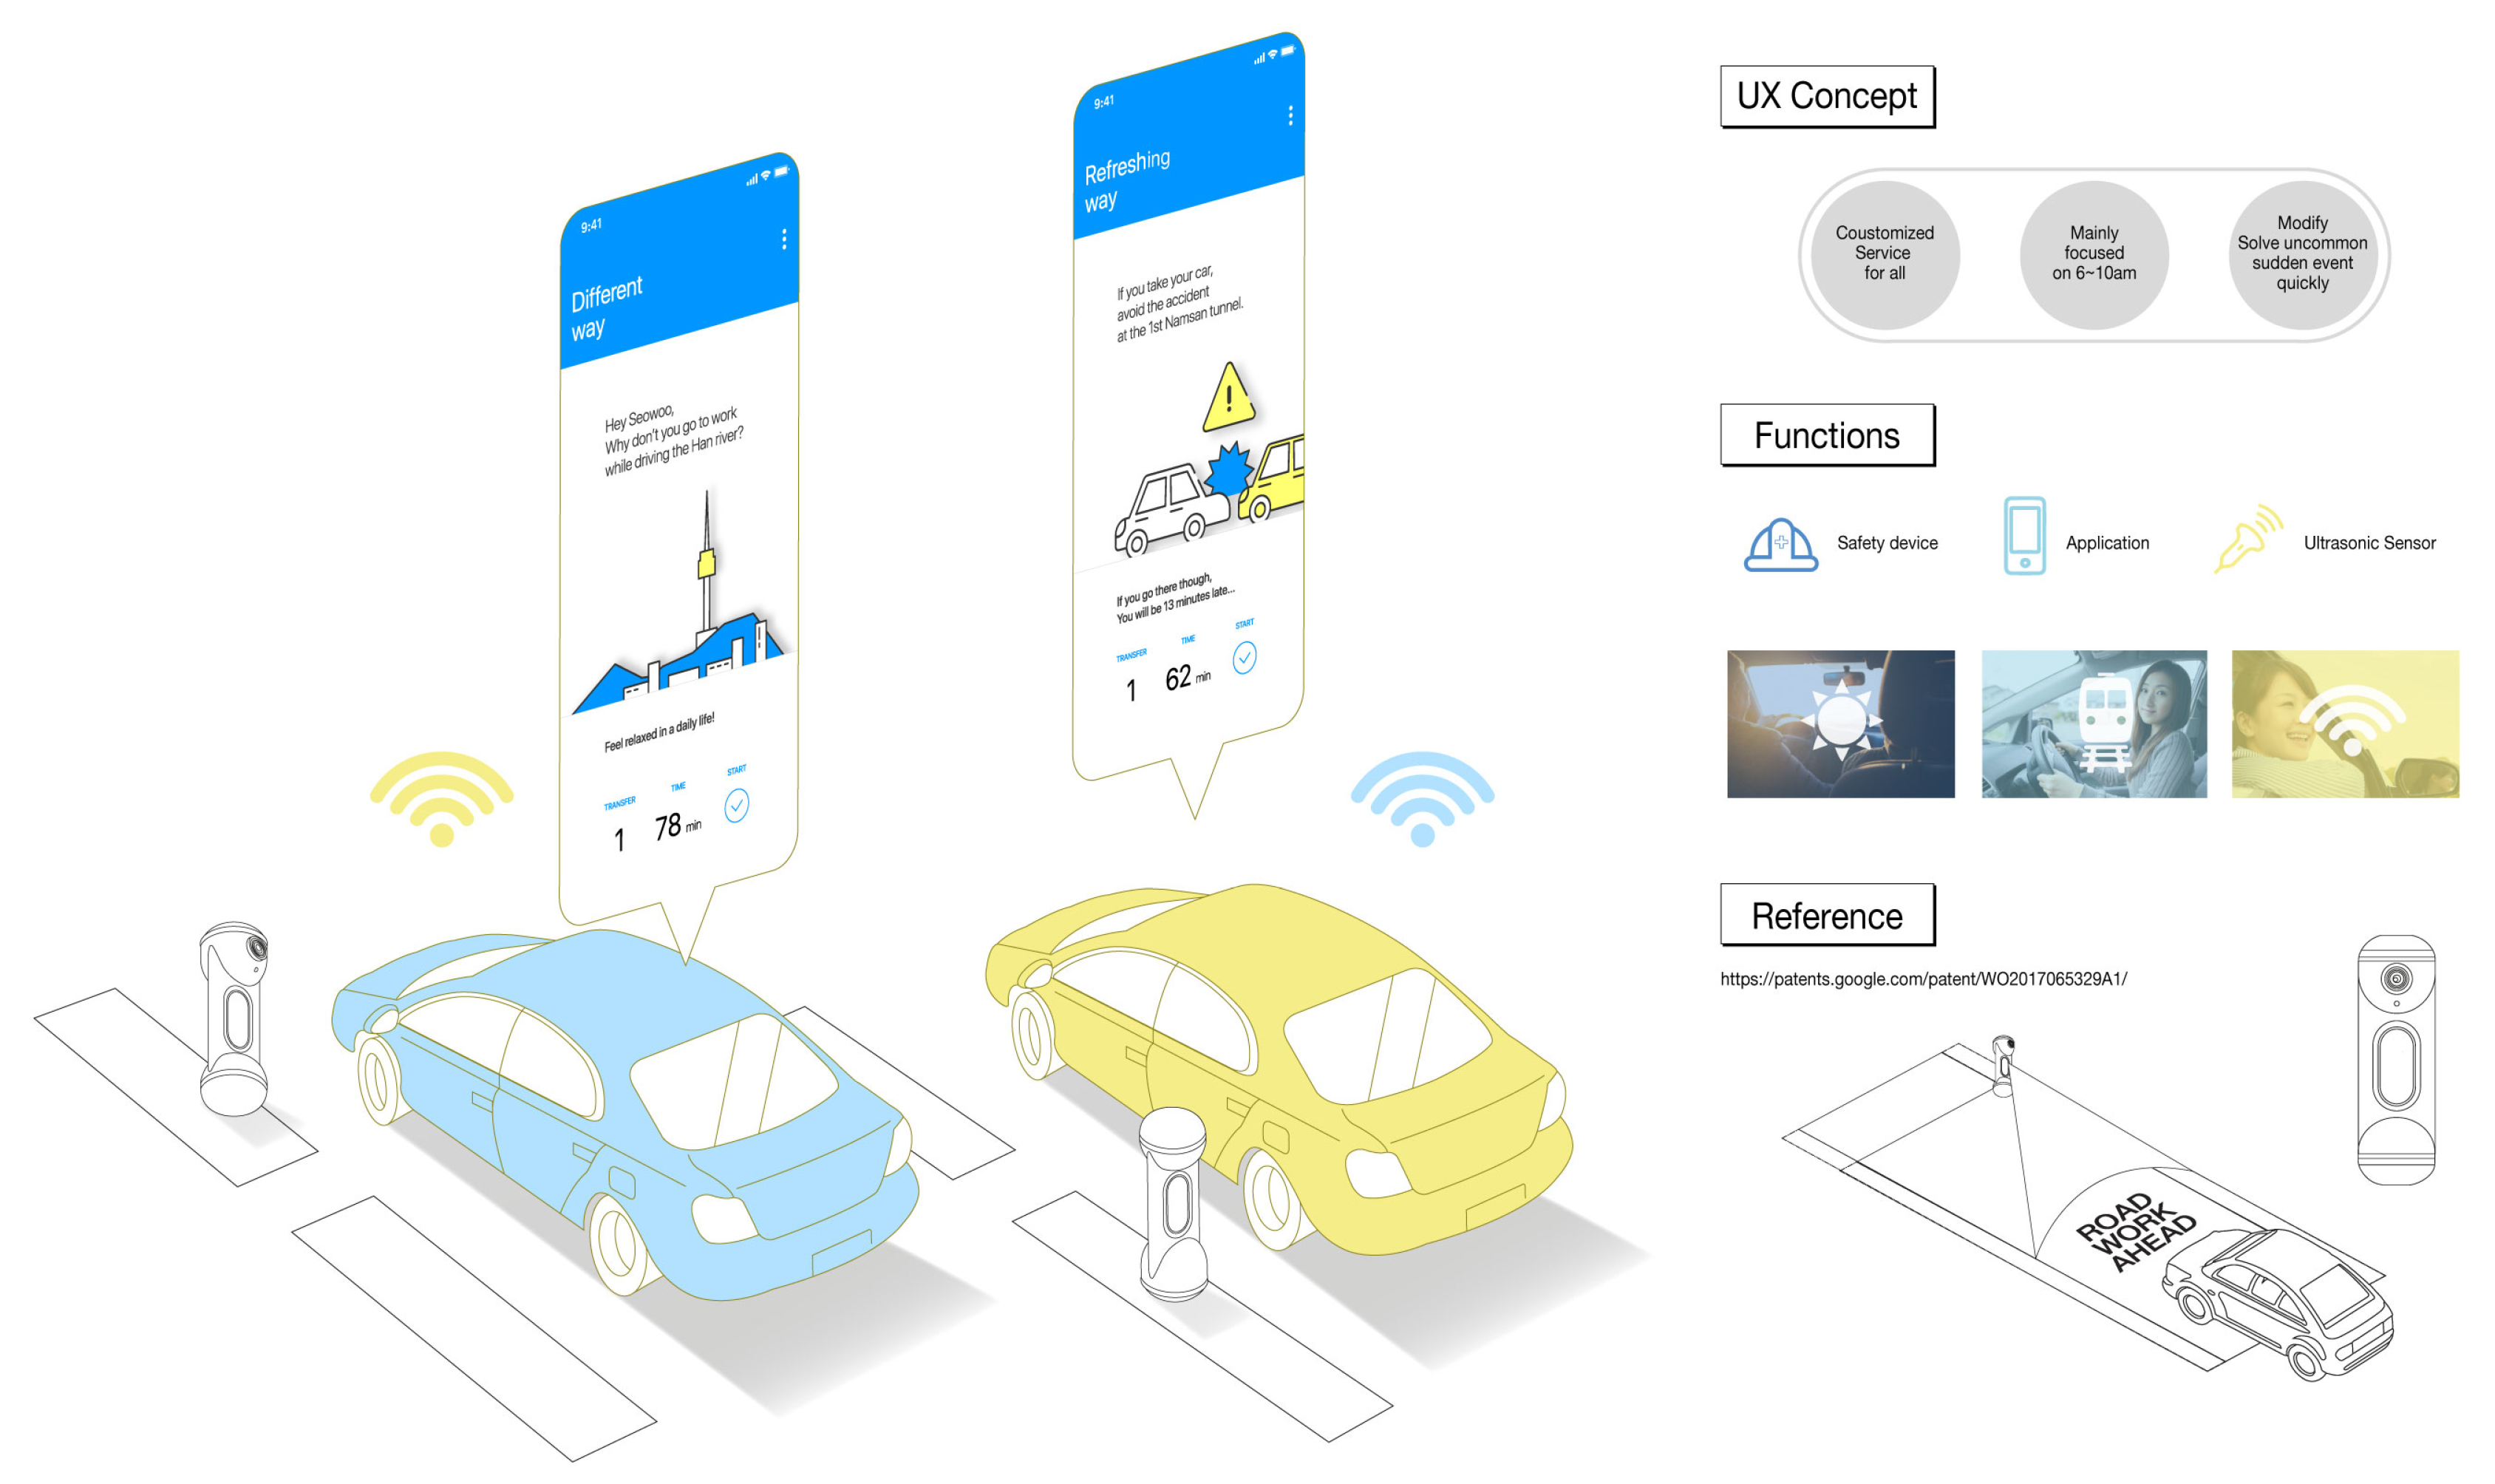
4.2. Mobile App Development

For commuting users of the whole system, we introduced the mobile application to users to support decision making. According to the insightful user study results, we categorized it into three functional approaches [6]:
  • “Different way to work”
  • “Wise way to work”
  • “Refreshing way to work”

4.2.1. Case 1: Different Way to Work

In data collection for an alternative pathway to guide users, the first requirement is the personalized driving experience. The display for the different way to work is shown in Figure 12. While using the different way to work function, users can be guided toward the best route using big data (car accidents, traffic situation, rest area, drowsiness rest area) from collected data, such as the highway information API, as shown in Figure 12.
The application will suggest to commuters a different route to that which they used to use. The app finds the optimal route using big data APIs (weather, current traffic conditions, rest stops, shelters) according to user sleep time and custom arrival time settings, and daily weather and fine dust information. Driver (user)-generated features are mainly focused on understanding the individual patterns and operating as a service tailored to the individual. The application will also link products like:
  • Personalized service for rush hour pass to work
  • Decentralized traffic which is congested
  • Traffic measurement and notification by time
When building the database, a personalized information service for the user is the first aim. Authorities can also help to control the congested traffic from decentralized resources with various APIs, as given in Table 3.

4.2.2. Case 2: Wise Way to Work

The case 2 data requirement is personalized arrival time. The display for a wise way to work emphasizes a new experience component by attracting commuters to select the alternative route (e.g., avoiding sleepy drive, misty highway), as shown in Figure 13. While using the “Wise way to work” function, users are offered the best route using big data (weather, traffic jam, delay zone, black ice, and so forth) from collected data, such as the weather information API.
When designing the database, a personalized information service for the user is focused upon. The authorities can also control congested traffic from decentralized resources from various APIs, as given in Table 4:
  • Current traffic
  • Monthly weather forecast
  • Weather observations of a specific area around the road, from Korean government open APIs
  • Dust - PM10, PM2.5 from “Air Korea” [28]
Along with the weather, road conditions are an important factor for users to decide which route to drive. Depending on precipitation, fine dust, road conditions, etc., car pools, public transportation, and personal mobility recommendations can be provided via the app. The function suggests the better commute (e.g., only today, from home, to work) information. For instance, spread by public transportation, the load on the road can be decreased while temporary “black ice” appears in the pathway.

4.2.3. Case 3: Refreshing way to work

The data for the alternative pathway to guide the user for case 3 requirements are personalized to offer an enjoyable journey. The display for the refreshing way to work emphasizes the new experience component to attract commuters to select an alternative way, as shown in Figure 13c. While using the “Refreshing way to work” function, the user can get the best route using big data (event, travelers’ site, density on the bridge) from linked information in the API.
  • VDS by lane, speed by direction
  • Local route speed by hour
In developing the database, along with both safety and time reduction, which are important for users in the “Refreshing way to work” mode, authorities can assure quick clearing of accidents on the road resourced from clouded sensor robots and various open APIs, as summarized in Table 5.
The display for the refreshing way to work emphasizes the new experience component to users to attract commuters to select the alternative way, as shown in Figure 13c, when a traffic accident occurs.

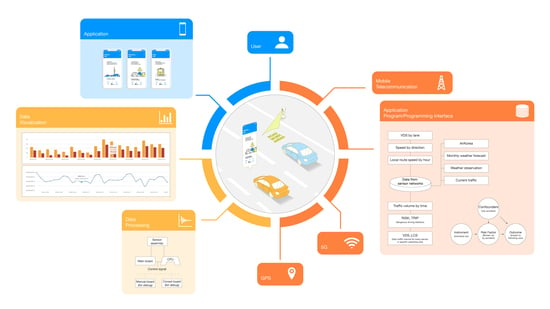
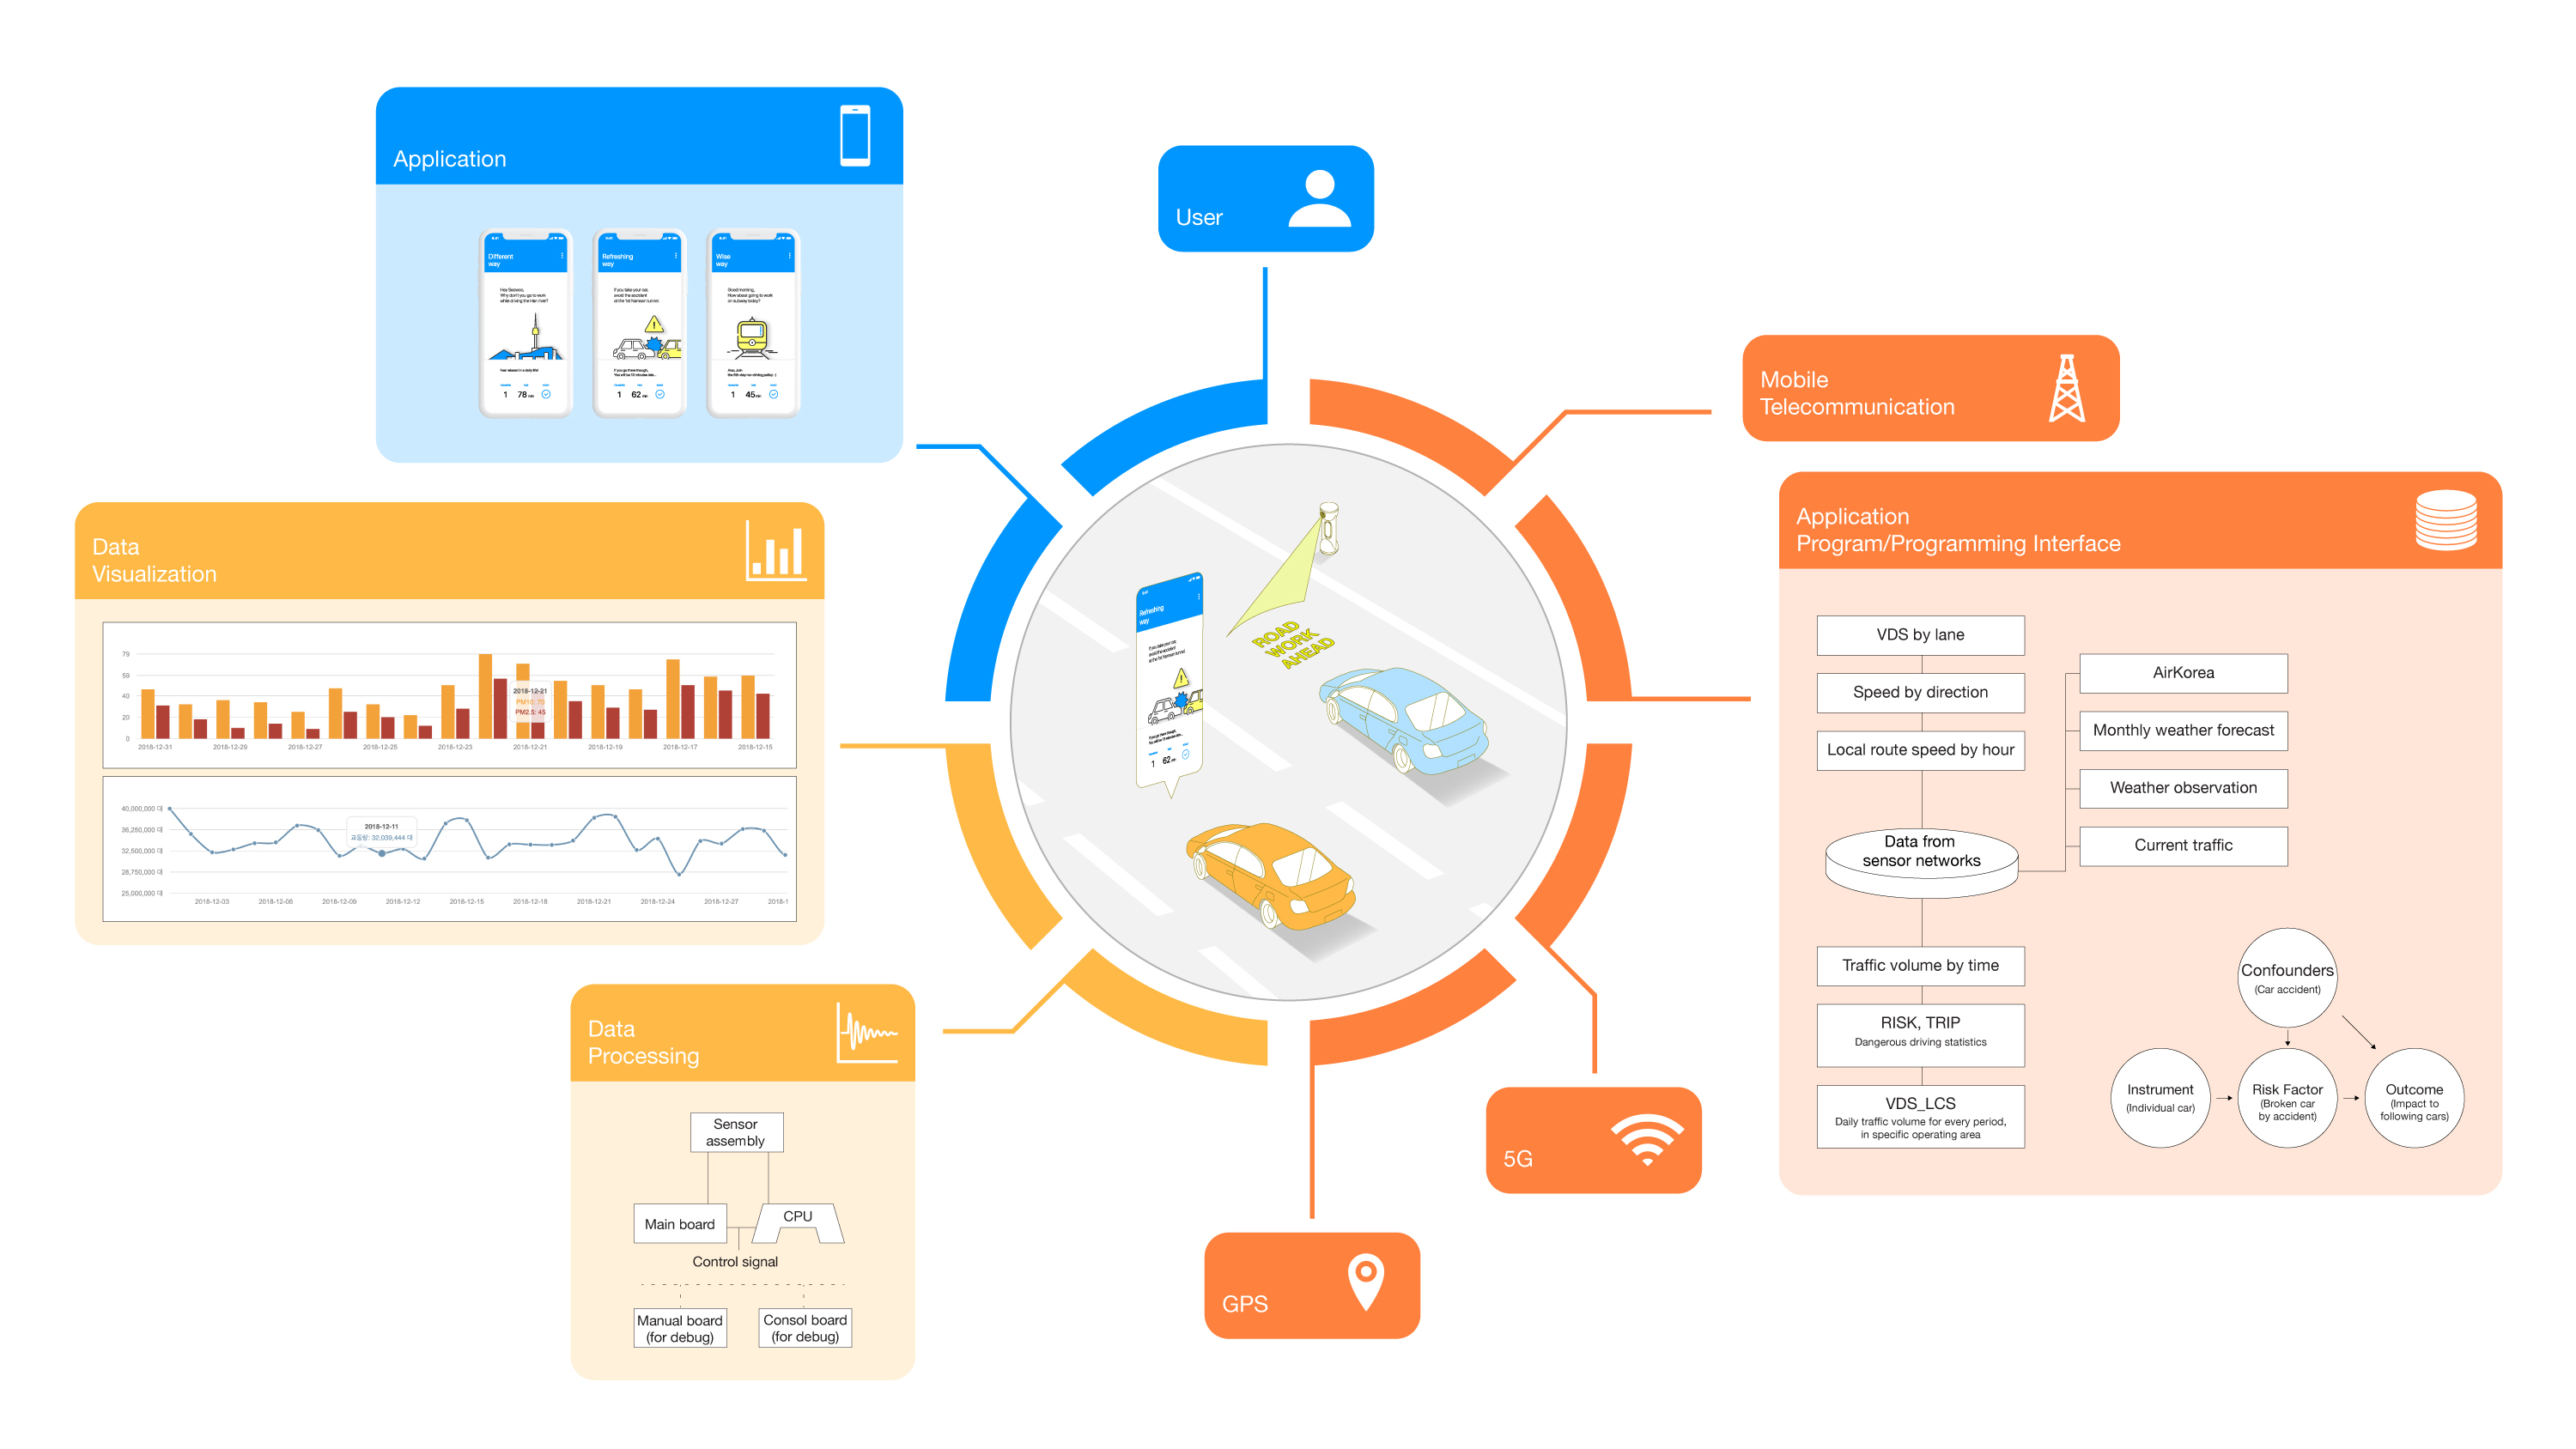
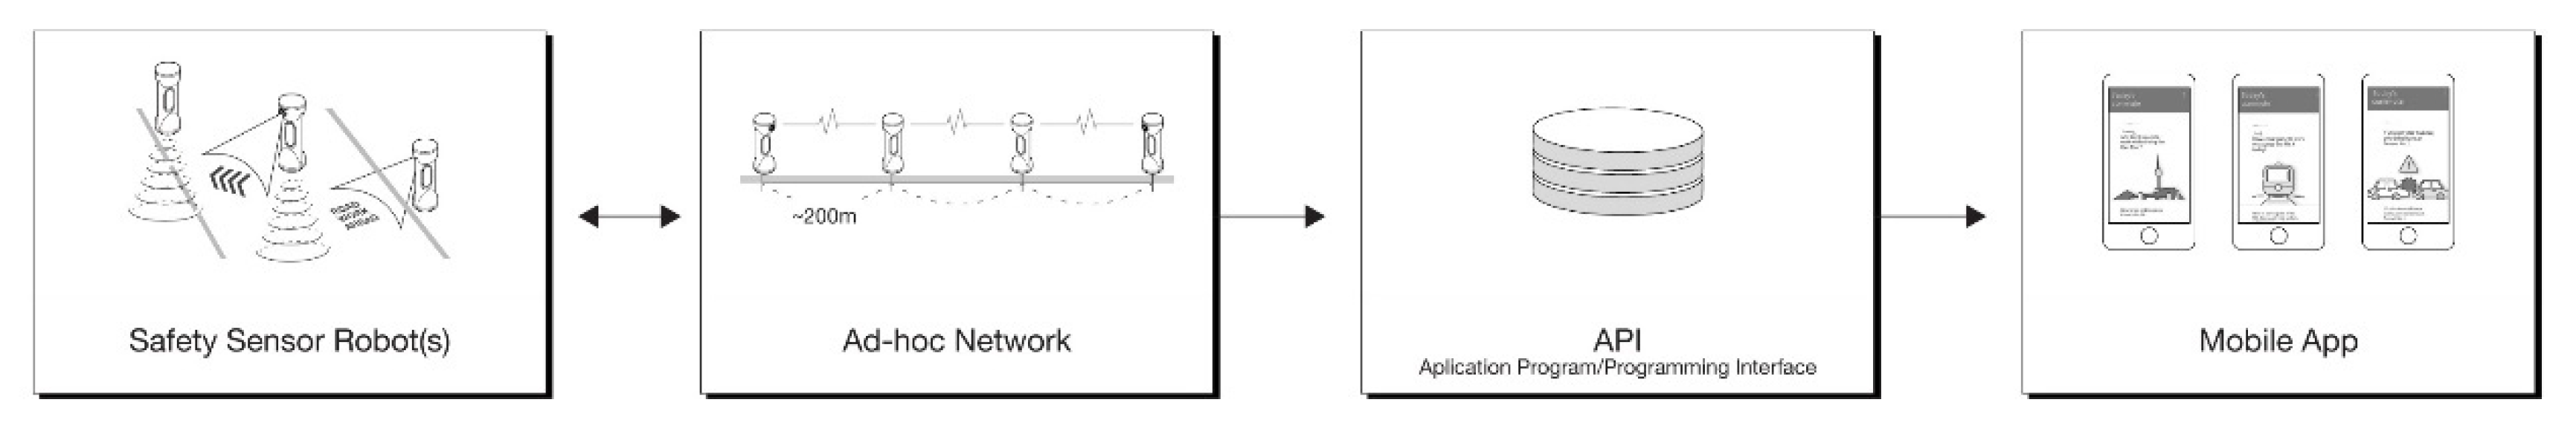
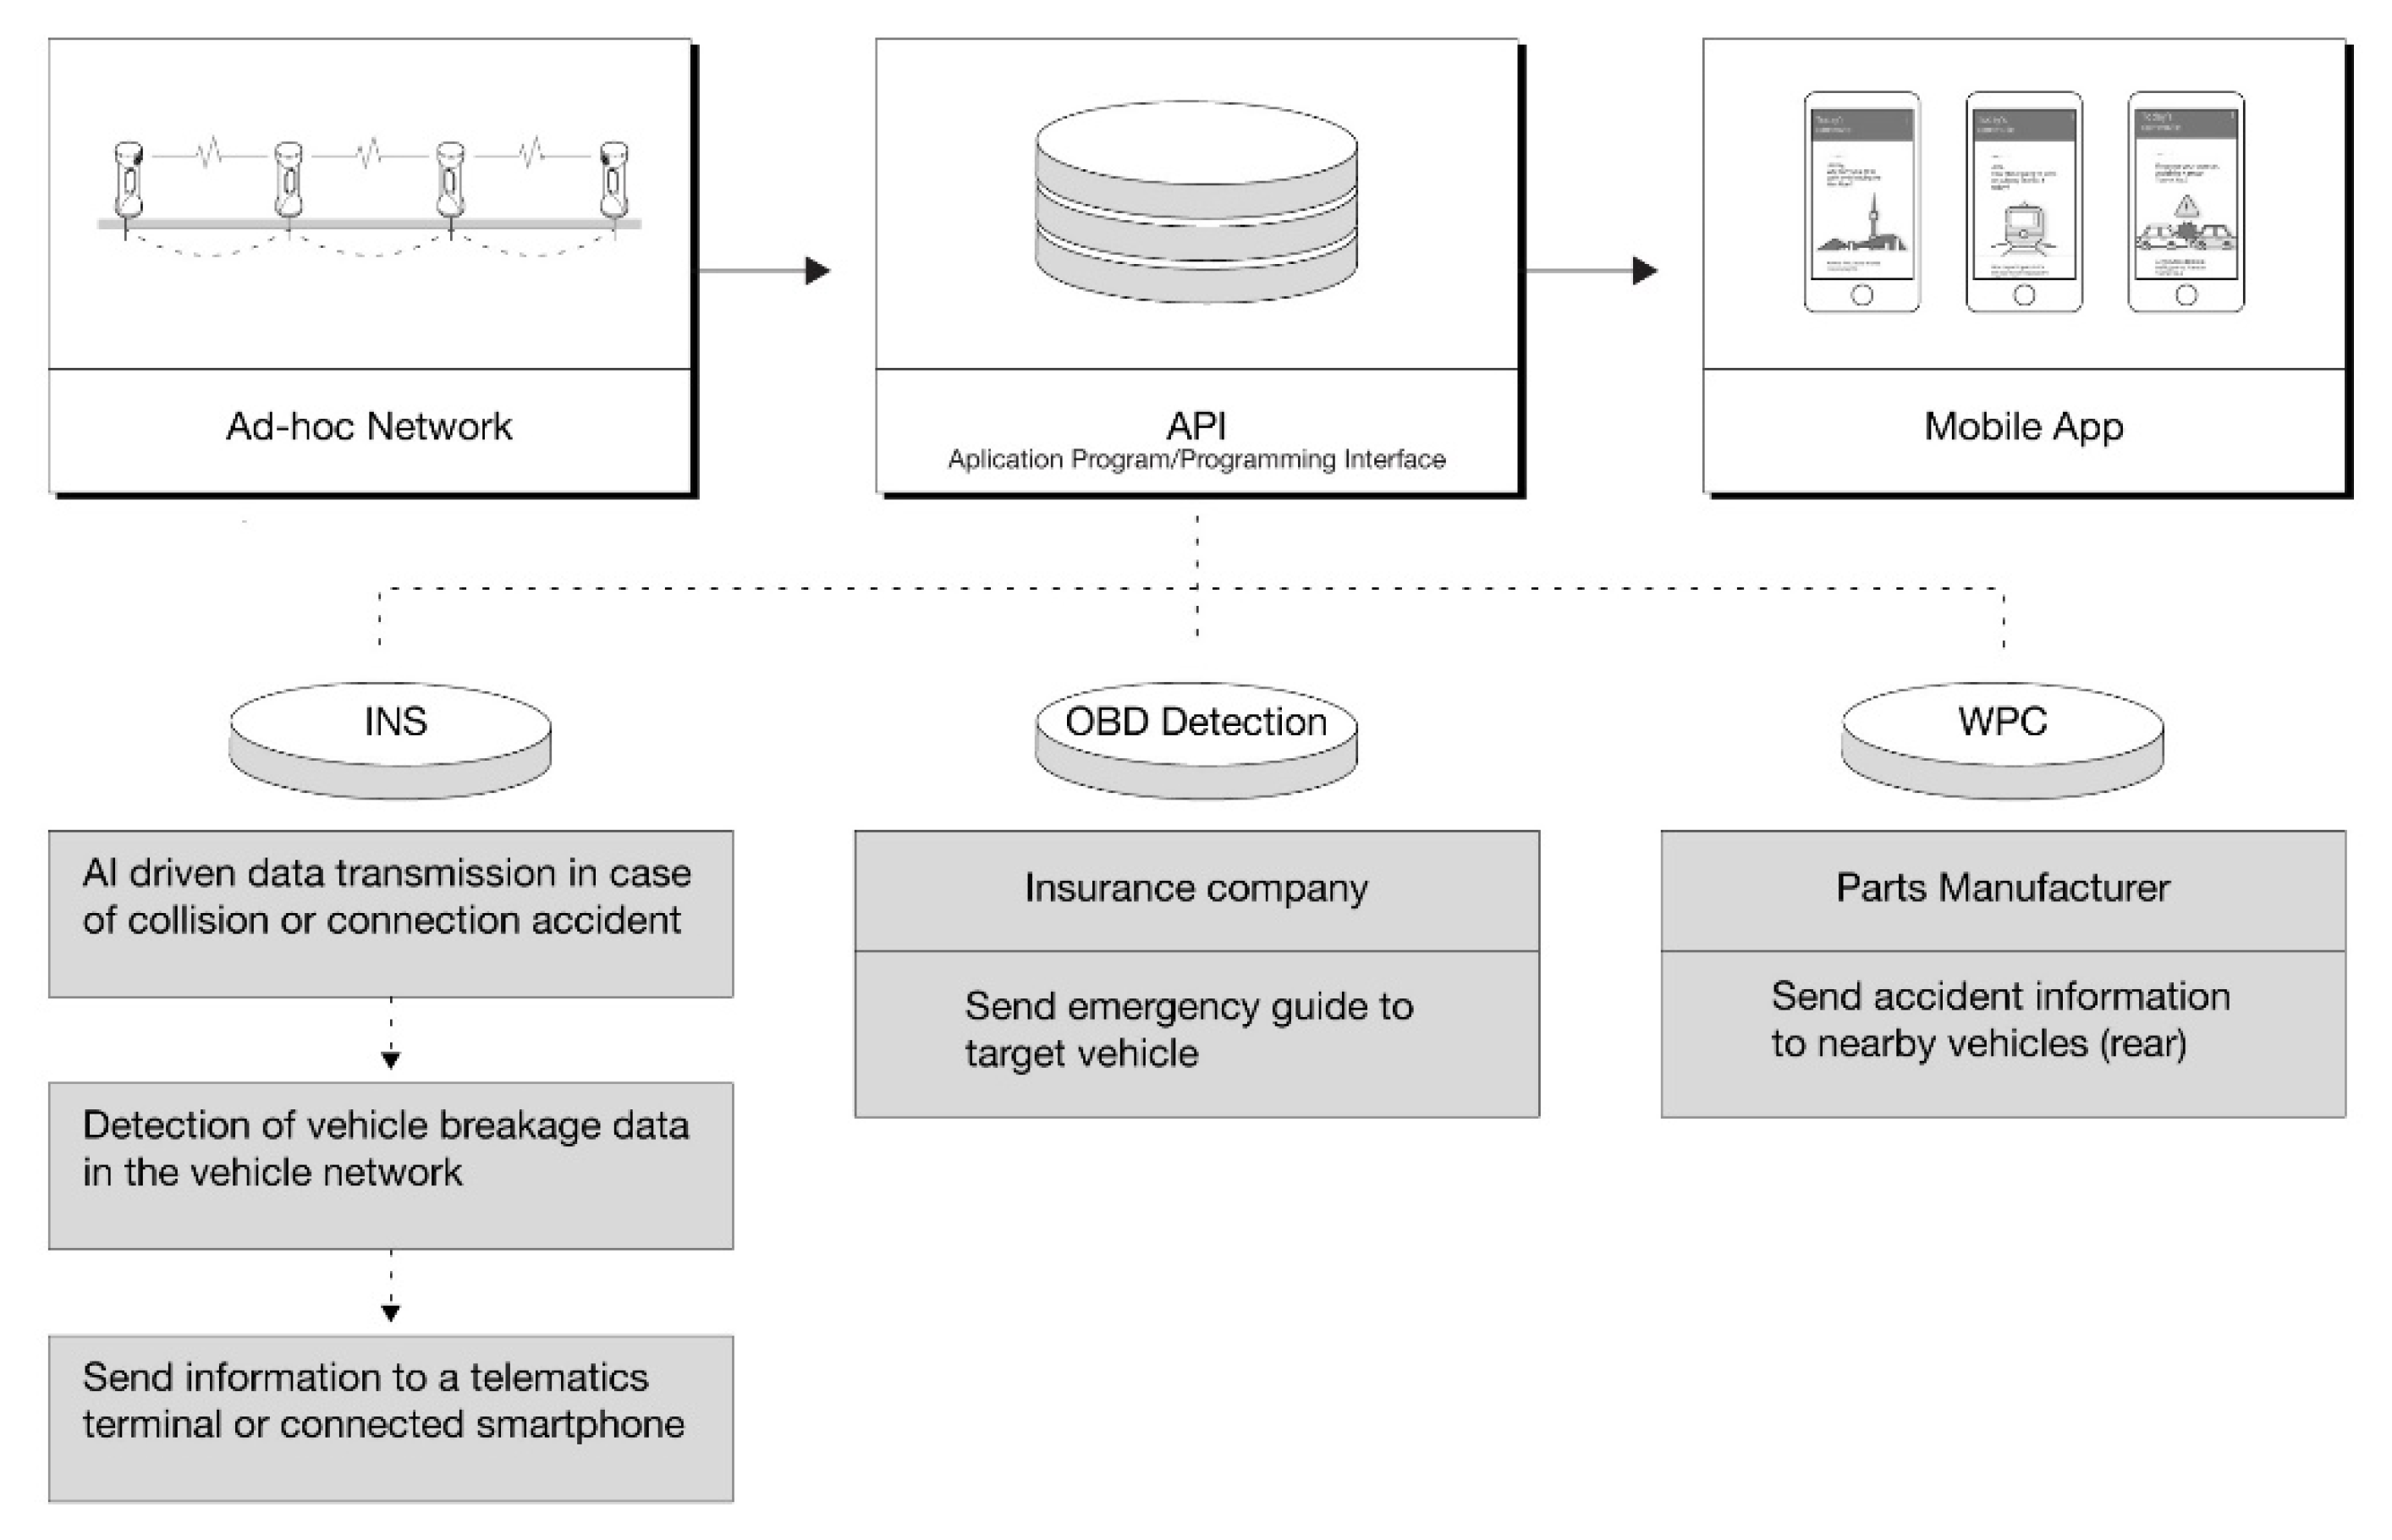
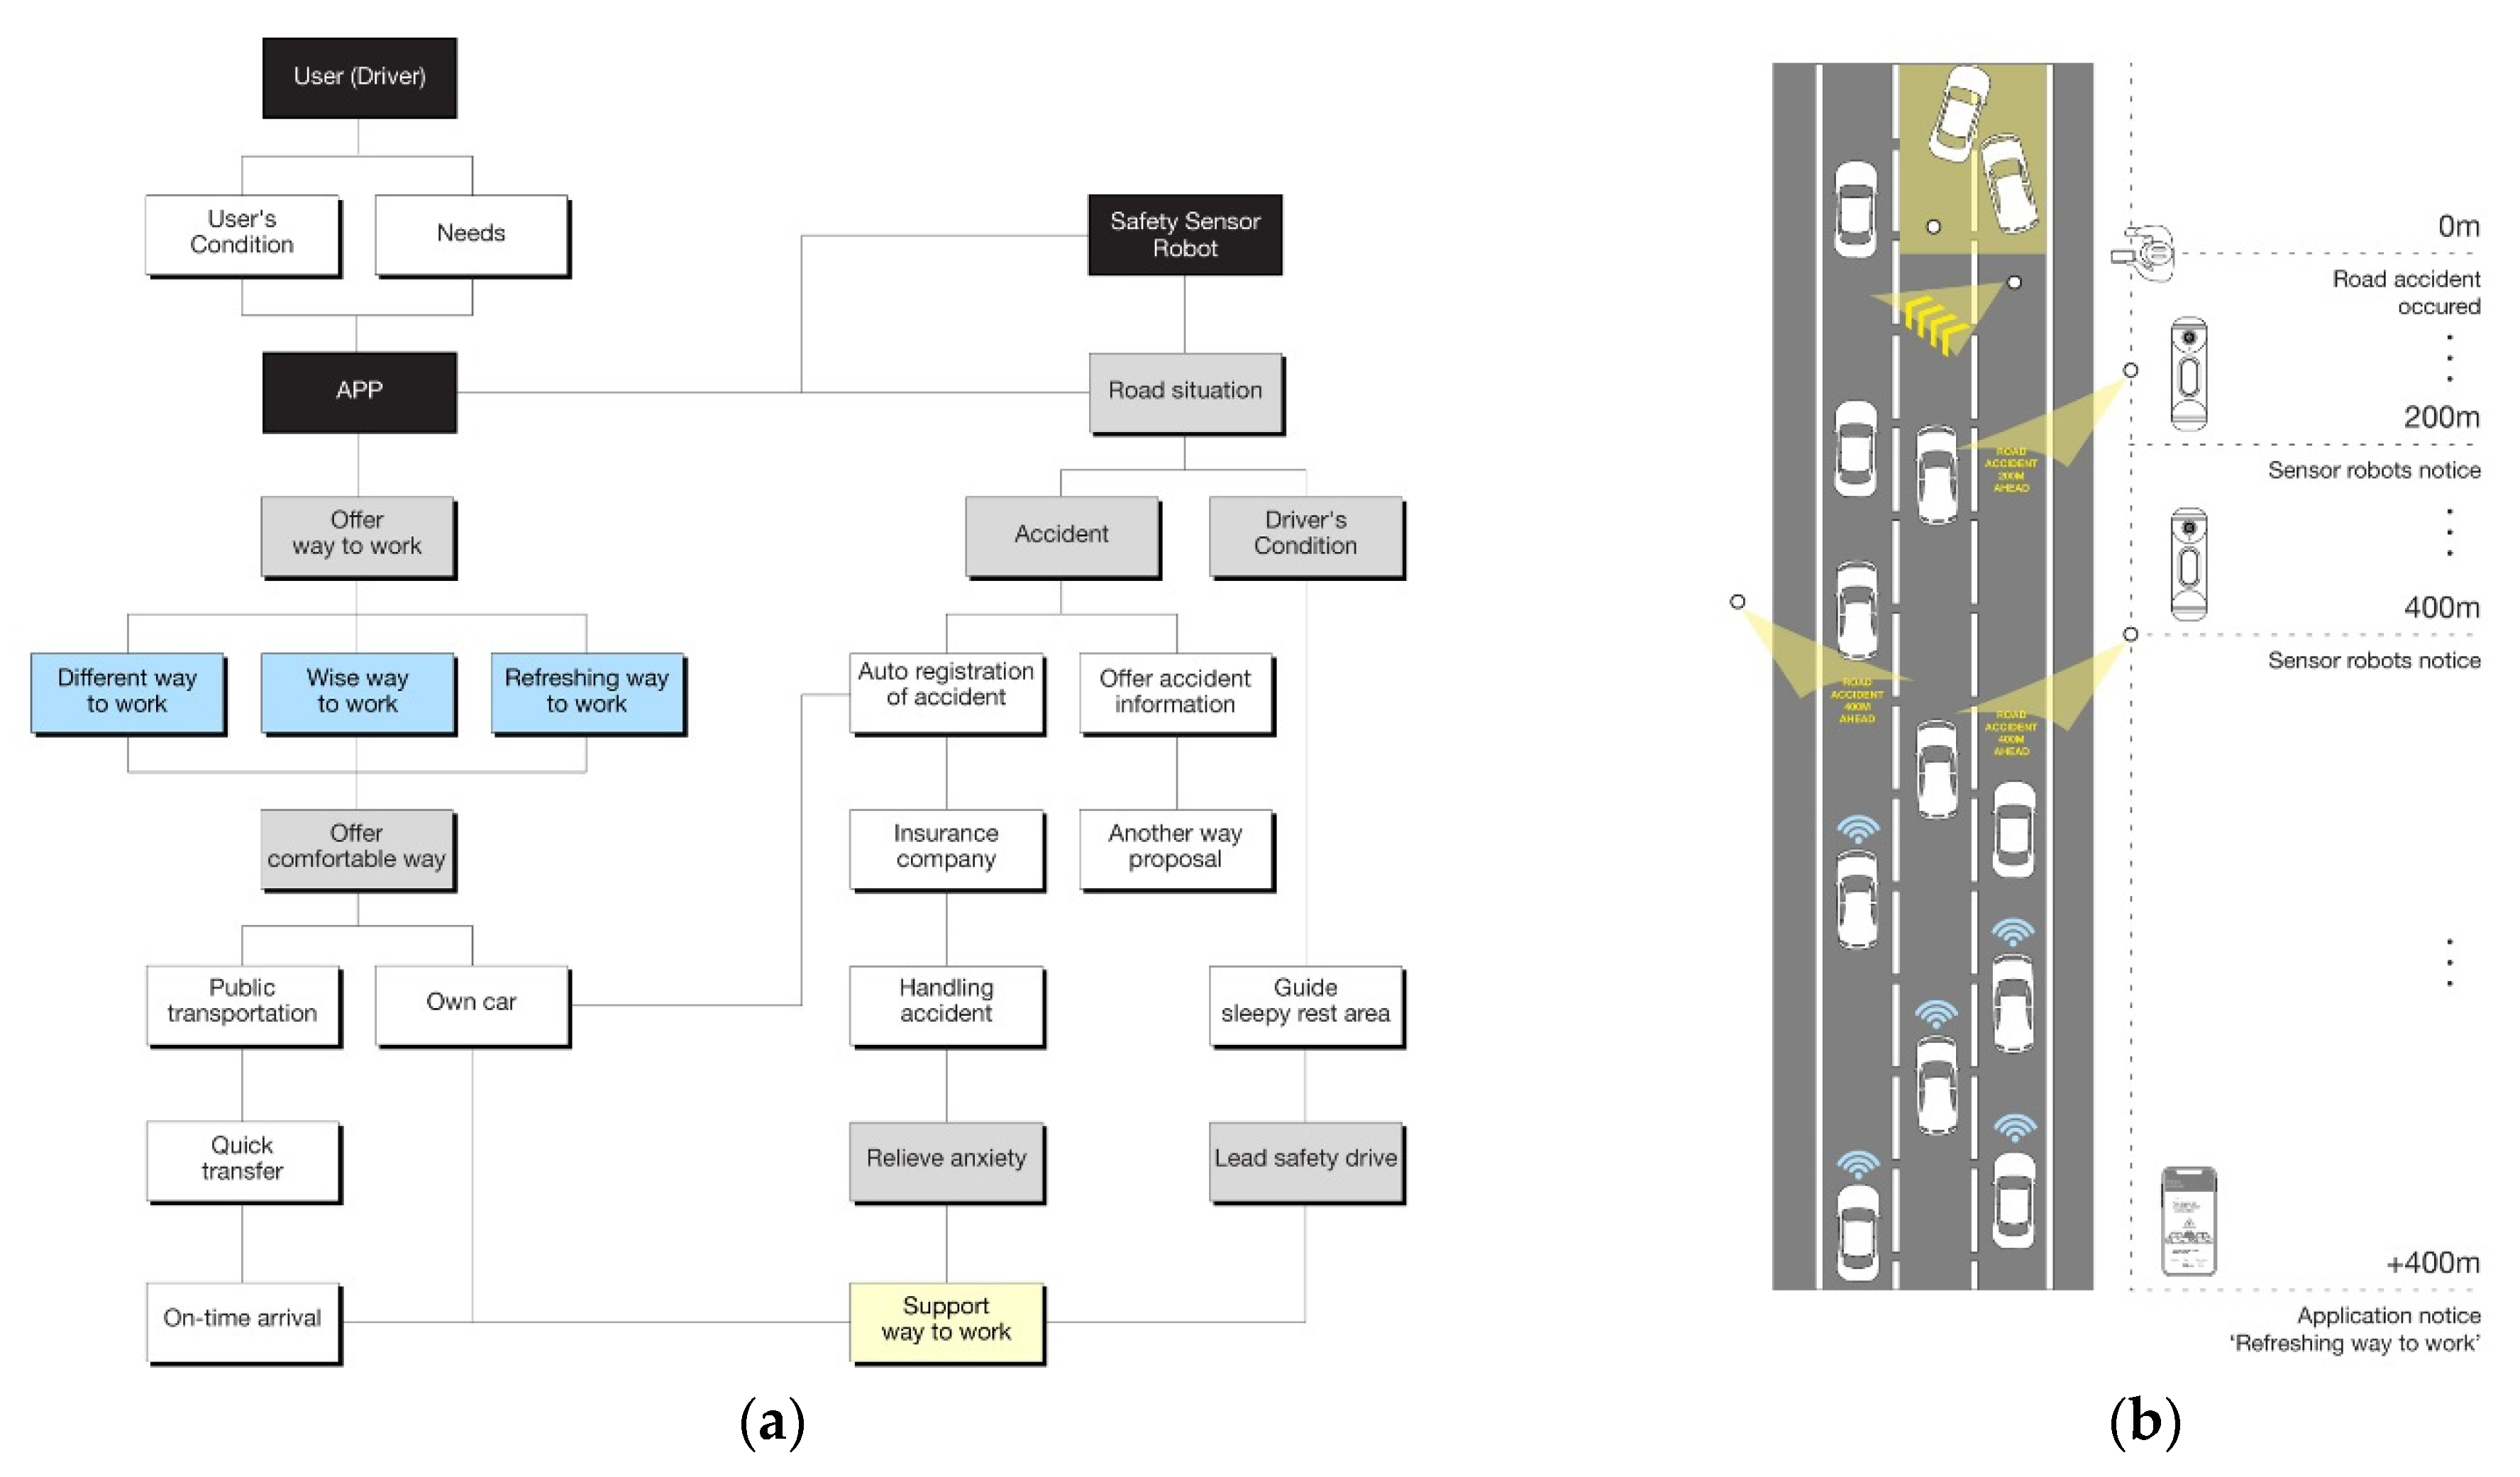
4.3. Summary of Architecture: Sensor Robot to Mobile Application

We aim to integrate safety and efficiency with convenient apps through a terminal designed with a proven system based on big data. The system focuses on the safety of the user and prioritizes safety and convenience of use. Information architecture of user experience is shown in Figure 14a.
We introduced safety lighting systems and interfaces to interoperate robots and gather information. Based on the cooperation of relevant agencies, we worked in the same external environment as the actual highway and implemented a verification method by implementing and testing the lighting that indicates a safe bypass.
The information architecture was designed to provide three contextual value services to users. The AI-based value creation proposed by this system leverages data from road traffic environments and map information systems to help coordinate overall traffic. The three case studies, [6]—(1) Different way to work, (2) Wise way to work, (3) Refreshing way to work—seek to instill a happy memory of the commuting journey. To all users who commute through highways/roads, this application will contribute to creating a balanced condition by providing stable route options, as shown in Figure 14b.

4.4. Discussion

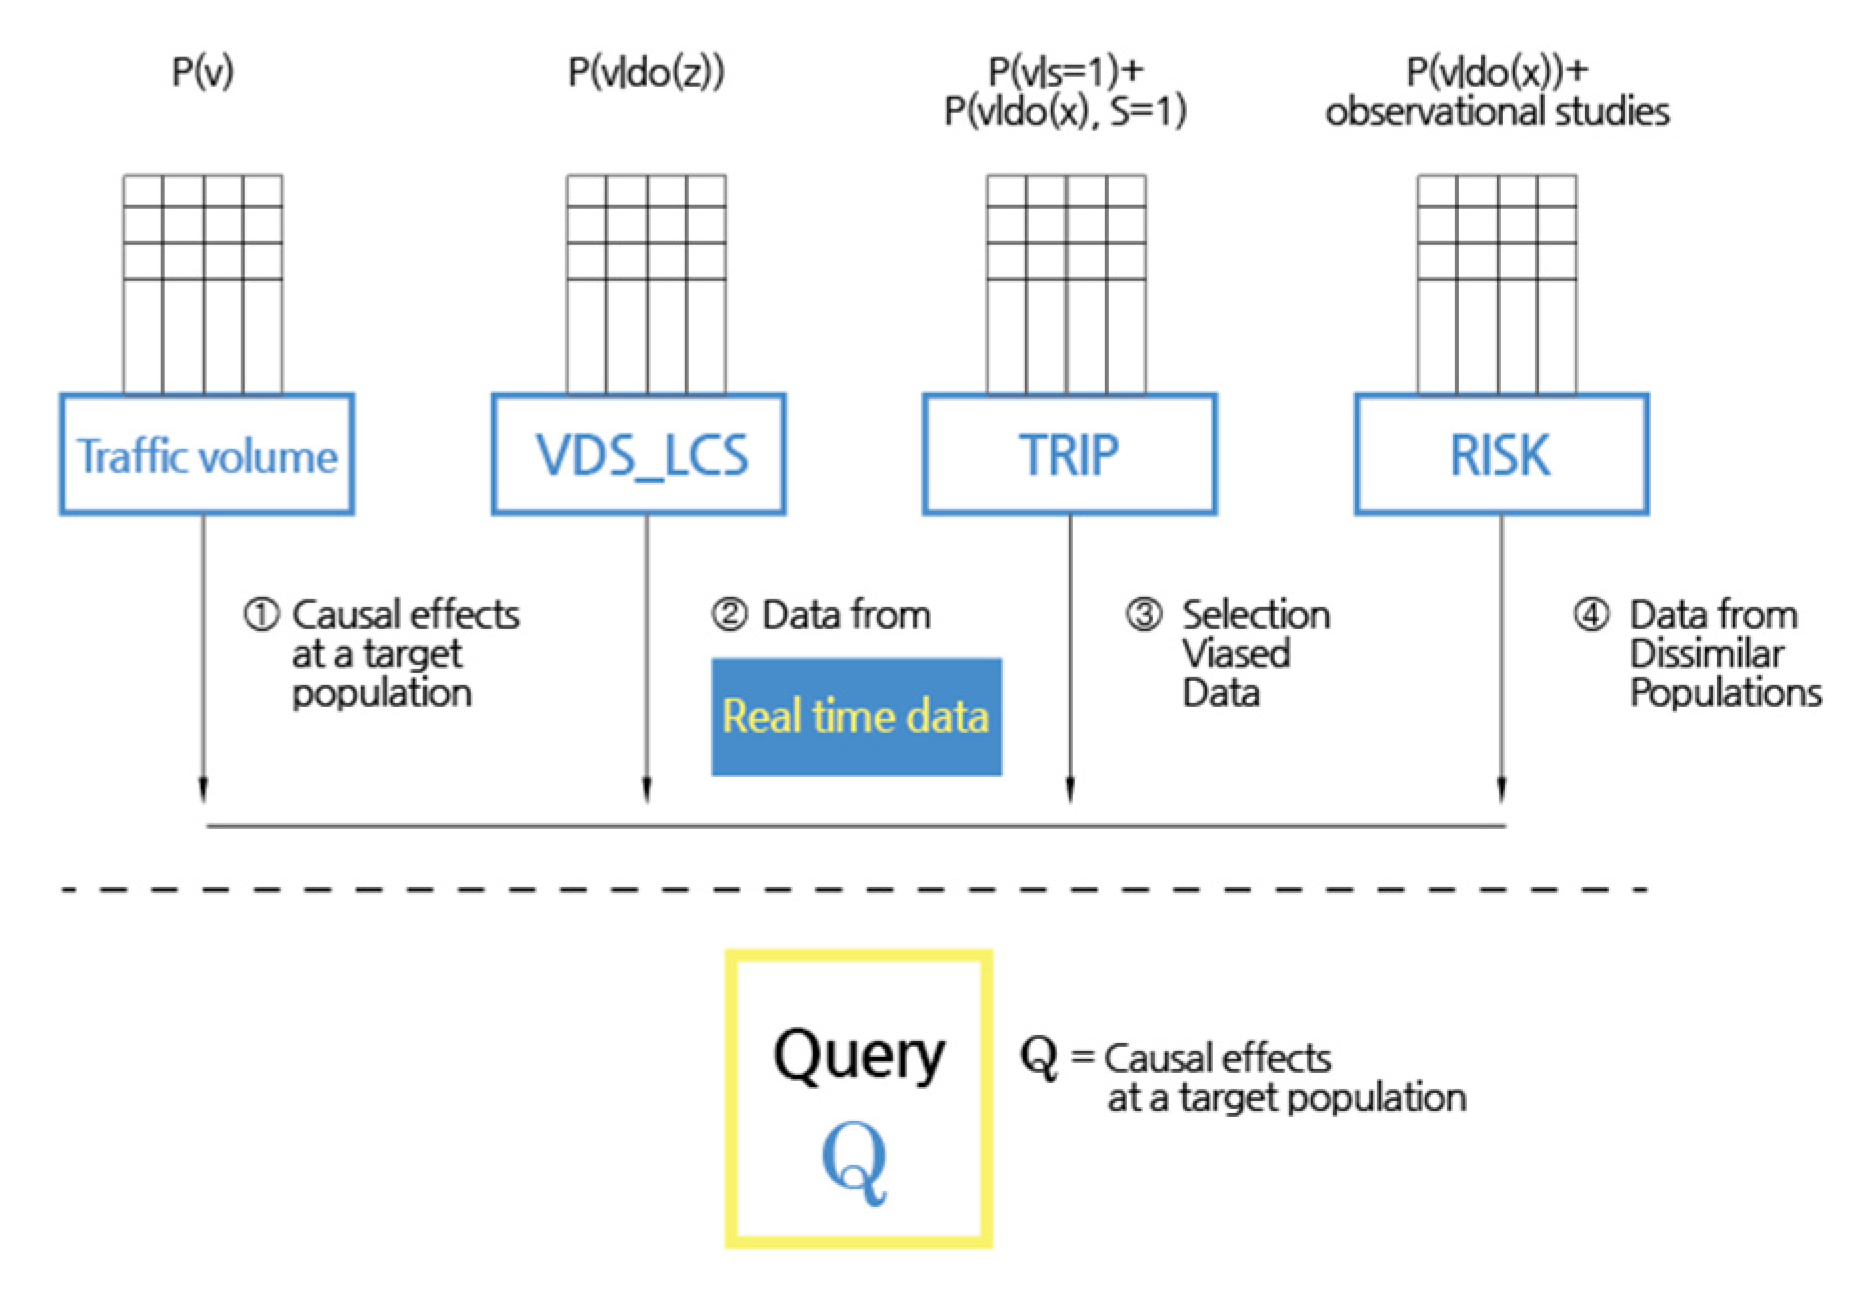
4.4.1. Quantitative Approach: Causal Inference

To estimate a causal effect on a target population Q (the number of commuters), the task of predicting the distribution of outcomes Y after intervening on a variable X, written Q = P(Y = y|do(X = x)) [23]. This information is available to us from an observational study (Traffic Volume). This is the standard task of policy evaluation, where controlling for confounding bias shown in Figure 15.

4.4.2. Qualitative Approach: Design Thinking Methodology

We investigated, from the benchmark of “RITIS” [20], strategies to inform individual users as well as a public transportation data center on road conditions. As the use-case, shown in Figure 16, demonstrates, multiple safety sensor robots working in the middle of highway and roads can engage in robot-to-robot communication in an ad-hoc network.

4.4.3. Information Flow: Gathered from Sensor Robot and Provided to Mobile App for the User

Additional functions for projecting messages to a specific dangerous vehicle is available with supervised learning in real-time. According to the signals from sensor robots, and real-time data from APIs, customized recommendations for users to ensure safe driving experiences were given. This resulted in three types of mobile app function module from the perspective of:
  • Causal inference to data from sensor robot
  • Sensor robot data to cloud network DB
  • DB to information architecture (IA)
  • IA to layout
  • Layout to display
  • Display to state-transition in the mobile app of the user.
The result of customized/alternative path finding service via ad-hoc networks can share information to alert uncommon sudden events on the road as quickly as drivers want to bypass.

5. Conclusions

In this study, we recognize the need to build a customized service system that ensures driver safety and resolves inconveniences on the road by suggesting possible directions and answers to questions of a typical driver (user). The driver can work through a safe and convenient user-oriented service system and freely choose the desired path via the proposed mobile app. The solution approached in this study guides the driver’s vehicle on a safe route with a low risk of an accident.
The design of the sensor robot first focused on the ease of installation and operation. In its operation, swarm robotic communication becomes active as the public device status report in simulation.
In further research, we will develop the next version of the robot, which has a more reliable wireless signal than the current robot device. In this research, we considered ad-hoc delivery tasks by using the TCP-IP packet in the Wi-Fi module of the Arduino board. The LTE-M module for the internet of things products is available now for the newer research. Furthermore, we consider more real environmental conditions of the highways/roads, such as weather (atmosphere, humidity, dust, direct sunlight), and reliability.
In several countries, local roads and highways are facing a lack of safety prevention due to their weak infrastructures. We are aware that the situations of roads are not all alike. The next research will focus its target not only on commuters but on residents and families as for citizen scientist approaches.

6. Patents

This research is registered in a patent application: Hong, S.Y.; Eune, J.; Lee, M.; Cho, M.G.; Jin, T.; Hong, I.K.; Jeon, H.; Shin, S.O.; Jung, E. (2017). Safety device for guiding vehicle to detour route, vehicle guidance method using the same, and vehicle guidance system using the same. International patent #WO2017065329A1 [30].

Author Contributions

Conceptualization, M.L. and H.J.; formal analysis, J.K.; investigation, M.L., J.K. and J.E.; methodology, J.K, I.H. and E.J.; project administration, M.L., J.K and J.E.; resources, M.L., T.J., J.W., H.J., E.J. and S.-H.G.; software, J.K., S.-H.G. and M.L.; supervision, C.-J.K. and J.E.; visualization, S.J., E.J., J.W. and M.L.; writing—original draft, M.L., J.W. and J.K.; writing—review & editing, C.-J.K. and J.E. All authors have read and agreed to the published version of the manuscript.

Funding

This research received no external funding.

Acknowledgments

This research is based on liveworks within “Design in the road” project of Integrated Creative Design program with Korean Expressway and earned excellence award at final presentation of Hackathon competition in “Land, Infrastructure and Transport Technology Fair 2019”. The infrastructure device thereof is already published in patent #WO2017065329A1. We could devote ourselves in this research within the infrastructure of Seoul National University and climate change education research project of APHESE. This work was supported by the National Research Foundation of Korea(NRF) grant funded by the Korea government (MSIT). (No. 2020R1A2C1014534)

Conflicts of Interest

The authors declare no conflict of interest.

Abbreviations

The following abbreviations are used in the manuscript:
DDistance (between the sensor robot and approaching vehicle)
HHole (in the center of the sensor robot)
Llight-emitting device
PProjection module
RRoad surface
SSensor module (recognition/recognizing unit = identification unit = detection unit = the detector)
TTop (the upper end)
MMiddle (the body)
BBottom (the lower end)
appapplication
APIApplication Program Interface = Application Programming Interface
VGNvehicle guidance network
IAinformation architecture
IDIin-depth-interview
IoTInternet of Things / Intelligence of Things
LoRaLong Range, a low-power wide-area network
RITISRegional Integrated Transportation Information System
ATMSAdvanced Traffic Management System
NJDOTNew Jersey department of transportation
OBDOn Board Diagnostics = OBU (unit)
INSinsurance (mainly car insurance company)
OBSObservation
PMparticulate matter
LCSLane Control System
VDSVehicle Detection System
WPCWeb Parts Catalog (to figure out which parts are out of order)

References

  1. Prasad, M.J.; Arundathi, S.; Anil, N.; Kariyappa, B.S. Automobile black box system for accident analysis. In Proceedings of the 2014 International Conference on Advances in Electronics Computers and Communications, Bangalore, India, 21 June 2014; pp. 1–5. [Google Scholar]
  2. Jang, J.; Kim, H. Advisory safety speed model using real-time vehicular data at SMART HIGHWAY. J. Korean Soc. Civ. Eng. 2010, 30, 443–451. [Google Scholar]
  3. Hong, I.K.; Jeon, H.; Eune, J.; Lee, M. Prevention through Design-Based on Safety Lighting for Perception on Highway Repairing Area Scenario. In Proceedings of the KSDS 2016, Seoul, Korea, 21 June 2016; pp. 110–111. [Google Scholar]
  4. Redmond, L.S.; Mokhtarian, P.L. The positive utility of the commute: Modeling ideal commute time and relative desired commute amount. Transportation 2001, 28, 179–205. [Google Scholar] [CrossRef]
  5. Chen, S.Y.; Zhang, Y.; Zhang, Y.H.; Yu, J.J.; Zhu, Y.X. Embedded system for road damage detection by deep convolutional neural network. Math. Biosci. Eng. 2019, 16, 7982–7994. [Google Scholar] [CrossRef] [PubMed]
  6. Jung, E.; Kim, J.; Jeong, S.; Soe, S.; Lee, M. Guidance Application for Drivers’ Safety at Moving to Work. In Proceedings of the HCI Korea 2020, Hongcheon, Korea, 11–14 February 2020; pp. 609–613. [Google Scholar]
  7. 2019 MOLIT Avengers. Available online: https://github.com/kjm0623v/2019_molit_Avengers (accessed on 20 February 2020).
  8. Ulleberg, P.; Rundmo, T. Personality, attitudes and risk perception as predictors of risky driving behavior among young drivers. Saf. Sci. 2003, 41, 427–443. [Google Scholar] [CrossRef]
  9. Davis, G.A. Possible aggregation biases in road safety research and a mechanism approach to accident modeling. Accid. Anal. Prev. 2004, 36, 1119–1127. [Google Scholar] [CrossRef]
  10. Rahman, M.M.; Strawderman, L.; Lesch, M.F.; Horrey, W.J.; Babski-Reeves, K.; Garrison, T. Modelling driver acceptance of driver support systems. Accid. Anal. Prev. 2018, 121, 134–147. [Google Scholar] [CrossRef]
  11. Karwa, V.; Slavković, A.B.; Donnell, E.T. Causal inference in transportation safety studies: Comparison of potential outcomes and causal diagrams. AAS 2011, 10, 1428–1455. [Google Scholar] [CrossRef]
  12. García-Castellano, M.; González-Romo, J.M.; Gómez-Galán, J.A.; García-Martín, J.P.; Torralba, A.; Pérez-Mira, V. ITERL: A Wireless Adaptive System for Efficient Road Lighting. Sensors 2019, 19, 5101. [Google Scholar] [CrossRef] [PubMed] [Green Version]
  13. Wundersitz, L. Driver distraction and inattention in fatal and injury crashes: Findings from in-depth road crash data. Traffic Inj. Prev. 2019, 20, 696–701. [Google Scholar] [CrossRef] [PubMed]
  14. Lu, N.; Ma, Y.; Liu, Y. Evaluating Probabilistic Traffic Load Effects on Large Bridges Using Long-Term Traffic Monitoring Data. Sensors 2019, 19, 5056. [Google Scholar] [CrossRef] [PubMed] [Green Version]
  15. Arokiasami, W.A.; Vadakkepat, P.; Tan, K.C.; Srinivasan, D. Real-Time Path-Generation and Path-Following Using an Interoperable Multi-Agent Framework. Unmanned Syst. 2018, 6, 231–250. [Google Scholar] [CrossRef]
  16. Leven, P.; Hutchinson, S. A framework for real-time path planning in changing environments. IJRR 2002, 21, 999–1030. [Google Scholar] [CrossRef]
  17. Pattara-Aticom, W.; Pongraibool, P.; Thajchayapong, S. Estimating road traffic congestion using vehicle velocity. In Proceedings of the 6th International Conference on ITS Telecommunications, Chengdu, China, 21–23 June 2006; pp. 1001–1004. [Google Scholar]
  18. Shin, S.I.; Park, J.J.; Lee, J.C.; Ha, T.J. Development of user customized path finding algorithm for public transportation information. J. Korean Soc. Civ. Eng. 2008, 28, 317–323. [Google Scholar]
  19. Regional Integrated Transportation Information System. Available online: https://ritis.org/intro/ (accessed on 16 February 2020).
  20. CATT Lab. Available online: http://www.catt.umd.edu/news/news_story.php?id=4673 (accessed on 22 February 2020).
  21. Bauer, J.; Margiotta, R.A.; Pack, M.L. Applying Archived Operations Data in Transportation Planning–A Primer (No. FHWA-HOP-16-082); Federal Highway Administration: Washington, DC, USA, 2016.
  22. Boukerche, A.; Oliveira, H.A.; Nakamura, E.F.; Loureiro, A.A. Vehicular Ad Hoc Networks: A New Challenge for Localization-Based Systems. Comput. Commun. 2008, 31, 2838–2849. [Google Scholar] [CrossRef]
  23. Bareinboim, E.; Pearl, J. Causal inference and the data-fusion problem. In Proceedings of the National Academy of Sciences, Washington, DC, USA, 26–27 March 2015; pp. 7345–7352. [Google Scholar]
  24. Christiaans, H.H.C.M.; Dorst, K.; Roozenburg, N. An empirical study into design thinking. Research in Design Thinking; Delft University Press: Delft, The Netherlands, 1992; pp. 119–125. ISBN 978-9-06275-796-1. [Google Scholar]
  25. Dorst, K.; Cross, N. Creativity in the Design Process: Co-Evolution of Problem-Solution. Des. Stud. 2001, 22, 425–437. [Google Scholar] [CrossRef] [Green Version]
  26. Peña-García, A.; Nguyen, T. A Global Perspective for Sustainable Highway Tunnel Lighting Regulations: Greater Road Safety with a Lower Environmental Impact. Int. J. Environ. Res. Public Health 2018, 15, 2658. [Google Scholar] [CrossRef] [PubMed] [Green Version]
  27. Zaldivar, J.; Calafate, C.T.; Cano, J.C.; Manzoni, P. Providing accident detection in vehicular networks through OBD-II devices and Android-based smartphones. In Proceedings of the 2011 IEEE 36th Conference on Local Computer Networks, Bonn, Germany, 4–7 October 2011; pp. 813–819. [Google Scholar]
  28. Air Korea. Available online: https://www.airkorea.or.kr/eng (accessed on 20 March 2020).
  29. Jeong, S. Today’s Commute. Available online: https://https://seowoojeong.com/todays-commute (accessed on 20 March 2020).
  30. Hong, S.Y.; Eune, J.; Lee, M.; Cho, M.G.; Jin, T.; Hong, I.K.; Jeon, H.; Shin, S.; Jung, E. Safety Device for Guiding Vehicle to Detour Route, Vehicle Guidance Method Using Same, and Vehicle Guidance System Using Same. International Patent No. WO2017065329A1, 20 April 2017. Available online: https://patents.google.com/patent/WO2017065329A1/en/ (accessed on 20 February 2020).
Figure 1. Scope of our research on the sensor robot and the mobile app: (a) first draft version of a safety sensor function module for robot communication, adapted from [3]; (b) our mobile app that provides information on route conditions, adapted from [6].
Applsci 10 02353 g001
Figure 2. The Regional Integrated Transportation Information System (RITIS) integrates existing public/private data, adapted from its website [19] and modified.
Applsci 10 02353 g002
Figure 3. The total design process and thumbnails of sensor robot used in the highways/roads and the converged mobile app to get information from the robots in network. Each process includes the planning, data collection, idea sketching and prototype stages, and the prototype that repeats modifications.
Applsci 10 02353 g003
Figure 4. Process of co-evolution of problem-solution adapted from [25]. P(t) and S(t) are interactive.
Applsci 10 02353 g004
Figure 5. Affinity map: Information from the sensor robot and mobile app to find out the users’ needs, and the user journey map (right side, for persona) facing the sensor robot, in the highways/roads.
Applsci 10 02353 g005
Figure 6. Process diagram: Sensor robot communicate via network infrastructure - API - mobile app.
Applsci 10 02353 g006
Figure 7. The architecture of the sensor robot system: (a) controlling module with the sensor assembly; (b) implemented projection.
Applsci 10 02353 g007
Figure 8. (a) Projection; (b) simple R-R manipulator and the kinematics.
Applsci 10 02353 g008
Figure 9. Vehicle induction: information generation from the robot device via access point function.
Applsci 10 02353 g009
Figure 10. An example view explaining the vehicle guidance system: (a) vehicle guidance method between the robot device (200) and vehicle (300). D is the distance between the robot device and vehicle and E is the preset range; (b) in normal communication among 200a, 200b and 200c; (c) communication between 200a and 200c is available even when the robot 200b is damaged.
Applsci 10 02353 g010
Figure 11. Data flow: vehicle guidance system, from sensor robots to in-vehicle service [27] network.
Applsci 10 02353 g011
Figure 12. Database of “Different way to work”, “Wise way to work”, “Refreshing way to work” linked to APIs.
Applsci 10 02353 g012
Figure 13. Display of (a) “Different way to work”; (b) “Wise way to work”; (c) “Refreshing way to work” in the mobile application.
Applsci 10 02353 g013
Figure 14. (a) Information architecture that aims for a (b) comfortable commute experience. Data from [3,6].
Applsci 10 02353 g014
Figure 15. Estimation of causal effect at target users commuting in the morning. Data from [23].
Applsci 10 02353 g015
Figure 16. Convergence scenario from safety sensor robot to inform mobile application. Adapted from [6,29] including 3 user experience concepts and 3 functions converged into 3 mobile app services.
Applsci 10 02353 g016
Table 1. User observation research with interview.
GoalObservation Details
To identify inconvenience:Observe the behavioral flow:
Observationcaused by ignorance of road conditions in theof decision-making in the
morning rush hour and to find ways to improve roadparticipant’s morning schedule
Contextually to identify hidden inconveniences:Ask participants about the reason:
Interviewthat participants experiencethat influence driving decisions
in the morning rush hourduring the morning commute
Table 2. Findings from the voice-of-user, near a car accident area vs. distant from the road in issue.
Car Accident Area (Near)Prompt ReportAnxious UsersCollect for Accident FactsWhen Moving to a Safe Place
Distant From the Road (of Issue)Prior information registration requiredNeed service proposalAccurate status recordChoice based on user simulation
Table 3. Data type and causal inference in database of “Different way to work”.
Index (type)Traffic VolumeRISKTRIPVDS_LCS
Data Type
Causal Inference
Traffic volume
Instrument
Need service InstrumentAccurate status
Instrument
Choice based on
Confounder
Table 4. Data type and causal inference in database of “Wise way to work”.
Index (Type)Current TrafficMonthly W.ForecastW.OBS.Area(Dust) PM10(Dust) PM2.5
Data Type
Causal Inference
Traffic volume
Instrument
Weather data ConfounderPlace data
Confounder
Weather data
Confounder
Weather data
Confounder
Table 5. Data type and causal inference in database of “Refreshing way to work”.
Index (Type)VDS by LaneSpeed by DirectionLocal Route Speed by Hour
Data Type
Causal Inference
Travel time
Confounder
Speed data
Instrument
Speed data
Risk factor

